partners capital approach to risk management · partners capital approach to risk management | stan...
TRANSCRIPT
P A R T N E R S C A P I T A L L L P Third Quarter 2013 | 1
P A R T N E R S C A P I T A L
Intel lectual Capital
Partners Capital Approach to Risk Management
| Stan Miranda |
M ost investors think of risk management as a process of minimizing or eliminating risk while achieving the target
returns. At the simplest level, Partners Capital’s risk management is achieved with our client portfolios through asset class and asset manager diversification and through a deep understanding of what each asset manager is doing. That is the essence of our risk management.
Our “insights” about risk management stem from our somewhat unique perspective of risk which is that there are some risks that we want to take and for which we believe we will be paid handsome returns and then there are risks that are quite simply not paid for. For example, investors are paid explicitly for taking default risk on a corporate bond by being paid c. 6% interest income for the loan. Examples of risks that investors are not paid for include fraud, theft, trading errors, extreme asset class or asset manager concentration (the opposite of diversification) and foreign currency risk.
This distinction is critical to avoid the risk of not achieving target returns. We would assert that the primary reason investors fail to achieve long-term target returns is that they were not diligent about ensuring they had their target level of risk. A risk management system that clearly delineates desired “paid for” risk and undesirable “unpaid for risk” will deliver what we say our clients want in the first sentence above.
The list of possible risks (negative surprises to the value of assets) is endless, which can serve to confuse and complicate any risk management process even further. So we think it critical to first define the primary sources of risk at a very high level and then distinguish between what aspects of each of those risks need to be budgeted in line with target returns and which are to be minimized against an assumption of no return ever being paid for those risks. We think the following six categories of risk capture the bulk of the most important risks to financial asset values:
• Market Risk
• Manager Risk
• Counterparties
• Liquidity Risk
• Leverage
• Internal Operational Risk
In the table overleaf, we define each of these six in terms of the risks that are paid for or not.
It is rarely crystal clear which risks an investor is paid for, but one helpful rule is that if you cannot eliminate the potential damage to asset values from a given risk, then you should be getting paid for taking that risk. For example, under “manager risk” one can eliminate currency risk and key man risk, so with a given asset manager you are not being paid for taking that risk. On the other hand, if the manager has the freedom to take leverage up and down in the fund and we cannot limit that, we need to believe that that is a risk that we will be paid for through higher returns.

Intel lectual Capital
Partners Capital Approach to Risk Management
P A R T N E R S C A P I T A L L L P Third Quarter 2013 | 2
6 Core RisksPaid for (budget intelligently)
Not paid for (seek to eliminate)
Market Risk • Quoted price volatility
• Volatility of income from assets (eg, profits and dividends from companies = “equity risk”)
• Default risk (= credit market risk)
• Value decline from rising interest rates (= interest rate risk)
• Real value decline from inflation (= inflation risk)
• Country, political and repatriation risk
• Government intervention (eg, nationalization, taxation, regulation)
• Currency risk
• Concentration risk
- single stock risk
- few asset classes
- too narrow geographic spread
• War (minimize through geographic targeting)
• Natural Disaster (unless an insurer)
• Moving overall portfolio risk away from target (either from TAA or from managers collectively moving away)
Manager Risk • That the manager will underperform the market (beta) net of fees
• Concentration
• Budgeted illiquidity
• Budgeted leverage
• Legal, a regulatory risk
• Business failure (costs > revenue)
• Strategy drift (in most cases)
• Excessive leverage
• Excessive illiquidity
• Key team member death/departures
• Fraud, theft
• Insider trading abuses
• Not having budgeted market risk (unless a macro manager)
• Investor redemption risk
Counterparties • None are paid for • Custodians: bank failure; trading errors
• Administrators
• Prime Brokers: re-hypothecation risk
Liquidity Risk • Locking up capital in an investment (eg, start-up venture) or with an asset manager (private equity fund) because a long term strategy earns more than a short term one (the “illiquidity premium”)
• Excessive allocations to illiquid assets relative to likely spending needs
• Mismatch between the liquidity of a manager’s fund (based on investor terms) and the underlying liquidity of investments
Leverage • Prudent leverage for the environment and opportunity set
• Excessive leverage
• Less than prudent leverage (can cost you)
Internal Operational Risk
• None are paid for • Fraud and theft
• Trading errors
• Regulatory abuses with consequences
Intel lectual Capital
Partners Capital Approach to Risk Management
P A R T N E R S C A P I T A L L L P Third Quarter 2013 | 3
The first important delineation is between market risk and all other risks. Market risk is the primary source of investment return. This is also referred to as beta. Alpha is return over and above what one expects to be paid for the market risk or beta. Manager Risk (for active managers) is in essence “alpha risk”.
The essence of market risk management at Partners Capital is rooted in knowing what aggregate market risks are embedded in each client’s portfolio as we look through to each underlying asset manager’s portfolio. We seek to fully understand the risks they are taking with our clients’ capital and how they are changing such risks over time. Market risk optimization is achieved by maintaining the overall portfolio risk in line with the risk budget, diversifying across all asset classes (or types of market risk) and diversifying geographically and within asset classes across the right number of underlying managers.
We group market risks under four core headings: equity risk, credit risk, interest rate risk and inflation risk. We monitor such risks through our on-going interaction with each asset manager and with our system of measuring each individual client’s look through risk exposure against the agreed budgeted level and mix of risks. Rebalancing to target risks (betas) or asset classes is one critical step for ensuring the portfolio has the budgeted risk in place at all times. If we inadvertently let the collective group of asset managers take risk up, we may experience a larger decline than anticipated and if one lets market risk inadvertently drift downwards (e.g., managers getting defensive), we may miss the upside that we budgeted risk to achieve. Many experienced this latter risk in 2009, missing one of the strongest equity rallies in history.
The Market Risks we seek to completely eliminate (as we believe we will not be paid for taking these) are currency risk, asset class, geographic or security concentration (vs. diversification) and moving the overall portfolio risk away from its long term target.
Partners Capital follows a rigorous approach to manager risk assessment. Our initial manager due diligence process is extensive, focused on both quantitative and qualitative factors. Quantitative analysis decomposes historical performance into beta and alpha through multi-factor regression. Other standard risk measures are similarly considered, such as skew, kurtosis and up/down capture ratios. Qualitative risk analysis is based on meetings with senior staff at the manager (two partners need to meet each new manager), reference calls with other investors, regulatory / legal issue reviews, analysis of prior audited financial statements, discussions with fund counter-parties, operational due diligence and key personnel background checks by a third party specialist firm. The conclusions of this initial risk analysis are documented in a 40-60 page internal document that is reviewed and approved by the Internal Investment Committee (examples available upon request). Thereafter, every manager is monitored on an on-going basis each quarter using the risk management system described above.
Intel lectual Capital
Partners Capital Approach to Risk Management
P A R T N E R S C A P I T A L L L P Third Quarter 2013 | 4
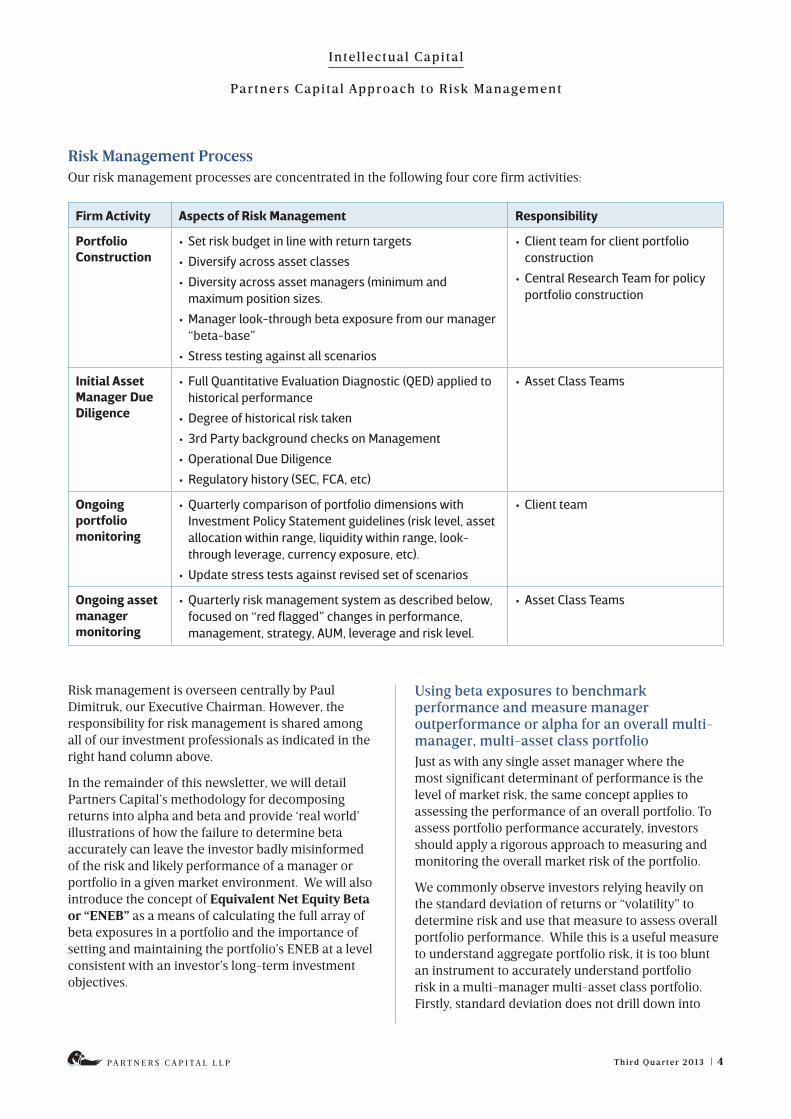
Risk Management ProcessOur risk management processes are concentrated in the following four core firm activities:
Firm Activity Aspects of Risk Management Responsibility
Portfolio Construction
• Set risk budget in line with return targets
• Diversify across asset classes
• Diversity across asset managers (minimum and maximum position sizes.
• Manager look-through beta exposure from our manager “beta-base”
• Stress testing against all scenarios
• Client team for client portfolio construction
• Central Research Team for policy portfolio construction
Initial Asset Manager Due Diligence
• Full Quantitative Evaluation Diagnostic (QED) applied to historical performance
• Degree of historical risk taken
• 3rd Party background checks on Management
• Operational Due Diligence
• Regulatory history (SEC, FCA, etc)
• Asset Class Teams
Ongoing portfolio monitoring
• Quarterly comparison of portfolio dimensions with Investment Policy Statement guidelines (risk level, asset allocation within range, liquidity within range, look-through leverage, currency exposure, etc).
• Update stress tests against revised set of scenarios
• Client team
Ongoing asset manager monitoring
• Quarterly risk management system as described below, focused on “red flagged” changes in performance, management, strategy, AUM, leverage and risk level.
• Asset Class Teams
Risk management is overseen centrally by Paul Dimitruk, our Executive Chairman. However, the responsibility for risk management is shared among all of our investment professionals as indicated in the right hand column above.
In the remainder of this newsletter, we will detail Partners Capital’s methodology for decomposing returns into alpha and beta and provide ‘real world’ illustrations of how the failure to determine beta accurately can leave the investor badly misinformed of the risk and likely performance of a manager or portfolio in a given market environment. We will also introduce the concept of Equivalent Net Equity Beta or “ENEB” as a means of calculating the full array of beta exposures in a portfolio and the importance of setting and maintaining the portfolio’s ENEB at a level consistent with an investor’s long-term investment objectives.
Using beta exposures to benchmark performance and measure manager outperformance or alpha for an overall multi-manager, multi-asset class portfolio Just as with any single asset manager where the most significant determinant of performance is the level of market risk, the same concept applies to assessing the performance of an overall portfolio. To assess portfolio performance accurately, investors should apply a rigorous approach to measuring and monitoring the overall market risk of the portfolio.
We commonly observe investors relying heavily on the standard deviation of returns or “volatility” to determine risk and use that measure to assess overall portfolio performance. While this is a useful measure to understand aggregate portfolio risk, it is too blunt an instrument to accurately understand portfolio risk in a multi-manager multi-asset class portfolio. Firstly, standard deviation does not drill down into
Intel lectual Capital
Partners Capital Approach to Risk Management
P A R T N E R S C A P I T A L L L P Third Quarter 2013 | 5
the market exposures that generated the returns and volatility. These exposures (or “betas”) to equity, credit or interest rate markets matter greatly in determining how returns were generated. For example, in 2012 a credit portfolio would have looked much better than an equity portfolio since credit provided returns similar to equities with much lower standard deviation. This does not necessarily imply that the credit portfolio is superior to the equity portfolio, but simply that credit performed strongly as a market in 2012. Secondly, managing risk on a forward looking basis is impractical since standard deviations vary substantially over time depending on market conditions. For example during times of market stress, standard deviations rise sharply and during times of stability, standard deviations drop off. Trying to vary exposures to fit within a “standard deviation budget” is very difficult to manage in practice and typically leads to poor results.
A more pragmatic definition of risk is based on measuring betas to each of the key markets risks to which the portfolio is exposed. In view of the dominant role that public equities play in most institutional and individual portfolios, at Partners Capital we use the equity market beta of a portfolio as the most important measure of overall portfolio risk to target and maintain. Given that most portfolios also incorporate exposure to other asset classes, such as fixed income, credit, property and commodities, it is important to capture the market risk or betas of each of these diverse asset classes in any overall portfolio risk measure. Therefore, the portfolio’s beta to each of these markets is first calculated. In order
to represent the portfolio’s risk in a single term, we translate each of the asset class risks into the common denominator of equity equivalent risk. We refer to this single risk measure as Equivalent Net Equity Beta (“ENEB”). For example, high yield credit has a high correlation with equity markets, but significantly lower volatility than equities; thus exposure to high yield credit currently gets translated into ENEB at a rate of 0.6 to equities. On the other hand, government bond returns have recently shown a negative -0.2 beta to public equities. So if the portfolio has a 30% allocation to government bonds, the portfolio’s ENEB is reduced by 6% (30% x -0.2). In general, risky assets tend to have a positive ENEB, while safety-oriented assets tend to have a low or negative ENEB. These ‘look-through’ ENEB exposures can be calculated for a portfolio of managers and aggregated together, since they are expressed as a common measurement.
Once the level and nature of each market risk in a portfolio is determined, separating out performance into market exposures and portfolio manager skill (i.e., skill from asset allocation, manager selection, etc.) is relatively straightforward. The return on market exposures is simply the allocation to each market beta multiplied by the passive return from the market indices that corresponds with each beta. We refer to this as the “beta return” of the portfolio.
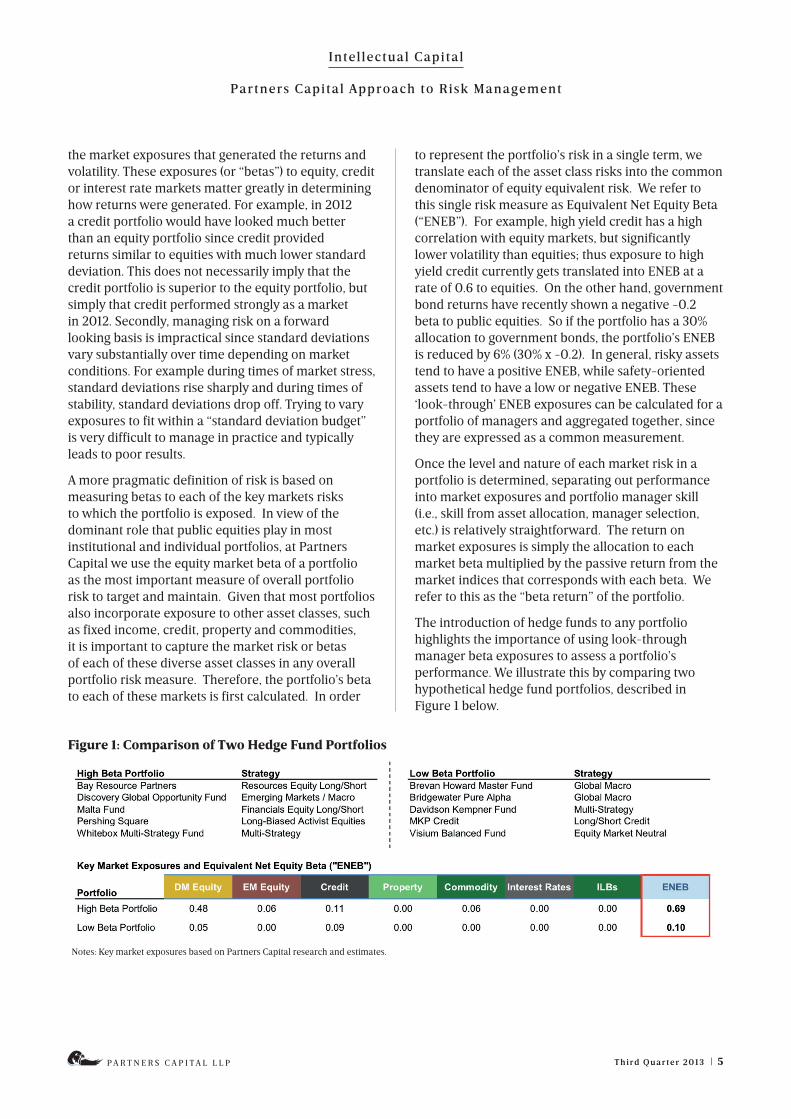
The introduction of hedge funds to any portfolio highlights the importance of using look-through manager beta exposures to assess a portfolio’s performance. We illustrate this by comparing two hypothetical hedge fund portfolios, described in Figure 1 below.
Figure 1: Comparison of Two Hedge Fund Portfolios
Notes: Key market exposures based on Partners Capital research and estimates.
Intel lectual Capital
Partners Capital Approach to Risk Management
P A R T N E R S C A P I T A L L L P Third Quarter 2013 | 6
We separated the selected funds into two groups: a High Beta Portfolio, with more directional exposure, and a Low Beta Portfolio, with more market neutral exposure. All of the selected hedge funds are constituents of the Credit Suisse/Tremont Hedge Fund Index, measuring the broad performance of the hedge fund industry. However, deeper analysis of the underlying exposures and performance shows just how different the risk exposures can be between different strategies and managers. The numbers underneath each column heading (DM Equity, EM Equity, etc.) are the betas that each of the two portfolios has to those different market risks. For example, the High Beta Portfolio’s return should rise by +1.1% due to its credit exposure alone if the credit market index rises by +10% (applying the credit beta or factor of 0.11). The underlying market exposures translate to an equivalent net equity beta (ENEB) of approximately 0.69 for the High Beta Portfolio and 0.10 for the Low Beta Portfolio.
Clearly, these risk levels mean that investors should expect vastly different performance from each of the portfolios in different market environments, even though all of the managers are considered “hedge funds.”
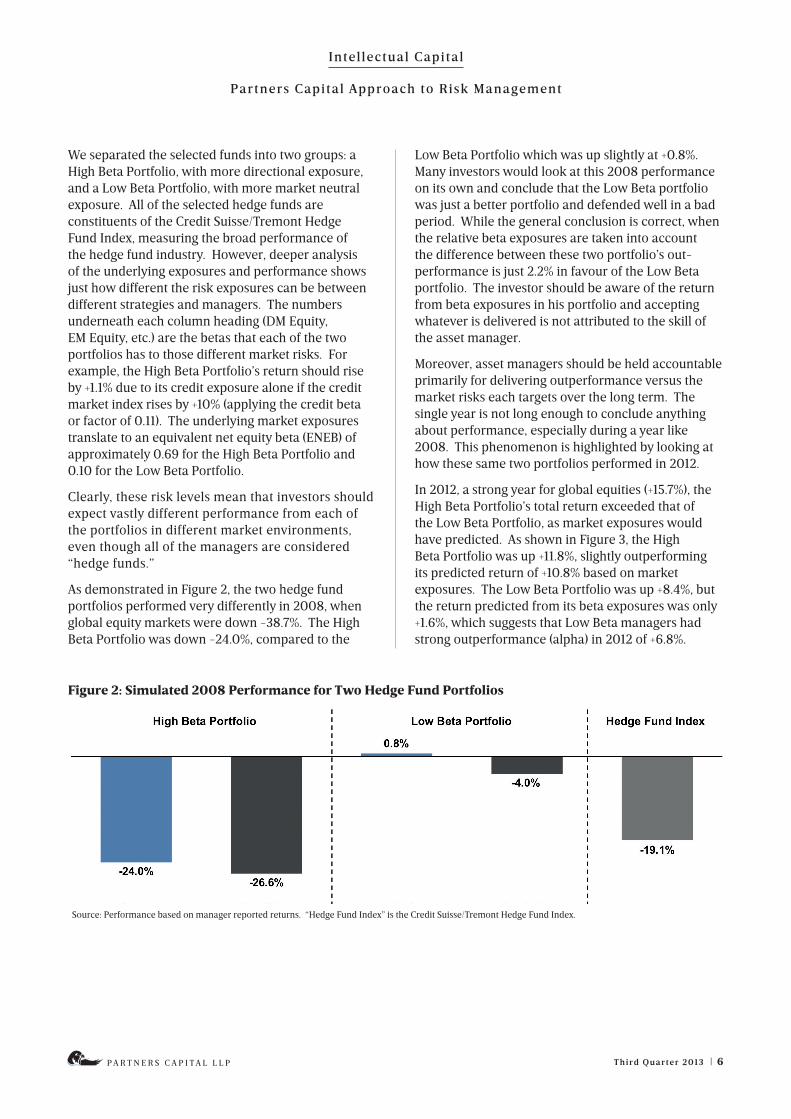
As demonstrated in Figure 2, the two hedge fund portfolios performed very differently in 2008, when global equity markets were down -38.7%. The High Beta Portfolio was down -24.0%, compared to the
Low Beta Portfolio which was up slightly at +0.8%. Many investors would look at this 2008 performance on its own and conclude that the Low Beta portfolio was just a better portfolio and defended well in a bad period. While the general conclusion is correct, when the relative beta exposures are taken into account the difference between these two portfolio’s out-performance is just 2.2% in favour of the Low Beta portfolio. The investor should be aware of the return from beta exposures in his portfolio and accepting whatever is delivered is not attributed to the skill of the asset manager.
Moreover, asset managers should be held accountable primarily for delivering outperformance versus the market risks each targets over the long term. The single year is not long enough to conclude anything about performance, especially during a year like 2008. This phenomenon is highlighted by looking at how these same two portfolios performed in 2012.
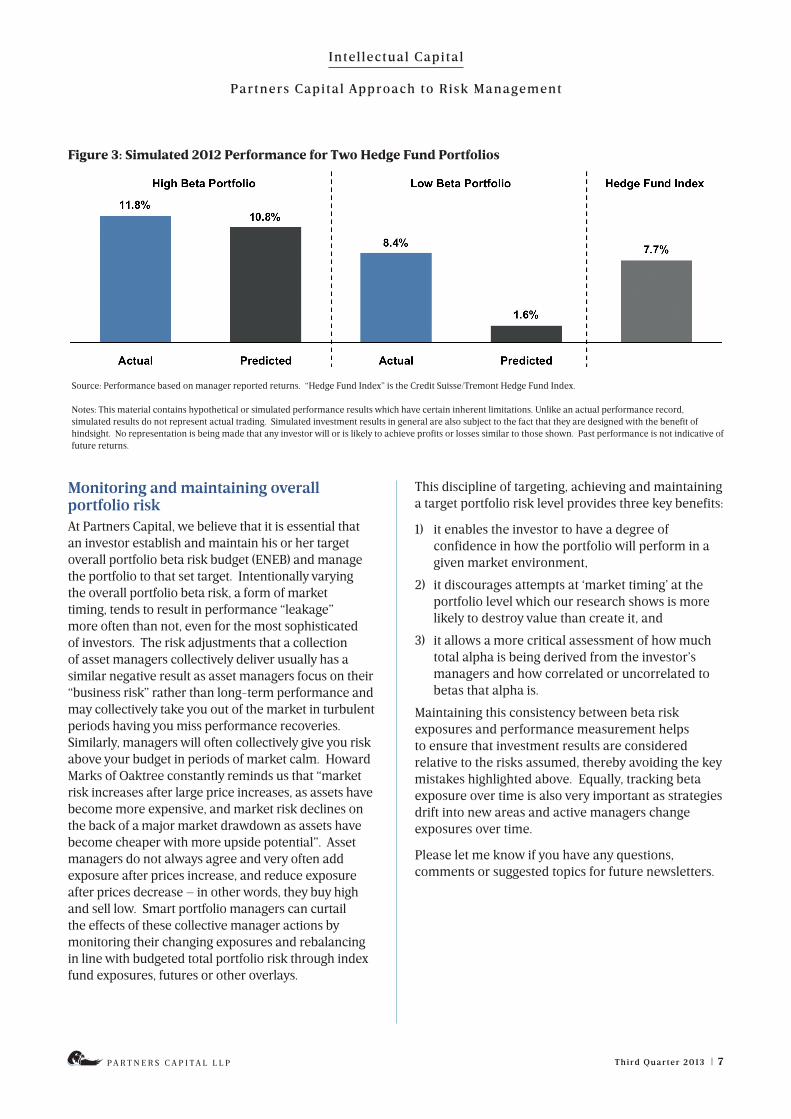
In 2012, a strong year for global equities (+15.7%), the High Beta Portfolio’s total return exceeded that of the Low Beta Portfolio, as market exposures would have predicted. As shown in Figure 3, the High Beta Portfolio was up +11.8%, slightly outperforming its predicted return of +10.8% based on market exposures. The Low Beta Portfolio was up +8.4%, but the return predicted from its beta exposures was only +1.6%, which suggests that Low Beta managers had strong outperformance (alpha) in 2012 of +6.8%.
Source: Performance based on manager reported returns. “Hedge Fund Index” is the Credit Suisse/Tremont Hedge Fund Index.
Figure 2: Simulated 2008 Performance for Two Hedge Fund Portfolios
Intel lectual Capital
Partners Capital Approach to Risk Management
P A R T N E R S C A P I T A L L L P Third Quarter 2013 | 7
Figure 3: Simulated 2012 Performance for Two Hedge Fund Portfolios
Source: Performance based on manager reported returns. “Hedge Fund Index” is the Credit Suisse/Tremont Hedge Fund Index.
Notes: This material contains hypothetical or simulated performance results which have certain inherent limitations. Unlike an actual performance record, simulated results do not represent actual trading. Simulated investment results in general are also subject to the fact that they are designed with the benefit of hindsight. No representation is being made that any investor will or is likely to achieve profits or losses similar to those shown. Past performance is not indicative of future returns.
Monitoring and maintaining overall portfolio riskAt Partners Capital, we believe that it is essential that an investor establish and maintain his or her target overall portfolio beta risk budget (ENEB) and manage the portfolio to that set target. Intentionally varying the overall portfolio beta risk, a form of market timing, tends to result in performance “leakage” more often than not, even for the most sophisticated of investors. The risk adjustments that a collection of asset managers collectively deliver usually has a similar negative result as asset managers focus on their “business risk” rather than long-term performance and may collectively take you out of the market in turbulent periods having you miss performance recoveries. Similarly, managers will often collectively give you risk above your budget in periods of market calm. Howard Marks of Oaktree constantly reminds us that “market risk increases after large price increases, as assets have become more expensive, and market risk declines on the back of a major market drawdown as assets have become cheaper with more upside potential”. Asset managers do not always agree and very often add exposure after prices increase, and reduce exposure after prices decrease – in other words, they buy high and sell low. Smart portfolio managers can curtail the effects of these collective manager actions by monitoring their changing exposures and rebalancing in line with budgeted total portfolio risk through index fund exposures, futures or other overlays.
This discipline of targeting, achieving and maintaining a target portfolio risk level provides three key benefits:
1) it enables the investor to have a degree of confidence in how the portfolio will perform in a given market environment,
2) it discourages attempts at ‘market timing’ at the portfolio level which our research shows is more likely to destroy value than create it, and
3) it allows a more critical assessment of how much total alpha is being derived from the investor’s managers and how correlated or uncorrelated to betas that alpha is.
Maintaining this consistency between beta risk exposures and performance measurement helps to ensure that investment results are considered relative to the risks assumed, thereby avoiding the key mistakes highlighted above. Equally, tracking beta exposure over time is also very important as strategies drift into new areas and active managers change exposures over time.
Please let me know if you have any questions, comments or suggested topics for future newsletters.
Intel lectual Capital
P A R T N E R S C A P I T A L L L P | 8
Firm ProfilePartners Capital is a leading Outsourced Investment Office based in London, Boston, New York City, Singapore and Hong Kong serving investment professionals, endowments, foundations, pensions and high net-worth families globally. We provide wholly independent advice on asset allocation and access to what we believe to be best-of-breed asset managers across all asset classes and geographic markets. This access is strongly enhanced by the quality of our community of shareholders and clients, most of whom are veteran investors themselves in specialist sectors around the world.
The firm was founded in 2001 by investment professionals seeking an independent and conflict free adviser to provide portfolio construction advice and rigorous analysis of investment opportunities. From its initial focus as the “money managers to the money managers” with a base of 70 clients, Partners Capital has grown to become an adviser to endowments and foundations as well as prominent family offices and successful entrepreneurs across the U.S., U.K., Europe and Asia. Endowments have become a large proportion of the institutional client base, which now includes Oxford and Cambridge Colleges, and many of the most highly respected museums and charitable foundations located around the world.
Among Partners Capital services are bespoke, outsourced investment solutions for endowments, foundations and tax-efficient and tax-deferred investment strategies for taxable private clients. For endowments and foundations, Partners Capital advises both entire portfolios as well as separate
specialty strategies, such as Private Equity or Private Debt strategies.
Partners Capital deploys an investment philosophy that embraces many of the powerful diversification benefits of the “endowment model” of investing, but with a more dynamic approach to asset allocation, which seeks to clearly delineate between performances derived from market factors as opposed to the skill of individual managers.
Today, with over $17bn in assets advised, Partners Capital’s clients comprise an approximately equal mix of private individuals and institutional clients. Many of our clients are among the most sophisticated investors in the world, with a sound understanding of investment principles and experience across multiple asset classes.
Partners Capital LLP is authorized and regulated by the Financial Conduct Authority in the United Kingdom; Partners Capital Investment Group LLC is regulated by the Securities and Exchange Commission and is a member of the National Futures Administration in the United States; Partners Capital Asia Limited is licensed by the Securities and Futures Commission in Hong Kong; and Partners Capital Investment Group (Asia) Pte Ltd is regulated by the Monetary Authority of Singapore as a holder of a Capital Markets Services licence for Fund Management under the Securities and Futures Act and as an exempt financial adviser.
Further information can be found on our website: www.partners-cap.com
Europe
5 Young Street London W8 5EH England
Tel: +44 (0)20 7938 5200
North America
50 Rowes Wharf, 4th Floor Boston, MA 02110 USA
Tel: +1 617 292 2570
152 West 57th St, 47th Floor New York, NY 10019 USA
Tel: +1 212 951 1288
Asia
50 Raffles Place, Level 34 Singapore Land Tower Singapore 048623
Tel: +65 6645 3733
Two Exchange Square 8 Connaught Place, Level 8 Central, Hong Kong
Tel: +852 2297 2467

Intel lectual Capital
P A R T N E R S C A P I T A L L L P | 9
DISCLAIMERCopyright © 2016, Partners Capital
This document is being provided to customers and other parties on the condition that it will not form a primary basis for any investment decision by or on behalf of such customers or parties. This document and any related documentation provided herewith is given on a confidential basis.
This document is not intended for public use or distribution. It is the responsibility of every person reading this document to satisfy himself or herself as to the full observance of any laws of any relevant jurisdiction applicable to such person, including obtaining any governmental or other consent which may be required or observing any other formality which needs to be observed in such jurisdiction. This document is not an offer to sell or the solicitation of an offer to buy any security.
The source for all figures included in this document is Partners Capital unless stated otherwise. While all the information prepared in this document is believed to be accurate, Partners Capital may have relied on information obtained from third parties and makes no warranty as to the completeness or accuracy of information obtained from such third parties, nor can it accept responsibility for errors of such third parties, appearing in this document. The information contained herein has neither been reviewed nor approved by any referenced funds or investment managers.
Opinions expressed are our current opinions as of the date appearing on this document only. We do not undertake to update the information discussed in this document. We and our affiliates, partners, officers, directors, managing directors, and employees, including persons involved in the preparation or issuance of this material may, from time to time, have long or short positions in, and buy and sell, the securities, or derivatives thereof, of any companies or issuers mentioned herein.
This document contains hypothetical or simulated performance results, including for the Equity/Bond index, which have certain inherent limitations. Unlike an actual performance record, simulated results do not represent actual trading. Also, since the trades have not actually been executed, the results may have under- or over-compensated for the impact, if any, of certain market factors, such as lack of liquidity. Simulated trading programs in general are also subject to the fact that they are designed with the benefit of hindsight. No representation is being made that any client will or is likely to achieve profits or losses similar to those shown. These results are simulated and may be presented gross or net of management fees.
This document may include indications of past performance of investments or asset classes. Past performance is not a reliable indicator and is no guarantee of future results.
Investment returns will fluctuate with market conditions and every investment has the potential for loss as well as profit. The value of investments may fall as well as rise and investors may not get back the amount invested.
Certain information presented herein constitutes “forward-looking statements” which can be identified by the use of forward-looking terminology such as “may,” “will,” “should,” “expect,” “anticipate,” “project,” “continue” or “believe” or the negatives thereof or other variations thereon or comparable terminology. Any projections, market outlooks or estimates in this document are forward-looking statements and are based upon certain assumptions. Due to various risks and uncertainties, actual market events, opportunities or results or strategies may differ materially from those reflected in or contemplated by such forward-looking statements and any such projections, outlooks or assumptions should not be construed to be indicative of the actual events which will occur.
Certain transactions, including those involving futures, options, and high yield securities, give rise to substantial risk and are not suitable for all investors. The investments described herein are speculative, involve significant risk and are suitable only for investors of substantial net worth who are willing and have the financial capacity to purchase a high risk investment which may not provide any immediate cash return and may result in the loss of all or a substantial part of their investment. An investor should be able to bear the complete loss in connection with any investment.
Certain aspects of the investment strategies described in this document may from time to time include commodity interests as defined under applicable law. Pursuant to an exemption from the U.S. Commodity Futures Trading Commission (CFTC) in connection with accounts of qualified eligible clients, this document is not required to be, and has not been filed with the CFTC. The CFTC does not pass upon the merits of participating in a trading program or upon the adequacy or accuracy of commodity trading advisor disclosure. Consequently, the CFTC has not reviewed or approved this trading program or this document.
Partners Capital refers to the Partners Capital group of entities comprising: (i) Partners Capital Investment Group, LLC, registered as an investment adviser with the Securities and Exchange Commission (“SEC”), as a commodity trading adviser with the Commodity Futures Trading Commission (“CFTC”) and is a member of the National Futures Association (“NFA”) (ii) Partners Capital LLP (FRN: 475743), authorised and regulated in the United Kingdom by the Financial Conduct Authority (“FCA”) and (iii) Partners Capital Asia Limited (CER:AXB644), licensed by the Securities and Futures Commission (“SFC”) in Hong Kong (iv) Partners Capital Investment Group (Asia) Pte Ltd regulated by the Monetary Authority of Singapore (MAS) as a holder of a Capital Markets Services licence for Fund Management under the Securities and Futures Act and as an exempt financial adviser.