partners-hallmark preliminary report
TRANSCRIPT

Review of PaRtneRs HealtHCaRe system’s PRoPosed aCquisition of
HallmaRk HealtH CoRPoRation (HPC-CmiR-2013-4)
PuRsuant to m.G.l. C. 6d, § 13
PReliminaRy RePoRtJuly 2, 2014
Commonwealth of massaChusetts
health PoliCy Commission

INTRODUCTION
The Health Policy Commission (HPC) was established in 2012 by the Commonwealth’s
landmark health care cost containment law, Chapter 224 of the Acts of 2012, “An Act Improving the
Quality of Health Care and Reducing Costs through Increased Transparency, Efficiency, and
Innovation” (Chapter 224). The HPC is an independent state agency governed by an 11-member board
with diverse experience in health care. It is charged with developing health policy to reduce overall
cost growth while improving the quality of care, and monitoring the health care delivery and payment
systems in Massachusetts.
Recognizing that excessive health care costs are crowding out other economic needs for
government, households, and businesses, Chapter 224 set a statewide target for a sustainable rate of
growth of total health care expenditures. This benchmark is set at 3.6% for 2014. Achieving this
ambitious benchmark will require the continued development of a competitive, value-based health care
market and a more efficient, accountable health care delivery system.
Chapter 224 tasks the HPC with many important responsibilities to support the
Commonwealth’s efforts to meet the health care cost growth benchmark, including to “foster
innovative health care delivery and payment models” as well as to “monitor and review the impact of
changes within the health care marketplace.”1 These dual values of innovation and accountability are
at the core of that landmark legislation and the HPC’s mission, and both are necessary to advance the
goal of a more affordable and effective health care system.
A significant aspect of the health care system that requires more transparency and
accountability is the evolving structure and composition of the provider market. Provider changes,
including consolidations and alignments, have been shown to impact health care market functioning,
and thus the performance of our health care system in delivering high quality, cost effective care. Due
to confidential payer-provider contracts and limited information about provider organizations, the
mechanisms by which market changes impact the cost, quality, and availability of health care services
have not been apparent to government, consumers, and businesses which ultimately bear the costs of
the health care system.
Chapter 224 directs the HPC to monitor this aspect of the Massachusetts health care system.
Through the filing of notices of material change by provider organizations,2 the HPC tracks the
frequency, type, and nature of changes in our health care market.3 The HPC may also engage in a
more comprehensive review of particular transactions anticipated to have a significant impact on
health care costs or market functioning. The result of such “cost and market impact reviews” (CMIRs)
is a public report detailing the HPC’s findings. In order to allow for public assessment of the findings,
the transactions may not be finalized until the HPC issues its Final Report. Where appropriate, such
1 MASS. GEN. LAWS ch. 6D, § 5 (2012).
2 In this report, we use the terms provider organization, defined in MASS. GEN. LAWS ch. 6D, § 1 (2012), and provider
system interchangeably. 3 See MASS. GEN. LAWS ch. 6D, § 13 (2012) (requiring health care providers to notify the HPC before making material
changes to their operations or governance). See also MASS. HEALTH POLICY COMM’N, BULLETIN 2013-01: INTERIM
GUIDANCE FOR PROVIDERS AND PROVIDER ORGANIZATIONS RELATIVE TO NOTICE OF MATERIAL CHANGE (Mar. 12, 2013),
available at http://www.mass.gov/anf/docs/hpc/material-change-notices/20130312-interim-guidance-on-material-change-
and-notice-form.pdf.
reports may identify areas for further review or monitoring, or be referred to other state agencies in
support of their work on behalf of health care consumers.4
The HPC conducts its work during a period of dynamic change among provider organizations,
including accelerating consolidation and new contractual and clinical alignments. In particular,
hospital acquisition of physicians and the transition from independent or affiliated practices to
employment models are significant trends both in Massachusetts and nationally, as is increased
presence of alternative payment models focused on promoting accountable care. Through the CMIR
process we seek to improve our understanding of these trends and other market developments affecting
short and long term health care spending, quality, and consumer access. In addition, our reviews
enable us to identify particular factors for market participants to consider in proposing and responding
to potential future organizational changes. Through this process, we seek to encourage providers and
payers alike to evaluate and take steps to minimize negative impacts and enhance positive outcomes of
any given material change.
This document reports on the HPC’s third CMIR, examining the proposed acquisition of
Hallmark Health System (Hallmark) and its affiliates by Partners HealthCare System (Partners). Based
on criteria articulated in Chapter 224 and informed by the facts of the transaction, we analyzed the
likely impact of this acquisition, relying on the best available data and information. Our work included
review of the parties’ stated goals for the transaction and the information they provided in support of
how and when these alignments would result in efficiencies and care delivery improvements.
Concurrent with the HPC’s review, the Massachusetts Attorney General (AGO), Partners, and
related health care providers filed a proposed consent judgment that would settle an extensive law
enforcement investigation into Partners’ market conduct and plans to acquire Hallmark, South Shore
Hospital (the subject of the HPC’s first CMIR), and their related physicians. Since that investigation
includes the Hallmark transaction under review in this CMIR, aspects of this report address some
topics common to that law enforcement review.
As discussed above, under Chapter 224, the HPC’s CMIRs are intended to provide for public
assessment of a spectrum of potential impacts from market changes, ranging from changes in cost and
quality performance to impacts on the availability and accessibility of services. To the HPC’s
knowledge, no other state has authorized such a policy-oriented, prospective review of the impact of
health care transactions that is distinct from an administrative determination of need or law
enforcement review of antitrust or consumer protection concerns. This public reporting process is a
unique opportunity to enhance the transparency of significant changes to our health care system, and
can inform and complement the many important efforts of other agencies, such as the AGO, the Center
for Health Information and Analysis (CHIA), the Department of Public Health (DPH), and the
Division of Insurance (DOI), in monitoring and overseeing our health care market. Consistent with the
goals of Chapter 224, comprehensive and evidence-based reporting of provider organization
performance brings important information to the public dialogue about how to develop a more
affordable, effective, and accountable health care system.
4 For example, MASS. GEN. LAWS ch. 6D, §13(f) (2012) requires referral of the CMIR report to the state Attorney General’s
Office if the HPC finds that a provider under review (1) has a dominant market share in its service area, (2) charges prices
that are materially higher than the median prices in its service area for the same services, and (3) has a health status adjusted
total medical expense that is materially higher than the median in its service area.
i
TABLE OF CONTENTS
Introduction
Acronyms and Abbreviations ii
Naming Conventions iii
Executive Summary 1
I. Analytic Approach and Data Reliances 4
II. Overview of the Parties and the Transaction 6
III. Analysis of Parties’ Baseline Performance (2010 – 2013) 16
IV. Impact Projections (2014 onward) 40
V. Conclusion 73
Acknowledgements
ii
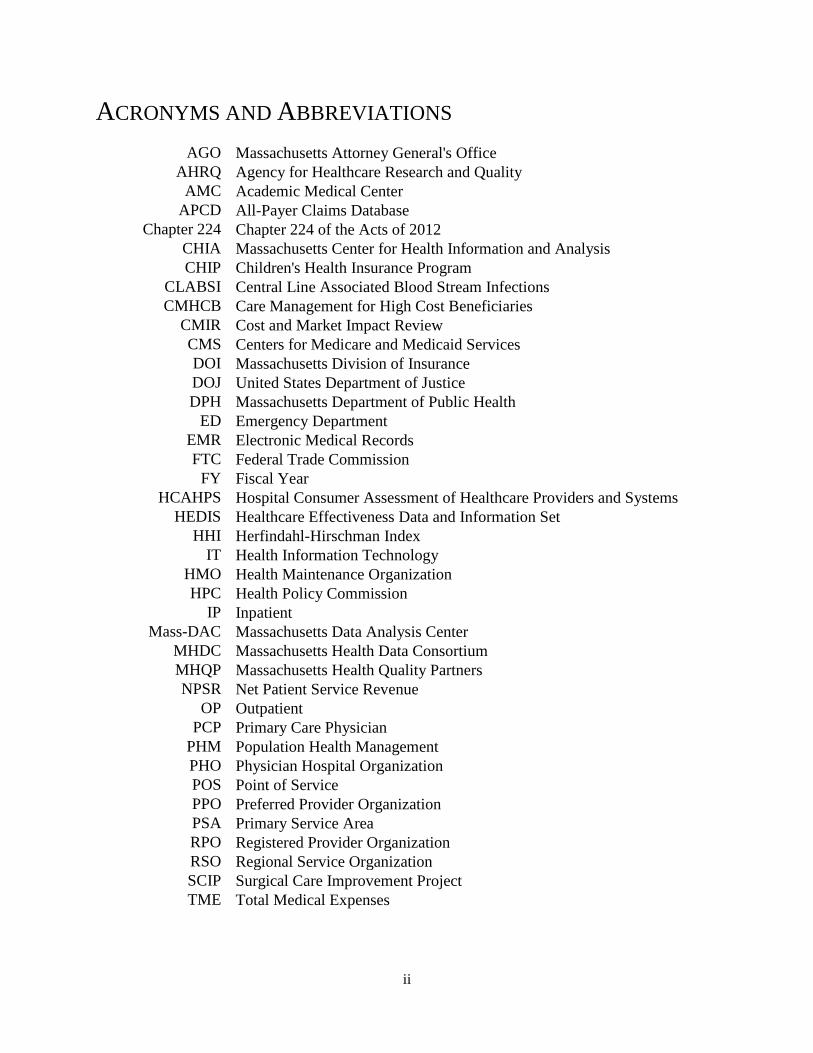
ACRONYMS AND ABBREVIATIONS
AGO Massachusetts Attorney General's Office
AHRQ Agency for Healthcare Research and Quality
AMC Academic Medical Center
APCD All-Payer Claims Database
Chapter 224 Chapter 224 of the Acts of 2012
CHIA Massachusetts Center for Health Information and Analysis
CHIP Children's Health Insurance Program
CLABSI Central Line Associated Blood Stream Infections
CMHCB Care Management for High Cost Beneficiaries
CMIR Cost and Market Impact Review
CMS Centers for Medicare and Medicaid Services
DOI Massachusetts Division of Insurance
DOJ United States Department of Justice
DPH Massachusetts Department of Public Health
ED Emergency Department
EMR Electronic Medical Records
FTC Federal Trade Commission
FY Fiscal Year
HCAHPS Hospital Consumer Assessment of Healthcare Providers and Systems
HEDIS Healthcare Effectiveness Data and Information Set
HHI Herfindahl-Hirschman Index
IT Health Information Technology
HMO Health Maintenance Organization
HPC Health Policy Commission
IP Inpatient
Mass-DAC Massachusetts Data Analysis Center
MHDC Massachusetts Health Data Consortium
MHQP Massachusetts Health Quality Partners
NPSR Net Patient Service Revenue
OP Outpatient
PCP Primary Care Physician
PHM Population Health Management
PHO Physician Hospital Organization
POS Point of Service
PPO Preferred Provider Organization
PSA Primary Service Area
RPO Registered Provider Organization
RSO Regional Service Organization
SCIP Surgical Care Improvement Project
TME Total Medical Expenses
iii
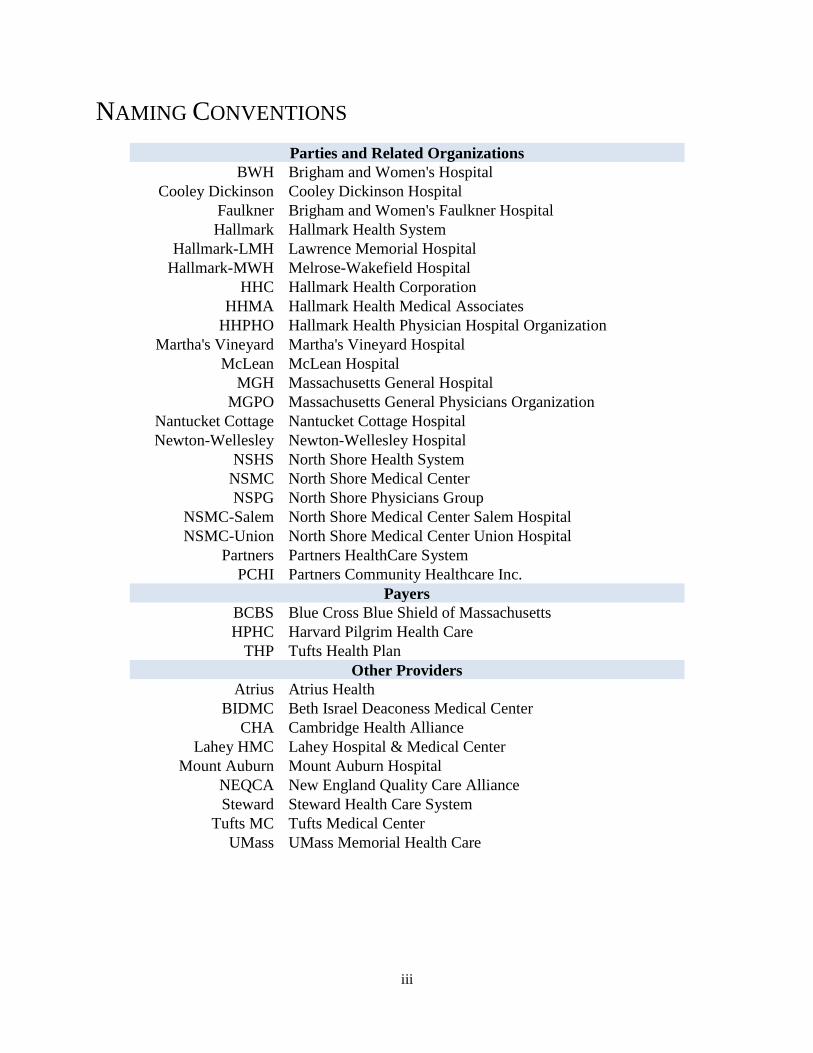
NAMING CONVENTIONS
Parties and Related Organizations
BWH Brigham and Women's Hospital
Cooley Dickinson Cooley Dickinson Hospital
Faulkner Brigham and Women's Faulkner Hospital
Hallmark Hallmark Health System
Hallmark-LMH Lawrence Memorial Hospital
Hallmark-MWH Melrose-Wakefield Hospital
HHC Hallmark Health Corporation
HHMA Hallmark Health Medical Associates
HHPHO Hallmark Health Physician Hospital Organization
Martha's Vineyard Martha's Vineyard Hospital
McLean McLean Hospital
MGH Massachusetts General Hospital
MGPO Massachusetts General Physicians Organization
Nantucket Cottage Nantucket Cottage Hospital
Newton-Wellesley Newton-Wellesley Hospital
NSHS North Shore Health System
NSMC North Shore Medical Center
NSPG North Shore Physicians Group
NSMC-Salem North Shore Medical Center Salem Hospital
NSMC-Union North Shore Medical Center Union Hospital
Partners Partners HealthCare System
PCHI Partners Community Healthcare Inc.
Payers
BCBS Blue Cross Blue Shield of Massachusetts
HPHC Harvard Pilgrim Health Care
THP Tufts Health Plan
Other Providers
Atrius Atrius Health
BIDMC Beth Israel Deaconess Medical Center
CHA Cambridge Health Alliance
Lahey HMC Lahey Hospital & Medical Center
Mount Auburn Mount Auburn Hospital
NEQCA New England Quality Care Alliance
Steward Steward Health Care System
Tufts MC Tufts Medical Center
UMass UMass Memorial Health Care
1
EXECUTIVE SUMMARY
On January 31, 2014, Partners HealthCare System (Partners) and Hallmark Health
Corporation (HHC) executed an Affiliation Agreement for Partners to acquire Hallmark Health
System (Hallmark) and its affiliates, including two acute care hospitals (Lawrence Memorial
Hospital in Medford and Melrose-Wakefield Hospital in Melrose) and multiple outpatient
facilities, making Hallmark a fully integrated, community-based member of the Partners system.5
The transaction builds on an eighteen-year clinical and contracting relationship between the
parties.6 The parties state that they are committed to “accepting responsibility (and financial
risk) for controlling the total medical expenses . . . for patients cared for by their primary care
physicians in the . . . communities served by [the parties].”7 In order to achieve this objective,
the parties seek to implement a “robust population health management (PHM) model” in their
joint service area,8 which they state will require relocating and rationalizing facilities and service
lines, expanding and more fully integrating their primary care networks, and investing in
integrated information systems.
Following a 30-day initial review, the HPC determined that the transaction was likely to
have a significant impact on costs and market functioning in northeastern Massachusetts and
warranted further review.9 This Preliminary Report presents our analysis and the key findings
from our review. Following a 30-day opportunity for the parties to respond to these findings, the
HPC will issue a Final Report.
Concurrent with the HPC’s review, the Massachusetts Attorney General (AGO), Partners,
and related health care providers filed a proposed consent judgment in state court that would
settle an extensive law enforcement investigation into Partners’ market conduct and recent
expansion plans.10
Among other provisions, we understand this agreement would constrain
Partners’ contracting practices, network growth, and prices for five to ten years, and would allow
Partners to acquire South Shore Hospital, Hallmark, and their related providers. The agreement
5 On November 8 and 12, 2013, Partners and HHC filed Notices of Material Change with the HPC pursuant to
MASS. GEN. LAWS ch. 6D, § 13 (2012). 6 As part of this relationship, Hallmark contracts with most of the major payers through Partners Community
Healthcare Inc. (PCHI) for both its health maintenance organization (HMO)/point of service (POS) and preferred
provider organization (PPO) rates for both its physician and hospital services. See also infra note 32 and
accompanying text (noting the history of Hallmark’s joint contracting relationship with PCHI). 7 Application by Hallmark Health System, Inc. for Determination of Need under 105 C.M.R. 100.600-603 for
Change of Ownership of Hallmark Health System, Attachment G, Affiliation Agreement, Art. 1, 4.5 (Apr. 4, 2014)
[hereinafter Affiliation Agreement]. 8 The parties describe their joint service area as the “Northern Corridor,” which is comprised of the combined
primary and secondary service areas of Hallmark (Lawrence Memorial Hospital and Melrose-Wakefield Hospital
campuses) and North Shore Medical Center (NSMC) (Union and Salem campuses). Id. at Exh. 4.4.1-A. 9 See MASS. HEALTH POLICY COMM’N, MINUTES OF THE HEALTH POLICY COMM’N (Dec. 18, 2013) (approving
continuation of the Cost and Market Impact Review of the Partners/Hallmark merger). 10
See generally Press Release, Office of Att’y Gen. Martha Coakley, AG Final Resolution with Partners Would
Alter Provider’s Negotiating Power, Restrict Growth and Health Care Costs (June 24, 2014), available at
http://www.mass.gov/ago/news-and-updates/press-releases/2014/2014-06-24-partners-settlement.html (last visited
June 25, 2014).
2
would also require the AGO and Partners to confer on mitigating any material price impacts
identified by the HPC in this CMIR.
We understand the agreement limits average price growth across all Partners providers to
no more than the rate of general inflation for the next 6.5 years, and separately holds the South
Shore providers, as an individual group, to this same cap. Since the current agreement does not
separately cap the prices of the Hallmark providers, we understand that Hallmark’s prices could
grow in excess of general inflation, so long as the impact of that increase was allocated across
the rest of Partners’ community network. The findings of this report thus bear on the need for
mitigation of Hallmark-specific price impacts, as we anticipate increases in Hallmark’s prices as
a result of this transaction that would set a new, permanent baseline upon which future price
increases would be negotiated, including prices negotiated after the expiration of the settlement.
Similarly, we understand that other material price effects, such as changes in site of patient care
across differently priced providers – especially for patients in Preferred Provider Organization
(PPO) and non-risk Health Maintenance Organization (HMO)/ Point of Service (POS) insurance
products – are not fully encompassed by the current agreement. Over time, the increased
spending baseline from such site of care effects will impact consumers and payers in
northeastern Massachusetts, as well as providers who refer their patients to Hallmark facilities
and are increasingly at risk for these patients’ total medical expenses.
This report is organized into five parts. Part I outlines our analytic approach to
conducting CMIRs. Part II describes the parties to this CMIR and their goals and plans for
undertaking the transaction. Parts III and IV then present our findings. Part III reports on the
parties’ baseline performance leading up to the transaction, and Part IV reports on the projected
impact of the transaction on that baseline. We conclude in Part V. Below is a summary of the
findings presented in Parts III and IV:
1. Cost Profile: Partners and Hallmark are financially strong and have the highest share of
inpatient and primary care services in the relevant service areas. In each region where
Partners operates, its hospitals have higher prices than nearly all other area hospitals, and
Partners’ physicians have some of the highest prices in the state. Hallmark’s prices are
lower than those of other Partners hospitals and physician groups. Partners has higher
health status adjusted total medical expenses (TME) than Hallmark, due in part to its
higher prices.
2. Quality Profile: Partners is generally a strong quality performer, consistently exceeding
Massachusetts and national averages across a spectrum of measures. Hallmark’s
hospitals have slightly above-average inpatient quality compared to state and national
benchmarks and Hallmark’s physician groups generally perform at or slightly below the
state average among Massachusetts physician groups.
3. Access Profile: Hallmark and North Shore Medical Center (NSMC) provide a range of
inpatient and outpatient services, including behavioral health, that are important to their
local communities. While northeastern Massachusetts appears to have some excess
inpatient bed capacity, evidence indicates there is likely a need for additional behavioral
health capacity. While Partners’ hospitals generally care for higher proportions of
3
commercially insured patients and lower proportions of Medicaid patients than other area
hospitals, the exception is their hospital in northeastern Massachusetts, NSMC, which has
a relatively high government payer mix. The Hallmark hospitals also have a relatively
high government payer mix, particularly of Medicare patients, and a particularly high mix
of Medicare behavioral health patients at Lawrence Memorial Hospital.
4. Cost Impact: This transaction will reinforce Partners’ position as the provider with the
highest share of inpatient and primary care services in its northeastern Massachusetts
service areas. Over time, this transaction is anticipated to increase spending in
northeastern Massachusetts by an estimated $15.5 million to $23 million per year for the
three major commercial payers due to material price effects, which are not expected to be
offset by commensurate savings from decreased utilization through population health
management (PHM).
5. Quality Impact: The differences in Partners and Hallmark’s historic quality
performance indicate potential for the transaction to drive quality improvement.
However, Partners and Hallmark have already been affiliated for nearly 20 years,
including joint clinical and contracting efforts, and it is unclear how this merger is
necessary to improve clinical quality in ways the parties’ longstanding affiliation has not.
6. Access Impact: The parties have proposed significant changes to care delivery that have
the potential to expand access to a number of services in northeastern Massachusetts.
However, the parties’ current plans lack the detail necessary to evaluate the extent to
which such potential will be realized. Given Hallmark and NSMC’s high government
payer mix, the proposed reconfiguration and relocation of services is anticipated to
impact especially vulnerable populations as they seek to access services at new, more
distant locations.
In summary, based on our review, we find that the proposed transaction between Partners
and Hallmark is likely to increase health care spending in northeastern Massachusetts, reinforce
Partners’ market power, and, over time, increase premiums for employers and consumers. While
the parties have described PHM initiatives that have the potential to reduce total medical
spending, those potential savings are unlikely to offset the projected increases to health care
spending. At the same time, this transaction has the potential to improve quality and increase
access to certain health care services. The parties’ current plans lack sufficient detail to enable
us to assess the likelihood that this potential will be realized, or confirm that potential adverse
impacts to vulnerable populations will be sufficiently mitigated. We invite the parties to address
these concerns in their written response, including how they would demonstrate any
commitments in this regard.
Based on these findings, this transaction may warrant further review and referral to the
AGO pursuant to MASS. GEN. LAWS ch. 6D, § 13. These findings suggest, consistent with the
terms of the proposed consent judgment, that further consideration of mitigation of transaction-
specific impacts is likely warranted. Following the period for written response, we look forward
to publishing our Final Report, including any referral to the Massachusetts Attorney General's
Office.
4
I. ANALYTIC APPROACH AND DATA RELIANCES
A. ANALYTIC APPROACH
In structuring a CMIR, we take the following steps. First, we identify the primary areas
of impact for the HPC to study. MASS. GEN. LAWS ch. 6D, § 13 tasks the HPC with examining
impact in three interrelated areas:11
1. Costs. The statute directs the HPC to examine prices, total medical expenses, provider
costs and market share, and other measures of health care spending.
2. Quality. The statute directs the HPC to examine the quality of services provided,
including patient experience.
3. Access/market structure. The statute directs the HPC to examine the availability and
accessibility of services provided; the provider’s role in serving at-risk, underserved, and
government payer patient populations; the provider’s role in providing low or negative
margin services; the provider’s methods for attracting patient volume and health care
professionals; and the provider’s impact on competing options for care delivery.
After identifying the primary areas for the HPC’s review, we then gather detailed
information in each of these areas. The HPC examines recent data to establish the parties’
baseline performance in each of these areas prior to the transaction. The HPC then combines
the parties’ baseline performance with known details of the transaction, as well as the parties’
goals and plans, to project the impact of the transaction on baseline performance. The analytic
sections of this report are divided into two parts that mirror this framework: Part III addresses
baseline performance and Part IV addresses impact analysis.
Within this general framework for CMIRs, the specific facts of a transaction, the
availability of accurate data, and time constraints will affect the particular analyses included in
our review of any given material change. We also seek to focus our work on analyses that
complement, rather than duplicate, the work of other agencies. Future CMIRs may encompass
new and evolving analyses, depending on the facts of a transaction, recent market developments,
areas of public interest, and the availability of improved data resources, like an expanded All-
Payer Claims Database (APCD) and Registered Provider Organization (RPO) information.
12
B. DATA RELIANCES
To conduct this review, we relied on the documents and data the parties produced to us in
response to HPC information requests, and their own description of the transaction as presented
11
The HPC may also examine consumer concerns and any other factors it determines to be in the public interest.
MASS. GEN. LAWS ch. 6D, § 13(d) (2012). 12
All-Payer Claims Database, CTR. FOR HEALTH INFO. & ANALYSIS, http://www.mass.gov/chia/researcher/hcf-data-
resources/apcd/ (last visited Apr. 16, 2014) (“The APCD is comprised of medical, pharmacy, and dental claims, as
well as information about member eligibility, benefit design, and providers for all payers covering Massachusetts
residents.”); MASS. GEN. LAWS ch. 6D, § 11 (2012) (requiring provider organizations to register biennially with the
HPC and provide information on contractual and operating structures, capacity, and other requested information).
5
in their material change notices and other filings with the Commonwealth.13
To further inform
our review, the HPC obtained data and documents from a number of other sources. These
include state agencies such as the AGO’s Non-Profit Organizations/Public Charities Division
and CHIA, from which we received provider-level data as well as claims-level data in the
APCD; federal agencies such as the Agency for Healthcare Research and Quality (AHRQ) and
the Centers for Medicare and Medicaid Services (CMS); private organizations that collect health
care data such as the Massachusetts Health Data Consortium (MHDC) and Massachusetts Health
Quality Partners (MHQP); payers such as Blue Cross Blue Shield of Massachusetts (BCBS),
Harvard Pilgrim Health Care (HPHC), and Tufts Health Plan (THP); and health care providers
operating in the same areas of the state as the parties. The HPC appreciates the cooperation of
all entities that provided information in support of this review.
Where our analyses rely on nonpublic information produced by the parties or other
market participants, MASS. GEN. LAWS ch. 6D, § 13 prohibits the HPC from disclosing such
information without the consent of the producing entity, except in a preliminary or final CMIR
report where “the commission believes that such disclosure should be made in the public interest
after taking into account any privacy, trade secret or anti-competitive considerations.”14
Consistent with this statutory requirement, this Preliminary Report contains only limited
disclosures of such confidential information where the HPC has determined that the public
interest in disclosure outweighs privacy, trade secret, and anti-competitive considerations.
To assist in our review and analysis of information, the HPC engaged consultants with
extensive experience evaluating provider systems and their impact on the health care market.
Working with these experts, the HPC extensively analyzed the data and other materials provided.
For each analysis, the HPC utilized the most recent, reliable data available. Because data—
whether publicly reported or privately held—is usually generated on a variable schedule from
entity to entity, the most recent and reliable data generally reflects 2012 data and sometimes
2013 or 2011. We have noted the applicable year for the underlying data throughout this report.
Wherever possible, the HPC examined multiple years of data to analyze trends and to report on
the consistency of findings over time. For data and materials produced by the parties and other
market participants, the HPC tested the accuracy and consistency of the data collected to the
extent possible, but also had to rely in large part on the producing party for the quality of the
information provided.
Several of our analyses focus on the anticipated cost impact in the commercially insured
market. In the commercially insured market, prices for health care services—whether fee-for-
service, global budgets, or other forms of alternative payments—are established through private
negotiations between payers and providers. The terms of these payer-provider contracts vary
widely, both with regard to price and with regard to other material terms that impact health care
costs and market functioning.15
Within the commercial market, we focused our review on four
13
E.g., Application by Hallmark Health System, Inc. for Determination of Need under 105 C.M.R. 100.600-603 for
Change of Ownership of Hallmark Health System (Apr. 4, 2014). 14
MASS. GEN. LAWS ch. 6D, § 13(c) (2012), amended by 2013 Mass. Acts 38, § 20. 15
See, e.g., OFFICE OF ATT’Y GEN. MARTHA COAKLEY, EXAMINATION OF HEALTH CARE COST TRENDS AND COST
DRIVERS PURSUANT TO G.L. C. 118G, § 6 ½(b): REPORT FOR ANNUAL PUBLIC HEARING 40-43 (Mar. 16, 2010)

6
payers, the three largest Massachusetts payers (BCBS, HPHC, THP) and a major national payer,
which together account for more than 80% of the commercial market.16
For future reports, we
hope to have access to consolidated data on the entire health care market through the APCD,
RPO program, and other resources.
Many of our analyses compare Hallmark and Partners’ existing hospital in northeastern
Massachusetts, NSMC, to other hospitals operating in the same area. These comparator
hospitals, shown below, were identified based on geography, service offerings, and patient flow
patterns, and are intended to reflect a set of hospitals that a local patient could reasonably choose
as a substitute for the focal hospital:
North Shore Medical Center Salem Hospital and North Shore Medical Center Union
Hospital (NSMC, jointly, or NSMC-Union and NSMC-Salem, individually):
Hallmark-Lawrence Memorial Hospital (Hallmark-LMH), Hallmark-Melrose-Wakefield
Hospital (Hallmark-MWH), Lahey-Addison Gilbert Hospital, Lahey-Beverly Hospital,
Lahey Hospital & Medical Center (Lahey HMC);
Lawrence Memorial Hospital and Melrose-Wakefield Hospital (Hallmark hospitals,
jointly, or Hallmark-LMH and Hallmark-MWH, individually): Cambridge Health
Alliance (CHA), Lahey HMC, Mount Auburn Hospital (Mount Auburn), NSMC,
Winchester Hospital (Winchester).
Given that the Hallmark hospitals and NSMC operate in similar regions, we often present
their data together, along with the comparators for both hospitals.
Throughout this report, we seek to present data in the manner that most accurately
reflects the current state of the market. For example, Cooley Dickinson Hospital (Cooley
Dickinson), which was acquired by Partners in July 2013, is included in Partners’ hospital
statistics. Cooley Dickinson Physician Hospital Organization, which the HPC understands has
not joined Partners’ physician organization, Partners Community Healthcare Inc. (PCHI), is not
included in PCHI’s information. Other recent transactions, such as Beth Israel Deaconess
Medical Center’s acquisition of Jordan Hospital, as well as pending transactions that have passed
necessary regulatory approvals, are also reflected throughout our data except where explicitly
noted.
II. OVERVIEW OF THE PARTIES AND THE TRANSACTION
On January 31, 2014, Partners HealthCare System (Partners) and Hallmark Health
Corporation (HHC) executed an Affiliation Agreement for Partners to acquire HHC and its
[hereinafter AGO 2010 COST TRENDS REPORT], available at http://www.mass.gov/ago/docs/healthcare/2010-hcctd-
full.pdf. 16
CTR. FOR HEALTH INFO. & ANALYSIS, ANNUAL REPORT ON THE MASSACHUSETTS HEALTH CARE MARKET, 1 (Aug.
2013) [hereinafter CHIA ANNUAL REPORT AUG. 2013], available at http://www.mass.gov/chia/docs/r/pubs/13/ar-
ma-health-care-market-2013.pdf. This report relies primarily on data from BCBS, HPHC, and THP, whom we
commonly refer to as the “three largest payers.” Where we are able to include data from the major national payer
with the data of these three largest payers, we refer to the group as “four major payers” in Massachusetts.
7
affiliates, including Hallmark Health System (Hallmark).17
This section describes the parties and
their proposed transaction.
A. PARTNERS HEALTHCARE SYSTEM
Partners is the largest provider system in Massachusetts and, like most providers in
Massachusetts, operates as a non-profit public charity. It was founded in 1994 by an affiliation
between Brigham and Women’s Hospital (BWH) and Massachusetts General Hospital (MGH).
Partners owns eight general acute care hospitals18
with a total of 2,793 licensed beds that operate
across the following five regions within Massachusetts:
Boston: BWH and MGH (academic medical centers) and Brigham and Women’s
Faulkner Hospital (community hospital)
Metro-West: Newton-Wellesley
North Shore: NSMC (two campuses, NSMC-Salem and NSMC-Union)
Cape and Islands: Nantucket Cottage Hospital (Nantucket Cottage) and Martha’s
Vineyard Hospital (Martha’s Vineyard)
Pioneer Valley: Cooley Dickinson
Partners also contracts with most major payers on behalf of two non-owned affiliate
hospitals, Hallmark and Emerson Hospital. BWH and MGH, Partners’ largest hospitals, are
academic medical centers (AMCs) that serve as principal teaching hospitals of Harvard Medical
School. They are also the largest private hospital recipients of the National Institutes of Health
funding in the nation.19
BWH is clinically affiliated with South Shore Hospital and Cape Cod
Healthcare, and MGH with Emerson Hospital and Hallmark. Both BWH and MGH have clinical
affiliations with Dana Farber Cancer Institute and are the preferred tertiary/quaternary providers
in Steward Health Care System’s limited network products through Fallon Community Health
Plan and THP. Through NSMC, Partners owns and operates Salem Hospital (NSMC-Salem) and
Union Hospital (NSMC-Union) in northeastern Massachusetts, located six miles apart.
In addition to its general acute care hospitals, Partners owns a psychiatric hospital
(McLean Hospital), a network of rehabilitation facilities (Spaulding Rehabilitation Network),
and a home care agency (Partners HealthCare at Home). Partners’ managed care network, PCHI,
negotiates contracts on behalf of approximately 6,200 primary care physicians (PCPs) and
specialists. PCHI is organized into Regional Service Organizations (RSOs), which vary in size
and structure. 20
Many of Partners’ community hospitals have affiliated physician groups. For
example, the physicians affiliated with NSMC are organized into North Shore Health System
17
See supra note 5 (reporting filing dates for the parties’ notices of material change). 18
As referenced throughout this Report, Partners is seeking to acquire three more hospitals, South Shore Hospital
and the two Hallmark Hospitals. 19
See PARTNERS HEALTHCARE SYSTEM, Series L Bond Statement at A-3 (Dec. 9, 2011), available at
http://emma.msrb.org/ER539808-ER417769-ER819686.pdf. 20
PCHI’s larger RSOs are tied to its AMCs. PCHI includes approximately 1,300 PCPs, 1,700 community-based
specialists, and 3,560 academically-based specialists. Id. at A-5; Partners Community Healthcare, Inc., PARTNERS
HEALTHCARE, http://www.partners.org/services/general/patient-care/community-based-programs/partners-
community-healthcare-inc.aspx (last visited Apr. 30, 2014).

8
(NSHS) Physician Hospital Organization (PHO), which includes both physicians who are
directly employed by Partners, as well as those who are not, but who are affiliated with Partners
for contracting and clinical purposes.21
The NSHS physicians receive varying rates depending on
whether they are employed or affiliated.22
Partners has continued to grow in recent years. In October 2012, Partners acquired
Neighborhood Health Plan, a Massachusetts payer with over 260,000 members. In July 2013,
Partners acquired 140-bed Cooley Dickinson Hospital in Northampton, Massachusetts. Partners
has also proposed acquiring South Shore Hospital and Harbor Medical Associates, the topic of
the HPC’s first Cost and Market Impact Review (CMIR), and upon which the HPC released a
Final Report in February 2014.23
On June 24, 2014, the AGO, Partners, South Shore Health and Educational Corporation,
and Hallmark Health Corporation filed a proposed consent judgment (AGO Settlement) in
Suffolk Superior Court that would settle an extensive law enforcement investigation into
Partners’ market conduct and plans to acquire Hallmark, South Shore Hospital, and their related
physicians.24
The AGO Settlement includes provisions that:
Allow payers to contract with Partners providers on a component basis. AMCs and
community hospitals would remain separate components for 10 years. South Shore
Hospital and Hallmark would remain separate components for seven years and then
become part of the community hospital group;
Prohibit joint contracting by Partners on behalf of non-owned physician group affiliates
outside of its physician hospital organizations for 10 years;
Prohibit Partners’ system-wide price growth and the price growth of South Shore
providers from exceeding the rate of general inflation for 6.5 years;
For the next three years, limit the growth of Partners’ physician network to 2012 levels
(approximately 550 more physicians than current levels), and for two additional years,
limit physician network growth to two percent each year; and
21
NSHS is comprised of approximately 600 physicians, more than one-third of which are employed by North Shore
Physician Group (NSPG), the employed subgroup of NSHS. About NSMC, NORTH SHORE MED. CTR.,
http://nsmc.partners.org/about_nsmc (last visited June 30, 2014); NORTH SHORE PHYSICIANS GRP.,
http://www.northshorephysicians.org/ (last visited June 30, 2014). 22
See note 83 infra regarding the difference between Partners’ rates for its employed or “integrated” physicians and
its affiliated physicians. 23
MASS. HEALTH POLICY COMM’N, REVIEW OF PARTNERS HEALTHCARE SYSTEM’S PROPOSED ACQUISITIONS OF
SOUTH SHORE HOSPITAL (HPC-CMIR-2013-1) AND HARBOR MEDICAL ASSOCIATES (HPC-CMIR-2013-2),
PURSUANT TO M.G.L. C. 6D, § 13, FINAL REPORT (Feb. 19, 2014), available at
http://www.mass.gov/anf/docs/hpc/20140219-final-cmir-report-phs-ssh-hmc.pdf [hereinafter PHS-SSH-HARBOR
FINAL CMIR REPORT]. The HPC released its Preliminary Report of the CMIR on December 18, 2013. MASS.
HEALTH POLICY COMM’N, REVIEW OF PARTNERS HEALTHCARE SYSTEM’S PROPOSED ACQUISITIONS OF SOUTH
SHORE HOSPITAL (HPC-CMIR-2013-1) AND HARBOR MEDICAL ASSOCIATES (HPC-CMIR-2013-2), PURSUANT TO
M.G.L. C. 6D, § 13, PRELIMINARY REPORT (Dec. 18, 2013), available at http://www.mass.gov/anf/docs/hpc/hpc-
preliminary-review-of-phs-ssh-harbor-12-18-2013.pdf. 24
See supra note 10 (citing the Massachusetts Attorney General’s press release regarding the proposed consent
judgment with Partners).
9
For the next seven years, prohibits Partners from acquiring hospitals in eastern
Massachusetts other than South Shore Hospital and Hallmark without AGO approval,
with Emerson Hospital, in light of its existing joint contracting relationship with Partners,
excepted from this AGO discretionary approval.25
B. HALLMARK HEALTH SYSTEM
Founded in 1997, Hallmark Health System (Hallmark) serves residents in northern
suburban Boston, including Malden, Medford, Melrose and Wakefield.26
Hallmark is a non-
profit integrated health system that operates two acute care hospitals under a single license,
Melrose-Wakefield Hospital (Hallmark-MWH) in Melrose and Lawrence Memorial Hospital
(Hallmark-LMH) in Medford.27
Located five miles apart, Hallmark-MWH and Hallmark-LMH
have 174 and 132 licensed acute care beds, respectively. Both hospitals offer general acute care
inpatient and outpatient services, including emergency and psychiatric care.28
Hallmark has
clinical affiliations with MGH for cardiology and Tufts Medical Center (Tufts MC) for
neonatology. Hallmark also owns a number of outpatient facilities in northeastern
Massachusetts, including a Stoneham outpatient campus that is the site of the Hallmark Health
System Hematology and Oncology Center as well as the CHEM Centers for MRI and Radiation
Oncology.29
Hallmark Health Physician Hospital Organization (HHPHO) is the managed care
contracting organization for Hallmark’s hospitals and physicians, including Hallmark’s
employed physicians in Hallmark Health Medical Associates, Inc. (HHMA).30
HHPHO has
approximately 400 participating physicians, more than 50 of whom are PCPs.31
HHPHO
25
Id. 26
Hallmark Health System, Inc. is one of several entities owned by Hallmark Health Corporation (HHC). Partners
and HHC executed an Affiliation Agreement on January 31, 2014, pursuant to which Partners will acquire HHC and
all of its affiliates. See infra Section II.C for details regarding the transaction. 27
HALLMARK HEALTH CORP., NOTICE OF MATERIAL CHANGE TO THE HEALTH POLICY COMM’N (Nov. 12, 2013), AS
REQUIRED UNDER MASS. GEN. LAWS ch. 6D § 13 (2012) [hereinafter HALLMARK NOTICE OF MATERIAL CHANGE]. 28
Hallmark-MWH and Hallmark-LMH have 24 and 34 licensed inpatient psychiatric beds, respectively.
Application by Hallmark Health System, Inc. for Determination of Need under 105 C.M.R. 100.600-603 for Change
of Ownership of Hallmark Health System, Section III (Apr. 4, 2014) [hereinafter Hallmark Determination of Need]. 29
The Stoneham outpatient campus also includes the Comprehensive Breast Center and Montvale PET/CT.
Hallmark also owns Hallmark Health Medical Center (Reading), Hallmark Health Visiting Nurse Association
(HHVNA) and Hospice, Inc. (Malden), Lawrence Memorial/Regis College Nursing Radiography Programs
(Medford), Malden Family Health Center (Malden), and the Dutton Center/Adult Supportive Day Care (Wakefield).
Hospitals & Health Centers, HALLMARK HEALTH SYS., http://www.hallmarkhealth.org/Hospitals-Health-Centers/
(last visited June 24, 2014). 30
HHMA employs approximately 30 PCPs and has 23 practice locations in the following nine cities and towns north
of Boston: Malden, Medford, Melrose, Reading, Revere, Saugus, Somerville, Stoneham, and Winthrop. Affiliation
Agreement, supra note 7, at Exh. 4.4.1-B; Locations, HALLMARK HEALTH MED. ASSOCS., http://hhma.org/locations/
(last visited May 1, 2014). 31
Find a Provider, HALLMARK HEALTH SYS., http://physicians.hallmarkhealth.org/ (last visited June 30, 2014);
Affiliation Agreement, supra note 7, at Exh. 4.4.1-B.
10
currently contracts through PCHI for its hospital and physician HMO, POS, and PPO rates for
most of the major payers.32
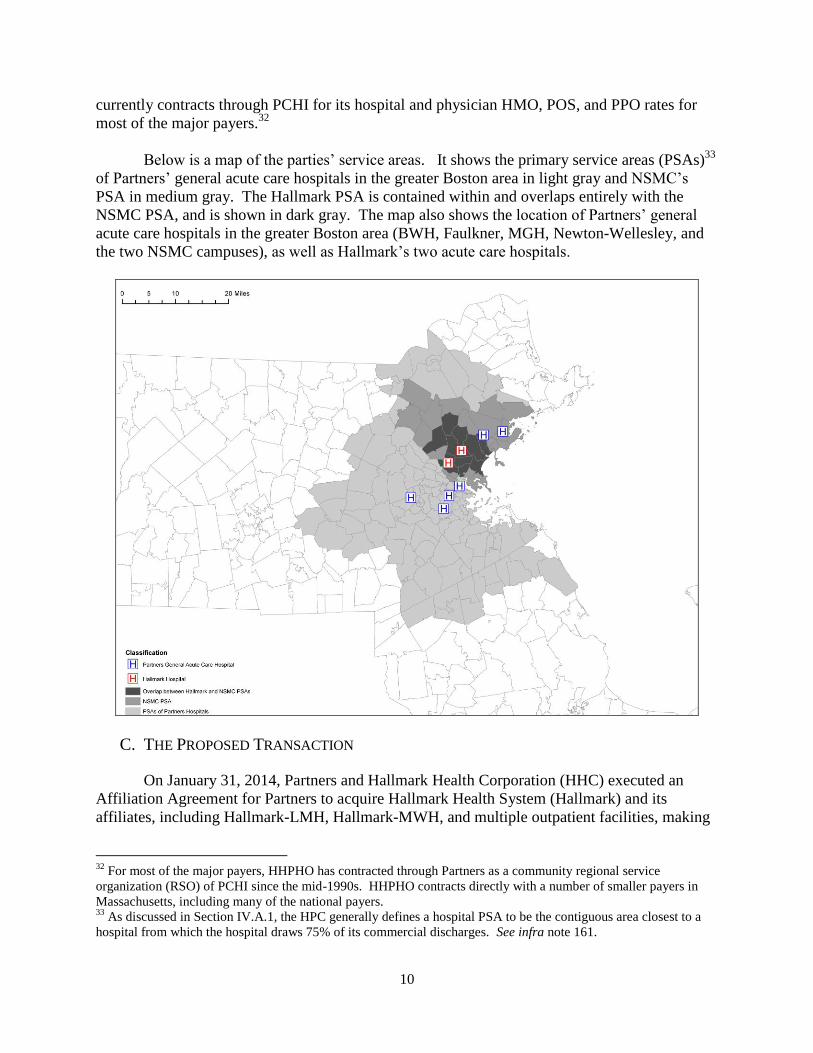
Below is a map of the parties’ service areas. It shows the primary service areas (PSAs)33
of Partners’ general acute care hospitals in the greater Boston area in light gray and NSMC’s
PSA in medium gray. The Hallmark PSA is contained within and overlaps entirely with the
NSMC PSA, and is shown in dark gray. The map also shows the location of Partners’ general
acute care hospitals in the greater Boston area (BWH, Faulkner, MGH, Newton-Wellesley, and
the two NSMC campuses), as well as Hallmark’s two acute care hospitals.
C. THE PROPOSED TRANSACTION
On January 31, 2014, Partners and Hallmark Health Corporation (HHC) executed an
Affiliation Agreement for Partners to acquire Hallmark Health System (Hallmark) and its
affiliates, including Hallmark-LMH, Hallmark-MWH, and multiple outpatient facilities, making
32
For most of the major payers, HHPHO has contracted through Partners as a community regional service
organization (RSO) of PCHI since the mid-1990s. HHPHO contracts directly with a number of smaller payers in
Massachusetts, including many of the national payers. 33
As discussed in Section IV.A.1, the HPC generally defines a hospital PSA to be the contiguous area closest to a
hospital from which the hospital draws 75% of its commercial discharges. See infra note 161.

11
Hallmark a fully integrated, community-based member of the Partners system.34
The transaction
builds on an eighteen-year clinical and contracting relationship between the parties.35
The
parties state that they are committed to “accepting responsibility (and financial risk) for
controlling the total medical expenses . . . for patients cared for by their primary care physicians
in the . . . communities served by [the parties].”36
In order to achieve this objective, the parties
seek to implement a “robust population health management (PHM) model” in their joint service
area,37
which they state will require relocating and rationalizing facilities and service lines,
expanding and more fully integrating their primary care networks, and investing in integrated
information systems.
To accomplish these goals, the Affiliation Agreement sets out three principal initiatives
that would be implemented over five years at a cost of approximately $595 million at the two
Hallmark hospitals, the two North Shore Medical Center (NSMC) hospitals, and Hallmark’s
outpatient cancer care facilities in Stoneham.38
The first initiative is the Program and Facilities
Rationalization Initiative (Rationalization Initiative), which involves rationalizing services at the
parties’ four acute care hospitals in the region39
and decreasing the net number of
medical/surgical beds at these facilities by up to 110. Under this initiative, two hospitals would
continue to provide general acute care services, while the other two hospitals would be
repurposed:
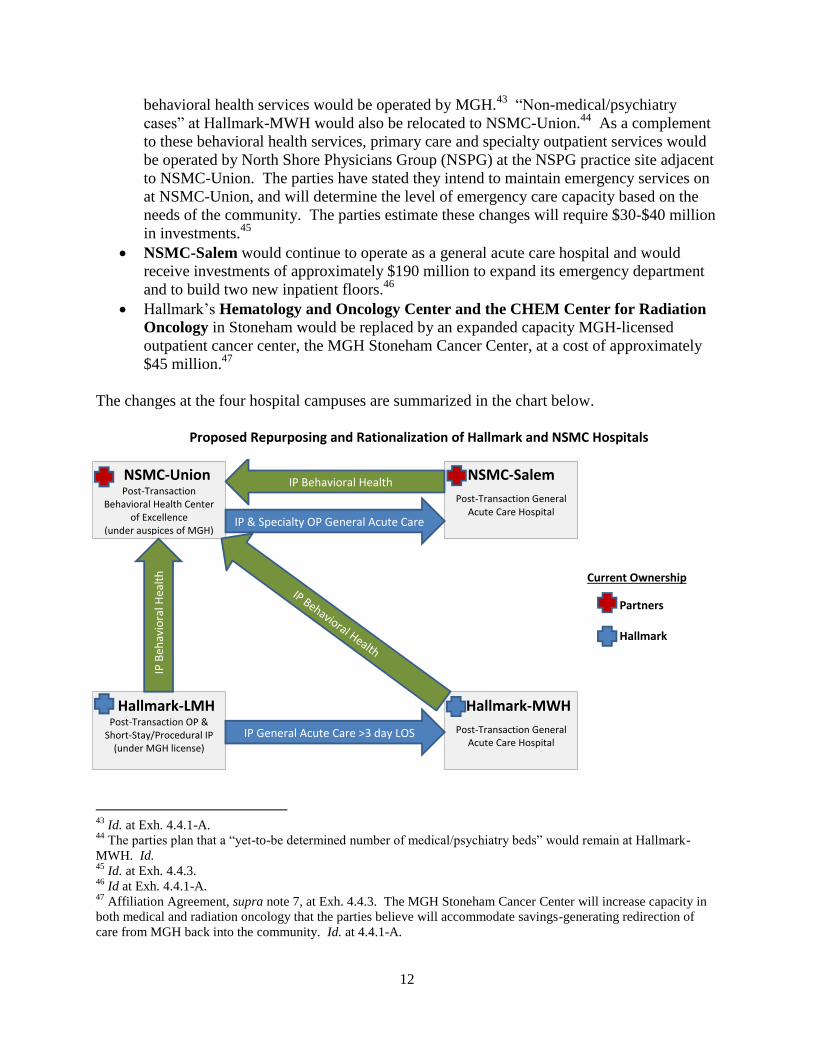
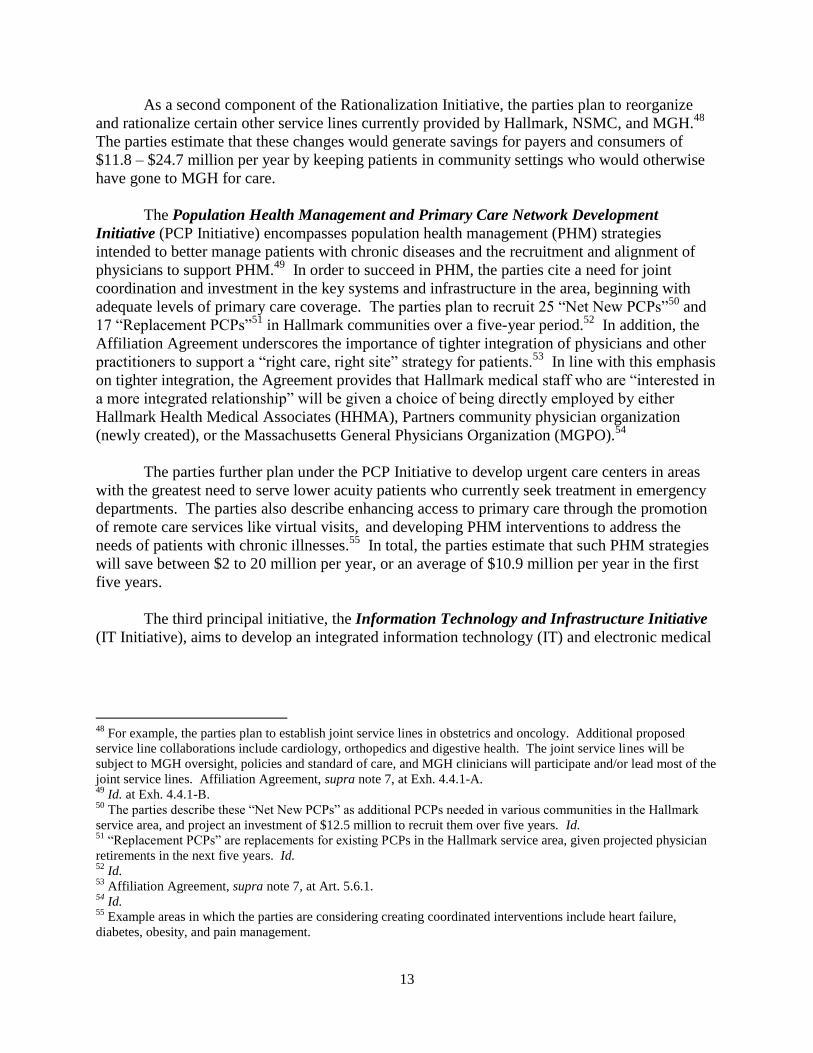
Hallmark-LMH would become a 30-40 bed facility for ambulatory care and “short-stay”
inpatient care lasting three days or fewer, operated under the MGH license.40
Hallmark-
LMH would have an urgent care center, certain expanded outpatient services,41
and,
during at least the transition period of Hallmark-LMH’s conversion (2-3 years), the
parties have committed to keeping the emergency department open. The parties anticipate
spending up to $107 million on this conversion.42
Hallmark-MWH would remain an acute care hospital under the Hallmark license. The
hospital would receive an estimated $152 million worth of substantial renovation,
including expansion of capacity.
NSMC-Union would host “Centers of Excellence” for primary care and behavioral
health. All of the behavioral health beds from Hallmark-LMH and NSMC-Salem would
be consolidated and relocated to NSMC-Union, where psychiatry, substance abuse, and
34
See supra note 5 (reporting filing dates for the parties’ notices of material change). 35
See supra note 32 and accompanying text (noting the history of HHPHO’s joint contracting relationship with
PCHI). 36
Affiliation Agreement, supra note 7, at Art. 1. 37
See supra note 8 (describing the parties’ joint service area). 38
Affiliation Agreement, supra note 7, at Exh. 4.4.3. Partners and Hallmark will make capital contributions of
approximately $245 and $124 million, respectively, equaling $370 million. In addition, the parties estimate capital
investments by Partners of $190 million at NSMC-Salem and $30-$40 million for the NSMC-Union reorganization.
Id. at Exh. 4.4.1-A, Exh. 4.4.3. 39
Id. at Exh. 4.4.1-A. 40
The parties identify endoscopy and short stay operations as examples of short stay care. Id. 41
For example, the parties propose expanding cardiology, gastroenterology, chronic disease management, and spine
services. 42
Affiliation Agreement, supra note 7, at Exh. 4.4.3.
12
behavioral health services would be operated by MGH.43
“Non-medical/psychiatry
cases” at Hallmark-MWH would also be relocated to NSMC-Union.44
As a complement
to these behavioral health services, primary care and specialty outpatient services would
be operated by North Shore Physicians Group (NSPG) at the NSPG practice site adjacent
to NSMC-Union. The parties have stated they intend to maintain emergency services on
at NSMC-Union, and will determine the level of emergency care capacity based on the
needs of the community. The parties estimate these changes will require $30-$40 million
in investments.45
NSMC-Salem would continue to operate as a general acute care hospital and would
receive investments of approximately $190 million to expand its emergency department
and to build two new inpatient floors.46
Hallmark’s Hematology and Oncology Center and the CHEM Center for Radiation
Oncology in Stoneham would be replaced by an expanded capacity MGH-licensed
outpatient cancer center, the MGH Stoneham Cancer Center, at a cost of approximately
$45 million.47
The changes at the four hospital campuses are summarized in the chart below.
Proposed Repurposing and Rationalization of Hallmark and NSMC Hospitals
43
Id. at Exh. 4.4.1-A. 44
The parties plan that a “yet-to-be determined number of medical/psychiatry beds” would remain at Hallmark-
MWH. Id. 45
Id. at Exh. 4.4.3. 46
Id at Exh. 4.4.1-A. 47
Affiliation Agreement, supra note 7, at Exh. 4.4.3. The MGH Stoneham Cancer Center will increase capacity in
both medical and radiation oncology that the parties believe will accommodate savings-generating redirection of
care from MGH back into the community. Id. at 4.4.1-A.
NSMC-Salem
Post-Transaction General Acute Care Hospital
NSMC-Union
Post-Transaction Behavioral Health Center
of Excellence (under auspices of MGH)
Hallmark-LMH
Post-Transaction OP & Short-Stay/Procedural IP
(under MGH license)
Hallmark-MWH
Post-Transaction General Acute Care Hospital
IP Behavioral Health
IP & Specialty OP General Acute Care
IP General Acute Care >3 day LOS
IP B
ehav
iora
l Hea
lth
13
As a second component of the Rationalization Initiative, the parties plan to reorganize
and rationalize certain other service lines currently provided by Hallmark, NSMC, and MGH.48
The parties estimate that these changes would generate savings for payers and consumers of
$11.8 – $24.7 million per year by keeping patients in community settings who would otherwise
have gone to MGH for care.
The Population Health Management and Primary Care Network Development
Initiative (PCP Initiative) encompasses population health management (PHM) strategies
intended to better manage patients with chronic diseases and the recruitment and alignment of
physicians to support PHM.49
In order to succeed in PHM, the parties cite a need for joint
coordination and investment in the key systems and infrastructure in the area, beginning with
adequate levels of primary care coverage. The parties plan to recruit 25 “Net New PCPs”50
and
17 “Replacement PCPs”51
in Hallmark communities over a five-year period.52
In addition, the
Affiliation Agreement underscores the importance of tighter integration of physicians and other
practitioners to support a “right care, right site” strategy for patients.53
In line with this emphasis
on tighter integration, the Agreement provides that Hallmark medical staff who are “interested in
a more integrated relationship” will be given a choice of being directly employed by either
Hallmark Health Medical Associates (HHMA), Partners community physician organization
(newly created), or the Massachusetts General Physicians Organization (MGPO).54
The parties further plan under the PCP Initiative to develop urgent care centers in areas
with the greatest need to serve lower acuity patients who currently seek treatment in emergency
departments. The parties also describe enhancing access to primary care through the promotion
of remote care services like virtual visits, and developing PHM interventions to address the
needs of patients with chronic illnesses.55
In total, the parties estimate that such PHM strategies
will save between $2 to 20 million per year, or an average of $10.9 million per year in the first
five years.
The third principal initiative, the Information Technology and Infrastructure Initiative
(IT Initiative), aims to develop an integrated information technology (IT) and electronic medical
48
For example, the parties plan to establish joint service lines in obstetrics and oncology. Additional proposed
service line collaborations include cardiology, orthopedics and digestive health. The joint service lines will be
subject to MGH oversight, policies and standard of care, and MGH clinicians will participate and/or lead most of the
joint service lines. Affiliation Agreement, supra note 7, at Exh. 4.4.1-A. 49
Id. at Exh. 4.4.1-B. 50
The parties describe these “Net New PCPs” as additional PCPs needed in various communities in the Hallmark
service area, and project an investment of $12.5 million to recruit them over five years. Id. 51
“Replacement PCPs” are replacements for existing PCPs in the Hallmark service area, given projected physician
retirements in the next five years. Id. 52
Id. 53
Affiliation Agreement, supra note 7, at Art. 5.6.1. 54
Id. 55
Example areas in which the parties are considering creating coordinated interventions include heart failure,
diabetes, obesity, and pain management.
14
record (EMR) infrastructure to facilitate coordination among providers.56
The parties’ estimated
capital investments and savings are summarized in the table below.
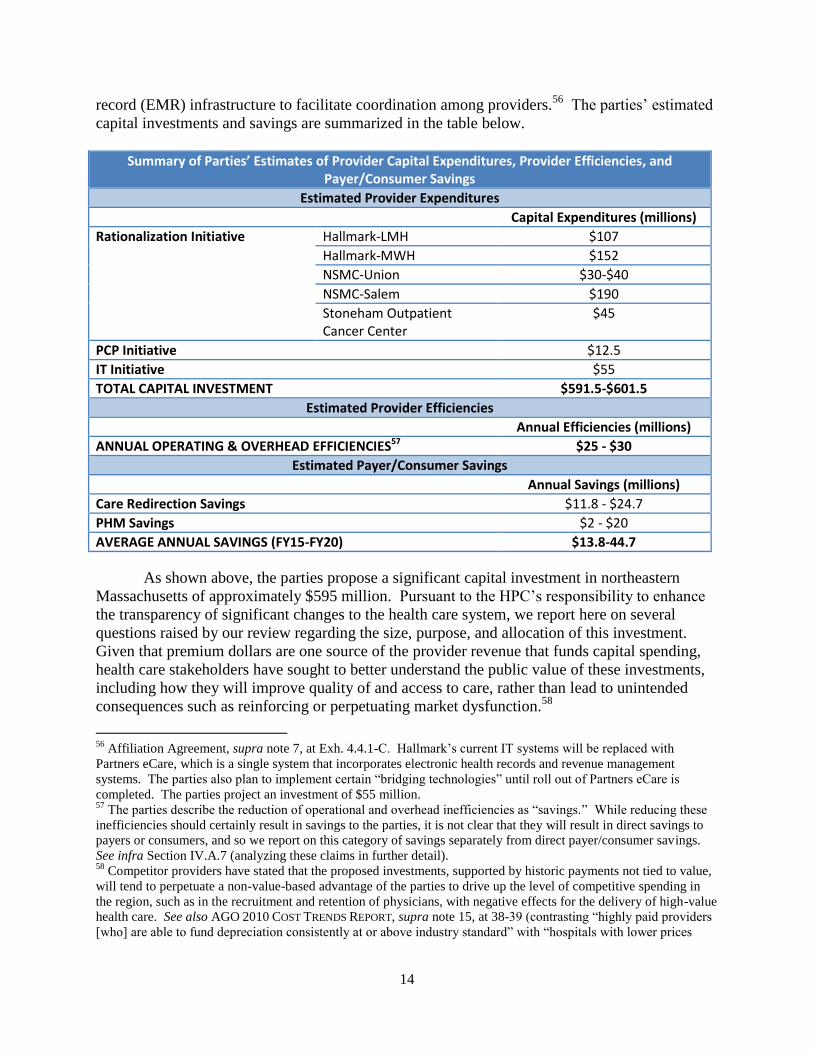
S y of ’ Estimates of Provider Capital Expenditures, Provider Efficiencies, and Payer/Consumer Savings
Estimated Provider Expenditures
Capital Expenditures (millions)
Rationalization Initiative Hallmark-LMH $107
Hallmark-MWH $152
NSMC-Union $30-$40
NSMC-Salem $190
Stoneham Outpatient Cancer Center
$45
PCP Initiative $12.5
IT Initiative $55
TOTAL CAPITAL INVESTMENT $591.5-$601.5
Estimated Provider Efficiencies
Annual Efficiencies (millions)
ANNUAL OPERATING & OVERHEAD EFFICIENCIES57 $25 - $30
Estimated Payer/Consumer Savings
Annual Savings (millions)
Care Redirection Savings $11.8 - $24.7
PHM Savings $2 - $20
AVERAGE ANNUAL SAVINGS (FY15-FY20) $13.8-44.7
As shown above, the parties propose a significant capital investment in northeastern
Massachusetts of approximately $595 million. Pursuant to the HPC’s responsibility to enhance
the transparency of significant changes to the health care system, we report here on several
questions raised by our review regarding the size, purpose, and allocation of this investment.
Given that premium dollars are one source of the provider revenue that funds capital spending,
health care stakeholders have sought to better understand the public value of these investments,
including how they will improve quality of and access to care, rather than lead to unintended
consequences such as reinforcing or perpetuating market dysfunction.58
56
Affiliation Agreement, supra note 7, at Exh. 4.4.1-C. Hallmark’s current IT systems will be replaced with
Partners eCare, which is a single system that incorporates electronic health records and revenue management
systems. The parties also plan to implement certain “bridging technologies” until roll out of Partners eCare is
completed. The parties project an investment of $55 million. 57
The parties describe the reduction of operational and overhead inefficiencies as “savings.” While reducing these
inefficiencies should certainly result in savings to the parties, it is not clear that they will result in direct savings to
payers or consumers, and so we report on this category of savings separately from direct payer/consumer savings.
See infra Section IV.A.7 (analyzing these claims in further detail). 58
Competitor providers have stated that the proposed investments, supported by historic payments not tied to value,
will tend to perpetuate a non-value-based advantage of the parties to drive up the level of competitive spending in
the region, such as in the recruitment and retention of physicians, with negative effects for the delivery of high-value
health care. See also AGO 2010 COST TRENDS REPORT, supra note 15, at 38-39 (contrasting “highly paid providers
[who] are able to fund depreciation consistently at or above industry standard” with “hospitals with lower prices
15
To better understand how the proposed extensive service reconfigurations and
infrastructure changes will improve quality of or access to care, it would be helpful to have
further detail and specific evidence regarding how the parties’ prioritization of expenditures
tracks to community need. For example, it may be worth further exploring why the NSMC-
Union campus, which is undergoing perhaps the most significant transformation in becoming a
specialized behavioral health center of excellence, is anticipated to receive the smallest
investment of the four hospital campuses, especially as compared to Hallmark-LMH, which is
receiving a substantially larger investment despite the planned elimination of a majority of its
beds. Similarly, it would be helpful to better understand, especially in light of Partners’
longstanding and commendable commitment to behavioral health, why the parties have not yet
committed any minimum expenditures for certain urgently needed services related to the
transaction, such as outpatient behavioral health,59
but have committed significant portions of the
$595 million to expanding certain higher-margin specialty services for which we have not
received similar evidence of unmet need.60,61
We invite the parties to provide additional detail
on these questions in their Written Response to this report.
[who] are unable to put comparable resources toward building maintenance or equipment acquisition,” resulting “in
a loss of volume to better capitalized, more expensive hospitals”). 59
Throughout this report, we include intensive outpatient and partial hospitalization services among “outpatient”
behavioral health services, recognizing that behavioral health treatment occurs in a variety of settings that range in
intensity and duration. Hallmark currently provides some such intensive outpatient services. Intensive Outpatient
Program at Community Counseling Services, HALLMARK HEALTH SYS., http://www.hallmarkhealth.org/Behavioral-
Health/Psychiatric-Services/Intensive-Outpatient-Program.html (last visited June 27, 2014). Intensive outpatient
and partial hospitalization services generally involve regular individual and/or group counseling services during the
day, before and after work or school, in the evenings, or on weekends to enable patients to apply treatment skills in
real-world environments. These programs often include medical and psychiatric consultation,
psychopharmacological consultation, medication management, and 24-hour crisis services. See D. Mee-Lee & D.R.
Gastfriend, Patient Placement Criteria, in TEXTBOOK OF SUBSTANCE ABUSE TREATMENT Ch. 6, 82 (Galanter &
Kleber eds., 4th ed. 2008); CENTER FOR SUBSTANCE ABUSE TREATMENT, SUBSTANCE ABUSE: CLINICAL ISSUES IN
INTENSIVE OUTPATIENT TREATMENT Ch. 4 (2006), available at http://www.ncbi.nlm.nih.gov/books/NBK64094/. 60
The parties’ planned investments mirror a national trend of expanded capacity for specific specialty services such
as cardiology, cancer, orthopedics, women’s and children’s services, and GI endoscopy. According to a survey of
senior hospital executives across the country, one of the factors motivating this trend is service line profitability.
For more on expansion of specialty service lines and the underlying factors, see Robert A. Berenson et al., Specialty-
Service Lines: Salvos in The New Medical Arms Race, 25 HEALTH AFFAIRS, w337, (2006), available at
http://content.healthaffairs.org/content/25/5/w337. 61
Given the different margins associated with different service lines and payer populations, providers often rely on a
balanced mix of services and payers to maintain financial viability and adequate access to all services. Thus, if the
proposed investments drive changes in the service mix or payer mix of the parties or other area providers, these
changes could have significant implications for how our health care system finances adequate access to all needed
services, including low-margin services, for all populations.
16
III. ANALYSIS OF PARTIES’ BASELINE PERFORMANCE
(2010-2012)
To analyze the impact of a proposed transaction on costs, quality, and access, it is
important to understand the parties’ baseline performance in these areas, prior to the transaction.
Part III examines the recent performances of Partners and Hallmark in each of these areas.
A. COST PROFILE
The law governing cost and market impact reviews directs the HPC to examine different
measures of the parties’ cost and financial performance, including their size, prices, health status
adjusted TME, and market share. The HPC examined these measures over time and compared
them to other providers to establish the parties’ baseline performance leading up to the proposed
transaction. In Part IV, we will combine the parties’ current performance with details of the
transactions and the parties’ goals and plans to project the likely impacts of the transaction on
health care costs.
Measures of financial condition and market share indicate the relative strength of a
provider compared to competitors. Comparisons of provider health status adjusted TME and of
relative prices (the relative amounts that payers pay providers for comparable services) show
differences in provider efficiency and costs, both between the parties and compared to other area
providers. In examining these elements of the parties’ cost profile, the HPC found:
Partners is in strong financial condition; Hallmark’s financial position is positive and
improving.
Partners has the highest share of inpatient and primary care services in Hallmark’s and
NSMC’s service areas.
Partners’ hospitals receive higher prices than Hallmark and other area hospitals.
Partners’ physician groups (excluding Hallmark) generally receive higher prices than
Hallmark physicians and other area physician groups.
Partners’ physician groups (excluding Hallmark) generally have higher health status
adjusted TME than Hallmark and other area physician groups.
1. Partners is in Strong Financial Condition; Hallmark’s Financial Position is Positive
and Improving.
The HPC reviewed financial statements from 2009 through 2012 for Partners and
Hallmark, which showed that Partners is in strong financial condition, while Hallmark’s financial
position is positive and improving. Over the last four years, Partners’ total operating revenue
increased by nearly 20% from $7.5 billion in 2009 to nearly $9 billion in 2012. Over this same
period, Partners’ total net assets grew by 6.2% (over $300 million). The following table shows
key financial metrics for Partners compared to the next five largest health care systems in
Massachusetts, as measured by net patient service revenue (NPSR). As shown below, Partners’
total net assets are more than double the combined assets of the next five largest systems in
17
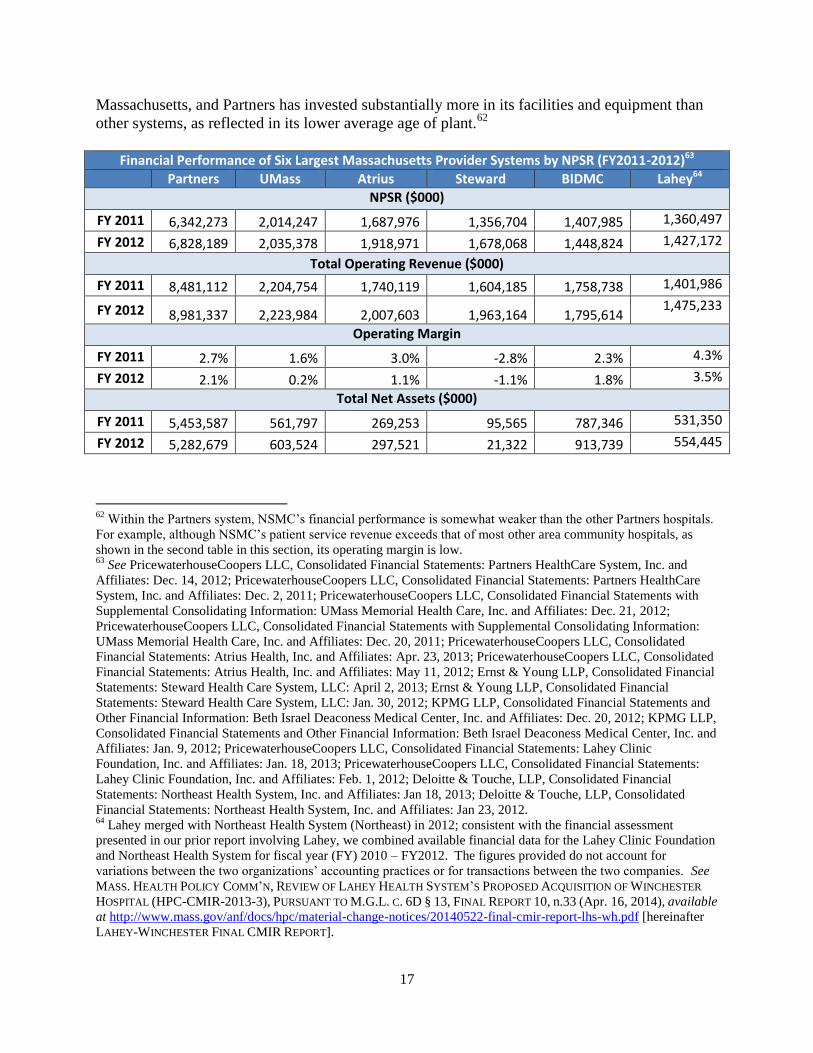
Massachusetts, and Partners has invested substantially more in its facilities and equipment than
other systems, as reflected in its lower average age of plant.62
Financial Performance of Six Largest Massachusetts Provider Systems by NPSR (FY2011-2012)63
Partners UMass Atrius Steward BIDMC Lahey64
NPSR ($000)
FY 2011 6,342,273 2,014,247 1,687,976 1,356,704 1,407,985 1,360,497
FY 2012 6,828,189 2,035,378 1,918,971 1,678,068 1,448,824 1,427,172
Total Operating Revenue ($000)
FY 2011 8,481,112 2,204,754 1,740,119 1,604,185 1,758,738 1,401,986
FY 2012 8,981,337 2,223,984 2,007,603 1,963,164 1,795,614 1,475,233
Operating Margin
FY 2011 2.7% 1.6% 3.0% -2.8% 2.3% 4.3%
FY 2012 2.1% 0.2% 1.1% -1.1% 1.8% 3.5%
Total Net Assets ($000)
FY 2011 5,453,587 561,797 269,253 95,565 787,346 531,350
FY 2012 5,282,679 603,524 297,521 21,322 913,739 554,445
62
Within the Partners system, NSMC’s financial performance is somewhat weaker than the other Partners hospitals.
For example, although NSMC’s patient service revenue exceeds that of most other area community hospitals, as
shown in the second table in this section, its operating margin is low. 63
See PricewaterhouseCoopers LLC, Consolidated Financial Statements: Partners HealthCare System, Inc. and
Affiliates: Dec. 14, 2012; PricewaterhouseCoopers LLC, Consolidated Financial Statements: Partners HealthCare
System, Inc. and Affiliates: Dec. 2, 2011; PricewaterhouseCoopers LLC, Consolidated Financial Statements with
Supplemental Consolidating Information: UMass Memorial Health Care, Inc. and Affiliates: Dec. 21, 2012;
PricewaterhouseCoopers LLC, Consolidated Financial Statements with Supplemental Consolidating Information:
UMass Memorial Health Care, Inc. and Affiliates: Dec. 20, 2011; PricewaterhouseCoopers LLC, Consolidated
Financial Statements: Atrius Health, Inc. and Affiliates: Apr. 23, 2013; PricewaterhouseCoopers LLC, Consolidated
Financial Statements: Atrius Health, Inc. and Affiliates: May 11, 2012; Ernst & Young LLP, Consolidated Financial
Statements: Steward Health Care System, LLC: April 2, 2013; Ernst & Young LLP, Consolidated Financial
Statements: Steward Health Care System, LLC: Jan. 30, 2012; KPMG LLP, Consolidated Financial Statements and
Other Financial Information: Beth Israel Deaconess Medical Center, Inc. and Affiliates: Dec. 20, 2012; KPMG LLP,
Consolidated Financial Statements and Other Financial Information: Beth Israel Deaconess Medical Center, Inc. and
Affiliates: Jan. 9, 2012; PricewaterhouseCoopers LLC, Consolidated Financial Statements: Lahey Clinic
Foundation, Inc. and Affiliates: Jan. 18, 2013; PricewaterhouseCoopers LLC, Consolidated Financial Statements:
Lahey Clinic Foundation, Inc. and Affiliates: Feb. 1, 2012; Deloitte & Touche, LLP, Consolidated Financial
Statements: Northeast Health System, Inc. and Affiliates: Jan 18, 2013; Deloitte & Touche, LLP, Consolidated
Financial Statements: Northeast Health System, Inc. and Affiliates: Jan 23, 2012. 64
Lahey merged with Northeast Health System (Northeast) in 2012; consistent with the financial assessment
presented in our prior report involving Lahey, we combined available financial data for the Lahey Clinic Foundation
and Northeast Health System for fiscal year (FY) 2010 – FY2012. The figures provided do not account for
variations between the two organizations’ accounting practices or for transactions between the two companies. See
MASS. HEALTH POLICY COMM’N, REVIEW OF LAHEY HEALTH SYSTEM’S PROPOSED ACQUISITION OF WINCHESTER
HOSPITAL (HPC-CMIR-2013-3), PURSUANT TO M.G.L. C. 6D § 13, FINAL REPORT 10, n.33 (Apr. 16, 2014), available
at http://www.mass.gov/anf/docs/hpc/material-change-notices/20140522-final-cmir-report-lhs-wh.pdf [hereinafter
LAHEY-WINCHESTER FINAL CMIR REPORT].
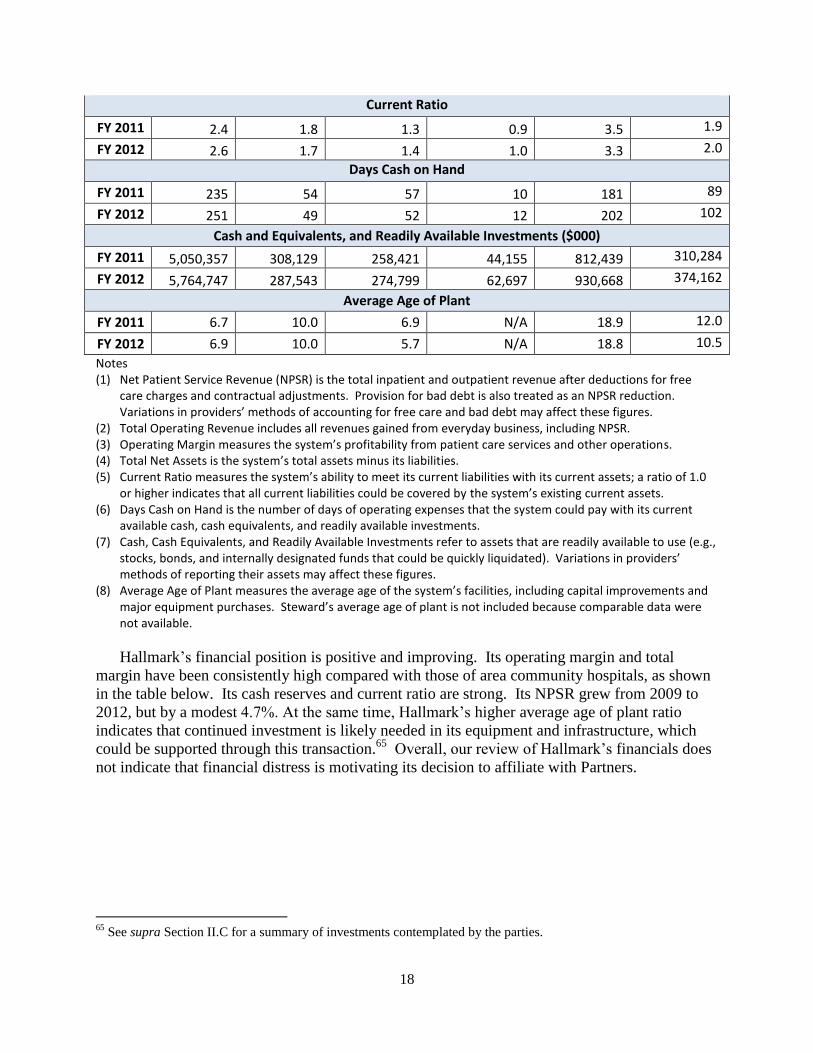
18
Current Ratio
FY 2011 2.4 1.8 1.3 0.9 3.5 1.9
FY 2012 2.6 1.7 1.4 1.0 3.3 2.0
Days Cash on Hand
FY 2011 235 54 57 10 181 89
FY 2012 251 49 52 12 202 102
Cash and Equivalents, and Readily Available Investments ($000)
FY 2011 5,050,357 308,129 258,421 44,155 812,439 310,284
FY 2012 5,764,747 287,543 274,799 62,697 930,668 374,162
Average Age of Plant
FY 2011 6.7 10.0 6.9 N/A 18.9 12.0
FY 2012 6.9 10.0 5.7 N/A 18.8 10.5
Notes (1) Net Patient Service Revenue (NPSR) is the total inpatient and outpatient revenue after deductions for free
care charges and contractual adjustments. Provision for bad debt is also treated as an NPSR reduction. Variations in providers’ methods of accounting for free care and bad debt may affect these figures.
(2) Total Operating Revenue includes all revenues gained from everyday business, including NPSR. (3) Operating Margin measures the system’s profitability from patient care services and other operations. (4) Total Net Assets is the system’s total assets minus its liabilities. (5) Current Ratio measures the system’s ability to meet its current liabilities with its current assets; a ratio of 1.0
or higher indicates that all current liabilities could be covered by the system’s existing current assets. (6) Days Cash on Hand is the number of days of operating expenses that the system could pay with its current
available cash, cash equivalents, and readily available investments. (7) Cash, Cash Equivalents, and Readily Available Investments refer to assets that are readily available to use (e.g.,
stocks, bonds, and internally designated funds that could be quickly liquidated). Variations in providers’ methods of reporting their assets may affect these figures.
(8) Average Age of Plant measures the average age of the system’s facilities, including capital improvements and major equipment purchases. Steward’s average age of plant is not included because comparable data were not available.
Hallmark’s financial position is positive and improving. Its operating margin and total
margin have been consistently high compared with those of area community hospitals, as shown
in the table below. Its cash reserves and current ratio are strong. Its NPSR grew from 2009 to
2012, but by a modest 4.7%. At the same time, Hallmark’s higher average age of plant ratio
indicates that continued investment is likely needed in its equipment and infrastructure, which
could be supported through this transaction.65
Overall, our review of Hallmark’s financials does
not indicate that financial distress is motivating its decision to affiliate with Partners.
65
See supra Section II.C for a summary of investments contemplated by the parties.

19
Financial Performance of Hallmark Compared to Area Community Hospitals (FY2011-2012)66
North Shore MC Mt. Auburn Hallmark Winchester CHA
NPSR ($000)
FY 2011 481,208 340,450 291,795 276,050 230,455
FY 2012 503,511 348,007 293,455 290,350 282,232
Total Operating Revenue ($000)
FY 2011 503,343 355,956 311,989 292,640 1,333,065
FY 2012 528,418 363,485 319,745 310,093 780,346
Operating Margin
FY 2011 -3.9% 3.9% 4.4% 1.9% 3.8%
FY 2012 -2.7% 3.1% 4.5% 2.0% -1.4%
Total Net Assets ($000)
FY 2011 2,097 219,316 152,672 173,063 264,526
FY 2012 -18,117 244,735 184,433 201,166 308,886
Current Ratio
FY 2011 1.00 4.38 3.01 1.27 1.61
FY 2012 1.15 4.70 3.52 1.35 2.24
Days Cash on Hand
FY 2011 33 125 230 145 88
FY 2012 52 146 259 170 121
Cash and Equivalents, and Readily Available Investments ($000)
FY 2011 44,734 111,699 176,196 109,483 302,663
FY 2012 74,256 134,299 203,391 134,722 253,402
Average Age of Plant
FY 2011 N/A 13.8 13.5 14.3 11.9
FY 2012 N/A 14.7 14.5 12.6 11.8
Notes: Because Partners’ financial statements do not disaggregate accumulated depreciation for each of its campuses, we are unable to calculate an age of plant figure specifically for NSMC.
66
KPMG LLP, Combined Financial Statements and Supplemental Schedules: Winchester Healthcare Management,
Inc. and Affiliates: Dec. 20, 2012; KPMG LLP, Combined Financial Statements and Supplemental Schedules:
Winchester Healthcare Management, Inc. and Affiliates: Dec. 22, 2011; Deloitte & Touche, LLP, Consolidated
Financial Statements: Hallmark Health Corp. and Affiliates: Dec. 20, 2013; Deloitte & Touche, LLP, Consolidated
Financial Statements: Hallmark Health Corp. and Affiliates: Jan. 18, 2012; KPMG LLP, Consolidated Financial
Statements and Other Financial Information: Mount Auburn Hospital and Subsidiary: Dec. 19, 2012; KPMG LLP,
Consolidated Financial Statements and Other Financial Information: Mount Auburn Hospital and Subsidiary: Jan. 9,
2012; PricewaterhouseCoopers LLC, Consolidated Financial Statements: Partners HealthCare System, Inc. and
Affiliates: Dec. 14, 2012; PricewaterhouseCoopers LLC, Consolidated Financial Statements: Partners HealthCare
System, Inc. and Affiliates: Dec. 2, 2011; PricewaterhouseCoopers LLC, Consolidated Financial Statements and
Supplemental Schedules: Emerson Health System, Inc. and Affiliates: Dec. 20, 2012; PricewaterhouseCoopers LLC,
Consolidated Financial Statements and Supplemental Schedules: Emerson Health System, Inc. and Affiliates: Dec.
20, 2011; PricewaterhouseCoopers LLC, Financial Statements and Supplemental Schedules: Cambridge Health
Alliance: Nov. 20, 2012; PricewaterhouseCoopers LLC, Financial Statements and Supplemental Schedules:
Cambridge Health Alliance: Nov. 14, 2011. The figures in this table reflect the performance of the entire corporate
entity, not just its constituent hospital(s).
20
2. Partners Has the Highest Share of Inpatient and PCP Services in Hallmark’s and
NSMC’s Service Areas.
A provider’s market share is its share of patient volume in a particular geographic area.
Here, we examined the parties’ market share for both inpatient services and PCP services in the
relevant hospital and primary care PSAs.67
a. Hospital Market Share
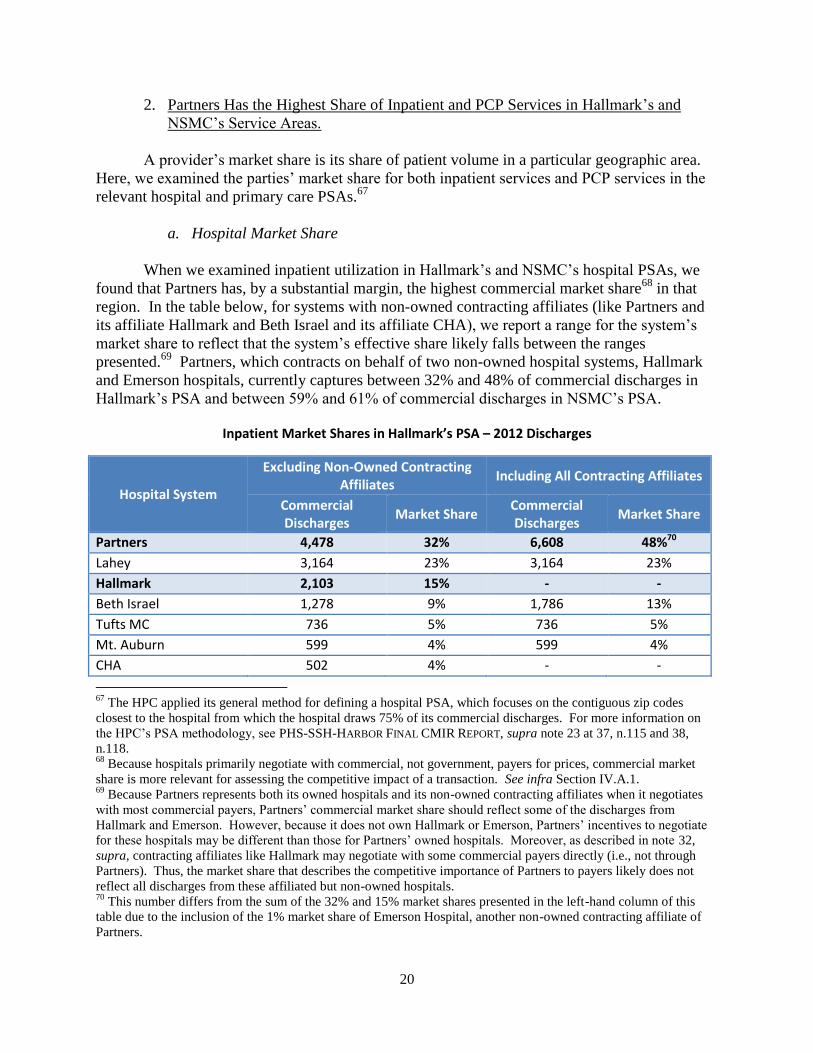
When we examined inpatient utilization in Hallmark’s and NSMC’s hospital PSAs, we
found that Partners has, by a substantial margin, the highest commercial market share68
in that
region. In the table below, for systems with non-owned contracting affiliates (like Partners and
its affiliate Hallmark and Beth Israel and its affiliate CHA), we report a range for the system’s
market share to reflect that the system’s effective share likely falls between the ranges
presented.69
Partners, which contracts on behalf of two non-owned hospital systems, Hallmark
and Emerson hospitals, currently captures between 32% and 48% of commercial discharges in
Hallmark’s PSA and between 59% and 61% of commercial discharges in NSMC’s PSA.
Inpatient Market S ’ SA – 2012 Discharges
Hospital System
Excluding Non-Owned Contracting Affiliates
Including All Contracting Affiliates
Commercial Discharges
Market Share Commercial Discharges
Market Share
Partners 4,478 32% 6,608 48%70
Lahey 3,164 23% 3,164 23%
Hallmark 2,103 15% - -
Beth Israel 1,278 9% 1,786 13%
Tufts MC 736 5% 736 5%
Mt. Auburn 599 4% 599 4%
CHA 502 4% - -
67
The HPC applied its general method for defining a hospital PSA, which focuses on the contiguous zip codes
closest to the hospital from which the hospital draws 75% of its commercial discharges. For more information on
the HPC’s PSA methodology, see PHS-SSH-HARBOR FINAL CMIR REPORT, supra note 23 at 37, n.115 and 38,
n.118. 68
Because hospitals primarily negotiate with commercial, not government, payers for prices, commercial market
share is more relevant for assessing the competitive impact of a transaction. See infra Section IV.A.1. 69
Because Partners represents both its owned hospitals and its non-owned contracting affiliates when it negotiates
with most commercial payers, Partners’ commercial market share should reflect some of the discharges from
Hallmark and Emerson. However, because it does not own Hallmark or Emerson, Partners’ incentives to negotiate
for these hospitals may be different than those for Partners’ owned hospitals. Moreover, as described in note 32,
supra, contracting affiliates like Hallmark may negotiate with some commercial payers directly (i.e., not through
Partners). Thus, the market share that describes the competitive importance of Partners to payers likely does not
reflect all discharges from these affiliated but non-owned hospitals. 70
This number differs from the sum of the 32% and 15% market shares presented in the left-hand column of this
table due to the inclusion of the 1% market share of Emerson Hospital, another non-owned contracting affiliate of
Partners.

21
I M S NSM ’ SA – 2012 Discharges
Hospital System
Excluding Non-Owned Contracting Affiliates
Including All Contracting Affiliates
Commercial Discharges
Market Share Commercial Discharges
Market Share
Partners 5,040 59% 5,208 61%
Lahey 2,470 29% 2,470 29%
Beth Israel 343 4% 383 4%
Boston Children’s Hosp. 218 3% 218 3%
Hallmark 160 2% - -
b. Physician Market Share
We also examined PCHI’s share of primary care physician (PCP) services in Hallmark’s
service area. Using claims-level data from the All Payer Claims Database (APCD) for the
largest commercial payer in Massachusetts, we constructed a PSA for Hallmark’s PCPs
(hereinafter primary care PSA).71
We found that PCHI physicians (including Hallmark) have an
approximately 40% share of PCP services in this service area, as measured by revenue, and an
approximately 35% share as measured by visits.72
When a provider’s share of revenue is above
its share of visits in a given area, that provider’s revenue per visit is above average relative to
other providers in the same area.73
Winchester Physician Associates,74
New England Quality
Care Alliance (NEQCA), and Atrius Health (Atrius) have the second, third, and fourth largest
market shares in Hallmark’s primary care PSA by both visits and revenue. However, their shares
are tightly clustered and the ordering of their respective positions can shift with minor changes in
methodology. These three groups each have between 7% and 13% of PCP visits and between
8% and 12% of PCP revenue in Hallmark’s primary care PSA.
In addition to this strong market share in northeastern Massachusetts, as CHIA has
previously reported, Partners is also the largest acute care hospital system and physician group
statewide based on revenue reported from nine of the largest commercial payers in
71
For the purposes of this report, we define a primary care PSA to be the area from which Hallmark PCPs
collectively draw 75% of their primary care visits. Due to time and data constraints, our analysis is based on data
for the largest commercial payer. As the APCD is expanded and refined, we look forward to further developing our
APCD-based analyses. 72
These are conservative figures because, in calculating PCHI’s market share, we excluded certain PCHI specialists
who may occasionally provide some primary care services, but were unable to exclude this type of specialist from
other physician groups and independent PCPs. In order to ensure these findings are robust, we tested multiple
market share sensitivities, including treating the Hallmark PCPs as separate Lawrence-Memorial and Melrose-
Wakefield groups based on the location of each PCP, which all yielded results consistent with those reported here.
Analyzed separately, Hallmark physicians have approximately 14% to 16% of primary care revenue and 13% to
15% of primary care visits in Hallmark’s primary care PSA. 73
Higher average revenue per visit reflects a combination of higher prices and/or higher patient acuity. 74
Although we understand that Winchester Physician Associates (WPA) is being acquired by Lahey, it currently
contracts through NEQCA, so for clarity we treat its market share here separately from either system.

22
Massachusetts. In 2011, Partners received nearly one-third of statewide commercial payments to
acute hospitals and approximately one-quarter of statewide payments to physician groups.75
3. Partners’ Hospitals Receive Higher Prices Than Hallmark and Other Area Hospitals
The HPC examined hospital relative price76
data for the parties from 2010 to 2012, and
found consistent trends for all three major commercial payers. In each region in which Partners
operates, its hospitals were consistently high priced.77
Partners’ owned hospital in northeastern
Massachusetts, North Shore Medical Center (NSMC), generally received the highest prices in the
region,78
while Hallmark’s prices were near the middle. These data also show that Partners’
community hospitals in the greater Boston area receive comparable prices79
and that Hallmark
hospitals, while contracting through Partners, generally receive lower prices (for the three largest
commercial payers, Partners’ community hospitals in the greater Boston area receive prices that
are approximately 18%, 17%, and 6% higher than Hallmark’s prices, depending on the payer).
The following chart is an example of this pattern, showing relative prices for inpatient and
outpatient services for one major payer.80
75
CHIA ANNUAL REPORT AUG. 2013, supra note 16, at 33-34 (finding that Partners received 31% of acute hospital
payments in 2012 and 25% of physician payments in 2011 from these commercial payers). 76
Relative price is a standardized pricing measure that accounts for differences among provider service volume,
service mix, patient acuity, and insurance product types in order to allow comparison of negotiated price levels. Id.
at 35. 77
From 2010 to 2012, each Partners hospital received the highest price among area hospitals from BCBS and THP,
except for Cooley Dickinson (acquired by Partners in July 2013; received the second highest price from BCBS),
Faulkner (received a lower price from THP), and Newton-Wellesley (received the second highest price from THP in
2010, but the highest in 2011 and 2012). HPHC’s prices for all of the Partners hospitals except Martha’s Vineyard
and Nantucket Cottage were consistently either the highest or second highest among area hospitals. CHIA ANNUAL
REPORT AUG. 2013, supra note 16, at 10; CTR. FOR HEALTH INFO. & ANALYSIS, 2012 Relative Prices, APMs, and
TME by Payer Databook, http://www.mass.gov/chia/docs/r/pubs/13/2013-annual-report-rp-apm-tme-data-book.xlsx
[hereinafter CHIA 2012 Relative Prices, APMs, and TME by Payer Databook]. See also PHS-SSH-HARBOR FINAL
CMIR REPORT, supra note 23, at 15 (showing relative prices for the Partners hospitals compared to other area
hospitals). 78
CHIA 2012 Relative Prices, APMs, and TME by Payer Databook, supra note 77. From 2010-2012, NSMC
received the second highest prices from HPHC and the highest prices from THP and BCBS among area hospitals,
while Hallmark was in the lower to middle range among area hospitals. 79
The three major commercial payers also confirmed that Partners seeks consistent pricing for these owned
community hospitals in the greater Boston area: Faulkner, Newton-Wellesley, and NSMC. 80
See supra note 78.

23
Source: CHIA 2012 Relative Prices, APM, and TME by Payer Databook, supra note 77.
4. Partners’ Physician Groups (excluding Hallmark) Generally Receive Higher Prices
than Hallmark Physicians and Other Area Physician Groups.
The HPC examined physician relative price data from 2009 to 2011 for the three major
payers.81
Over this period, Partners’ physician groups received higher prices than nearly all
other physician groups in northeastern Massachusetts.82
Although Hallmark physicians contract
through PCHI for both PPO and HMO/POS rates, overall, Hallmark’s relative prices were also
lower than those for Partners’ other physician groups. As shown below for one major
commercial payer, when Partners’ rates are broken out by type of physician group, Partners’
physicians associated with AMCs received the highest rates, followed by employed community
81
2012 physician relative price data will likely be available from CHIA in late 2014. 82
For BCBS from 2009-2011, only Atrius and Mount Auburn Cambridge Independent Practice Association received
higher relative prices than PCHI.
Nantucket Cottage
Cooley*Faulkner
BWH & MGH
Newton-Wellesley
Martha's Vineyard
NSMC
Hallmark
0
0.5
1
1.5
2
2.5
Rel
ativ
e P
rice
Partners' Owned Hospitals Area Hospitals Hallmark (Partners Affiliated)
Newton/ Wellesley
Cape & Islands
North of Boston
Boston Community
Hospitals
Boston AMCs
Pioneer Valley
Relative Prices for Hallmark and Partners Hospitals Compared to Other Area Hospitals (BCBS 2012)
Area hospitals: Pioneer Valley (Baystate MC, Holyoke, Mercy MC, Noble); Boston Community (Carney, Norwood, St. Elizabeth's MC); Boston AMCs (BIDMC, BMC, Tufts MC); Newton/Wellesley (BID-Needham, Metrowest MC, Mt. Auburn); Cape & Islands (Cape Cod, Falmouth); North of Boston (Addison-Gilbert, Beverly, Cambridge Health Alliance, Lahey MC, Mt. Auburn, Winchester)
*Cooley owned by Partners as of July 1, 2013.
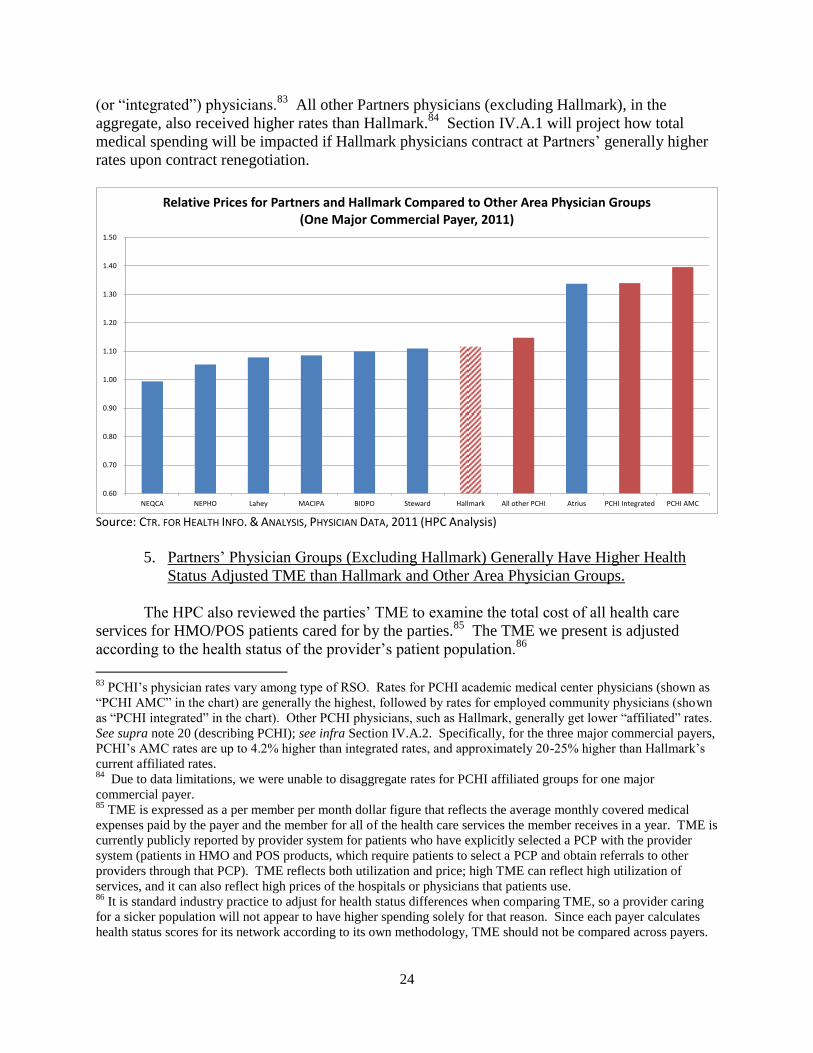
24
(or “integrated”) physicians.83
All other Partners physicians (excluding Hallmark), in the
aggregate, also received higher rates than Hallmark.84
Section IV.A.1 will project how total
medical spending will be impacted if Hallmark physicians contract at Partners’ generally higher
rates upon contract renegotiation.
Source: CTR. FOR HEALTH INFO. & ANALYSIS, PHYSICIAN DATA, 2011 (HPC Analysis)
5. Partners’ Physician Groups (Excluding Hallmark) Generally Have Higher Health
Status Adjusted TME than Hallmark and Other Area Physician Groups.
The HPC also reviewed the parties’ TME to examine the total cost of all health care
services for HMO/POS patients cared for by the parties.85
The TME we present is adjusted
according to the health status of the provider’s patient population.86
83
PCHI’s physician rates vary among type of RSO. Rates for PCHI academic medical center physicians (shown as
“PCHI AMC” in the chart) are generally the highest, followed by rates for employed community physicians (shown
as “PCHI integrated” in the chart). Other PCHI physicians, such as Hallmark, generally get lower “affiliated” rates.
See supra note 20 (describing PCHI); see infra Section IV.A.2. Specifically, for the three major commercial payers,
PCHI’s AMC rates are up to 4.2% higher than integrated rates, and approximately 20-25% higher than Hallmark’s
current affiliated rates. 84
Due to data limitations, we were unable to disaggregate rates for PCHI affiliated groups for one major
commercial payer. 85
TME is expressed as a per member per month dollar figure that reflects the average monthly covered medical
expenses paid by the payer and the member for all of the health care services the member receives in a year. TME is
currently publicly reported by provider system for patients who have explicitly selected a PCP with the provider
system (patients in HMO and POS products, which require patients to select a PCP and obtain referrals to other
providers through that PCP). TME reflects both utilization and price; high TME can reflect high utilization of
services, and it can also reflect high prices of the hospitals or physicians that patients use. 86
It is standard industry practice to adjust for health status differences when comparing TME, so a provider caring
for a sicker population will not appear to have higher spending solely for that reason. Since each payer calculates
health status scores for its network according to its own methodology, TME should not be compared across payers.
0.60
0.70
0.80
0.90
1.00
1.10
1.20
1.30
1.40
1.50
NEQCA NEPHO Lahey MACIPA BIDPO Steward Hallmark All other PCHI Atrius PCHI Integrated PCHI AMC
Relative Prices for Partners and Hallmark Compared to Other Area Physician Groups (One Major Commercial Payer, 2011)
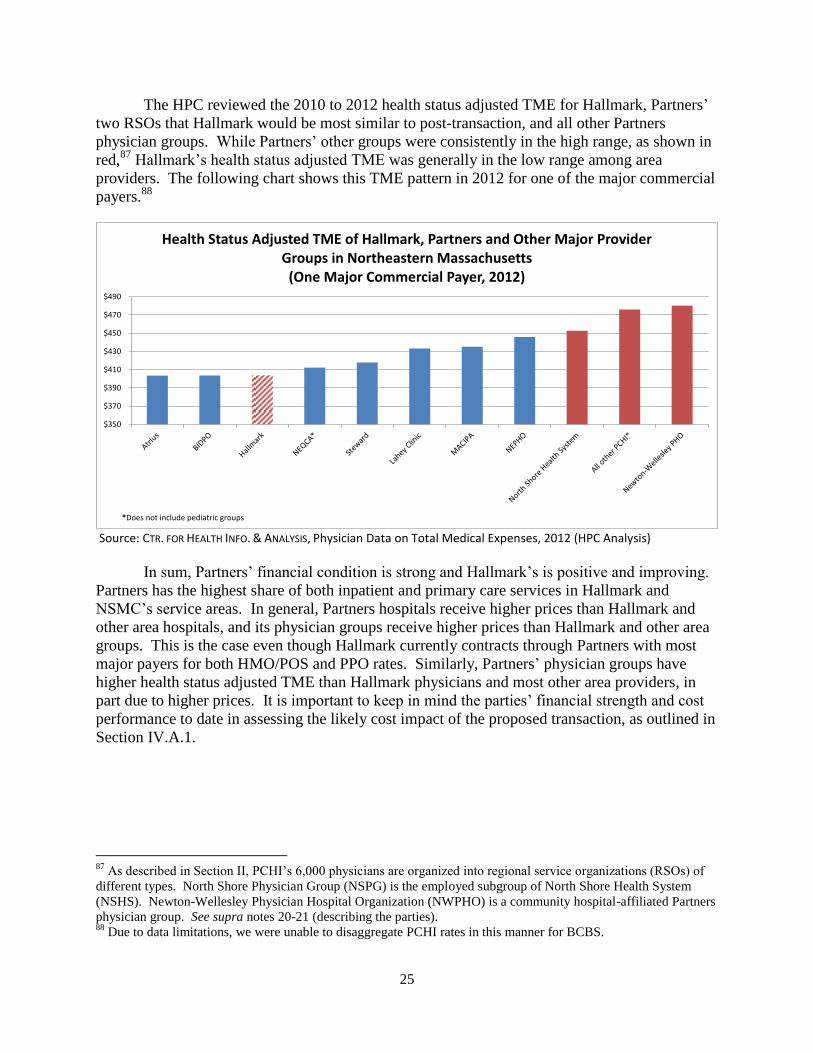
25
The HPC reviewed the 2010 to 2012 health status adjusted TME for Hallmark, Partners’
two RSOs that Hallmark would be most similar to post-transaction, and all other Partners
physician groups. While Partners’ other groups were consistently in the high range, as shown in
red,87
Hallmark’s health status adjusted TME was generally in the low range among area
providers. The following chart shows this TME pattern in 2012 for one of the major commercial
payers.88
Source: CTR. FOR HEALTH INFO. & ANALYSIS, Physician Data on Total Medical Expenses, 2012 (HPC Analysis)
In sum, Partners’ financial condition is strong and Hallmark’s is positive and improving.
Partners has the highest share of both inpatient and primary care services in Hallmark and
NSMC’s service areas. In general, Partners hospitals receive higher prices than Hallmark and
other area hospitals, and its physician groups receive higher prices than Hallmark and other area
groups. This is the case even though Hallmark currently contracts through Partners with most
major payers for both HMO/POS and PPO rates. Similarly, Partners’ physician groups have
higher health status adjusted TME than Hallmark physicians and most other area providers, in
part due to higher prices. It is important to keep in mind the parties’ financial strength and cost
performance to date in assessing the likely cost impact of the proposed transaction, as outlined in
Section IV.A.1.
87
As described in Section II, PCHI’s 6,000 physicians are organized into regional service organizations (RSOs) of
different types. North Shore Physician Group (NSPG) is the employed subgroup of North Shore Health System
(NSHS). Newton-Wellesley Physician Hospital Organization (NWPHO) is a community hospital-affiliated Partners
physician group. See supra notes 20-21 (describing the parties). 88
Due to data limitations, we were unable to disaggregate PCHI rates in this manner for BCBS.
$350
$370
$390
$410
$430
$450
$470
$490
*Does not include pediatric groups
Health Status Adjusted TME of Hallmark, Partners and Other Major Provider Groups in Northeastern Massachusetts
(One Major Commercial Payer, 2012)
26
B. QUALITY PROFILE
The HPC examined the parties’ quality performance89
in recent years to establish a
baseline from which to assess whether differences in the parties’ performance could be expected
to drive beneficial clinical impacts following the transaction.90
We focused on four core
dimensions of quality: health care system structures, clinical processes, clinical outcomes, and
patient experience of care. We discuss each of these below.
After examining over 115 nationally recognized measures91
across these dimensions, we
found:
Hallmark hospitals92
have slightly above-average inpatient quality when compared to
state and national averages, but slightly lower performance than other area community
hospitals.93
Partners’ hospitals generally have high quality performance compared to
state and national averages.
Hallmark’s physician groups generally perform at or slightly below the state average
among Massachusetts medical groups. PCHI (excluding Hallmark) consistently
outperforms the state average.
a. Measures of Health System Structures
Our examination of a series of structural factors related to quality and patient safety
(including, e.g., staff policies, accreditation, certification, and staff influenza vaccination)
indicates that the parties generally perform well.94
Hallmark-MWH met the 2013 state average
89
Our analysis is based on the best available, nationally accepted measures of quality and care delivery
performance. As additional measures of quality performance are developed, we look forward to incorporating them
into our future work. 90
An important factor that may increase the likelihood of a beneficial quality impact from a transaction is
substantial pre-merger clinical superiority of the acquiring party, though differences in quality by themselves do not
guarantee a transaction will result in quality improvements. See Patrick Romano & David Balan, A Retrospective
Analysis of the Clinical Quality Effects of the Acquisition of Highland Park Hospital by Evanston Northwestern
Healthcare, 18 INTL. J. OF ECON. OF BUSINESS 45 (2011) (“[P]re-merger quality differences suggest one hospital has
something of value to impart to the other.”). 91
We assessed a broad spectrum of measures capturing different segments of care. Where possible, measures were
drawn from the Massachusetts Standard Quality Measure Set. See CTR. FOR HEALTH INFO & ANALYSIS, MASS.
STANDARD QUALITY MEASURE SET (2014), available at http://www.mass.gov/chia/docs/g/sqac/2013/2013-final-
report-appendix-b-standard-quality-measure-set.pdf. 92
In most cases, sources of inpatient quality data aggregated Hallmark-MWH and Hallmark-LMH. 93
As noted in Section I.B, area community hospitals used as comparators for Hallmark include NSMC (Salem and
Union), Winchester, Mount Auburn, and CHA. 94
The Leapfrog Group® conducts an annual assessment of hospital patient safety performance across the nation.
Based upon a series of factors, including utilization of computerized physician order entry (CPOE), ICU physician
staffing ratios, core safety practices, five surgical care improvement project measures, data on seven hospital
acquired conditions, and six patient safety indicators, the Leapfrog Group assigns a Hospital Safety ScoreSM
to each
hospital. The Hallmark hospitals, BWH, Faulkner, and NSMC’s-Union campus all received a score of “A,” while
MGH and NSMC-Salem each received a “B.” The Hospital Safety ScoreSM
grades hospitals on data related to how
safe they are for patients. About the Score - Hospital Safety Score, THE LEAPFROG GROUP,
http://www.hospitalsafetyscore.org/about-the-score (last visited June 27, 2014).
27
rate of influenza vaccination for health care personnel95
of 86%, and Hallmark-LMH achieved a
vaccination rate of 90%; Partners’ hospitals generally had lower rates of vaccination.96
Partners
has well-developed internal systems for tracking and benchmarking quality and incentivizing
clinical improvement at its hospitals and individual PCHI physician groups, including Hallmark
Health PHO (HHPHO), while Hallmark also has some internal quality tracking systems.97
b. Clinical Process Measures
Clinical processes are the elements of workflow in a clinical environment, such as
adherence to guidelines or the timely provision of certain accepted services. We examined the
following clinical process measures:
Hospital Process Composites for Acute Myocardial Infarction (AMI), Pneumonia, and
Heart Failure, and Surgical Care Improvement Project (SCIP) Measures.98
Hallmark99
and NSMC perform lower than state and national averages on these measures, while
BWH and other area providers—Lahey HMC, Beverly, and Mount Auburn—perform
higher than the averages. This is, however, a small difference among high-performing
institutions.100
All hospitals demonstrate consistent improvement over the time period
examined.
Behavioral Health Inpatient Process Measures.101
The HPC examined four measures of
the quality of inpatient care for patients admitted for behavioral health treatment. On
95
These data are from the Massachusetts Department of Public Health for 2012-2013; DPH’s target rate of
vaccination for 2013 was 90%. See MASS. DEP’T OF PUBLIC HEALTH, 2012 HEALTHCARE ASSOCIATED INFECTION
ANNUAL REPORT (2013), available at http://www.mass.gov/eohhs/docs/dph/quality/healthcare/hai/employee-flu-
vac/acute-care-hospital-2012-2013.pdf. 96
Vaccination rates at Partners hospitals were: 73% at BWH, 78% at NSMC-Salem, 79% at NSMC-Union, 82% at
Cooley Dickinson, 84% at MGH, 87% at Newton-Wellesley, 89% at Faulkner. Id. 97
The development and implementation of systems to track and improve quality can play a part in improving
clinical performance. See Loes M. Schouten et al, Evidence for the Impact of Quality Improvement Collaboratives:
Systematic Review, 336 BMJ 1491 (2008), available at
http://www.ncbi.nlm.nih.gov/pmc/articles/PMC2440907/pdf/bmj-336-7659-res-01491-el.pdf. 98
The HPC used CMS Hospital Compare data to create a singular weighted composite process measure of the
parties’ performance for each year 2011 through Q1 2013. The weighted process measure was composed of hospital
process composites for AMI, pneumonia, heart failure and SCIP measures. See Measures Displayed on Hospital
Compare, CTR. FOR MEDICARE & MEDICAID SERVS., http://www.medicare.gov/hospitalcompare/Data/Measures-
Displayed.html (last visited Mar. 26, 2014) (process measures for AMI, heart failure, pneumonia, and SCIP listed
under the heading of “Timely and Effective Care”). 99
We refer to Hallmark as a system when discussing certain inpatient measures because CMS Hospital Compare
aggregates data for Hallmark-LMH and Hallmark-MWH. 100
In 2013, Hallmark achieved a 97.3% score in the CMS Hospital Compare Hospital Process Composite and
NSMC scored a 97.8%, compared to the Massachusetts average score of 98.3% and national average score of
97.9%. 101
The HPC examined four CMS measures of care for patients identified as psychiatric discharges: hours of
physical restraint use (HBIPS-2), hours of seclusion (HBIPS-3), frequency of creation of a post-discharge
continuing care plan (HBIPS-6), and frequency of transmission of a post-discharge continuing care plan to the next
level of care provider upon discharge (HBIPS-7). These measures were recently published, and data are available
only for the period from Oct. 2012 through Mar. 2013. See Specifications Manual for Joint Commission National
Quality Measures (v2013A1), THE JOINT COMM’N,
28
measures assessing the frequency of use of restraints or seclusion, the parties’ hospitals
perform well relative to state and national averages. On measures of the use of post-
discharge care plans, MGH and McLean performed extremely well compared to state and
national benchmarks, while Hallmark’s performance was substantially lower.
Hospital Outpatient Imaging Measures.102
The HPC examined five measures of the
frequency of use of certain imaging procedures for hospital outpatients. While the use of
these procedures is necessary in some cases, particularly high rates of use may indicate
inappropriate or inefficient use.103
On a composite of these measures, Hallmark’s rate of
use was over 80% higher than the state average; Partners AMCs’ use was less than half of
the average, and NSMC’s rate of use was also below average.
Ambulatory Care (HEDIS) Process Measures.104
The HPC analyzed 25 measures that
show how primary care providers perform on preventative care services, including
hypertension, cancer screening, heart failure, and diabetes. HHPHO105
performed
slightly below the state average in both years analyzed, while the weighted average
performance of PCHI’s physician groups (not including Hallmark) slightly exceeded the
state average in both years; the variation between the parties was four percentage
points.106
Overall, on these nationally accepted process measures, for both inpatient and outpatient quality
Hallmark performs below the state and national averages, while most Partners hospitals and
PCHI perform better compared to these averages.
c. Clinical Outcome Measures
We also examined clinical outcomes, or the results of a given course of care, in the
hospital setting. On measures of mortality, inpatient performance at Hallmark and all Partners
https://manual.jointcommission.org/releases/TJC2013A/HospitalBasedInpatientPsychiatricServices.html (last visited
May 9, 2014). 102
The HPC examined CMS Hospital Compare measures of the use of medical imaging for Q1 2010 through Q4
2011. These measures were not case-mix adjusted. Outpatient Imaging Efficiency Data, CTR. FOR MEDICARE &
MEDICAID SERVS., http://www.medicare.gov/hospitalcompare/Data/Outpatient-Measures.html (last visited June 29,
2014). 103
Id. 104
The HPC obtained data for years 2009 and 2010 from Massachusetts Health Quality Partners (MHQP) and used
measures derived from the Healthcare Effectiveness Data Information Set (HEDIS) to measure the quality of clinical
processes in the outpatient setting. The composite presented includes metrics for adult diagnostic and preventive
care, depression, medication management, asthma care, heart disease and chronic disease management, diabetes
care, well-child visits, pediatric medications and testing, and women’s health. HEDIS ® and Quality Compass ®,
NAT’L COMM. FOR QUALITY ASSURANCE, http://www.ncqa.org/HEDISQualityMeasurement/WhatisHEDIS.aspx
(last visited Mar. 26, 2014). 105
Because the physician data used predates the formation of HHPHO, the data presented here is the average
performance of the two physician groups which later became HHPHO, Melrose-Wakefield/Metro North Healthcare
Alliance and The Lawrence Organization, weighted by number of patients. 106
HHPHO performed roughly 2% below the state average in both 2009 and 2010, while PCHI performed
approximately 2% higher than the state average in the same time period.
29
hospitals was better than state and national averages.107
On a composite measure of
readmissions, Hallmark performs slightly better than the state average, but not as well as the
national average. NSMC outperforms state and national averages, while MGH and BWH
perform below both benchmarks.108
The performance of the parties’ hospitals on Massachusetts
Data Analysis Center (Mass-DAC) measures of mortality after percutaneous coronary
interventions were not statistically significantly different from the state average.109
On a
composite of AHRQ Patient Safety Indicators, which measures the frequency of preventable
harm in the hospital setting,110
NSMC-Salem outperformed Hallmark-MWH, while both
hospitals performed better than the state average; Hallmark-LMH, NSMC-Union, MGH, and
BWH all performed below the state average in 2012. On another composite measure of the
frequency of hospital acquired conditions, Hallmark performed in line with the state average,
while NSMC and the Partners AMCs performed below average over a one-year period.111
There
was no statistical difference between the rate of health care associated infections at the parties’
hospitals and the national average, except that MGH experienced a lower incidence of central
line associated blood stream infections (CLABSI) related to surgeries in 2012, NSMC-Salem
107
These findings are based on a composite of CMS Hospital Compare mortality rates among heart attack, heart
failure, and pneumonia patients from Q3 2009 through Q2 2012. Although lower scores on these outcome measures
indicate better performance, we use the term “below average” to mean lower performance. Performance on
outcome measures is adjusted for differences in patient acuity. Compared to national averages, NSMC’s
performance was statistically significantly better for heart failure and pneumonia mortality in 2012, while the
performance of the other Partners hospitals and Hallmark was not statistically higher or lower than the national
averages. See Outcome Measures, CTR. FOR MEDICARE & MEDICAID SERVS.,
http://www.cms.gov/Medicare/Quality-Initiatives-Patient-Assessment-
Instruments/HospitalQualityInits/OutcomeMeasures.html. 108
This statistic is based on a composite of CMS Hospital Compare readmission rates within 30 days among heart
attack, heart failure, and pneumonia patients from Q3 2009 through Q2 2012. NSMC was statistically better than
the national average on heart failure readmissions in 2012. All other hospitals were not statistically different from
the national average in 2012 for each of the three readmission rates. 109
Although Mass-DAC also measures mortality after coronary artery bypass graft (CABG) surgery, Hallmark-
MWH performed no CABG procedures during the time period examined; therefore, we evaluated only measures for
elective and emergency percutaneous coronary interventions. Hallmark-LMH does not perform any of the complex
cardiac procedures monitored by Mass-DAC. See Reports, MASS. DATA ANALYSIS CTR.,
http://www.massdac.org/index.php/reports/ (last visited Apr. 16, 2014). 110
The HPC computed Patient Safety Indicators (PSI) and Inpatient Quality Indicators (IQI) from Massachusetts
Health Data Consortium (MHDC) hospital discharge data for 2010 through 2012 using code available from AHRQ.
See Patient Safety Indicators Overview, AGENCY FOR HEALTHCARE RESEARCH & QUALITY,
http://www.qualityindicators.ahrq.gov/modules/psi_resources.aspx (last visited Apr. 16, 2014) (discussing the use of
PSIs to measure the frequency of a variety of adverse outcomes and preventable harm); AGENCY FOR HEALTH CARE
RESEARCH & QUALITY, PATIENT SAFETY FOR SELECTED INDICATORS, TECHNICAL SPECIFICATIONS, PATIENT SAFETY
INDICATORS #90 (2013), available at
http://www.qualityindicators.ahrq.gov/Downloads/Modules/PSI/V45/TechSpecs/PSI%2090%20Patient%20Safety%
20for%20Selected%20Indicators.pdf (showing the measures that are part of the PSI #90 health status adjusted
composite). 111
This statistic is based on a composite of CMS Hospital Compare measures of the frequency of hospital acquired
conditions occurring in Q4 2010 through Q4 of 2011 (the most recently available data). Conditions - Hospital
Acquired Conditions (HACs), QUALITYNET,
http://qualitynet.org/dcs/ContentServer?c=Page&pagename=QnetPublic%2FPage%2FQnetTier4&cid=1228759483
171 (last visited June 29, 2014).

30
experienced a higher incidence of CLABSI in 2012, and Hallmark-MWH experienced a higher
incidence of surgical site infections associated with hysterectomies in 2010 and 2012.112
d. Patient Experience of Care Measures
We assessed the parties’ performance on ten hospital experience measures113
and six
ambulatory adult and five pediatric patient experience measures.114
On a composite measure of
hospital patient experience, Hallmark’s hospitals, MGH, and BWH performed better than both
state and national averages, while NSMC performed below the state and national averages.
On the adult ambulatory care experience composite, PCHI on average (not including
Hallmark) performed approximately 1% better than the state average for both 2009 and 2011,
while HHPHO performed equal to the state average in 2009, but fell 2% below the state average
in 2011. On the pediatric ambulatory care experience composite, both HHPHO and PCHI
trended upward from 2009 to 2011, with HHPHO meeting and PCHI exceeding the state average
in 2011.115
In summary, Hallmark hospitals performed equal to or above the state average on 55% of
the inpatient quality measures we examined, while HHPHO performed equal to or above average
on 38% of ambulatory measures examined.116
All of Partners’ hospitals and physician groups
met or exceeded average performance on more measures than Hallmark; NSMC met or exceeded
the average on 66% of inpatient measures and NSHS met or exceeded the average on 78% of
ambulatory measures, while MGH met or exceeded the average on 59% of inpatient measures
and MGPO met or exceeded the average on 69% of ambulatory measures.
112
These statistics are based on DPH data on health care associated infections for 2010 through 2012. See MASS.
DEPT. OF PUBLIC HEALTH, MASS. 2012 HAI DATA UPDATE (2013), available at
http://www.mass.gov/eohhs/docs/dph/quality/healthcare/hai/hai-hospital-data-2012.xls. 113
We obtained Hospital Consumer Assessment of Healthcare Providers and Systems (HCAHPS) data from CMS
for years 2011 through Q1 2013 and analyzed to produce our findings, focusing on HCAHPS “top-box” scores. See
Survey of Patients’ Experiences, CTR. FOR MEDICARE & MEDICAID SERVS.,
http://www.medicare.gov/hospitalcompare/About/Survey-Patients-Experience.html (last visited Mar. 26, 2014)
(explaining HCAHPS survey criteria); Summary Analyses, CTR. FOR MEDICARE & MEDICAID SERVS.,
http://www.hcahpsonline.org/SummaryAnalyses.aspx (last visited Mar. 18, 2014) (explaining HCAHPS “top box”
methodology). 114
We obtained Adult and Pediatric Ambulatory Care Patient Experience Surveys for 2009 and 2011 from the
Massachusetts Health Quality Partners (MHQP) and analyzed to produce our findings. See Quality Insights: 2011
Patient Experiences in Primary Care, Technical Appendix, MASS. HEALTH QUALITY PARTNERS,
http://www.mhqp.org/quality/pes/pesTechApp.asp?nav=031638 (last visited Mar. 26, 2014) (explaining the Adult
and Pediatric Ambulatory Care Patient Experience Survey). 115
Hallmark improved two percentage points from 2009 to 2011 and was equal to the state average in 2011. 116
The percentages in this summary assess performance on individual measures, including those which comprise the
composites discussed in the preceding subsections. Those measures for which no data was available for a particular
hospital or local practice group were excluded from that entity’s total count. Performance within 0.1% of average
was considered average for the purpose of these summary counts. On inpatient measures for which disaggregated
data were available for the Hallmark hospitals and NSMC, data for Hallmark-MWH and NSMC-Salem were used,
respectively.
31
C. ACCESS PROFILE
Pursuant to MASS. GEN. LAWS ch. 6D, § 13, the HPC monitors factors relating to health
care access in its review of provider material changes (e.g., “availability and accessibility of
services,” “the role of the provider in serving at-risk, underserved, and government payer patient
populations, including those with behavioral, substance use disorder and mental health
conditions,” “[the provision of] low margin or negative margin services,” and “consumer
concerns”).117
The HPC recognizes that “access” is a broad term encompassing a spectrum of
interrelated factors that measure and monitor how patients access and engage with the health care
system.118,119
Given that the proposed transaction contemplates significant changes in service
offerings and service locations, including a net consolidation of inpatient beds and expansion of
certain outpatient services like cardiology, oncology, and orthopedics, it is important to
understand the baseline profile of the parties’ current service offerings and the patients they
serve. We evaluated the following measures of access in our review of this transaction:
1. Service capacity, utilization, and community need: Where possible, we examined
the scope of provider service offerings and the volume of services delivered in
different service lines, including lower margin service lines. To explore service need,
we examined emergency department (ED) wait times and community health
assessments.120
2. Payer mix: We examined the proportion of care delivered to patients covered by
different forms of insurance, including government payer patients.121
117
MASS. GEN. LAWS ch. 6D, § 13(d)(vi, ix-xii) (2012). 118
For example, in evaluating the accessibility of services, health care experts examine factors as varied as:
(1) financial barriers, which may restrict access either because patients have limited ability to pay for services or
because providers avoid treating patients of limited means; (2) structural barriers, which may impede access through
a poor match between the needs of the population and the number, type, location, hours of operation, or
organizational configuration of health care providers; and (3) personal and cultural barriers, which may inhibit
people who need medical attention from seeking it or adhering to plans of care, and which can impact effective
communication with providers. See, e.g., INSTITUTE OF MEDICINE, ACCESS TO HEALTH CARE IN AMERICA 39-44
(Michael Millman ed., 1993); J. Emilio Carillo et al., Defining and Targeting Health Care Access Barriers, 22 J. OF
HEALTH CARE FOR THE POOR AND UNDERSERVED 562, 564-68 (2011). 119
See LAHEY-WINCHESTER FINAL CMIR REPORT, supra note 64, at 25 (various agencies in Massachusetts are
responsible for monitoring access, including CHIA, DOI, and the AGO, for example). 120
There is currently limited data on behavioral health services rendered at specialty psychiatric hospitals and in
outpatient sites of care. For example, specialty psychiatric hospitals are not included in CHIA’s Hospital Discharge
Database. As a result, many of our analyses focus on behavioral health discharges at general acute care hospitals.
Given the importance of specialty hospitals in providing behavioral health and other services, the HPC strongly
encourages collection of discharge data from these hospitals. Efforts to ensure high quality behavioral health data
are included for all government payers and major commercial payers in the All Payer Claims Database will further
support meaningful ambulatory care analyses. 121
Differences in payer mix can have significant financial implications for how our health care system sustainably
apportions care for the neediest populations. Given presumed lower payments by government payers, there are
financial implications for providers who care for a greater proportion of government payer patients, and those who
do not. See INSTITUTE OF MEDICINE, supra note 118, at 40. “[M]ost structural barriers to access have their roots in
the way health care is financed. Despite a greatly enlarged physician force and the existence of some 600
community health centers, many of today's poor still find it difficult to identify physicians who will accept
Medicaid. A major reason for this dilemma is Medicaid's low reimbursement rates.” Id.
32
From these, we found:
The parties are important providers of inpatient services to their local communities,
including behavioral health services.
While northeastern Massachusetts appears to have some excess inpatient bed capacity,
evidence indicates there is likely a need for additional behavioral health capacity. There
are inadequate data to allow us to evaluate need for other outpatient services proposed in
this transaction.
In contrast to other Partners hospitals, NSMC has a higher government payer mix and
lower commercial mix compared to area hospitals. Hallmark also has a higher mix of
government payers, including the highest Medicare mix among area hospitals, with
Hallmark-LMH having a particularly high Medicare mix among behavioral health
discharges.
1. Hallmark and NSMC are Important Providers of Inpatient Services, Including
Behavioral Health Services, to Their Local Communities.
To understand the scope of services provided by the parties, the HPC examined inpatient
services provided by Hallmark, NSMC, and other area community hospitals, the mix of beds122
at these hospitals, and the geographic areas from which Hallmark and NSMC draw their
patients.123
We found that the Hallmark and NSMC hospitals provide a range of medical,
surgical, and behavioral health services, with services for deliveries and newborns offered at
NSMC-Salem and Hallmark-MWH.124
The parties are significant providers of inpatient
behavioral health services, with behavioral health diagnoses representing between seven and
seventeen percent of discharges at the Hallmark and NSMC hospitals in 2012. When we
examined the mix of beds at area hospitals, we found that the parties represent approximately
36% of all inpatient behavioral health capacity in the region (NSMC and Hallmark provide 116
of 249 staffed behavioral health beds among area general acute care hospitals and McLean
provides 177 of 570 staffed behavioral health beds among area specialty psychiatric
hospitals).125,126
The below table shows the mix of bed capacity across the region.
122
In general, we use the word “bed” in this report to refer exclusively to inpatient beds. 123
The hospital’s mix of outpatient services may be different than the mix of inpatient services described in this
section. 124
Specifically, using the MHDC hospital discharge database, we found that in 2012, Hallmark-LMH’s discharges
were 75% medical, 13% surgical, 11% behavioral health, and 0% deliveries; Hallmark-MWH’s discharges were
60% medical, 15% surgical, 10% behavioral health, and 14% deliveries; NSMC-Salem’s discharges were 56%
medical, 22% surgical, 7% behavioral health, and 15% deliveries; and NSMC-Union’s discharges were 66%
medical, 16% surgical, 17% behavioral health, and 0% deliveries. These categories are based on the Health Care
Cost Institute’s methodology. HEALTH CARE COST INST., HEALTH CARE COST AND UTILIZATION REPORT: 2011,
ANALYTIC METHODOLOGY (Sept. 2012), available at
http://www.healthcostinstitute.org/files/HCCI_HCCUR2011_Methodology.pdf. 125
Of the parties’ licensed, as opposed to staffed, psychiatric beds, NSMC-Salem has 26 adult beds, NSMC-Union
has 20 adult and 18 child/adolescent beds, Hallmark-LMH has 18 geriatric beds, and Hallmark-MWH has 22 adult
beds. Mass. Dep’t of Mental Health, Staffed and Licensed Beds (2014) (on file with HPC). 126
Throughout this report, references to “specialty psychiatric hospitals” refer to private specialty psychiatric
hospitals rather than facilities operated by the Commonwealth. We do not include, for example, Department of

33
Staffed Beds at Area General Acute Care Hospitals and Specialty Psychiatric Hospitals
Med/Surg. ICU127 Ped. Newborn128 Psych. Total129
Area General Acute Care Hospitals130
Cambridge Health Alliance
106 12 0 14 88 234
Hallmark-LMH and Hallmark-MWH
129 15 0 10 52 216
Lahey HMC 287 54 0 0 0 341
Mount Auburn Hospital 141 20 0 29 15 228
Northeast Health System (Addison Gilbert and Beverly Hospitals)
219 34 0 28 30 342
NSMC-Salem and NSMC-Union
247 40 24 37 64 436
Winchester Hospital 147 10 12 40 0 229
Area Specialty Psychiatric Hospitals131
Arbour Hospital - - - - 130 130
Arbour-HRI Hospital - - - - 66 66
Bayridge Hospital (Lahey)
62 62
Bournewood Hospital - - - - 90 90
McLean Hospital - - - - 177 177
Walden Behavioral Care132
- - - - 45 45
Source: 2012 Hospital 403 Reports (CHIA) and Hospital Profile Reports (CHIA)
To understand the behavioral health populations served by the NSMC and Hallmark
hospitals, we constructed separate service areas for mental health and substance abuse discharges
Mental Health or Bureau of Substance Abuse Services facilities in these analyses due to differences in both the
services provided and the populations served. 127
Reflects total medical/surgical, coronary, and neonatal staffed ICU bed counts. CTR. FOR HEALTH INFO. &
ANALYSIS, Massachusetts Hospital Profiles, March, 2014: Acute Hospital Data Appendix (FY2012 Staffed Beds)
(last visited June 27, 2014), http://www.mass.gov/chia/researcher/hcf-data-resources/massachusetts-hospital-
profiles/overiew-and-current-reports.html (scroll to bottom of page and click “Acute Hospital” Excel document
under “Databooks”) [hereinafter CHIA 2012 Acute Hospital Profiles Databook]. 128
Reflects total newborn nursery and special care nursery staffed beds. Id. 129
This column includes certain bed types not listed separately in the table (e.g. obstetrics). 130
CHIA 2012 Acute Hospital Profiles Databook, supra note 127. 131
CTR. FOR HEALTH INFO. & ANALYSIS, Massachusetts Hospital Profiles, March, 2014: Non-Acute Hospital Data
Appendix (FY2012 Staffed Beds) (last visited June 27, 2014), http://www.mass.gov/chia/researcher/hcf-data-
resources/massachusetts-hospital-profiles/overiew-and-current-reports.html (scroll to bottom of page and click
“Non-Acute Hospital” Excel document under “Databooks”). Area psychiatric hospitals were selected by focusing
on facilities within a 10-mile radius of the party community hospitals. 132
We understand that Walden Behavioral Health focuses on a subset of the services provided by the other
psychiatric hospitals listed (primarily treatment for eating disorders and related disorders).
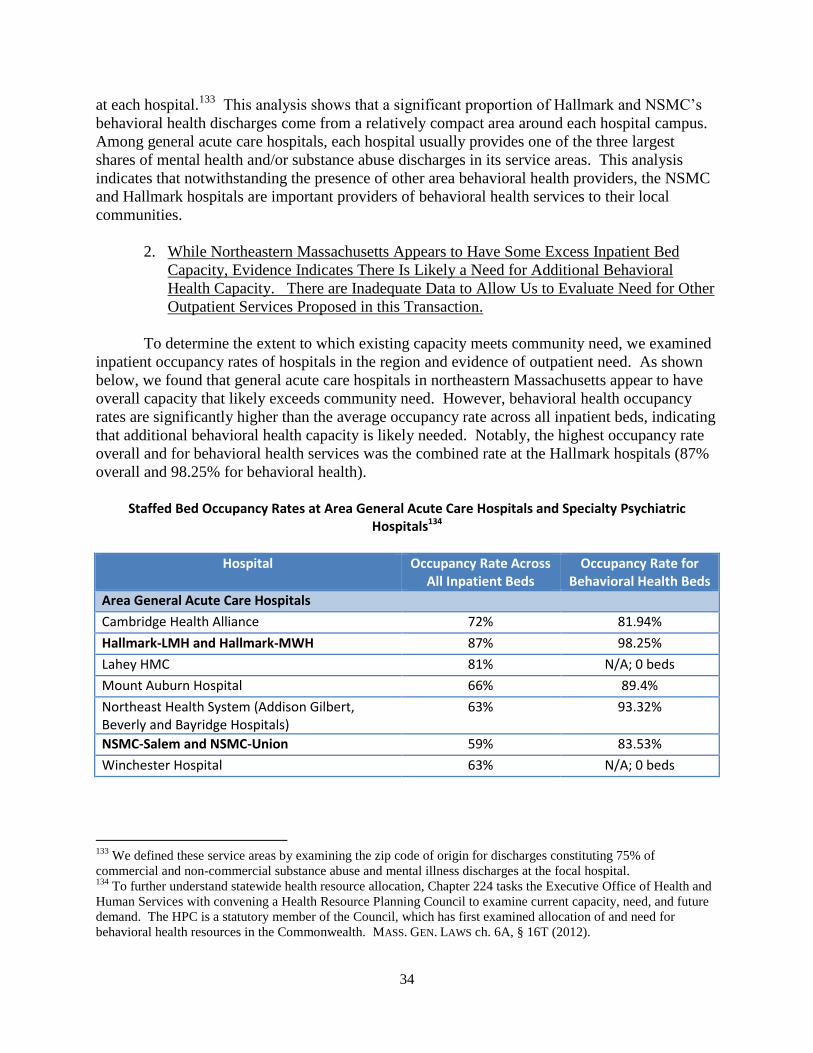
34
at each hospital.133
This analysis shows that a significant proportion of Hallmark and NSMC’s
behavioral health discharges come from a relatively compact area around each hospital campus.
Among general acute care hospitals, each hospital usually provides one of the three largest
shares of mental health and/or substance abuse discharges in its service areas. This analysis
indicates that notwithstanding the presence of other area behavioral health providers, the NSMC
and Hallmark hospitals are important providers of behavioral health services to their local
communities.
2. While Northeastern Massachusetts Appears to Have Some Excess Inpatient Bed
Capacity, Evidence Indicates There Is Likely a Need for Additional Behavioral
Health Capacity. There are Inadequate Data to Allow Us to Evaluate Need for Other
Outpatient Services Proposed in this Transaction.
To determine the extent to which existing capacity meets community need, we examined
inpatient occupancy rates of hospitals in the region and evidence of outpatient need. As shown
below, we found that general acute care hospitals in northeastern Massachusetts appear to have
overall capacity that likely exceeds community need. However, behavioral health occupancy
rates are significantly higher than the average occupancy rate across all inpatient beds, indicating
that additional behavioral health capacity is likely needed. Notably, the highest occupancy rate
overall and for behavioral health services was the combined rate at the Hallmark hospitals (87%
overall and 98.25% for behavioral health).
Staffed Bed Occupancy Rates at Area General Acute Care Hospitals and Specialty Psychiatric
Hospitals134
Hospital Occupancy Rate Across All Inpatient Beds
Occupancy Rate for Behavioral Health Beds
Area General Acute Care Hospitals
Cambridge Health Alliance 72% 81.94%
Hallmark-LMH and Hallmark-MWH 87% 98.25%
Lahey HMC 81% N/A; 0 beds
Mount Auburn Hospital 66% 89.4%
Northeast Health System (Addison Gilbert, Beverly and Bayridge Hospitals)
63% 93.32%
NSMC-Salem and NSMC-Union 59% 83.53%
Winchester Hospital 63% N/A; 0 beds
133
We defined these service areas by examining the zip code of origin for discharges constituting 75% of
commercial and non-commercial substance abuse and mental illness discharges at the focal hospital. 134
To further understand statewide health resource allocation, Chapter 224 tasks the Executive Office of Health and
Human Services with convening a Health Resource Planning Council to examine current capacity, need, and future
demand. The HPC is a statutory member of the Council, which has first examined allocation of and need for
behavioral health resources in the Commonwealth. MASS. GEN. LAWS ch. 6A, § 16T (2012).

35
Area Specialty Psychiatric Hospitals
Arbour Hospital - 85.58%
Arbour-HRI Hospital - 95.94%
Bournewood Hospital - 84.77%
McLean Hospital - 89.51%
Walden Behavioral Care135 - 93.36%
Source: 2012 and 2011 Hospital 403 Reports (CHIA) and Hospital Profile Reports (CHIA) Notes: Occupancy rates are estimates and may vary due to admission of select medically-complex behavioral health patients to medical-surgical units
To further examine area service capacity and need, the HPC studied boarding of patients
in emergency departments (EDs) in the region.136
Specifically, the HPC examined the number
of patients who visited regional emergency departments with a behavioral health need and had to
wait over 12 hours for an inpatient admission. This showed that although only about 5.9%137
of
emergency department patients have diagnosed behavioral health-related conditions, these
patients are disproportionately represented among ED boarders; over half of patients who
boarded at area hospitals had a behavioral health diagnosis.138
This data suggests that additional
inpatient and outpatient behavioral health capacity is likely necessary in the region. While these
data relate specifically to individuals awaiting an inpatient admission, the boarding problem also
suggests there may be insufficient outpatient behavioral health resources that would forestall the
need for a patient to go to an ED for behavioral health treatment.139
135
We understand that Walden Behavioral Health focuses on a subset of the services provided by the other
psychiatric hospitals listed (primarily treatment for eating disorders and related disorders). 136
There are few publicly available indicia of barriers to behavioral health access. Emergency department boarding
is a widely reported phenomenon with complex root causes, including limitation in access to certain types of
inpatient beds (most commonly pediatric and adolescent beds) as well as outpatient service limitations which result
in use of emergency departments as a routine site of care. ED boarding is routinely tracked by the Department of
Public Health. A boarding patient is defined as any individual in an ED for 12 or more hours after a decision is
made to admit or transfer the patient. See generally EXEC. OFFICE OF HEALTH & HUMAN SERVS., ED Length of Stay
Issues for Behavioral Health Patients (Jan. 2013), http://www.mass.gov/eohhs/docs/eohhs/behavioral-health/bh-
discussion-01022013.pdf; Elaine Rabin et al., Solutions To Emergency Department ‘Boarding’ And Crowding Are
Underused and May Need To Be Legislated, 31 HEALTH AFFAIRS 1757 (2012), available at
http://content.healthaffairs.org/content/31/8/1757. 137
Because of data limitations, the proportion of behavioral health-related ED visits at area hospitals is unknown.
However, among ED visits at all Massachusetts hospitals, 5.9% are behavioral health-related. See CTR. FOR HEALTH
INFO. & ANALYSIS, MASSACHUSETTS HEALTH CARE COST TRENDS: EFFICIENCY OF EMERGENCY DEPARTMENT
UTILIZATION IN MASSACHUSETTS (2012), available at http://www.mass.gov/chia/docs/cost-trend-docs/cost-trends-
docs-2012/emergency-department-utilization.pdf. 138
The HPC examined emergency department boarding data collected by the Department of Public Health (hospital
self-report) and emergency department wait-times reported by CMS. In addition to Hallmark and NSMC hospitals,
area hospitals for this analysis included Addison Gilbert, Beverly, Cambridge Health Alliance, Mount Auburn, and
Winchester Hospitals. 139
See, e.g., DAVID BENDER, NALINI PANDE AND MICHAEL LUDWIG, A LITERATURE REVIEW: PSYCHIATRIC
BOARDING (2008), available at http://aspe.hhs.gov/daltcp/reports/2008/psybdlr.htm (describing lack of inpatient
capacity as a direct cause of psychiatric ED boarding, but also describing the rise in emergency visits by psychiatric
patients as a proxy measure for failure of the outpatient mental health system); Vidhya Alakeson, Nalini Pande and
Michael Ludwig, A Plan to Reduce Emergency Room ‘Boarding’ of Psychiatric Patients, 29 HEALTH AFFAIRS 1637

36
While outpatient service capacity and need – particularly for behavioral health patients –
remain a central priority for the Commonwealth and the HPC,140
data on outpatient service
capacity and need remains limited. Thus, aside from the ED boarding data discussed above, the
HPC is unable to determine the full extent to which the parties’ current outpatient service
offerings align with community need. The parties commissioned a June 2012 community
assessment141
which provides some evidence regarding the general health concerns and
prevalence of certain conditions in Hallmark’s service area. That assessment highlights
community concerns about access to care and services for vulnerable populations (e.g., elders,
families with young children, immigrants, low-income residents, women and children), and for
behavioral health services. The assessment also identifies physical health conditions prevalent in
the community, including cancer, cardiovascular disease, diabetes, and obesity.142
However, as
the assessment does not include any analysis of existing capacity to address these conditions, we
are unable to evaluate the scope of any additional needed capacity.
3. Unlike Other Partners Hospitals, NSMC Has a Higher Government Payer Mix than
Most Area Hospitals; Hallmark Also Has a High Government Payer Mix With
Hallmark-LMH Serving a Substantial Proportion of Medicare Behavioral Health
Patients.
The HPC examined the payer mix of Partners’ general acute care hospitals and Hallmark,
as measured by revenue and discharges.143
As reported in the PHS-SSH-HARBOR FINAL CMIR
REPORT, from 2010 to 2012, each Partners hospital, with the notable exception of NSMC, had
the highest commercial payer mix and/or lowest Medicaid/Children’s Health Insurance Program
(CHIP) mix of any area hospital, based on revenue.144
By contrast, NSMC had a lower
commercial payer mix (28%) and higher combined Medicare and Medicaid/CHIP payer mix
(66%) than most area hospitals.
(2010) (stating that ED boarding of psychiatric patients is often the result of an inability to gain timely access to
community-based care). 140
The Health Planning Council convened pursuant to Mass. Gen. Laws ch. 6A, §16T has focused its first year of
planning activity solely on behavioral health services, including a substantial focus on outpatient service use and
availability. The HPC is a statutory member of the Health Planning Council. 141
Hallmark Determination of Need, supra note 28, at Exh. 7. 142
The assessment consisted of interviews with key community leaders and stakeholders across the catchment area
(n = 18) about top health concerns and vulnerable populations; community assets and resources. Online and in-
person community surveys (n = 387) were conducted by Hallmark among catchment area residents. Information
about health concerns, behaviors and needs was collected. “Vulnerable populations” included elders, families with
young children, immigrant groups, low-income residents, women, and children/youth. The assessment does not
provide analysis of current service availability, barriers to access, or quantitative data on new service needs. 143
The HPC examined the payer mix at general acute care hospitals using (1) data gathered by CHIA on inpatient
and outpatient revenue by payer and (2) MHDC data on discharges by payer. The HPC examined payer mix at
specialty psychiatric hospitals using data gathered by CHIA on gross inpatient and outpatient service revenue. 144
Where we examined two Partners hospitals together (MGH and BWH among Boston AMCs and Martha’s
Vineyard and Nantucket Cottage among the four Cape and Island hospitals), the two Partners hospitals were the two
highest commercial payer mix and/or lowest Medicaid/CHIP mix compared to other area hospitals. See PHS-SSH-
HARBOR FINAL CMIR REPORT, supra note 23, at 24-25.
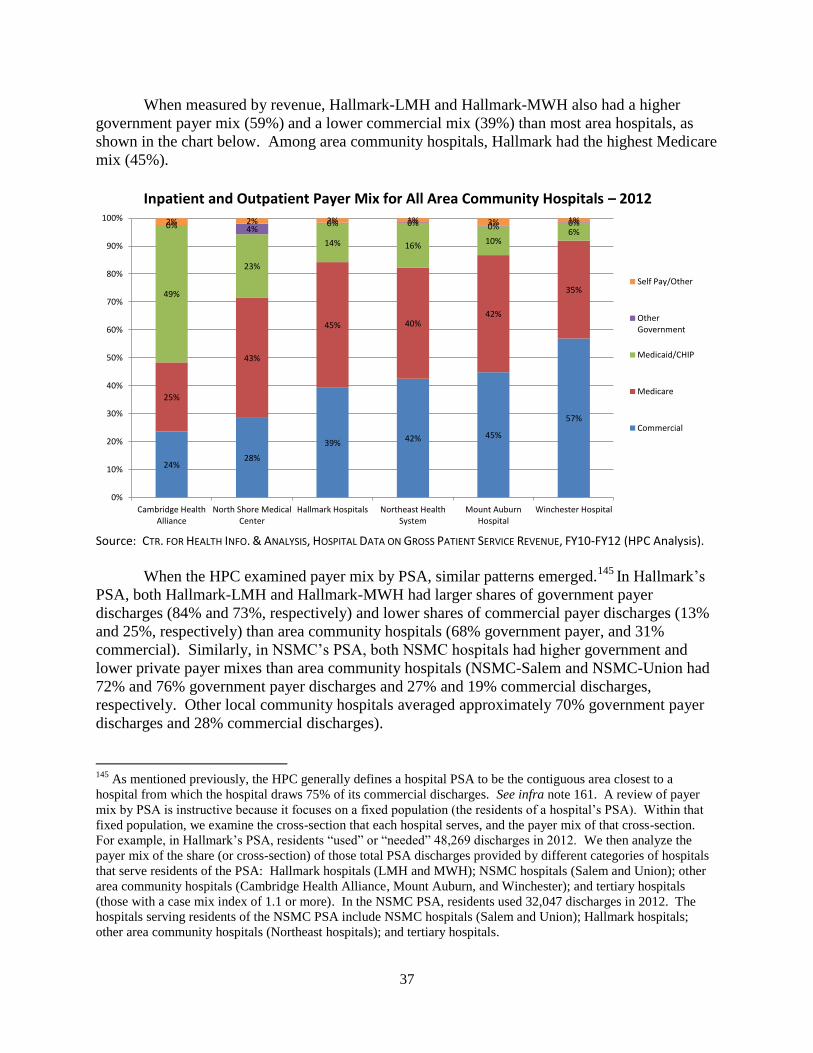
37
When measured by revenue, Hallmark-LMH and Hallmark-MWH also had a higher
government payer mix (59%) and a lower commercial mix (39%) than most area hospitals, as
shown in the chart below. Among area community hospitals, Hallmark had the highest Medicare
mix (45%).
Inpatient and Outpatient Payer Mix for All Area Community Hospitals – 2012
Source: CTR. FOR HEALTH INFO. & ANALYSIS, HOSPITAL DATA ON GROSS PATIENT SERVICE REVENUE, FY10-FY12 (HPC Analysis).
When the HPC examined payer mix by PSA, similar patterns emerged.145
In Hallmark’s
PSA, both Hallmark-LMH and Hallmark-MWH had larger shares of government payer
discharges (84% and 73%, respectively) and lower shares of commercial payer discharges (13%
and 25%, respectively) than area community hospitals (68% government payer, and 31%
commercial). Similarly, in NSMC’s PSA, both NSMC hospitals had higher government and
lower private payer mixes than area community hospitals (NSMC-Salem and NSMC-Union had
72% and 76% government payer discharges and 27% and 19% commercial discharges,
respectively. Other local community hospitals averaged approximately 70% government payer
discharges and 28% commercial discharges). 145
As mentioned previously, the HPC generally defines a hospital PSA to be the contiguous area closest to a
hospital from which the hospital draws 75% of its commercial discharges. See infra note 161. A review of payer
mix by PSA is instructive because it focuses on a fixed population (the residents of a hospital’s PSA). Within that
fixed population, we examine the cross-section that each hospital serves, and the payer mix of that cross-section.
For example, in Hallmark’s PSA, residents “used” or “needed” 48,269 discharges in 2012. We then analyze the
payer mix of the share (or cross-section) of those total PSA discharges provided by different categories of hospitals
that serve residents of the PSA: Hallmark hospitals (LMH and MWH); NSMC hospitals (Salem and Union); other
area community hospitals (Cambridge Health Alliance, Mount Auburn, and Winchester); and tertiary hospitals
(those with a case mix index of 1.1 or more). In the NSMC PSA, residents used 32,047 discharges in 2012. The
hospitals serving residents of the NSMC PSA include NSMC hospitals (Salem and Union); Hallmark hospitals;
other area community hospitals (Northeast hospitals); and tertiary hospitals.
24%28%
39% 42% 45%
57%
25%
43%
45% 40%42%
35%49%
23%
14% 16% 10%6%
0% 4%0% 0% 0% 0%2% 2% 2% 1% 3% 1%
0%
10%
20%
30%
40%
50%
60%
70%
80%
90%
100%
Cambridge HealthAlliance
North Shore MedicalCenter
Hallmark Hospitals Northeast HealthSystem
Mount AuburnHospital
Winchester Hospital
Self Pay/Other
OtherGovernment
Medicaid/CHIP
Medicare
Commercial

38
The HPC also reviewed the mix of behavioral health discharges by payer at area general
acute care community hospitals in 2012.146
As shown in the chart below, Medicare patients were
a substantial proportion of the behavioral health discharges at Hallmark-LMH (86%). This is
higher than the combined percentage of Medicare and Medicaid/CHIP behavioral health
discharges at other local community hospitals (79%), and is likely related to Hallmark-LMH
psychiatric beds being principally designated for geriatric-psychiatry patients. Both Hallmark
hospitals also had a lower mix of commercial behavioral health discharges than either of the
NSMC hospitals.
Inpatient Behavioral Health Payer Mix for Area Community Hospitals – 2012 Discharges
Source: 2012 MHDC DISCHARGE DATA, BEHAVIORAL HEALTH DISCHARGES (ALL HOSPITALS, COMMERCIAL AND NON-COMMERCIAL
PAYERS)
As shown above, NSMC-Union – where the parties propose to consolidate all inpatient
behavioral health services – had the highest mix (41%) of commercial behavioral health
discharges of any area hospital. The HPC also reviewed the payer mix of all Partners general
acute care hospitals compared to the average payer mix across all general acute care hospitals in
Massachusetts, and found that NSMC-Union has a significantly higher mix of commercial
behavioral health discharges than the statewide average of 31%.
146
To allow for direct comparison between similar area community hospitals, this analysis was not restricted to a
PSA region, see supra note 123. Other community hospitals examined in this analysis were Mount Auburn, CHA,
Addison-Gilbert, Beverly, and Winchester.
20%
32%
47%
0%1%
9%
25%
86%
33%
5%
40%
0%0%
0% 2%
26%
41%
24%
26%
47%
31%
0%2%3% 1%
0%
10%
20%
30%
40%
50%
60%
70%
80%
90%
100%
Other AreaCommunity
Hospitals
Hallmark-LMH Hallmark-MWH NSMC-Salem NSMC-Union
Pe
rcen
t o
f D
isch
arge
s
Self Pay/Other
Other Government
Medicaid/CHIP, CommonwealthCare, Health Safety Net
Medicare
Private/Commercial
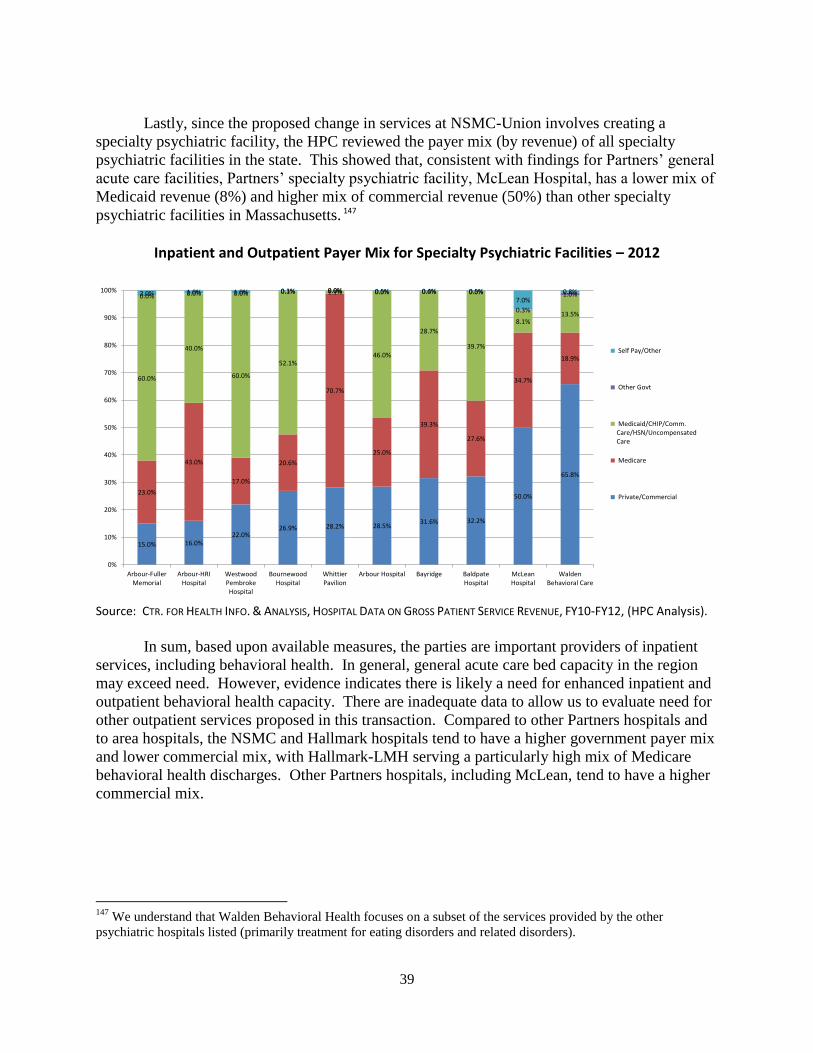
39
Lastly, since the proposed change in services at NSMC-Union involves creating a
specialty psychiatric facility, the HPC reviewed the payer mix (by revenue) of all specialty
psychiatric facilities in the state. This showed that, consistent with findings for Partners’ general
acute care facilities, Partners’ specialty psychiatric facility, McLean Hospital, has a lower mix of
Medicaid revenue (8%) and higher mix of commercial revenue (50%) than other specialty
psychiatric facilities in Massachusetts. 147
Inpatient and Outpatient Payer Mix for Specialty Psychiatric Facilities – 2012
Source: CTR. FOR HEALTH INFO. & ANALYSIS, HOSPITAL DATA ON GROSS PATIENT SERVICE REVENUE, FY10-FY12, (HPC Analysis).
In sum, based upon available measures, the parties are important providers of inpatient
services, including behavioral health. In general, general acute care bed capacity in the region
may exceed need. However, evidence indicates there is likely a need for enhanced inpatient and
outpatient behavioral health capacity. There are inadequate data to allow us to evaluate need for
other outpatient services proposed in this transaction. Compared to other Partners hospitals and
to area hospitals, the NSMC and Hallmark hospitals tend to have a higher government payer mix
and lower commercial mix, with Hallmark-LMH serving a particularly high mix of Medicare
behavioral health discharges. Other Partners hospitals, including McLean, tend to have a higher
commercial mix.
147
We understand that Walden Behavioral Health focuses on a subset of the services provided by the other
psychiatric hospitals listed (primarily treatment for eating disorders and related disorders).
15.0% 16.0%22.0%
26.9% 28.2% 28.5%31.6% 32.2%
50.0%
65.8%
23.0%
43.0%
17.0%
20.6%
70.7%
25.0%
39.3%
27.6%
34.7%
18.9%
60.0%
40.0%
60.0%
52.1%
1.1%
46.0%
28.7%
39.7%
8.1%13.5%
0.0% 0.0% 0.0% 0.1% 0.0% 0.0% 0.0% 0.0%
0.3%
1.0%2.0% 1.0% 1.0% 0.3% 0.0% 0.5% 0.4% 0.5%7.0%
0.8%
0%
10%
20%
30%
40%
50%
60%
70%
80%
90%
100%
Arbour-FullerMemorial
Arbour-HRIHospital
WestwoodPembrokeHospital
BournewoodHospital
WhittierPavilion
Arbour Hospital Bayridge BaldpateHospital
McLeanHospital
WaldenBehavioral Care
Self Pay/Other
Other Govt
Medicaid/CHIP/Comm.Care/HSN/UncompensatedCare
Medicare
Private/Commercial

40
IV. IMPACT PROJECTIONS (2014 ONWARD)
Chapter 224 directs the HPC to enhance the transparency of significant changes to our
health care market, given that provider alignments and consolidations impact health care system
performance and levels of medical spending148
As discussed in the Introduction, the purpose of
this report is to fulfill this important transparency function, by advancing an evidentiary record
that can inform and complement other work being done in the Commonwealth to monitor and
oversee our health care market. For example, the recent proposed consent judgment filed by the
AGO, Partners, and related health care providers concerning Partners’ market conduct and
expansion plans explicitly requires the AGO and Partners to confer on mitigating any material
price impacts identified by the HPC in this CMIR.
We understand the AGO Settlement limits average price growth across all Partners
providers to no more than the rate of general inflation for the next 6.5 years, and separately holds
the South Shore providers, as an individual group, to this same cap. Since the current agreement
does not separately cap the prices of the Hallmark providers, we understand that Hallmark’s
prices could grow in excess of general inflation, so long as the impact of that increase was
allocated across the rest of Partners’ community network. The findings of this report thus bear
on the need for mitigation of Hallmark-specific price impacts. While price increases resulting
from this transaction would not necessarily result in a net increase in average price growth across
the Partners network, they would be anticipated to set a new, permanent baseline upon which
future price increases would be negotiated, including prices negotiated after the expiration of the
settlement, and would similarly contribute to an increased total medical spending baseline in
northeastern Massachusetts.
Similarly, we understand that other material price effects, such as changes in site of
patient care across differently priced providers – especially for patients in PPO and non-risk
HMO/POS insurance products – are not fully encompassed by the current agreement. Over time,
the increased spending baseline from such site of care effects will impact consumers and payers
in this region, as well as providers who refer their patients to Hallmark facilities and are
increasingly at risk for these patients’ total medical expenses. Other providers will also have to
compete with the effect of any additional spending Hallmark is able to do as a result of increased
revenue and/or capital resources from the proposed transaction, such as increased spending on
physician recruitment. The remainder of this report examines the anticipated cost, quality, and
access impacts of this proposed transaction.
148
See generally PHS-SSH-HARBOR FINAL CMIR REPORT, supra note 23; ProMedica Health System, Inc. v. FTC,
No. 12-3583, 2014 U.S. App. LEXIS 7500 (6th Cir. Apr. 22, 2014); FTC v. St. Luke’s Health Sys. Ltd., No. 1:13-
CV-00116-BLW (D. Id. Jan. 24, 2014).
41
A. COST IMPACT
One of the HPC’s central responsibilities is to monitor the Commonwealth’s progress in
meeting the health care cost growth benchmark set forth in Chapter 224.149
Growth in total
medical spending is driven by four principal factors: unit price, utilization, provider mix, and
service mix. Provider consolidations or alignments can affect all of these factors, resulting in:
Increased bargaining leverage, or shifts in incentives to use existing bargaining leverage,
which allow providers to negotiate higher commercial prices and other favorable contract
terms;
Changes in physician, hospital, or other facility prices as consolidations or alignments
change the affiliations of provider groups;
Changes in site of care, or use of differently priced providers, as physicians shift
utilization in response to consolidations or alignments; and
Changes in the nature or amount of services patient populations utilize as a result of
proposed care delivery changes.
Provider consolidations and alignments can also result in changes which have the potential to
impact total medical spending indirectly, such as increased investments in services and facilities
or operational efficiencies that decrease overhead costs. These changes will impact total medical
spending only insofar as the provider chooses to pass on its costs or savings to payers and
consumers when negotiating future reimbursement rates.
We examined each of these mechanisms for its potential cost impact150
and found:
Market Structure
This transaction will reinforce Partners’ position as the provider with the highest share of
inpatient and PCP services in its northeastern Massachusetts service areas and will
strengthen Partners’ ability and incentives to negotiate price increases and other favorable
contract terms for Hallmark.
Unit Price
As the Hallmark physicians become more tightly integrated with Partners,151
changes in
physician prices are anticipated to increase total medical spending in northeastern
Massachusetts.
149
MASS. GEN. LAWS ch. 6D, § 9 (2012) (requiring the HPC to establish annually “a health care cost growth
benchmark for the average growth in total health care expenditures in the commonwealth,” pegged to the growth
rate of the gross state product). 150
Our cost impact analysis is based primarily on data from the three largest payers, who represent 80% of the
commercial market. As such, our cost projections tend to underestimate the total dollar impact to commercial
spending. 151
See Affiliation Agreement, supra note 7, at Art. 5.6.1. After the effective date of the transaction, Hallmark
medical staff physicians who are “interested in a more integrated relationship” will be given a choice of being
42
If Partners seeks parity between Hallmark’s prices and those at its owned community
hospitals, these changes in hospital prices will increase total medical spending in
northeastern Massachusetts.
Services at the facilities the parties propose will be licensed and operated by MGH are
expected to be billed at higher rates as a result of this transaction, increasing total medical
spending in northeastern Massachusetts.
Over the life of any Partners-wide price cap, that cap should successfully constrain the net
impact of increases in the prices of Hallmark providers, requiring that such increases do not
result in average price growth across Partners’ community network that exceeds general
inflation. At the same time, without an individual price cap for Hallmark providers, those
providers, as shown below, will likely experience price growth much faster than the rate of
general inflation as a result of this transaction, with significant consequences for total
medical spending in this region, particularly following expiration of the AGO Settlement.152
We anticipate such price increases would set a permanently increased baseline upon which
future price increases would be negotiated, and also permanently increase total medical
spending in northeastern Massachusetts.
Provider Mix
Changes in site of care/referral patterns are unlikely to result in significant savings. If
Partners seeks rate increases for Hallmark providers, anticipated changes in referral
patterns to higher priced providers will increase total medical spending.
Utilization
The parties have outlined a set of PHM strategies that have the potential to reduce
unnecessary utilization and wasteful spending. However, the scope of potential savings
from these initiatives is likely smaller than projected by the parties and is not expected to
offset anticipated increases in total medical spending.
directly employed by either Hallmark Health Medical Associates (HHMA), Partners’ community physician
organization (newly created), or the Massachusetts General Physicians Organization (MGPO) on an exception basis.
Id. 152
Without lasting change to the market structures that underlie bargaining leverage, price caps on their own may
not be effective in keeping costs down. In other circumstances where providers have been subject to a price cap,
prices have risen after the cap’s expiration. See, e.g., Jeff Engel, Spectrum Health, Metro Health, and St. Mary’s
Are Charging More for Hospital Services, GRAND RAPIDS PRESS, July 3, 2010, available at
http://www.mlive.com/business/west-michigan/index.ssf/2010/07/spectrum_health_metro_health_a.html (describing
8% price increases at Spectrum Health after the expiration of a seven year price cap set forth in FTC v. Butterworth
Health Corp., 946 F. Supp. 1285 (W.D. Mich. 1996)).
43
1. This Transaction will Reinforce Partners’ Position as the Provider with the Highest
Share of Inpatient and PCP Services in its Northeastern Massachusetts Service Areas
and Will Strengthen Partners’ Ability and Incentives to Negotiate Price Increases and
Other Favorable Contract Terms.
The HPC examined whether the proposed transaction will enhance the parties’ ability to
charge supracompetitive rates by studying market shares and anticipated changes in market
concentration.153,
154
As noted in Part II, Partners and Hallmark are already contracting affiliates
and Partners already negotiates rates with most of the major payers in Massachusetts for
Hallmark’s hospitals and physicians. Thus, whether the proposed transaction is likely to create
upward pressure on rates will depend on both the structural changes associated with the
transaction – as measured by the market share and concentration analyses below – and the extent
to which Partners already has incentives to negotiate for Hallmark’s rates as if the two were fully
financially integrated.
Joint contracting and full financial integration embody different structures and bargaining
incentives. For example, Partners does not currently “own” Hallmark’s revenue, and as such
does not directly profit if Hallmark’s margins or volume increase. Thus, Partners’ current
incentives to negotiate Hallmark’s rates are likely different from Partners’ incentives to negotiate
rates for entities with which Partners is fully financially integrated (e.g., hospitals that it owns),
where Partners would directly profit from increased volume or margins. Upon full financial
ownership of Hallmark, Partners would likely have increased alignment of both ability and
incentives to command higher rates for Hallmark.155
At the same time, given that the parties
have a preexisting joint contracting relationship, we would not expect the changes in leverage
and incentives here to be as great as a situation in which the parties had no preexisting
relationship. Our structural analysis therefore assesses the range of impact the proposed
transaction is likely to have on negotiating leverage and incentives.156
a. Market Shares
As described in the PHS-SSH-Harbor Final CMIR Report and the Lahey-Winchester
Final CMIR Report, commercial prices for health care services are established through contract
negotiations between payers and providers. The results of these negotiations – prices that payers
will pay for services as well as other contractual terms – are influenced by the bargaining
153
We also examined anticipated changes in patient flow patterns if the Hallmark hospitals were to become
unavailable to consumers (diversion analysis), which provided results consistent with our concentration analysis. 154
To provide a public analysis of the likely nature of a transaction’s competitive effects, our analysis mirrors many
of the initial steps that would likely be included in an antitrust investigation, without repeating all of the econometric
modeling of changes in competition (e.g., “willingness-to-pay” analysis) that might be pursued in a law enforcement
context. 155
Hallmark’s revenue does not currently directly impact Partners’ revenue, and Hallmark’s HMO/POS and PPO
rates are below Partners’ community hospital HMO/POS and PPO rates. See supra Sections III.A.3 and III.A.4. 156
Although additional review might be able to more precisely estimate the degree to which the parties’ existing
joint contracting relationship differs from full financial integration, that analysis and thus the exact change in pricing
incentives is beyond the scope of this time-limited review.
44
leverage of the negotiating parties. A transaction may have competitive effects if it changes the
bargaining leverage or incentives of the negotiating parties.
An analysis of competitive effects often begins with an assessment of relevant markets:157
Product Market: Based on the services offered by Partners and Hallmark and the
availability of robust data, we evaluated potential competitive effects on general acute care
inpatient services and primary care services for patients living in Hallmark’s primary service
area.158,159
To provide a more detailed analysis, we also reviewed the market for general acute
care inpatient services subdivided into tertiary/quaternary acute care inpatient services (tertiary
services) and non-tertiary/non-quaternary acute care inpatient services (non-tertiary services).160
Geographic Market: Our analysis focuses on the likely impact of the proposed
transaction on consumers living in the Hallmark and NSMC hospital Primary Service Areas
(PSAs),161
using information on patient-based market shares. This information shows the
hospitals that patients in each of the Hallmark and NSMC PSAs choose for certain general acute
inpatient hospital care. We also study inpatient market shares in the primary and secondary
service areas defined by the parties.162
In addition, we studied market shares in the primary care
service area of Hallmark.
As described in Section III.A.2, Partners and Hallmark respectively have the largest
(32.3%) and third largest (15.2%) shares of commercial discharges in Hallmark’s hospital PSA.
Combined, they capture approximately 48% of the commercial discharges in the PSA. As noted
in Part II, the parties contract jointly with most major payers for the majority of Hallmark’s
business. However, the parties do not share common financial ownership (e.g., Partners does not
own Hallmark’s revenue, and as such does not directly profit if Hallmark’s margins or volume
increase), and Hallmark negotiates with some commercial payers separately from Partners.
Thus, although Partners and Hallmark are financially and contractually related, their financial
interests are not entirely aligned. For that reason, it is likely that Partners’ current competitive
significance in the marketplace is reflected in an effective market share that is between these
157
A relevant market includes the narrowest set of products (or hospitals) and the narrowest geography in which a
hypothetical monopolist over all hospitals could sustain a small but significant increase in price, or “SSNIP.” 158
This analysis focuses on hospital discharges for general acute care services, excluding normal newborns
(including normal newborns would effectively double-count a single delivery as two discharges), non-acute
discharges (e.g., discharges with a length of stay of greater than 180 days, rehabilitation discharges), and out-of-state
patients. 159
Given the importance of inpatient care to the health care market, competitive effects in the market for inpatient
general acute care services may also be probative of competitive effects in other, related health care markets. 160
For the purposes of these analyses, tertiary care is defined as the set of DRGs that are primarily performed at
facilities with a case mix index of 1.0 or more. 161
The HPC applied its general method for defining a hospital PSA, which focuses on the contiguous zip codes
closest to the hospital from which the hospital draws 75% of its commercial discharges. For more information on
the HPC’s PSA methodology, see PHS-SSH-HARBOR FINAL REPORT, supra note 23, at 37, n.115 and 38, n.118. 162
The parties have provided the HPC with the list of zip codes they have identified to be in each of their primary
and secondary service areas. We understand the primary service area to be defined as the zip codes from which the
hospital draws 75% of all of its discharges, and the secondary service area to be defined as the zip codes from which
the hospital draws 90% of all of its discharges.
45
lower and upper market share estimates (i.e., between 32.3% and 48%). As a result of the
transaction, Partners’ market share will shift entirely to the upper bound (48%), which would
reinforce Partners’ position as the provider with the largest share of inpatient services in this
PSA and would align Partners’ and Hallmark’s incentives such that Partners would have both the
ability and incentives to command higher rates for Hallmark. The next closest competitors for
commercial inpatient services in Hallmark’s PSA are Lahey with 22.8% of commercial
discharges, followed by Beth Israel with 9.2% of commercial discharges.163
As also shown in Section III.A.2, in NSMC’s PSA, Partners and Hallmark respectively
have the largest (58.9%) and fifth largest (1.9%) shares of commercial discharges, or
approximately 61% combined. Lahey has the second largest market share in this PSA, with
28.9% of commercial discharges, and Beth Israel has the third largest share, with 4.0% of
commercial discharges.164
The HPC also analyzed share of PCP services in Hallmark’s primary care PSA, using
APCD data. As discussed in Section III.A.2, we found that Partners physicians, including
Hallmark, have the largest share of PCP services in Hallmark’s primary care PSA, as measured
by either revenue (approximately 40%) or visits (approximately 35%).165
The parties have
described plans to recruit 25 net new PCPs to Hallmark, who could further increase PCHI’s share
of PCP services in Hallmark’s primary care PSA.
b. Market Concentration for Inpatient Services
We calculated market concentration before and after the proposed transaction in the
Hallmark and NSMC hospital PSAs using the Herfindahl–Hirschman Index (HHI).166,
167
The
change in concentration associated with a transaction is probative of the likely impact of the
163
These results are somewhat more pronounced in the Hallmark PSA as defined by the parties. Using their
definition, Partners and Hallmark respectively have the largest (28.7%) and second largest (26.0%) shares of all
discharges. Combined, they would capture nearly 55% of all discharges in the PSA. The next closest competitor in
terms of inpatient share would be Lahey, with 15.3% of all discharges, followed by Beth Israel Deaconess Care
Organization (BIDCO), with 9.1% of all discharges. 164
The results are also more pronounced in the NSMC PSA as defined by the parties. Using their primary service
area definition, Partners and Hallmark respectively have the largest (70.8%) and fourth largest (1.7%) shares of all
discharges. Combined, they would capture about 73% of all discharges in the PSA. The next closest competitor in
terms of inpatient market share in NSMC’s PSA would be Lahey, with 19.4% of all discharges, followed by Beth
Israel, with 2.3% of all discharges. Using their secondary service areas, Partners and Hallmark respectively have the
largest (35.6%) and third largest (9.8%) shares of all discharges. 165
Analyzed separately, Hallmark physicians have approximately 14% to 16% of primary care revenue and 13% to
15% of primary care visits in Hallmark’s primary care PSA. 166
The HHI is a commonly used measure of market concentration and an indicator of the amount of competition
among systems. The HHI is calculated by squaring the market share of each firm competing in the market and then
summing the resulting numbers. For example, for a market consisting of four firms with shares of 30, 30, 20, and 20
percent, the HHI is 2,600 (900 + 900 + 400 + 400 = 2,600). HHIs range from near 0 (perfect competition) to 10,000
(one firm with a monopoly). When firms are equally sized, the HHI is equal to 100 times the per-firm market share.
For example, two firms with a 50% share each give rise to an HHI of 5,000. Three firms with 33.3% share each
give rise to an HHI of 3,333, and so on. 167
We did not include a similar calculation of market concentration for primary care due to data limitations. In
particular, system affiliations are unconfirmed for a number of primary care physicians in that service area.

46
transaction on market power and the ability of the parties to negotiate higher prices.168
The
Department of Justice (DOJ) and the Federal Trade Commission (FTC) use market shares within
PSAs and HHIs as initial screens for determining whether a given transaction raises competitive
concerns and warrants further scrutiny.169
DOJ/FTC Horizontal Merger Guideline HHI Thresholds170
Post-Merger Market HHI Δ
in HHI Presumption
Moderately Concentrated 1,500 to 2,500
>100 Potentially raises significant competitive concerns and often warrants scrutiny
Highly Concentrated > 2,500
100 to 200 Potentially raises significant competitive concerns and often warrants scrutiny
> 200 Presumed to be likely to enhance market power
Below, we summarize the pre-merger and post-merger inpatient HHIs in the Hallmark
and NSMC service areas under both the HPC definition of PSAs and the parties’ definition of
PSAs. We present a lower and upper bound calculation of these HHIs. In the “lower bound”
scenario, the HHIs presented do not include non-owned hospital contracting affiliates of a
provider system in that system’s market share. In the “upper bound” scenario, such non-owned
contracting affiliates are included in the affiliated system’s market share.171
168
For example, the FTC and DOJ have noted that “[m]ost studies of the relationship between competition and
hospital prices generally find increased hospital concentration is associated with increased price.” FED. TRADE
COMM’N & U.S. DEP’T OF JUSTICE, IMPROVING HEALTHCARE: A DOSE OF COMPETITION 1, 15 (July 2004), available
at http://www.ftc.gov/reports/healthcare/040723healthcarerpt.pdf. 169
See, e.g., FED. TRADE COMM’N & U.S. DEP’T OF JUSTICE, PROPOSED STATEMENT OF ANTITRUST ENFORCEMENT
POLICY REGARDING PARTICIPATING IN THE MEDICARE SHARED SAVINGS PROGRAM 6 (2011), available at
http://www.justice.gov/atr/public/guidelines/269155.pdf. See also 76 FED. REG. 67026, 67028 (Oct. 28, 2011),
available at http://www.gpo.gov/fdsys/pkg/FR-2011-10-28/pdf/2011-27944.pdf. 170
See U.S. DEP’T OF JUSTICE. & FED. TRADE COMM’N, HORIZONTAL MERGER GUIDELINES (2010), available at
http://www.justice.gov/atr/public/guidelines/hmg-2010.pdf. 171
The HHI calculations are a function of the merging parties’ shares; thus, there is a single pre- and post-merger
HHI in the upper bound analysis because the Hallmark and Partners shares are considered to be combined regardless
of whether the merger has occurred. Note that because Emerson Hospital is also included in the Partners share in
the upper bound analysis, the post-transaction HHI in the lower bound and upper bound scenarios are not identical.
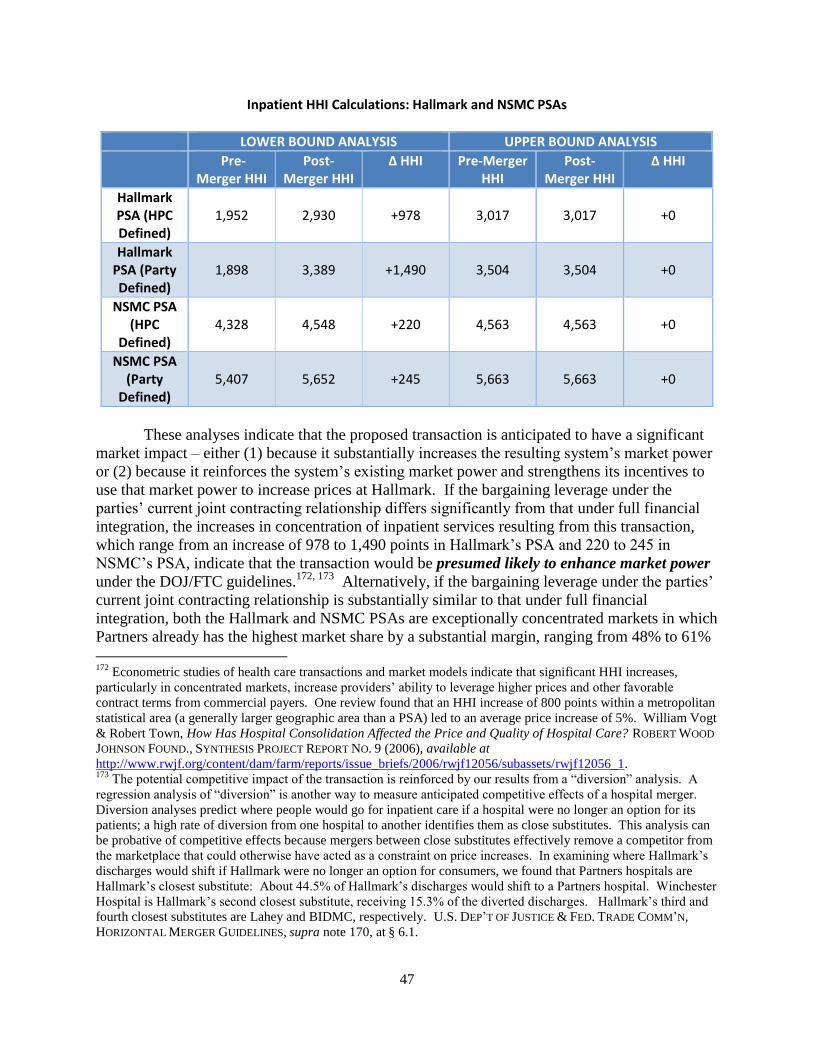
47
Inpatient HHI Calculations: Hallmark and NSMC PSAs
LOWER BOUND ANALYSIS UPPER BOUND ANALYSIS
Pre-Merger HHI
Post-Merger HHI
∆ HHI Pre-Merger HHI
Post-Merger HHI
∆ HHI
Hallmark PSA (HPC Defined)
1,952 2,930 +978 3,017 3,017
+0
Hallmark PSA (Party Defined)
1,898 3,389 +1,490 3,504 3,504
+0
NSMC PSA (HPC
Defined) 4,328 4,548 +220 4,563 4,563
+0
NSMC PSA (Party
Defined) 5,407 5,652 +245 5,663 5,663
+0
These analyses indicate that the proposed transaction is anticipated to have a significant
market impact – either (1) because it substantially increases the resulting system’s market power
or (2) because it reinforces the system’s existing market power and strengthens its incentives to
use that market power to increase prices at Hallmark. If the bargaining leverage under the
parties’ current joint contracting relationship differs significantly from that under full financial
integration, the increases in concentration of inpatient services resulting from this transaction,
which range from an increase of 978 to 1,490 points in Hallmark’s PSA and 220 to 245 in
NSMC’s PSA, indicate that the transaction would be presumed likely to enhance market power
under the DOJ/FTC guidelines.172, 173
Alternatively, if the bargaining leverage under the parties’
current joint contracting relationship is substantially similar to that under full financial
integration, both the Hallmark and NSMC PSAs are exceptionally concentrated markets in which
Partners already has the highest market share by a substantial margin, ranging from 48% to 61%
172
Econometric studies of health care transactions and market models indicate that significant HHI increases,
particularly in concentrated markets, increase providers’ ability to leverage higher prices and other favorable
contract terms from commercial payers. One review found that an HHI increase of 800 points within a metropolitan
statistical area (a generally larger geographic area than a PSA) led to an average price increase of 5%. William Vogt
& Robert Town, How Has Hospital Consolidation Affected the Price and Quality of Hospital Care? ROBERT WOOD
JOHNSON FOUND., SYNTHESIS PROJECT REPORT NO. 9 (2006), available at
http://www.rwjf.org/content/dam/farm/reports/issue_briefs/2006/rwjf12056/subassets/rwjf12056_1. 173
The potential competitive impact of the transaction is reinforced by our results from a “diversion” analysis. A
regression analysis of “diversion” is another way to measure anticipated competitive effects of a hospital merger.
Diversion analyses predict where people would go for inpatient care if a hospital were no longer an option for its
patients; a high rate of diversion from one hospital to another identifies them as close substitutes. This analysis can
be probative of competitive effects because mergers between close substitutes effectively remove a competitor from
the marketplace that could otherwise have acted as a constraint on price increases. In examining where Hallmark’s
discharges would shift if Hallmark were no longer an option for consumers, we found that Partners hospitals are
Hallmark’s closest substitute: About 44.5% of Hallmark’s discharges would shift to a Partners hospital. Winchester
Hospital is Hallmark’s second closest substitute, receiving 15.3% of the diverted discharges. Hallmark’s third and
fourth closest substitutes are Lahey and BIDMC, respectively. U.S. DEP’T OF JUSTICE & FED. TRADE COMM’N,
HORIZONTAL MERGER GUIDELINES, supra note 170, at § 6.1.
48
of commercial discharges across the two PSAs. This degree of existing market power raises its
own set of concerns that Partners could use its existing market power to seek price increases
once Partners owns Hallmark and profits directly from increased Hallmark revenue.
In the next section, we model the impact of this market power on total medical spending
in northeastern Massachusetts as a result of anticipated changes in physician, hospital, and
ambulatory facility prices.174
We understand that the proposed consent judgment would allow
payers to negotiate for all or only certain components of the Partners network (AMCs,
community hospitals and their physicians, South Shore Hospital and related physicians, and the
Hallmark hospitals and their physicians), which is designed to mitigate Partners’ bargaining
leverage. We are hopeful that this constraint of Partners’ current contracting practices will
promote a more competitive market and lead to lower health care costs, but we recognize the
impact of the constraint will depend, among other considerations, on whether and to what extent
payers vigorously pursue it, and on how the market responds.
As noted in the introduction to Section IV.A, the AGO Settlement proposes a price cap
that should successfully constrain the net impact of growth in Hallmark’s prices for the next 6.5
years by requiring that such increases do not result in average price growth across Partners’
network that exceeds general inflation. At the same time, without an individual price cap for
Hallmark providers, those providers, as shown below, will likely experience price growth much
faster than the rate of general inflation as a result of this transaction, with significant
consequences for total medical spending in this region, particularly following expiration of the
AGO Settlement. We anticipate such price increases would set a permanently increased baseline
upon which future price increases would be negotiated, and also permanently increase total
medical spending in northeastern Massachusetts.
2. As the Hallmark Physicians Become More Tightly Integrated with Partners, There
Will Likely Be Changes in Prices that Set an Increased Baseline Upon Which Future
Price Increases Would Be Negotiated, and that Increase Baseline Total Medical
Spending in Northeastern Massachusetts.
As described above in Section III.A.III.4, Partners’ physician groups have some of the
highest prices in northeastern Massachusetts. Although they contract through PCHI, Hallmark
physicians do not currently receive prices as high as many Partners groups, including its
employed or “integrated” groups. As a key element of the proposed transaction is the “tighter
integration” of Hallmark and Partners physicians,175
one mechanism by which we anticipate this
174
In these sections, we do not repeat all of the econometric modeling of changes in competition (e.g., “willingness-
to-pay” analysis) that might be pursued in a law enforcement context to assess the magnitude of the price increase
that could be sought by the parties as result of increased bargaining leverage. Rather, we model only the likely and
potentially conservative scenario if Partners were to seek parity in the rates for Hallmark physicians and hospitals
consistent with the rates of its currently owned physicians and hospitals. 175
See Affiliation Agreement, supra note 7, at Art. 5.6.1. After the effective date of the transaction, Hallmark
medical staff physicians who are “interested in a more integrated relationship” will be given a choice of being
directly employed by either Hallmark Health Medical Associates (HHMA), Partners community physician
organization (newly created), or the Massachusetts General Physicians Organization (MGPO) on an exception basis.
49
transaction will increase total medical spending in northeastern Massachusetts is through
increases in Hallmark physicians’ prices to these higher “integrated” PCHI prices.
The HPC interviewed four major commercial payers to develop a deeper understanding
of their contracts with PCHI. In Partners’ contracts with the three largest commercial payers,
there is a tiered price structure depending on the type of physician and the classification of the
physician’s RSO. Academic rates (for physicians in the Brigham and Women’s Physician
Organization and Massachusetts General Physician Organization) are the highest, followed very
closely by integrated rates (generally, for PCHI’s employed physicians in the community). Non-
employed PCHI community physicians receive lower rates – sometimes substantially lower –
known generally as “affiliated” rates.176
Because Hallmark is an affiliated RSO, all HHPHO
physicians currently receive affiliated rates, the lowest rate tier in the PCHI network.
The three major payers noted there is a modest variation in the potential timing for
Hallmark’s physicians to move to higher “integrated” rates, so we focused on the conservative
scenario where HHPHO physicians would only receive the higher, integrated rates upon
renegotiation of current contracts (anticipated as soon as late 2014 for one payer and about a year
thereafter for the other two payers). Accordingly, we report on our results separately for two
periods: 2015, when the anticipated increase in rates would only apply to one major payer, and
2016 onward, when the anticipated increase in rates would apply to all three major payers.
We also modeled a range of cost impact based on the number of HHPHO physicians that
would increase to PCHI’s higher, integrated rates. Under a conservative scenario, we model
only the physicians currently employed by Hallmark increasing to PCHI’s integrated rates.177
Under a moderate scenario, we adopt the parties’ position that, post-acquisition, PCHI will more
tightly integrate with Hallmark physicians, ultimately employing a greater proportion of these
physicians. We model the impact if PCHI were to employ and receive higher rates for a similar
proportion of Hallmark physicians as the proportion of physicians currently employed and
receiving higher rates in Partners’ existing community hospital RSOs, North Shore Health
System and Newton-Wellesley. The third scenario posits that all of Hallmark’s physicians would
receive integrated rates.178
The chart below shows the range of cost impact for the three largest
commercial payers. A major national payer that negotiates rates directly with Hallmark has
confirmed the impact could be far greater for payers who likewise currently negotiate with
Hallmark independently of Partners.179
176
PCHI’s AMC rates are up to 4.2% higher than the community “integrated” rates for the three major commercial
payers, and approximately 20-25% higher than Hallmark’s current “affiliated” rates for these payers. 177
This scenario is unrealistically low given the parties’ stated intention to offer employment to a significant
proportion of Hallmark physicians who are not currently employed. 178
This scenario is possible given that the parties intend to offer employment to all Hallmark medical staff
physicians who are “interested in a more integrated relationship.” See Affiliation Agreement, supra note 7, at Art.
5.6.1. A major payer also confirmed they believe this is a realistic scenario given Hallmark’s contracting history
with Partners and Partners’ current approach to physician integration. 179
This payer indicated that its prices for any employed Hallmark physicians would increase by an estimated 200%.
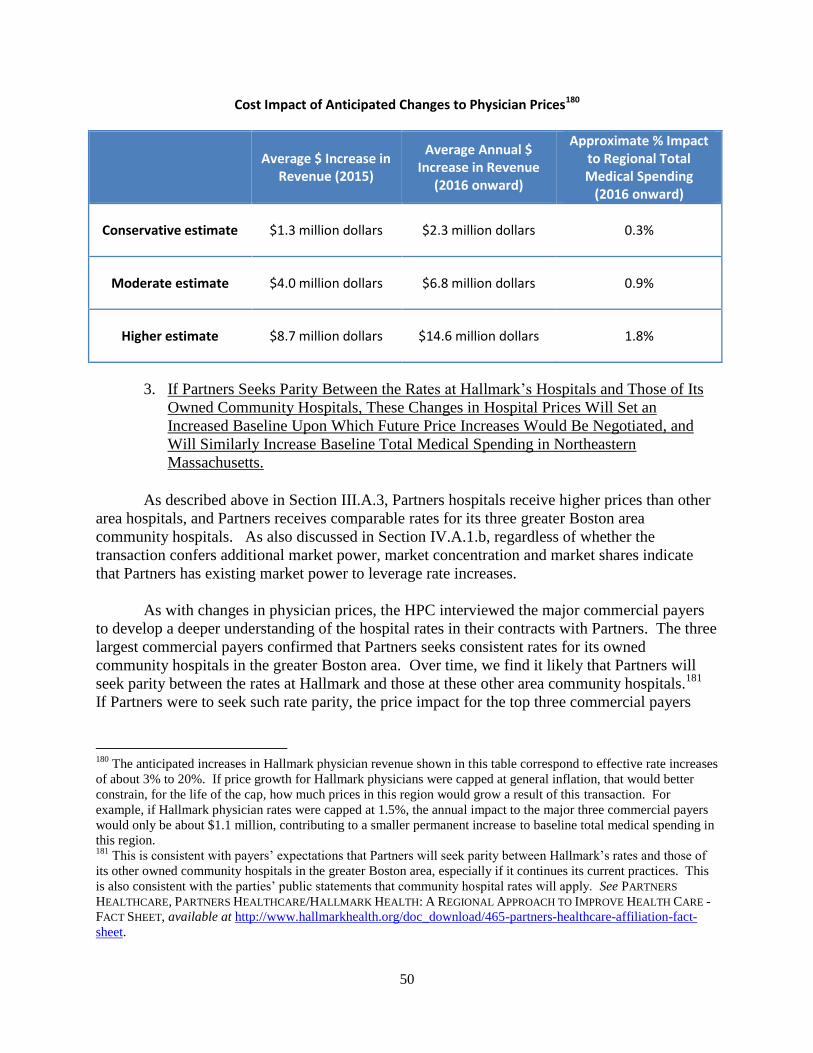
50
Cost Impact of Anticipated Changes to Physician Prices180
Average $ Increase in
Revenue (2015)
Average Annual $ Increase in Revenue
(2016 onward)
Approximate % Impact to Regional Total Medical Spending
(2016 onward)
Conservative estimate $1.3 million dollars $2.3 million dollars 0.3%
Moderate estimate $4.0 million dollars $6.8 million dollars 0.9%
Higher estimate $8.7 million dollars $14.6 million dollars 1.8%
3. If Partners Seeks Parity Between the Rates at Hallmark’s Hospitals and Those of Its
Owned Community Hospitals, These Changes in Hospital Prices Will Set an
Increased Baseline Upon Which Future Price Increases Would Be Negotiated, and
Will Similarly Increase Baseline Total Medical Spending in Northeastern
Massachusetts.
As described above in Section III.A.3, Partners hospitals receive higher prices than other
area hospitals, and Partners receives comparable rates for its three greater Boston area
community hospitals. As also discussed in Section IV.A.1.b, regardless of whether the
transaction confers additional market power, market concentration and market shares indicate
that Partners has existing market power to leverage rate increases.
As with changes in physician prices, the HPC interviewed the major commercial payers
to develop a deeper understanding of the hospital rates in their contracts with Partners. The three
largest commercial payers confirmed that Partners seeks consistent rates for its owned
community hospitals in the greater Boston area. Over time, we find it likely that Partners will
seek parity between the rates at Hallmark and those at these other area community hospitals.181
If Partners were to seek such rate parity, the price impact for the top three commercial payers
180
The anticipated increases in Hallmark physician revenue shown in this table correspond to effective rate increases
of about 3% to 20%. If price growth for Hallmark physicians were capped at general inflation, that would better
constrain, for the life of the cap, how much prices in this region would grow a result of this transaction. For
example, if Hallmark physician rates were capped at 1.5%, the annual impact to the major three commercial payers
would only be about $1.1 million, contributing to a smaller permanent increase to baseline total medical spending in
this region. 181
This is consistent with payers’ expectations that Partners will seek parity between Hallmark’s rates and those of
its other owned community hospitals in the greater Boston area, especially if it continues its current practices. This
is also consistent with the parties’ public statements that community hospital rates will apply. See PARTNERS
HEALTHCARE, PARTNERS HEALTHCARE/HALLMARK HEALTH: A REGIONAL APPROACH TO IMPROVE HEALTH CARE -
FACT SHEET, available at http://www.hallmarkhealth.org/doc_download/465-partners-healthcare-affiliation-fact-
sheet.
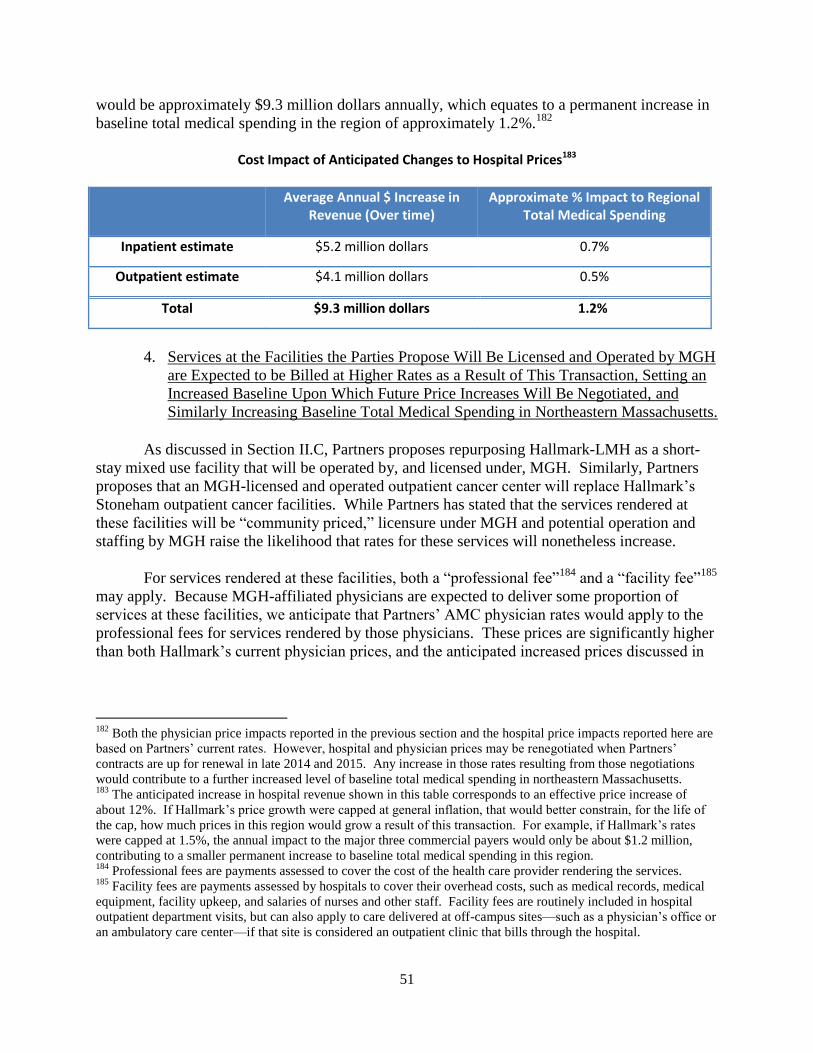
51
would be approximately $9.3 million dollars annually, which equates to a permanent increase in
baseline total medical spending in the region of approximately 1.2%.182
Cost Impact of Anticipated Changes to Hospital Prices183
Average Annual $ Increase in Revenue (Over time)
Approximate % Impact to Regional Total Medical Spending
Inpatient estimate $5.2 million dollars 0.7%
Outpatient estimate $4.1 million dollars 0.5%
Total $9.3 million dollars 1.2%
4. Services at the Facilities the Parties Propose Will Be Licensed and Operated by MGH
are Expected to be Billed at Higher Rates as a Result of This Transaction, Setting an
Increased Baseline Upon Which Future Price Increases Will Be Negotiated, and
Similarly Increasing Baseline Total Medical Spending in Northeastern Massachusetts.
As discussed in Section II.C, Partners proposes repurposing Hallmark-LMH as a short-
stay mixed use facility that will be operated by, and licensed under, MGH. Similarly, Partners
proposes that an MGH-licensed and operated outpatient cancer center will replace Hallmark’s
Stoneham outpatient cancer facilities. While Partners has stated that the services rendered at
these facilities will be “community priced,” licensure under MGH and potential operation and
staffing by MGH raise the likelihood that rates for these services will nonetheless increase.
For services rendered at these facilities, both a “professional fee”184
and a “facility fee”185
may apply. Because MGH-affiliated physicians are expected to deliver some proportion of
services at these facilities, we anticipate that Partners’ AMC physician rates would apply to the
professional fees for services rendered by those physicians. These prices are significantly higher
than both Hallmark’s current physician prices, and the anticipated increased prices discussed in
182
Both the physician price impacts reported in the previous section and the hospital price impacts reported here are
based on Partners’ current rates. However, hospital and physician prices may be renegotiated when Partners’
contracts are up for renewal in late 2014 and 2015. Any increase in those rates resulting from those negotiations
would contribute to a further increased level of baseline total medical spending in northeastern Massachusetts. 183
The anticipated increase in hospital revenue shown in this table corresponds to an effective price increase of
about 12%. If Hallmark’s price growth were capped at general inflation, that would better constrain, for the life of
the cap, how much prices in this region would grow a result of this transaction. For example, if Hallmark’s rates
were capped at 1.5%, the annual impact to the major three commercial payers would only be about $1.2 million,
contributing to a smaller permanent increase to baseline total medical spending in this region. 184
Professional fees are payments assessed to cover the cost of the health care provider rendering the services. 185
Facility fees are payments assessed by hospitals to cover their overhead costs, such as medical records, medical
equipment, facility upkeep, and salaries of nurses and other staff. Facility fees are routinely included in hospital
outpatient department visits, but can also apply to care delivered at off-campus sites—such as a physician’s office or
an ambulatory care center—if that site is considered an outpatient clinic that bills through the hospital.
52
Section IV.A.2 above,186
and would thus increase total medical spending in northeastern
Massachusetts.
The applicable facility fee will also likely increase. First, Partners could seek higher
facility fees—even potentially the fees applicable to the main MGH campus—since these sites
will be licensed through MGH.187
Even if Partners seeks only to apply the level of facility fees
that often apply to its community hospitals and MGH outpatient facilities, for most payers, those
rates are still higher than the facility rates that currently apply to Hallmark-LMH and Hallmark
Stoneham.188
Second, some of the major payers have raised concerns that, where there is a
change in licensure as proposed here, they would not necessarily be able to identify the location
at which services are rendered if the licensed entity bills for services at multiple sites, making
monitoring of any change in facility fees challenging.189
Finally, the contract terms governing
the rates applicable to Partners’ outpatient sites are up for renegotiation in late 2014 and 2015 for
the three major payers. Any change to the contract terms allowing services rendered at these
facilities to be reimbursed under higher fee schedules, whether achieved through increased
bargaining leverage or the exercise of existing bargaining leverage as discussed in Section
IV.A.1, would further increase the level of total medical spending in northeastern Massachusetts
that would likely become the new baseline level of spending in this region.
5. At Current Prices, Anticipated Changes in Referral Patterns are Unlikely to Result in
Significant Savings; if Partners Seeks Rate Increases for Hallmark, Changes in
Referral Patterns will Likely Increase Total Medical Spending.
In addition to changes in rates of reimbursement (unit price), changes in care referral
patterns or use of differently priced providers (provider mix) also impact total medical spending.
The parties have estimated cost savings of between $11.8 million and $24.7 million per year
from intended changes in referral patterns ($1.9 to $4.7 million for inpatient care and $9.9 to $20
million for outpatient care). The parties base this estimate on the assumption that 10% to 25% of
inpatient volume and 25% to 50% of outpatient volume from patients living in Hallmark’s
service area, but who were treated at MGH for given services, would be redirected from MGH to
Hallmark as a result of the transaction.190
This section examines changes in care referral patterns
186
See supra note 83, describing the differences in “AMC” versus community “integrated” and “affiliated” rates.
Because we do not know the proportion of services that would be rendered by MGH-affiliated physicians, we are
unable to estimate an impact on total medical spending. However, we note that the AMC rates are up to 4.2%
higher than the community “integrated” rates for the top three commercial payers, and 20-25% higher than
Hallmark’s current “affiliated” rates for these payers. 187
A major payer has confirmed that the main MGH campus rates currently apply to at least one MGH-licensed
facility outside of Boston. 188
For one major payer, it appears that Hallmark’s current rates at its Stoneham facilities are slightly higher than
rates at some of the MGH outpatient facilities outside of Boston. Overall, however, we anticipate that changes in
facility fees will be cost increasing as outpatient services generally move from being billed at lower Hallmark rates
to higher Partners rates. See supra Section III.A.3. 189
We note that effective payer monitoring of billing practices, including developing the capacity to identify
location of service delivery, is critical to ensure that changes in billing practices do not inappropriately increase total
medical spending for consumers. 190
Specifically, Partners expects redirection of secondary cases in the following service lines: obstetrics and
gynecology, orthopedics, cardiology, oncology, and digestive health. The parties have confirmed that their

53
and finds that, contrary to the parties’ claims, overall redirection of care to Hallmark following
the transaction is much more likely to come from lower-priced competitors than from other
Partners providers.191
a. Inpatient Services
We applied econometric modeling to hospital discharge data to empirically examine the
parties’ claim that Partners’ acquisition of Hallmark will lower spending by leading to a net
decrease in inpatient care at MGH, which is redirected back to the community.192
Focusing on
those cases that could feasibly and appropriately be redirected to community hospitals (i.e.,
secondary, non-emergency cases), we measured how often patients receive such care at Partners
and non-Partners hospitals, controlling for distance and demographics. This allowed us to
measure any differences in the care referral patterns associated with Partners versus non-Partners
hospitals (a so-called “Partners effect”).193
We found consistent and statistically significant results indicating that changes in referral
patterns will be more complex than a one-way redirection of care from Partners AMCs to its
community hospitals. Instead of care redirection exclusively from higher-priced Partners AMCs,
community hospitals owned by Partners receive volume from lower-priced competitors as well,
redirection estimates are goals identified by their clinicians, and do not reflect data from Partners’ experience
acquiring or establishing community-based provider sites. The parties also plan to direct some lower acuity patients
currently seen in the MGH emergency department to new urgent care centers the parties will develop in their joint
service area. Though the parties’ projected savings from this effort is only a small portion of their estimated care
redirection savings, we recognize the potential for urgent care centers to reduce unnecessary emergency department
use and to promote delivery of non-emergent care in more cost-effective settings. 191
This finding is consistent with payer observations that notwithstanding Partners’ claims of lowered spending
from redirecting care from MGH and BWH to Mass General/North Shore Center for Outpatient Care, the Mass
General Cancer Center at Emerson Hospital, and the Vernon Cancer Center at Newton-Wellesley Hospital, they
have not seen net reductions in volume at MGH and BWH or shifts in utilization to Partners community sites that
resulted in lowered spending. 192
We used discharge data and a logit share model to study the determinants of the odds that commercially insured
patients in individual eastern Massachusetts zip codes, for which the closest hospital is not an AMC, choose to go to
their closest hospital, instead of another community hospital, a non-Boston AMC, or a Boston AMC, for their
secondary non-emergency room care. The model controls for zip code fixed effects to account for all zip code-
specific factors that can affect patient choice, including demographics, distance from hospitals, and access to public
transportation. The model also controls for whether the chosen hospital is a Partners hospital and the impact of
distance, in drive time, between the patient zip code and the closest hospital, the closest Partners hospital, the closest
Boston AMC, and the five closest other community hospitals, on the odds that the patients choose the different types
of hospitals, relative to their closest hospital. This econometric model estimates the impact of being a “Partners”
hospital on the odds that patients from individual zip codes chose different types of hospitals (e.g., a Boston AMC)
relative to their closest hospital. Using these estimates, we analyze whether and from where inpatient care would be
redirected to Hallmark if Partners were to acquire Hallmark and operate it like it does its other community
hospitals. We also calculated confidence intervals around our predictions. 193
This model is consistent with the parties’ claims that patient preferences inform care referral patterns and that
Partners’ investments in community hospitals, sharing of programs with those institutions, and enhancement of
those institutions’ offerings, as Partners has done with its community hospitals, will cause patients to more
frequently choose their local hospitals over Partners’ downtown AMCs. By analyzing use patterns around existing
Partners community hospitals like Faulkner, Newton-Wellesley, and NSMC, this model takes into account all of the
reasons why a patient might choose a Partners hospital over a non-Partners hospital or vice versa (e.g., brand,
quality, investments, service offerings).
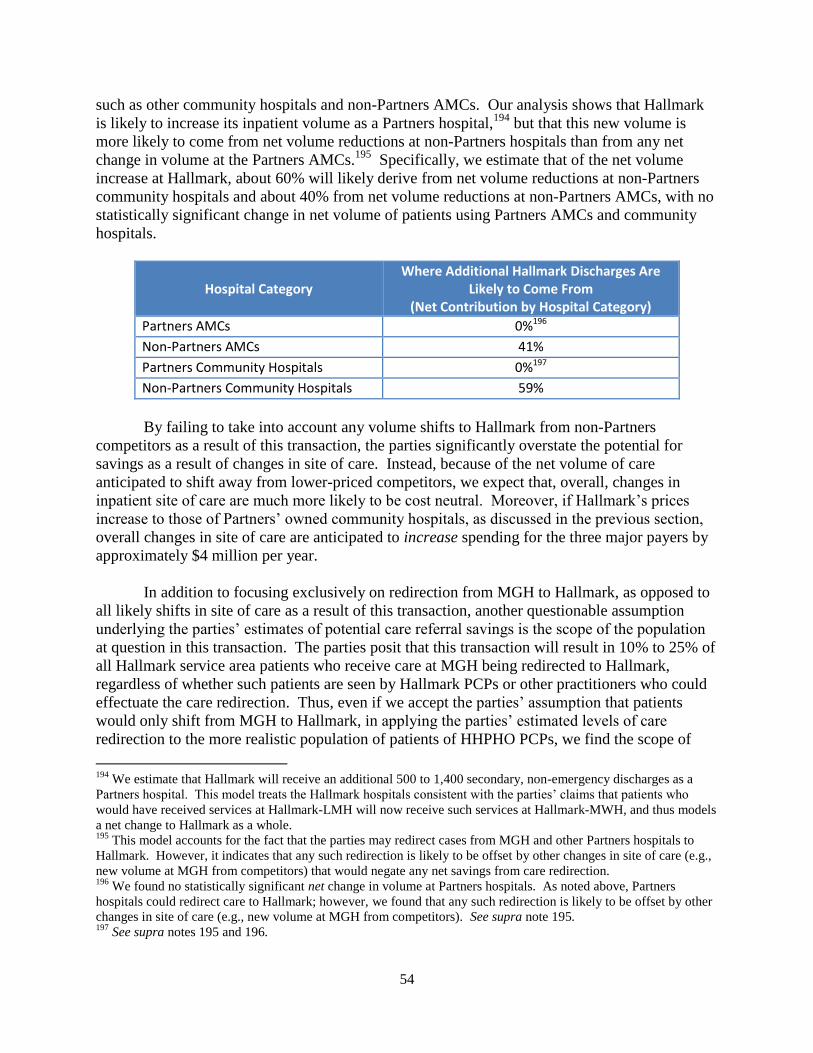
54
such as other community hospitals and non-Partners AMCs. Our analysis shows that Hallmark
is likely to increase its inpatient volume as a Partners hospital,194
but that this new volume is
more likely to come from net volume reductions at non-Partners hospitals than from any net
change in volume at the Partners AMCs.195
Specifically, we estimate that of the net volume
increase at Hallmark, about 60% will likely derive from net volume reductions at non-Partners
community hospitals and about 40% from net volume reductions at non-Partners AMCs, with no
statistically significant change in net volume of patients using Partners AMCs and community
hospitals.
Hospital Category Where Additional Hallmark Discharges Are
Likely to Come From (Net Contribution by Hospital Category)
Partners AMCs 0%196
Non-Partners AMCs 41%
Partners Community Hospitals 0%197
Non-Partners Community Hospitals 59%
By failing to take into account any volume shifts to Hallmark from non-Partners
competitors as a result of this transaction, the parties significantly overstate the potential for
savings as a result of changes in site of care. Instead, because of the net volume of care
anticipated to shift away from lower-priced competitors, we expect that, overall, changes in
inpatient site of care are much more likely to be cost neutral. Moreover, if Hallmark’s prices
increase to those of Partners’ owned community hospitals, as discussed in the previous section,
overall changes in site of care are anticipated to increase spending for the three major payers by
approximately $4 million per year.
In addition to focusing exclusively on redirection from MGH to Hallmark, as opposed to
all likely shifts in site of care as a result of this transaction, another questionable assumption
underlying the parties’ estimates of potential care referral savings is the scope of the population
at question in this transaction. The parties posit that this transaction will result in 10% to 25% of
all Hallmark service area patients who receive care at MGH being redirected to Hallmark,
regardless of whether such patients are seen by Hallmark PCPs or other practitioners who could
effectuate the care redirection. Thus, even if we accept the parties’ assumption that patients
would only shift from MGH to Hallmark, in applying the parties’ estimated levels of care
redirection to the more realistic population of patients of HHPHO PCPs, we find the scope of
194
We estimate that Hallmark will receive an additional 500 to 1,400 secondary, non-emergency discharges as a
Partners hospital. This model treats the Hallmark hospitals consistent with the parties’ claims that patients who
would have received services at Hallmark-LMH will now receive such services at Hallmark-MWH, and thus models
a net change to Hallmark as a whole. 195
This model accounts for the fact that the parties may redirect cases from MGH and other Partners hospitals to
Hallmark. However, it indicates that any such redirection is likely to be offset by other changes in site of care (e.g.,
new volume at MGH from competitors) that would negate any net savings from care redirection. 196
We found no statistically significant net change in volume at Partners hospitals. As noted above, Partners
hospitals could redirect care to Hallmark; however, we found that any such redirection is likely to be offset by other
changes in site of care (e.g., new volume at MGH from competitors). See supra note 195. 197
See supra notes 195 and 196.

55
potential savings for the three major payers would be on the order of $280K to $700K –
significantly less than the parties’ projections of $1.9 million to $4.7 million.198
The difference
in this HPC savings estimate and the parties’ estimates is driven by three principal factors. First,
we modeled shifts in inpatient care for a somewhat smaller population – patients of HHPHO
physicians, rather than all patients living in Hallmark’s service area, as we believe the patients
associated with Hallmark physicians are those the parties can most realistically be expected to
influence. Second, we focused on commercial patients. The parties posit that comparable levels
of savings would be achieved for every redirected patient; however, given that significant price
variation is principally a feature of the commercial market, we do not anticipate that shifts in the
site of care for government payer patients will result in the same degree of savings as shifts for
commercially insured patients. Third, we gave the parties credit for potential redirection of all
inpatient service lines, rather than the subset of service lines focused upon by the parties.
However, as discussed above, we find that even these more limited savings would likely not be
realized when all shifts in inpatient site of care, including shifts from non-Partners hospitals to
Hallmark, are appropriately taken into account.
b. Outpatient Services
The parties state that this transaction will result in redirection of outpatient services from
MGH to Hallmark amounting to approximately $9.9 million to $20 million in annual savings.
We have concerns about the reliability of this estimate, both because the parties only consider
service shifts in one direction (from MGH to Hallmark), and because the parties’ similar
approach to estimating inpatient savings is not substantiated by empirical analysis of Partners’
hospitals and referral practices. While we do not have detailed outpatient data on which to
conduct econometric modeling of shifts in outpatient care, if patients exhibit similar preferences
for hospitals for outpatient care as they do for inpatient care, we found that any savings from net
changes in outpatient site of care would be modest.
The parties’ estimate of outpatient savings is also questionable in light of HHPHO’s
current care referral patterns compared to those of the Newton-Wellesley and North Shore
physicians. We reviewed site of care data from the three largest commercial payers to examine
the care referral patterns associated with HHPHO, Newton-Wellesley, and North Shore
physicians. We examined how often HHPHO patients receive outpatient care at Hallmark
hospitals versus other area hospitals and how often they receive care at BWH and MGH versus
the other general acute care AMCs in Boston (Beth Israel Deaconess Medical Center, Boston
Medical Center, and Tufts MC). For Newton-Wellesley and NSMC patients, we examined how
often they use Newton-Wellesley Hospital and NSMC versus other area hospitals, and how often
they use BWH and MGH versus competitor AMCs.
We found that HHPHO’s existing care referral patterns look very similar to those of the
PCHI physicians at Newton-Wellesley and NSMC. Indeed, these data show that HHPHO
patients use Hallmark hospitals for outpatient care more frequently than the patients of Newton-
Wellesley and North Shore physicians use Newton-Wellesley Hospital and NSMC. These data
198
Moreover, as discussed in the previous section, if Hallmark’s rates were to increase to those of NSMC, the scope
of such savings would further decrease to $184K to $459K for the three major payers.
56
also show that HHPHO patients use the Partners AMCs no more frequently than Newton-
Wellesley and NSMC patients. The fact that HHPHO physicians already refer to their “home”
hospital more frequently than other Partners physicians refer to their “home” hospitals, and refer
to Partners AMCs no more frequently than the physicians at Newton-Wellesley and North Shore,
calls into question the parties claim that a substantial net shift in site of care from Partners AMCs
to Hallmark is likely to occur as a result of this transaction.
As with inpatient services, we also modeled the parties’ claim that 25% to 50% of
MGH’s outpatient volume from the Hallmark service area would shift to Hallmark, but that no
other care delivery patterns would change (i.e., the parties would not experience any shifts in
care vis-à-vis non-Partners hospitals). As with inpatient services, we applied the parties’
assumptions to a more realistic population, the patients of Hallmark PCPs, since those are the
patients the parties are most likely able to impact. We found that if the parties redirected 25% to
50% of outpatient care for this population from MGH to Hallmark, the savings for the three
major payers would be on the order of $900K to $1.8 million.199
If, as discussed in the previous
section, Hallmark’s rates were to increase to those of NSMC, potential savings would decrease to
$870K to $1.7 million.
Finally, a significant proportion of the savings claimed by the parties is based on
redirection of outpatient oncology services ($7.4 million to $14.9 million per year). If, as
discussed above, the parties bill the services of the Stoneham Cancer Center at increased facility
prices, or if a significant proportion of these services are provided by MGH physicians at higher
academic physician rates, even a substantial redirection of outpatient cancer care to the
community would not necessarily result in significant cost savings.200
c. New Physicians the Parties Seek to Recruit
As discussed in Section II.C, the proposed transaction includes plans to recruit 17
replacement and 25 net new physicians to Hallmark to support PHM. Consistent with
information provided by the parties, we expect that a number of patients currently receiving care
from other local providers will become patients of these new PCHI/Hallmark PCPs. We also
expect the care referral patterns of these PCHI/Hallmark PCPs to be in line with current
PCHI/Hallmark practices (higher use of Hallmark and Partners hospitals).
The table below shows, for one major payer, the average price of hospital services for
patients of HHPHO compared to the patients of other large physician groups serving the
northeastern Massachusetts region.201
The table shows how the prices for hospital services vary
significantly based on the system with which the patient’s PCP is affiliated. Among these
199
See supra Section IV.A.5.a regarding the reasons why this HPC estimate differs from the parties’ estimate. 200
Whether there will be net changes in site of cancer care that drive overall savings also depends on whether
Partners intends a net reduction of cancer volume and capacity at MGH, or if freed capacity from redirection of care
to Hallmark is likely to be filled with patients from lower-priced competitors. The probability that the Partners
system will not experience a net reduction in volume vis-à-vis competitors is consistent with our modeling of
inpatient site of care patterns, as well as the observations of some payers as referenced in note 191, supra. 201
We excluded other PCHI groups for this analysis as it appears unlikely that Partners would consider recruitment
of other PCHI PCPs as “net new” physician recruitment.
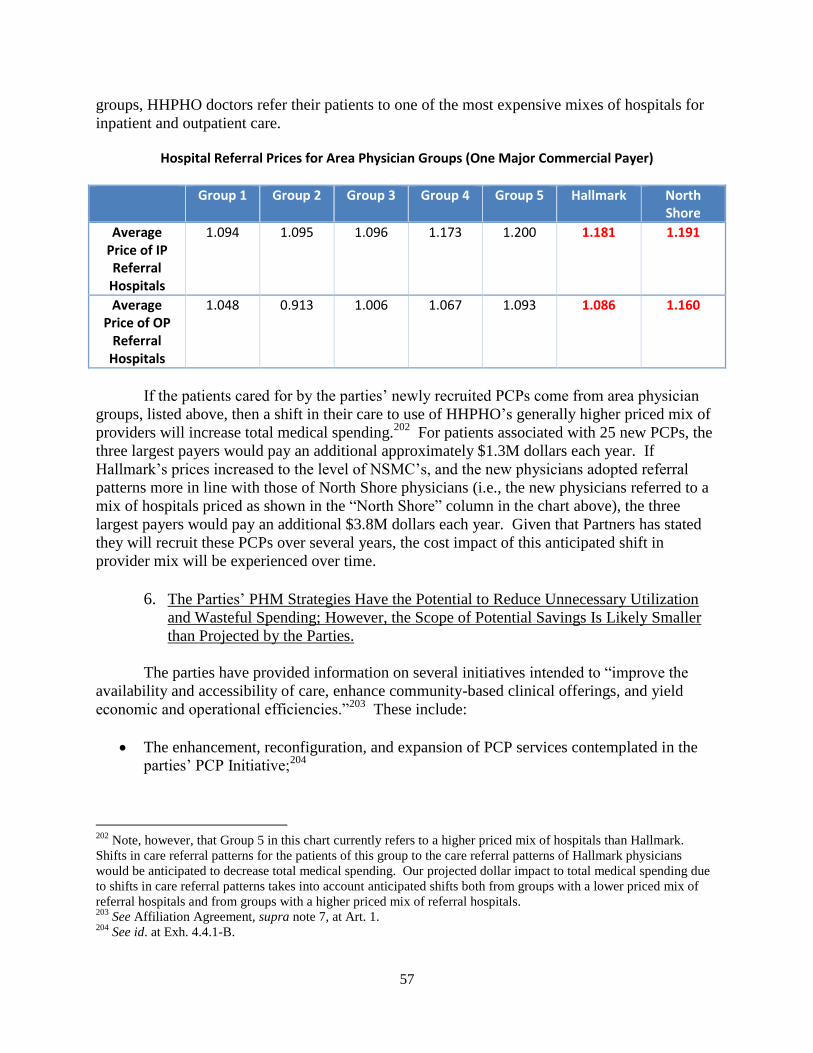
57
groups, HHPHO doctors refer their patients to one of the most expensive mixes of hospitals for
inpatient and outpatient care.
Hospital Referral Prices for Area Physician Groups (One Major Commercial Payer)
Group 1 Group 2 Group 3 Group 4 Group 5 Hallmark North Shore
Average Price of IP Referral
Hospitals
1.094 1.095 1.096 1.173 1.200 1.181 1.191
Average Price of OP
Referral Hospitals
1.048 0.913 1.006 1.067 1.093 1.086 1.160
If the patients cared for by the parties’ newly recruited PCPs come from area physician
groups, listed above, then a shift in their care to use of HHPHO’s generally higher priced mix of
providers will increase total medical spending.202
For patients associated with 25 new PCPs, the
three largest payers would pay an additional approximately $1.3M dollars each year. If
Hallmark’s prices increased to the level of NSMC’s, and the new physicians adopted referral
patterns more in line with those of North Shore physicians (i.e., the new physicians referred to a
mix of hospitals priced as shown in the “North Shore” column in the chart above), the three
largest payers would pay an additional $3.8M dollars each year. Given that Partners has stated
they will recruit these PCPs over several years, the cost impact of this anticipated shift in
provider mix will be experienced over time.
6. The Parties’ PHM Strategies Have the Potential to Reduce Unnecessary Utilization
and Wasteful Spending; However, the Scope of Potential Savings Is Likely Smaller
than Projected by the Parties.
The parties have provided information on several initiatives intended to “improve the
availability and accessibility of care, enhance community-based clinical offerings, and yield
economic and operational efficiencies.”203
These include:
The enhancement, reconfiguration, and expansion of PCP services contemplated in the
parties’ PCP Initiative;204
202
Note, however, that Group 5 in this chart currently refers to a higher priced mix of hospitals than Hallmark.
Shifts in care referral patterns for the patients of this group to the care referral patterns of Hallmark physicians
would be anticipated to decrease total medical spending. Our projected dollar impact to total medical spending due
to shifts in care referral patterns takes into account anticipated shifts both from groups with a lower priced mix of
referral hospitals and from groups with a higher priced mix of referral hospitals. 203
See Affiliation Agreement, supra note 7, at Art. 1. 204
See id. at Exh. 4.4.1-B.

58
Directing appropriate patient care to urgent care centers as opposed to hospital
emergency departments, and expanding urgent care availability at Hallmark-LMH, in
Reading, and in the Burlington/Lexington area;
Expanding the use of remote care services, including telehealth tools, virtual visits, and
patient portals, as alternatives to office or hospital visits; and
Expanding outpatient availability of preventive health programs and support for patients
with a variety of chronic conditions, centered at the reorganized LMH campus.205
The parties have projected that, taken together, these strategies will decrease inpatient utilization,
resulting in average gross savings of about $10.9 million per year over five years.
The HPC is committed to advancing the benefits of care delivery transformation in the
Commonwealth, and recognizes the potential for PHM to drive efficiencies and facilitate high-
quality care delivery. One way we are committed to advancing this transformative potential is
by requiring that providers proposing to undertake significant changes provide measurable
indicators of how those changes are likely to result in improved performance. Successful care
delivery improvement initiatives, including those implemented by Partners in the past, have been
based on data-driven interventions targeting well-defined populations.206
While the parties have
provided additional information about their proposed PHM approaches in connection with this
transaction, we have several methodological and substantive questions:
Novel care delivery models are most likely to be successful where such programs are
based on concrete implementation plans that include measurable goals and other
evidence-based benchmarks. Here, the parties’ proposals are overly general and lack the
quantifiable implementation and measurement plans that would better support projections
of success.
Projected savings should also be based on reasonable assumptions. Here, the parties rely
on some questionable assumptions in projecting savings; by adjusting these assumptions
using more relevant data, we find a smaller scale of potential savings.
Where novel programs are proposed, examining performance in similar programs can be
instructive in assessing the scope of potential savings. Here, consistent with the result
when we adjust the parties’ questionable assumptions, the parties’ projections are also
high when compared to their performance in recent care delivery initiatives.
The remainder of this section addresses these questions in turn.
205
See id. at Exh. 4.4.1-A, § 2(a). 206
See, e.g., Douglas McCarthy et al., Geisinger Health System: Achieving the Potential of System Integration
Through Innovation, Leadership, Measurement, and Incentives, COMMONWEALTH FUND 9 (June 2009), available at
http://www.commonwealthfund.org/~/media/Files/Publications/Case%20Study/2009/Jun/McCarthy_Geisinger_case
_study_624_update.pdf (discussing the successful care model redesign process at Geisinger Health System as being
based on identifying best practices, setting specific targets for improvement, defining methods to measure and
support progress, and proving new models in smaller pilot populations before expanding them).
59
a. Novel care delivery models are most likely to be successful where such programs are
based on concrete implementation plans that include measurable goals and other
evidence-based benchmarks. Here, the parties’ proposals are overly general and
lack the quantifiable implementation and measurement plans that would better
support projections of success.
The parties have identified several potential PHM strategies they plan to implement. The
parties have provided some details about these plans: they identify the number of doctors they
plan to recruit through the PCP Initiative, as well as those communities in which these doctors
would practice.207
They also identify certain chronic disease populations and outline some
possible interventions to meet community needs. However, the parties’ plans do not include
certain elements that we would expect to see when reviewing a proposed care delivery initiative.
For example, while we would expect a projection of how many clinical and non-clinical staff
would be needed to support each proposed intervention, the parties have provided no estimates
beyond the number of overall PCPs they plan to recruit. While we would expect a projection of
the impact of each intervention on volume and costs, the parties have not provided these detailed
projections.208
They provide few or no details concerning the expected scope or target
population for a number of programs, such as their proposed remote care services. The parties
have stated that in many cases, plans for interventions will develop as the programs are deployed
and community needs are assessed. We agree that careful planning is necessary, and that
modifying new care delivery models as they progress is often advisable. Here, however, the
absence of key elements in the parties’ plans, coupled with lack of detail as to how effective
modifications to these plans would be achieved, raise questions as to the reliability of the parties’
current savings estimates.
b. Projected savings must also be based on reasonable assumptions. Here, the parties
rely on some questionable assumptions in projecting savings; by adjusting these
assumptions using more relevant data, we find a smaller scale of potential savings.
We attempted to verify the parties’ aggregate savings estimate209
by comparing the
assumptions underlying the parties’ estimate to the best available data. The parties support their
projected savings with estimates of the population they expect the PHM initiatives to serve in the
aggregate, the reduction in admissions they expect to achieve, the amount they expect each
avoided admission would have cost, and the amount they expect to spend on implementing and
maintaining the programs.210
However, several of the assumptions underlying these projections
207
See Affiliation Agreement, supra note 7, at Exh. 4.4.1-B. 208
The parties have provided only total figures for anticipated reductions in admissions and resulting savings, rather
than projections specific to individual interventions. They have also indicated that some investments would support
the proposed reforms, but it is unclear how much funding would be necessary to implement any given initiative. See
Affiliation Agreement, supra note 7, at Exh. 4.4.3. 209
As discussed in note 208, supra, the parties’ model does not build up a total savings estimate by adding the
potential savings from individual interventions, but instead estimates an aggregate savings across all of the parties’
contemplated PHM strategies. 210
Although the parties’ model provides these projections as lump sums, it does provide separate projections for
reductions in admissions and costs for Hallmark’s commercial and Medicare populations.
60
raise methodological concerns, and correcting for these flaws shows a significantly smaller
potential for savings:
i. Population Served by Hallmark
The parties estimate that Hallmark will serve 50% of all people with commercial
insurance or Medicare in its service area.211
However, PCHI physicians, including Hallmark,
serve an estimated 35% of commercial discharges in the relevant service area.212
We use this
lower percentage as our estimate of the commercial population the PHM initiatives will reach,
since the parties can reasonably reduce admissions only among patients they serve.213
ii. Benchmark Rates of Admissions
The parties estimate admissions reductions by comparing the current admission rates in
Hallmark’s service area to the national rate of admission among Medicare patients and to the rate
of admission among the commercially insured population served by a leader in care delivery
redesign located in another state. They assume that their PHM initiatives will reduce the rate of
admissions in Hallmark’s service area over five years by half of the difference between the
current admissions rates and these benchmark rates.214
We apply the rate of admissions for
Medicare beneficiaries in an area more closely-linked to the parties’ own geography, eastern
Massachusetts, as a more relevant benchmark for admissions reduction.215
iii. Program Costs
We appreciate that the parties estimate the costs of implementing and maintaining the
proposed PHM initiatives, acknowledging that these costs may erode net program savings.
211
The parties based their population and admissions projections on their definition of Hallmark’s combined PSA
and SSA. See supra note 162. 212
The 35% figure presented here is the parties’ share of the market for PCP services in those zip codes from which
HHPHO draws 90% of its primary care visits for the largest commercial payer. See supra note 71. The parties also
use a service area that accounts for 90% of their volume in projecting the impacts of their PHM programs; the 75%
area used in Section III.A.2.b, supra, is more appropriate when examining market share for the purpose of assessing
potential market leverage. 213
As noted in Section IV.A.1.b, the addition of 25 new PCPs through the PCP initiative could increase PCHI’s
market share in its service area. However, it is unclear what the scope of this increase would be, or to what extent it
would alter the scope of Hallmark’s service area. We therefore are unable to model the impact of these additional
physicians on the population served by the parties. 214
Reducing the rate of admissions by 50% of the difference between actual and benchmark rates, as defined by the
parties, would result in a reduction of 3.8% of commercial admissions and 8.8% of Medicare admissions, for an
overall reduction of 6.4% of admissions in Hallmark’s service area. The parties do not provide any methodological
support for their projected rate of reduction and do not clarify how many admissions they expect to avoid for any
specific intervention or patient group. We adopt the parties’ assumed rate of admissions reduction in our own
projection, but note that there is no evidence from past programs that supports this assumption, as explained in
Section IV.A.6.c, infra. 215
See Hospital Discharges per 1,000 Medicare Enrollees, DARTMOUTH ATLAS OF HEALTH CARE,
http://www.dartmouthatlas.org/data/table.aspx?ind=66&tf=23&ch=35,125&loc=23,85,316,355&loct=3&fmt=91
(last visited May 11, 2014) (showing a rate of Medicare admissions per thousand beneficiaries in eastern
Massachusetts of 336.8).

61
However, without information to evaluate the basis for the parties’ estimate (e.g., the estimate is
not based on actual costs of implementing similar PHM initiatives, or on intervention-specific
projections216
), we focus on presenting gross savings figures in our analysis.217
iv. HPC’s Estimate
Using the parties’ estimates as a baseline, we adjusted the foregoing assumptions to
reflect the best available data. For other assumptions where supporting data were unavailable,
such as the potential rate of admissions reduction, we retained the parties’ assumptions. With the
limited adjustments outlined above, we estimate a potential for gross annual savings of up to
$5.4 million. While we cannot correct for all of the methodological concerns we have identified
in the parties’ projections, we find that savings from the PHM proposals are likely no more than
half of what the parties have projected, and are unlikely to outweigh the anticipated costs of the
transaction.
c. Where novel programs are proposed, examining performance in similar programs
can be instructive in assessing the scope of potential savings. Here, consistent with
the result when we adjust the parties’ questionable assumptions, the parties’
projections are also high when compared to their performance in recent care delivery
initiatives.
In light of the unresolved methodological concerns identified above, we compared the
parties’ projected reductions in costs and utilization to recent successful care delivery
improvement programs. The impact of innovative care delivery strategies may exceed that of
past programs; however, when the methodology for projecting the impact of a novel program
raises questions, examples of actual performance may provide insight into the scope of potential
success. We therefore analyze the parties’ projections for utilization and cost reductions in light
of recent initiatives undertaken by Partners and other providers.
The parties project the most significant reductions in cost and utilization from the
proposed care delivery reforms will be among Medicare beneficiaries in Hallmark’s service area.
Partners has participated in several pilot programs involving Medicare patients that could serve
as models for care management in Hallmark’s service area. In the CMS Care Management for
High Cost Beneficiaries (CMHCB) demonstration, Partners providers (first MGH, followed by
BWH and NSMC) intensively managed the care of certain high-risk Medicare beneficiaries with
the goal of reducing care costs (primarily by preventing admissions and readmissions) while
improving clinical outcomes. For most cohorts, Partners achieved some meaningful level of net
savings, particularly at MGH, though spending on the program outpaced savings at NSMC.218
If
216
The parties estimate their costs as a percentage of projected savings. This method of estimating costs will always
produce net savings, an approach that is inconsistent with known PHM experience, discussed in Section IV.A.6.c,
infra, in which program costs can equal or exceed any savings. 217
Investments in PHM initiatives can be valuable even if they do not produce net savings if, for example, they
increase quality of care for patients or access to services. These topics are addressed in Sections IV.B and IV.C,
infra. 218
See PHS-SSH-HARBOR CMIR FINAL REPORT, supra note 23, at Section IV.B.1.
62
we assume that Hallmark has a similar high-risk beneficiary population as MGH,219
and that
Hallmark would be able to manage that population as effectively as the highest-performing
MGH cohort, annual net savings of up to $4.4 million could be possible.220
Alternatively, if
Hallmark performed like NSMC in managing its cohort, annual spending could increase by as
much as $1.1 million.221
Yet, these savings levels assume that the parties could achieve an
equivalent rate of success as interventions focused on smaller populations of high-risk Medicare
beneficiaries,222
which were selected for intensive management because they are relatively sick
and therefore costly.223
It is unlikely that the rate of success achieved in these focused
populations would translate into the general population the parties plan to serve with their PHM
initiatives.224
The alternate analysis we present here,225
which examines a population of patients
with the greatest potential for care management savings, is consistent with our above findings
that the parties’ projections are likely overstated.
219
This assumption that Hallmark, a community hospital, draws as large a high-risk beneficiary population as MGH,
a tertiary/quaternary teaching hospital, is questionable. See id. at Exh. B-1, Section I.B.2.b. 220
This figure nets out the estimated costs of operating the programs (see note 218, supra), but not the costs of
initial infrastructure investments. Partners invested significantly in the CMHCB demonstration, including a pilot
study, several years of planning, personnel, and logistics. We cannot account for the cost of these supporting
investments because they are not known. 221
CMS paid Partners certain care management fees to help offset the operating costs of managing the
demonstration cohorts. Where the medical spend of the intervention cohort combined with the care management
fees exceeded the medical spend of the control groups, the intervention was characterized as resulting in a net
increase in spending, or a “loss.” Although CMS would not be providing management fees in support of the PHM
initiatives proposed in this transaction, the experience of NSMC in the CMHCB demonstration indicates that it is
possible that Partners’ costs of operating the new programs could outweigh any savings. 222
The three MGH refresh cohorts included a total of approximately 2,300 beneficiaries. See Jerry Cromwell &
Nancy McCall et al., RTI INTERNATIONAL, Evaluation of Medicare Care Management for High-Cost Beneficiaries
(CMHCB) Demonstration: Final Reconciliation Draft Report, CTR. FOR MEDICARE & MEDICAID SERVS. 8 (June 4,
2013). 223
Partners successfully reduced inpatient utilization among its high cost beneficiary demonstration population, with
the most successful cohort achieving a reduction of approximately 24% in the “refresh” cohort at MGH. See Nancy
McCall et al., RTI INTERNATIONAL, Evaluation of Medicare Care Management for High-Cost Beneficiaries
(CMHCB) Demonstration: Massachusetts General Hospital and Massachusetts General Physician Organization
(MGH), CTR. FOR MEDICARE & MEDICAID SERVS. 2 (Sept. 2010). A few other providers have also achieved large
utilization reductions by focusing on high-risk Medicare beneficiaries. For example, Mercy Medical Center North
Iowa, the highest performer in a group of providers participating in a coordinated care management demonstration,
reduced annualized hospitalizations by 11.8% in 2007 in its demonstration cohort. This reduction did not result in
statistically significant savings, after accounting for program fees. See JENNIFER SCHORE, ET AL., MATHEMATICA
POLICY RESEARCH, INC., FOURTH REPORT TO CONGRESS ON THE EVALUATION OF THE MEDICARE COORDINATED
CARE DEMONSTRATION 7 – 8 (Mar. 2011). 224
Partners’ performance in its first year of performance in CMS’s Pioneer ACO program, which encompassed
52,000 Medicare beneficiaries, is encouraging, but data are incomplete. In its first year, 2012, Partners reported
early returns for the management of 52,000 Medicare patients, decreasing the rate of growth of their health care
costs by approximately 2.4% as compared to the Medicare reference trend. Utilization data for 2012 are not yet
available, but it is the HPC’s understanding that none of the providers participating in the Pioneer ACO has yet
achieved the level of reduction in admissions projected by the parties. For the commercially-insured population,
utilization rates for PCHI’s risk populations under BCBS’ Alternative Quality Contract are lower for other PCHI
groups than for HHPHO; this may indicate the potential for improvement if HHPHO adopts similar care
management approaches, or may simply reflect confounding factors like differences in population demographics. 225
This alternate analysis does not raise any new sources of savings not captured in our previous analysis. The gross
savings estimates presented in Section IV.A.6.b include consideration of any savings from Hallmark’s Medicare
population.
63
In sum, the parties have proposed a series of PHM initiatives that they project will reduce
inpatient utilization and result in significant cost savings. We recognize the potential for PHM
initiatives to drive efficiencies and facilitate high-quality care delivery, and we commend the
parties for pursuing these approaches. We similarly recognize that novel care delivery models
such as those proposed here should include measurable goals and other evidence-based
benchmarks specific to each intervention, to maximize the likelihood that significant investments
in these models will result in improved performance. Here, the absence of key elements in the
parties’ plans, coupled with lack of detail as to how effective modifications to these plans would
be achieved, raise questions as to the reliability of the parties’ current projections. We find that
potential gross savings from the proposed PHM interventions would likely be no more than half
of what the parties project, and are unlikely to offset the projected costs of this transaction.
7. The Proposed Consolidations May Yield Operating Efficiencies for the Parties, but
the Scope of Potential Efficiencies is Uncertain and Is Likely Outweighed by the
Parties’ Proposed Investments.
As detailed in Section II, the parties expect to consolidate services provided by Hallmark
and NSMC. In this section, we assess the parties’ anticipated operating efficiencies and
investments:
The parties claim that consolidation of certain business administrative activities will
result in annual overhead savings of $1 - $2 million.
The parties claim that conversion of Hallmark-LMH to a short-stay facility and NSMC-
Union into a behavioral health and primary care center will result in annual overhead
savings totaling about $24 to $28 million.
The parties have proposed approximately $595 million in investments in their facilities,
technology, and programs pursuant to the proposed transaction.
a. Administrative efficiencies
The parties have provided the HPC with an assessment of administrative and business
efficiencies they expect to realize as a result of the transaction. These include reductions in
duplicative administrative staff, as well as joint contracting and purchasing efficiencies. While
the HPC cannot substantiate the exact amount of savings, the details provided suggest the parties
could reasonably meet their estimate of reducing operating expenses by about $1 – $2 million
per year.
b. Conversion of Hallmark-LMH and NSMC-Union
The parties have provided the HPC with projections of operating costs and avoidable
expenses associated with the proposed conversions of Hallmark-LMH and NSMC-Union. The
parties project that converting Hallmark-LMH into a short stay facility will reduce overhead
expenses by about $11 - $15 million annually, and converting NSMC-Salem into a center for
behavioral health and primary care will reduce overhead expenses by approximately $13 million
annually. While the parties have not provided detailed information to support these projections
64
(and the figures may be overstated226
), it is generally reasonable that the parties would realize
some efficiencies by consolidating their hospital capacity.
The projected operating efficiencies discussed in this section would not have a direct
impact on total medical spending in northeastern Massachusetts since they would accrue directly
to the parties. The same is true of the costs of the investments contemplated as part of the
transaction.227
The parties state that it may be possible to forego future rate increases as a result
of the projected efficiencies; however, their proposed capital spending is approximately twenty
times larger than the efficiencies.228
Some payers have also observed that any operating
efficiencies achieved by Partners in the past have not translated into lower rate increases as
compared to other providers. We therefore do not attribute an impact to total medical spending
from either these projected efficiencies or the proposed investments.
In sum, we found that this transaction will reinforce Partners’ position as the provider
with the highest share of inpatient and PCP services in its northeastern Massachusetts service
areas, and will strengthen the resulting system’s ability and incentives to negotiate price
increases and other favorable contract terms for Hallmark. As the Hallmark physicians become
more tightly integrated with Partners, anticipated changes in physician prices will increase total
medical spending in northeastern Massachusetts by about $6.8 million for the three largest
commercial payers. If Partners seeks parity between Hallmark’s rates and those at its other
greater Boston community hospitals, these changes in hospital rates will increase total medical
spending in northeastern Massachusetts by an additional $9.3 million for these payers. Facility
price changes and staffing by MGH physicians at the facilities proposed to be licensed under
MGH are likely to further increase total medical spending in northeastern Massachusetts, with
changes in site of care anticipated to be cost neutral or cost increasing rather than cost saving (up
to $4 million in increased spending for existing patients, and up to $3.8 million in increased
spending for anticipated new patients). While the parties have outlined a set of PHM initiatives
that have the potential to reduce total medical spending, the scope of those potential savings is
unlikely to offset the increased costs described above.
226
For instance, it is not clear whether the parties’ projections account for the operating costs of new facilities and
services at the campuses. As one example, the parties contemplate building a new medical office building and
garage at Hallmark LMH, and expect to spend $30 - $40 million on refitting NSMC-Union to become a behavioral
health and primary care center. Affiliation Agreement, supra note 7, at Exh. 4.4.3. 227
See Affiliation Agreement, supra note 7, at Exh. 4.4.1-A, Exh. 4.4.3 ($370 million for the PCP Initiative, the IT
Initiative, improvements at Hallmark’s facilities, and investments in the MGH Cancer Center, plus $30 - $40 million
to convert NSMC-Union and $190 million to renovate and expand NSMC-Salem). 228
The parties claim that the amount of investment contemplated in the transaction is only a small amount more than
what the parties would spend independently to maintain their existing campuses absent the transaction. Affiliation
Agreement, supra note 7, at Exh. 4.4.1-A, p. 2. They claim that certain improvements, including new Health
Information Technology (HIT) systems, would still be necessary, and would cost as much or significantly more for
Hallmark to implement independently. While some improvements at Hallmark would still be necessary absent the
transaction, the HPC cannot verify whether Hallmark’s independent investments would be similar to those proposed
in the transaction. However, even assuming that Hallmark would make independent investments similar to those
contemplated, Partners has not indicated that it would reorganize the NSMC campuses absent the transaction. The
projected cost of reorganization and rationalization of services at these facilities is $220 - $230 million. See supra,
note 227. This figure is significant, and far exceeds the parties’ projected overhead efficiencies.
65
While we anticipate that this transaction will increase health care spending and premiums
for employers and consumers, the parties have consistently advocated for the transaction on the
basis that it will lower total medical spending. Given this perspective, the parties should be
prepared to commit to a lower level of total medical spending across all books of business for the
operations and providers described in their transaction materials, whom they state will achieve
this lowered spending. The Commonwealth and other stakeholders should consider how such
commitments, including concrete benchmarks and penalties for failure to meet targets, might
appropriately be monitored and enforced through oversight responsibilities envisioned in Chapter
224, or other mechanisms.
B. QUALITY IMPACT
The parties have stated that the proposed transaction will improve the quality of patient
care and that one of their goals is enhancing opportunities for jointly monitoring and improving
care quality.229
They describe that they intend to “determine how best to assist each other in
implementing systems for measuring and improving the quality and value of health care services
to be delivered by the parties in their reconfigured inpatient, outpatient and community
settings.”230
We examined whether the parties’ historic performance on quality measures
suggests areas in which one party has knowledge and experience that could drive improvements
by the other, and the parties’ plans to facilitate this exchange of best practices.231
As discussed in Section III.B.1, differences in the parties’ performance across quality
measures indicate there should be opportunities for Hallmark to improve its quality through the
adoption of some Partners quality monitoring and improvement approaches. The parties have
outlined some plans that should facilitate this process. For example, the Rationalization
Initiative includes plans for MGH and Hallmark to form joint teams that will manage and
collaborate on certain service lines at the reorganized Hallmark and NSMC facilities.232
This
includes clinical integration of behavioral health services at MGH with those at the reorganized
NSMC-Union facility, which has the potential to increase the quality of those services. While the
parties have not specified how this joint management structure will result in quality
improvement, it is reasonable to expect it will facilitate the sharing of quality-improving best
practices, particularly in areas in which Partners excels.233
The parties have also described PHM initiatives they intend to deploy to serve residents
in their joint service areas in northeastern Massachusetts. As discussed in Section IV.A.6, these
229
PARTNERS HEALTHCARE SYSTEM, NOTICE OF MATERIAL CHANGE TO THE HEALTH POLICY COMM’N (Nov. 8,
2013), AS REQUIRED UNDER MASS. GEN. LAWS ch. 6D, § 13 (2012). 230
Affiliation Agreement, supra note 7, at Section 4.6.3. 231
Pre-merger clinical superiority of one party may indicate the likelihood of a quality impact on the other, though
differences in quality by themselves do not guarantee a transaction will result in quality improvements. See Romano
& Balan, supra note 90. 232
See Affiliation Agreement, supra note 7, at Exh. 4.4.1-A. These service lines include obstetrics/gynecology,
pediatrics, orthopedics, cardiology, oncology, digestive health, and psychiatry. 233
For example, as noted in Section III.B.1.b, Partners hospitals have a strong record of providing post-discharge
care planning for psychiatric inpatients, and it would be reasonable to expect the parties to promote similar practices
at the reorganized hospitals.
66
plans are founded on increasing primary care availability through the PCP Initiative, integrating
behavioral health services into primary care sites, expanding urgent care centers, providing more
remote care services, and developing outpatient services tailored to patients with specific chronic
conditions.234
Although the parties did not provide specific quality goals for these initiatives, we
recognize the potential for PHM initiatives to facilitate high quality care delivery and commend
the parties for pursuing these approaches.
At the same time, the potential positive quality impact of the transaction is colored by the
fact that Hallmark has a longstanding clinical and contracting relationship with Partners.
Through this relationship, Hallmark has been part of Partners’ internal quality tracking programs,
pay for performance incentives, and joint risk contracts. Consistent with models in use in other
systems, we would expect such programs to have encouraged the sharing of quality and
efficiency practices to the mutual benefit of both parties.235
It is unclear how corporate
ownership is instrumental to improving clinical quality in ways the parties’ longstanding
affiliation has not.236
C. ACCESS IMPACT
The proposed transaction includes an array of care delivery reforms, including a
significant reconfiguration of service offerings across the regions served by Hallmark and
NSMC. The parties have stated that the changes underlying the Program and Facilities
Rationalization and Primary Care Initiatives, described in detail in Section II.C, and their
expansion of PHM initiatives as discussed in Section IV.A.6 will “evolve current integrated
delivery care systems to promote [the] goals . . . of bending the cost curve while improving
quality and outcomes.”237
The parties also state that these care delivery reforms will improve
access to primary care and other health care services in northeastern Massachusetts.
As Partners and Hallmark seek to rationalize and improve care delivery structures and
direct resources to community-based facilities, there is significant potential to improve patient
234
See Affiliation Agreement, supra note 7, at Art. 1, Exh. 4.4.1-A, and Exh. 4.4.1-B. 235
There are a number of provider models in the Commonwealth that successfully coordinate care delivery and
improve quality without corporate ownership. See PHS-SSH-HARBOR FINAL CMIR REPORT, supra note 23, at
Section IV.B.2.b. As an example of an approach that does not require corporate integration, Hallmark’s joint risk
contracting arrangement with Partners means that Hallmark’s quality and efficiency performance impact the
payments that Partners receives. We expect this would incentivize Partners to work with Hallmark to improve its
quality and efficiency even absent the transaction. 236
The parties have suggested that the proposed IT Initiative may improve quality, and that these investments would
be impossible without corporate integration. However, the implementation of HIT can facilitate as well as raise
challenges for care coordination and health care competition. HIT tools that facilitate interoperability, both within a
provider organization and between different provider organizations, can enhance coordinated, effective care
delivery. Tools that lack interoperability can create silos, with challenges both for care coordination and access to
competitors. See Katherine Baicker & Helen Levy, Coordination versus Competition in Health Care Reform, 369
NEW ENGL. J. MED. 789 (2013), available at http://www.nejm.org/doi/pdf/10.1056/NEJMp1306268. The Epic IT
system used by Partners may be highly interoperable within the Partners system, but it may also create barriers for
patients and providers outside of the Partners system who rely on different HIT platforms. 237
Affiliation Agreement, supra note 7, at Art. 1.

67
access to and engagement with the health care system.238
In Massachusetts and elsewhere,
system reconfigurations such as those contemplated in this transaction may allow community
hospitals to better meet the challenges of the evolving health care system. The parties’ plan to
shift appropriate care from emergency departments to urgent care centers, for example, has the
potential to reduce unnecessary emergency department use and to ensure that non-emergent care
is delivered in a more appropriate setting.239
The structure of any transaction that aims to transform care delivery should reflect
consideration of the scope and mix of services currently available, the allocation of resources
necessary to support both existing and new proposed services, and the alignment of services with
community need. Significant shifts in the location and types of services provided, as proposed
here, can raise access concerns, particularly for vulnerable populations. As discussed in Section
III.C.3, Hallmark and NSMC hospitals have higher government payer mix than other area
community hospitals and provide a significant share of behavioral health services to their local
communities; it is important to consider any adverse impact to these vulnerable populations.
We evaluated the parties’ plans to improve access to certain services, as well as their
potential impact on the vulnerable patient populations that Hallmark and NSMC serve, and
found:
There is significant potential for the parties’ plans to improve access to primary care and
other services. However, the current plans lack sufficient detail for the HPC to determine
the extent to which such potential will be realized;
Relocating inpatient general acute care services is unlikely to impair regional access to
these services; and
Relocating inpatient behavioral health services may have an adverse impact on access to
those services for vulnerable populations.
1. There is Significant Potential for the Parties’ Plans to Improve Access to Primary
Care and Other Services. However, the Current Plans Lack Sufficient Detail for the
HPC to Determine the Extent to which Such Potential Will Be Realized.
The parties’ plans include reconfiguration of a range of inpatient and outpatient service
lines. Among other plans, the parties propose to “expan[d] and enhance[] all inpatient and
outpatient behavioral health,” develop population health programs for chronic conditions, expand
urgent care facilities, recruit 25 net new primary care physicians around Hallmark, and enhance
access to primary care services by expanding remote care services.
238
HALLMARK NOTICE OF MATERIAL CHANGE, supra note 27, at Section 14. A central purpose of the parties’ shared
vision to transform the way health care is implemented in the area is to “rationalize the overcapacity and overlap of
certain facilities and service lines.” Affiliation Agreement, supra note 7, at Exh. 4.4.1-A. There is an emphasis on
expansion of services lines, including the establishment of joint service lines, and the parties expect to generate
savings for consumers and payers through decreases in operating costs from the reduction of full-scale inpatient
facilities in the area. 239
See supra note 190.
68
These plans have significant potential to improve access to services. In particular, we
commend Partners for its longstanding commitment to behavioral health care, and for raising the
importance of expanding behavioral health services.240
To the extent the parties realize their
goal of expanding and enhancing such services, this change could meaningfully impact access to
behavioral health services in northeastern Massachusetts. Expanding primary care capacity also
has meaningful potential to improve care coordination,241
with remote care services and
expanded urgent care facilities shown in some instances to improve care delivery and the
likelihood of patients receiving appropriate, timely care.242
Primary care delivery for certain
populations has also been positively impacted by medical home models for physician group
practices, and by population health management programs similar to the diabetes and heart
failure programs described by the parties.243
Finally, integrating primary care and behavioral
health services has been shown to improve care delivery and similarly has the potential to
improve access to care for vulnerable patients.244
At the same time, the extent to which the parties can realize such potential will be driven
by the details of implementation, many of which were not available for the HPC’s review.245
For
example, the parties have not specified whether they will recruit the 25 net new primary care
physicians from existing practices; recruiting these physicians from other area medical groups
will not improve overall patient access. Similarly, while the parties have indicated their
commitment to enhancing behavioral health services in line with community need, they have not
240
See, e.g., Liz Kowalczyk, MGH to Screen All Patients for Substance Abuse, BOSTON GLOBE, (June 30, 2014),
available at http://www.bostonglobe.com/lifestyle/health-wellness/2014/06/29/mass-general-hospital-plans-screen-
all-patients-for-alcohol-and-illegal-drug-use/RmDqYAUpFuQql1e1LLicKI/story.html (reporting on Partners
investments in screening all patients at MGH for substance use disorders as part of a suite of activities to enhance
access to addiction treatment). 241
Thomas Bodenheimer & Hoangmai Pham, Primary Care: Current Problems and Proposed Solutions, 29
HEALTH AFFAIRS 799 (2010), available at http://content.healthaffairs.org/content/29/5/799.full. 242
Alan Snell, The Role of Remote Care Management in Population Health, HEALTH AFFAIRS BLOG (Apr. 4, 2014),
http://healthaffairs.org/blog/2014/04/04/the-role-of-remote-care-management-in-population-health/. 243
While evidence is mixed, one review found a moderate positive effect on delivery of preventive care services,
among other findings. George Jackson et al., The Patient-Centered Medical Home: A Systematic Review, 158
ANNALS OF INTERNAL MED. 169 (Nov. 2012), available at http://annals.org/article.aspx?doi=10.7326/0003-4819-
158-3-201302050-00579&an_fo_ed. 244
One review showed that integrated care has been effective in treating depression, anxiety, at-risk alcohol, and
ADHD in primary care settings. Mary Butler, et al., AGENCY FOR HEALTH CARE RESEARCH & QUALITY,
INTEGRATION OF MENTAL HEALTH/SUBSTANCE ABUSE AND PRIMARY CARE (2008), available at
http://www.ahrq.gov/research/findings/evidence-based-reports/mhsapc-evidence-report.pdf. Another found that
collaborative care models provide effective treatment for comorbid physical and mental health conditions.
Benjamin Druss & Elizabeth Walker, Mental Disorders and Medical Comorbidity, ROBERT WOOD JOHNSON
FOUND., SYNTHESIS PROJECT REPORT No. 21 (2011), available at http://www.rwjf.org/content/dam/farm/legacy-
parents/mental-disorders-and-medical-comorbidity. 245
As discussed in Section IV.A.6, the parties have stated that in many cases, their plans will develop as programs
are deployed and community needs are assessed. We agree that careful planning is necessary, and that modifying
new care delivery models as they progress is often advisable. Here, however, the absence of key elements in the
parties’ plans, coupled with lack of detail as to how effective modifications to these plans would be achieved,
prevent the HPC from fully evaluating how the proposed care delivery changes will impact access.
69
yet made decisions regarding any increase in inpatient behavioral health beds,246
any minimum
number of new behavioral health clinicians, or any expansion in outpatient, intensive outpatient,
or partial hospitalization behavioral health services. Likewise, many differing medical home
models and behavioral health-primary care integration approaches exist. The effectiveness of
these models varies and the HPC does not have sufficient information to evaluate how the parties
will choose to implement their initiatives.
The risk of potential access concerns may also turn on details of implementation which
are not yet known. For example, the impact of the parties’ plans for emergency care services
will depend on details regarding underlying access to such services in Lynn and Medford that are
not yet known. While sufficient emergency services capacity may exist at other facilities in the
region, the parties have not yet specified how they will monitor and evaluate need for such
services following the parties’ two to three year commitment to maintain emergency services in
these communities. The parties have similarly not yet detailed plans to ensure continuity of care
for those patients whose site of care will be moved (e.g., approximately 61% of current
discharges at Hallmark-LMH and all patients receiving medical-surgical care at NSMC-Union).
Such plans are necessary to protect ongoing access for these patients, many of whom, based on
the payer mix of these facilities, are likely to be low-income individuals, elders, or individuals
with disabilities. Finally, while the short-stay inpatient model proposed at Hallmark-LMH
presents opportunities for reframing the role of a small suburban community hospital, the
retention and expansion of primarily high-margin services247
such as gastroenterology,
cardiology, and orthopedics raises questions about whether these service expansions reflect
alignment with unmet community need.
As discussed in Section IV.B, it is also unclear whether corporate consolidation is
necessary to achieve the parties’ desired quality improvements and access gains. For example,
as described in Section III.C.2, NSMC had the lowest occupancy rate (59%) of area community
hospitals, suggesting that Partners could elect to reduce its capacity to achieve rationalization in
the absence of an acquisition of Hallmark. While we understand that the specifics of a given
plan for care rationalization may differ depending on whether a corporate acquisition versus
other form of affiliation is contemplated, it is worth asking whether the quality and access gains
desired are only or best achievable through this most permanent form of affiliation, a corporate
acquisition.
In sum, while there is significant opportunity for the parties’ proposed care delivery
changes to improve patient access to the health care system, limited data and detail in the parties’
plans prevents us from drawing many conclusions regarding the likelihood that the parties will
realize this potential. Similarly, lack of data and detail prevents us from drawing many
conclusions regarding the extent to which the parties will successfully mitigate potential access
246
The parties are considering up to 25 additional behavioral health beds at Hallmark-MWH for addiction services
and short stay admissions, but have not committed to any specific increase in beds to address evidence that there is
likely insufficient behavioral health capacity in the region. See Section III.C.2. 247
The parties’ planned investments mirror a national trend of expanded capacity for specific specialty services such
as cardiology, cancer, orthopedics, women’s and children’s services, and GI endoscopy. According to a survey of
senior hospital executives across the country, one of the factors motivating this trend is service line profitability.
For more on expansion of specialty service lines and underlying factors, see Berenson, supra note 60.
70
concerns related to the proposed restructuring and relocation of services for vulnerable
populations. At the close of this section, we highlight examples of such data and programmatic
details that would help the HPC better assess how the proposed care delivery changes will
impact access. Before turning to those examples, and inviting the parties to provide additional
detail in their response to this Preliminary Report, we discuss below two topics for which we
have sufficient information about the parties’ plans to make specific access findings.
2. Relocating Inpatient General Acute Care Services Is Unlikely to Impair Regional
Access to These Services
As described in Section II.C, the parties plan to convert Hallmark-LMH to an outpatient
and short-stay inpatient facility and reduce its bed count from 132 to approximately 30 to 40.
The parties also plan to convert NSMC-Union into a behavioral health center of excellence,
closing its 88 non-behavioral health beds. Hallmark-MWH and NSMC-Salem will remain
general acute care hospitals, with significant investments planned to expand inpatient capacity in
light of the Hallmark-LMH and NSMC-Union conversions.248
The parties anticipate that
patients who would have received general acute care services at Hallmark-LMH will receive care
at Hallmark-MWH and patients who would have received general acute care services at NSMC-
Union will receive care at NSMC-Salem. Across the four facilities, these changes would
decrease the net number of beds by up to 110.
Although these changes may have implications for local access to general acute care
services in and around Lynn and Medford, the net decrease in inpatient medical and surgical
capacity will likely not compromise overall access to these services in the region. As described
in Section III.C.2, a survey of general acute care capacity in the region suggests that sufficient
inpatient beds exist. Even after the parties’ planned conversions, we project that a sufficient
number of staffed, unoccupied beds will remain available for patient care, and that other area
hospitals with underutilized capacity will likely be able to accommodate the patients diverted
from Hallmark-LMH and NSMC-Union.
3. Relocating Inpatient Behavioral Health Services May Have an Adverse Impact on
Access to these Services for Vulnerable Populations
As described in Section II.C, the parties propose to relocate all behavioral health beds at
Hallmark-LMH and NSMC-Salem, and “non-medical/psychiatry cases” at Hallmark-MWH,249
to
NSMC-Union, which will become a dedicated behavioral health center of excellence. NSMC-
Union’s behavioral health beds would thus increase from 38 to 140, and the behavioral health
patients who would have received care at Hallmark-LMH and NSMC-Salem would be expected
to receive care at NSMC-Union. Given that Hallmark and NSMC serve a relatively high mix of
government payer patients, who tend to be low-income, elderly, and/or disabled, and given the
248
See Section II.C describing Partners’ investment of approximately $190 million at NSMC-Salem and $152
million at Hallmark-MWH. 249
The parties indicate that Hallmark-MWH will retain “a yet-to-be determined number of medical/psychiatric
beds” Affiliation Agreement, supra note 7, at Exh. 4.4.1, and that up to 25 additional behavioral health beds may be
available for addiction treatment and short stay admissions.
71
unique vulnerabilities of behavioral health patients, we sought to assess potential risks associated
with a change in location of services for these vulnerable populations.
To provide a directional sense of potential impacts of relocating inpatient behavioral
health services for these populations, the HPC analyzed changes in commute times that would
result if patients currently receiving these services at Hallmark-LMH, Hallmark-MWH, and
NSMC-Salem sought services at NSMC-Union. We found that drive times would generally
increase by 50 percent or more.250
This impact would be more pronounced for patients who rely
on public transportation, as there are few public transportation options from the areas near
Hallmark-LMH and Hallmark-MWH to NSMC-Union.251
These increased travel times may
have an adverse impact on elders, individuals with disabilities, and individuals with limited
income, who may have more limited access to transportation services.252
While the parties have
stated they are exploring transportation options to mitigate these burdens, the extent to which this
burden will be mitigated will turn on details which have not yet been finalized.253
In sum, the parties have proposed significant changes to care delivery that have the
opportunity to expand access to a range of services in northeastern Massachusetts and reshape
the structure of care delivery in the region. However, the parties’ current plans lack the detail
necessary to evaluate the extent to which such opportunity will be realized. Given Hallmark and
NSMC’s higher government payer mix and the significant behavioral health services they 250
For patients who would have received mental health services at NSMC-Salem, there will only be a minor
increase in average drive times of a few minutes. For patients of Hallmark-LMH and Hallmark-MWH, average
drive times will increase by 50 percent or more (from an average of seven to 13 minutes, to over 17 minutes, for
patients of Hallmark-LMH, and from eight to 11 minutes, to over 16 minutes, for patients of Hallmark-MWH).
These drive time increases may be significantly greater during peak travel times. 251
Specifically, behavioral health patients in the Hallmark PSA currently using public transportation to seek care at
Hallmark-LMH will have an approximately 90-minute transit time if they seek those services at NSMC-Union post-
transaction, behavioral health patients in the NSMC PSA currently using public transportation to seek care at
NSMC-Salem will have approximately a 37-minute transit time if they seek those services at NSMC-Union post
transaction, and behavioral health patients in the Hallmark PSA currently using public transportation to seek care at
Hallmark-MWH will have approximately an 84-minute transit time if they seek those services at NSMC-Union post
transaction. 252
For more on how behavioral health service delivery can depend on transportation systems, see Grazia Zulian et
al., How are Caseload and Service Utilisation of Psychiatric Services Influenced by Distance? A Geographical
Approach to the Study of Community-Based Mental Health Services, 46 SOC. PSYCHIATRY & PSYCHIATRIC
EPIDEMIOLOGY 881 (2011), available at http://link.springer.com/article/10.1007/s00127-010-0257-4; British
Psychological Soc’y, Common Mental Health Disorders: Identification and Pathways to Care (2011), available at
https://www.ncbi.nlm.nih.gov/books/NBK92265/. 253
The conversion of NSMC-Union into a specialized psychiatric facility may also have implications for the mix of
patients served. As described in Section III.C, while NSMC and Hallmark have a higher mix of government payer
patients, Partners’ specialty psychiatry facility, McLean Hospital, has a high commercial payer mix compared to
similar hospitals in the Commonwealth. NSMC-Union also has a higher mix of commercial behavioral health
patients and the highest mix of commercial patients among the Hallmark and NSMC hospitals. Given these
patterns, there is the potential that the conversion of NSMC-Union into a specialty psychiatry facility and the
elimination of behavioral health beds at NSMC-Salem and Hallmark-LMH may shift the overall payer mix of
behavioral health services provided by the parties in this region. This shift could occur due to any number of
reasons. As Partners does not participate in certain MassHealth programs for dual-eligible patients (the Integrated
Care Organization and Senior Care Options programs), these patients would likely need to seek care elsewhere.
Additionally, depending on licensure models, CMS’s Institutions for Mental Diseases (IMD) restrictions may limit
the use of the NSMC-Union facility for government payer patients.
72
provide to their local communities, the proposed reconfiguration and relocation of services may
adversely impact vulnerable populations as they seek to access services at more distant locations.
Understanding that the parties have not yet made a number of decisions necessary to implement
their plans, we invite them to make specific commitments to ongoing, transparent engagement
with the relevant communities and stakeholders to ensure that final care delivery decisions align
with community needs. Specifically, the HPC invites the parties to provide the following detail
in their response to this Preliminary Report:
Transportation and Continuity of Care
A description of plans to ensure continuity of care for patients whose care location is
anticipated to change, including plans to ensure that behavioral health patients presenting
at emergency departments or urgent care centers receive prompt and appropriate
treatment, and plans to ensure that patients who rely on public transit or otherwise lack
sufficient access to transportation can continue to access services after reconfiguration
(e.g., non-mobile, elderly, and/or complex psychiatric patients who previously received
services at Hallmark-LMH and are diverted to the more distant NSMC-Union).
Behavioral Health Services
A detailed description of plans for enhancing access to behavioral health services,
including any plans to expand inpatient behavioral health capacity, to retain and/or
expand existing outpatient behavioral health capacity (e.g., intensive outpatient, partial
hospitalization, and nursing home psychiatric consultation services currently offered by
Hallmark), to allocate behavioral health services toward specific populations (e.g.,
whether the current mix of behavioral health beds for children, adolescents, adults, and
geriatric patients is anticipated to change), to integrate behavioral health with primary
care and other medical care, to hire additional behavioral health clinicians, and to
clinically integrate behavioral health services in the region with those provided at
McLean/MGH and/or other Partners providers (e.g., any plans for shared staffing,
referrals, exchange of best practices).
Community Need and Stakeholder Engagement
A detailed description of methods to assess, with diverse stakeholder input, community
need for emergency services in Lynn and Medford beyond the parties’ two to three year
commitment to maintain such services, need for and impact of plans to shift volume from
emergency departments to urgent care centers, unmet community need for services the
parties propose to expand (such as orthopedics and gastroenterology), community need
for services the parties propose to redirect (e.g., services that require inpatient stays of
longer than three days redirected from Hallmark-LMH), and community need for services
tailored to vulnerable populations (e.g., services for patients with language and cultural
barriers to care).
73
V. CONCLUSION
As described in Part IV, the HPC found:
1. Cost Impact: This transaction will reinforce Partners’ position as the provider with the
highest share of inpatient and primary care services in its northeastern Massachusetts
service areas. Over time, this transaction is anticipated to increase spending in
northeastern Massachusetts by an estimated $15.5 million to $23 million per year for the
three major commercial payers due to material price effects, which are not expected to be
offset by commensurate savings from decreased utilization through population health
management (PHM).
2. Quality Impact: The differences in Partners and Hallmark’s historic quality
performance indicate potential for the transaction to drive quality improvement.
However, Partners and Hallmark have already been affiliated for nearly 20 years,
including joint clinical and contracting efforts, and it is unclear how this merger is
necessary to improve clinical quality in ways the parties’ longstanding affiliation has not.
3. Access Impact: The parties have proposed significant changes to care delivery that have
the potential to expand access to a number of services in northeastern Massachusetts.
However, the parties’ current plans lack the detail necessary to evaluate the extent to
which such potential will be realized. Given Hallmark and NSMC’s high government
payer mix, the proposed reconfiguration and relocation of services is anticipated to
impact especially vulnerable populations as they seek to access services at new, more
distant locations.
In summary, based on our review, we find that the proposed transaction between Partners
and Hallmark is likely to increase health care spending in northeastern Massachusetts, reinforce
Partners’ market power, and, over time, increase premiums for employers and consumers. While
the parties have described PHM initiatives that have the potential to reduce total medical
spending, those potential savings are unlikely to offset the projected increases to health care
spending. At the same time, this transaction has the potential to improve quality and increase
access to certain health care services. The parties’ current plans lack sufficient detail to enable
us to assess the likelihood that this potential will be realized, or confirm that potential adverse
impacts to vulnerable populations will be sufficiently mitigated. We invite the parties to address
these concerns in their written response, including how they would demonstrate any
commitments in this regard.
Based on these findings, this transaction may warrant further review and referral to the
AGO pursuant to MASS. GEN. LAWS ch. 6D, § 13. These findings suggest, consistent with the
terms of the proposed consent judgment, that further consideration of mitigation of transaction-
specific impacts is likely warranted. Following the period for written response, we look forward
to publishing our Final Report, including any referral to the Massachusetts Attorney General's
Office.

Kate Scarborough, Deputy Director for Cost and Market Impact Reviews, Sasha Hayes-Rusnov, Policy Associate for Market Performance, and Sam Wertheimer, Senior Policy Associate for Performance Analytics, prepared this report under the direction of Karen Tseng, Director of Policy for Market Performance, with significant contributions by Iyah Romm, Director for System Performance and Strategic Investment. Additional HPC staff made significant contributions to this report, including Kate Durlacher, Lois Johnson, Amy Katzen, and Anuraag Chigurupati. The HPC wishes to acknowledge the analytic support provided by Analysis Group, Inc., Freedman Healthcare, LLC, Gorman Actuarial, Inc., Health Strategies & Solutions, Inc., and the Institute for Behavioral Health at the Brandeis Heller School for Social Policy and Management. The HPC would also like to thank the health insurers and providers who provided information for this report for their courtesy and cooperation.
Commissioners
Dr. Stuart AltmanChair Dr. Wendy EverettVice Chair Dr. Carole Allen Dr. David Cutler
Dr. Paul Hattis Mr. Rick Lord Mr. John PolanowiczSecretary of Health and Human Services
Mr. Glen ShorSecretary of Administration and Finance Ms. Marylou Sudders Ms. Veronica Turner Ms. Jean Yang
Executive Director
Mr. David Seltz
Commonwealth of massaChusetts
health PoliCy Commission
Health Policy CommissionTwo Boylston Street, 6th Floor
Boston, MA 02116www.mass.gov/HPC
(617) [email protected]
Acknowledgements