partnership ms. nancy leonard northwest power ... · ms. nancy leonard . northwest power &...
TRANSCRIPT

Presentation to the Northwest Power & Conservation Council
Program Evaluation Review Committee September 13, 2012
Presented by Jennifer Bayer & Jacquelyn Schei (US Geological Survey) 1
Pacific Northwest Aquatic Monitoring
Partnership (PNAMP) (Project 2004-002-00)
Regional Data Management Support
and Coordination (Project 2008-727-00)
2

Can you afford to independently collect, manage, analyze, and archive
all the information you need?
3

Can anyone afford to independently collect, manage, analyze, and archive
all the information they need?
4

PNAMP partners all share the need to “do more with less”
PNAMP provides a forum to enhance the capacity of multiple entities to collaborate to produce an effective and comprehensive
network of aquatic monitoring programs in the Pacific Northwest based on sound science
designed to inform public policy and resource management decisions.
5

T
PNAMP Signatory Partners
ACOE BLM
CDFG CBFWA
CRITFC Colville Tribes
EPA NWIFC
PSMFC
USBR USFS
WA ECY
WDFW
WA GSRO
WA RCO
6
Tribal
State Regional
Federal

Additional Courtesy Members: Charlie Holderman (Kootenai Tribe), Chris Ellings (Nisqually Tribe), Emmit Taylor (Nez Perce Tribe), Ken Dzinbal (WA PSP), Pete Hassemer (IDFG), Lance Hebdon (IDFG)
PNAMP Steering Committee Partner SC Representative SC Alternate SC Courtesy
BLM Al Doelker Karen Blakney, Kim Titus
BPA Jim Geiselman Russell Scranton CBFWA Tom Iverson
CCT John Arterburn CDFG Scott Downie
CRITFC Phil Roger Henry Franzoni Laura Gephart EPA Gretchen Hayslip
NOAA (Scott Rumsey) Bruce Crawford Elizabeth Gaar NPCC Nancy Leonard Peter Paquet
NWIFC Bruce Jones OWEB Greg Sieglitz PSMFC Bruce Schmidt USACE (David Clugston) USBR Michael Newsom USFS Linda Ulmer Steve Lanigan
USGS Steve Waste Eric Archer, Frank McCormick
WA ECY Bob Cusimano Karen Adams WA RCO Keith Dublanica Jennifer Johnson WDFW Dan Rawding
KEY
SC rep, ACTIVE
SC alternate or courtesy, ACTIVE
7

Workgroups/Tasks
PNAMP Structure & Planning Process Executive Network
Steering Committee
Coordination Team
Leadership Teams
8
PNAMP Maintains Open and Inclusive Process
PNAMP has seen in-kind participation from individual participants representing
more than 85 organizations and direct funding from eight entities.
9

PNAMP In-kind Contributions by Organization
Average hours per year (2008-
2011)
10

PNAMP In-kind Contributions by Category of Organization
Average hours per year (2008-
2011)
11

Data Management Partnership History
PNAMP DM Goals in 2005 1) Support inventory and assessment of monitoring
projects 2) Establish working relationship for data consistency
across WGs • NW Environmental Data Network (NED)
• CBFWA DM WG • CRITFC Tribal DM WG • PNW RGIC
3) Leverage existing data standards by collaborating with other data standardization efforts 4) Interact with and support existing data coordination efforts
12

Data Management Partnership History
PNAMP DM Goals in 2005 1) Support inventory and assessment of monitoring
projects 2) Establish working relationship for data consistency
across WGs • NW Environmental Data Network (NED)
• CBFWA DM WG • CRITFC Tribal DM WG • PNW RGIC
3) Leverage existing data standards by collaborating with other data standardization efforts 4) Interact with and support existing data coordination efforts
13

Successes, Strengths, Mission Fulfillment
1. Information sharing (host/convene meetings, workshops)
2. A forum for collaboration & coordination with respect to monitoring programs
3. Developing specific products (final documents, web resources)
4. Initiating pilot projects and developing recommendations appropriate for use at different scales (HLI, ISTM)
Steering Committee and participants offered similar feedback
14

PNAMP Supports Monitoring Collaboration & Coordination
GUIDANCE for monitoring design, methods for data collection, analysis, management, and sharing
TOOLS to make it easier to: – Design & document
monitoring – Collaborate, discover & share
data
15
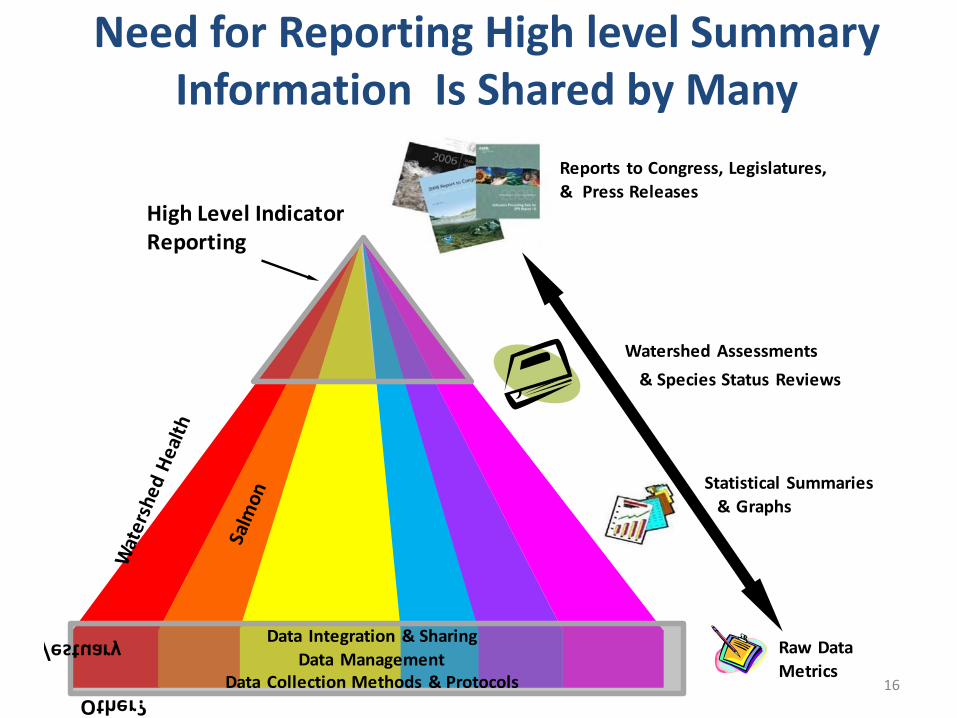
Data Integration & SharingData Management
Data Collection Methods & Protocols
High Level Indicator Reporting
Reports to Congress, Legislatures, & Press Releases
Watershed Assessments& Species Status Reviews
Statistical Summaries & Graphs
Raw Data Metrics
Need for Reporting High level Summary Information Is Shared by Many
16
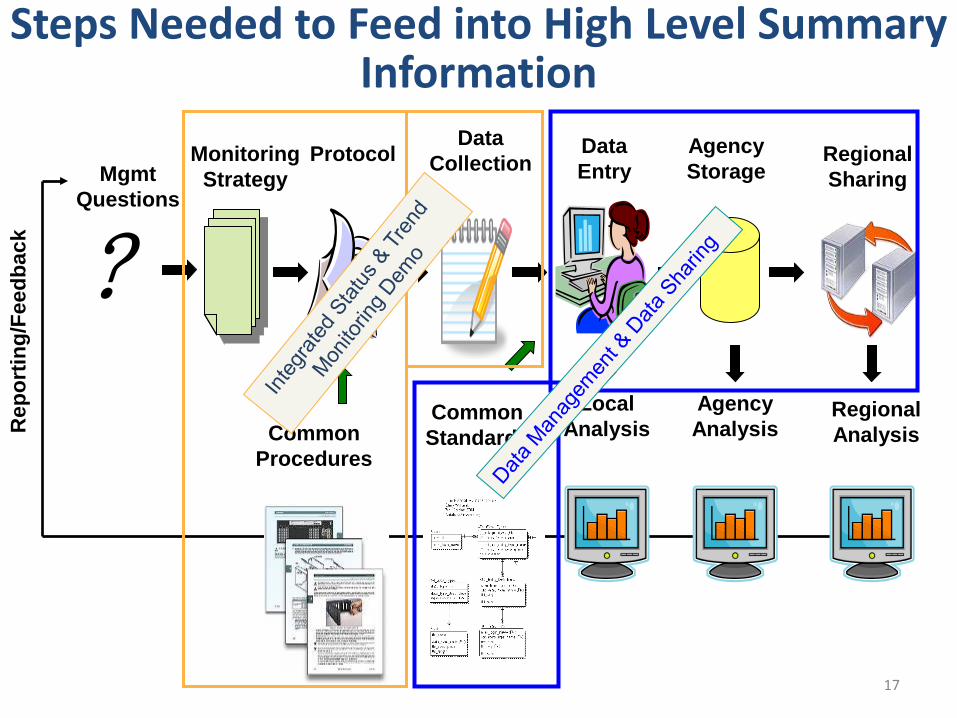
Rep
ortin
g/Fe
edba
ck
Local Analysis
Regional Analysis
Agency Analysis
?
Mgmt Questions
Monitoring Strategy
Data Collection
Data Entry
Protocol Agency Storage
Regional Sharing
Common Procedures
Common Standards
Steps Needed to Feed into High Level Summary Information
17

PNAMP Supports the Fish & Wildlife Program
• Sub-basin Planning: PNAMP monitoring recommendations (2005)
• Proposal review & methods documentation: MonitoringMethods.org (2011)
• MERR monitoring approaches: PNAMP Strategy (2005), topical workgroup input (ongoing)
• MERR Data Access: PNAMP DM Guidance (2012) • ASMS: Coordinated Assessments; ISTM Fish
(ongoing) • TBD HLI for Habitat: ISTM Habitat/HDS (ongoing)
18

Current PNAMP Projects at a Glance Data Management & Sharing • Data Management Best Practices • Habitat Data Sharing Coordination
– ID Priority Habitat Characteristics – Pilot with WA GSRO for statewide
reporting needs (pre-DET work) – Macroinvertebrate Data
• Coordinated Assessments Project (with CBFWA, StreamNet)
• Columbia River Basin Population Crosswalk Geodatabase and Online Interactive Mapping Application (with CRITFC)
Monitoring Design & Data Collection • Methods Review Series • Integrated Status and Trend Monitoring
(ISTM) Demonstration Project – Fish, Tributary Habitat, Mainstem
Components • Effectiveness Monitoring (& IMWs)
Coordination • Remote Sensing Forum
Web Resources • MonitoringResources.org
19

2013-2017 Proposal Deliverables Administrative/General Support • DELV-1: Steering Committee support • DELV-2: Data Management Leadership Team
Support • DELV-3: Administrative Support provided by
PNAMP staff (USGS employees) • DELV-4: Communication and Facilitation
Support Data Management & Sharing • DELV-13: Data Management Best Practices • DELV-7: Facilitate Habitat Data Sharing
Project • DELV-9: Facilitate Coordinated Assessments
Task • DELV-16: Promote Application of the
Columbia River Basin Population Crosswalk Geodatabase and Online Interactive Mapping Application
Monitoring Design & Data Collection • DELV-5: High Level Indicators Coordination • DELV-6: Facilitate monitoring methods reviews • DELV-10: Facilitate regional use of results from
PNAMP ISTM task • DELV-8: Facilitate Effectiveness Monitoring
Coordination Task • DELV-17: Facilitate coordination of remote sensing
applications for monitoring Web Resources • DELV-11: Provide long term support and
maintenance for Master Sample Tracking Tool • DELV-12: Provide long term support and
maintenance for MonitoringMethods.org • DELV-14: Regional deployment of Metadata Builder
Tool • DELV-15: Sustain PNAMP website • DELV-18: Sustain Salmon Monitoring Advisor web
resource • DELV-20: Develop and maintain Monitoring Site
Management online resource • DELV-19: Integrate PNAMP online resources
20

PNAMP sustains collaboration… so work builds towards big goals and
results don’t get lost
• Immediate benefits to partners & participants – Documentation adds values to information collected
• Added value to ongoing projects – State of the Salmon Project – National Fish Habitat Action Plan
• Make new projects possible – SW Washington stormwater monitoring coordination (with ISTM) – USGS Protocol Registry Comparison & Large Rivers Monitoring Forum
• Discussion Underway – LCC’s/CSC/LCMAP/NW Knowledge Network – Conservation Registry – PSEMP
21

PNAMP is a Communication
Forum • Event Calendar
- PNAMP activities - Partner activities
• PNAMP Tools • Announcements • Featured Partner Projects • What We’re Reading
What’s Inside • Projects/tasks pages
describe current activities, support WG’s
• Archive of documents
www.pnamp.org
22

PNAMP Sustains Collaboration
Coordinated Assessments Project
StreamNet
CBFWA
PNAMP
Pacific Northwest • Federal Agencies • State Agencies • Tribes Basin-scale data users Funding sources
Columbia River Basin • State Agencies • CRITFC Data Technicians Data exchange expertise
Columbia River Basin • Federal Agencies • State Agencies • Tribes Federal managers State Biologists/Coordinators Tribal Biologists/Data Technicians
23

Data Best Practices
• The Roadmap: identify best practices for data management and sharing
• Metadata: guidance on standards; support & aid metadata creation & posting
• Data Steward Community of Practice: support data professionals via expert exchange forums, trainings, etc.
• Web Tools: sustain changes over time
24
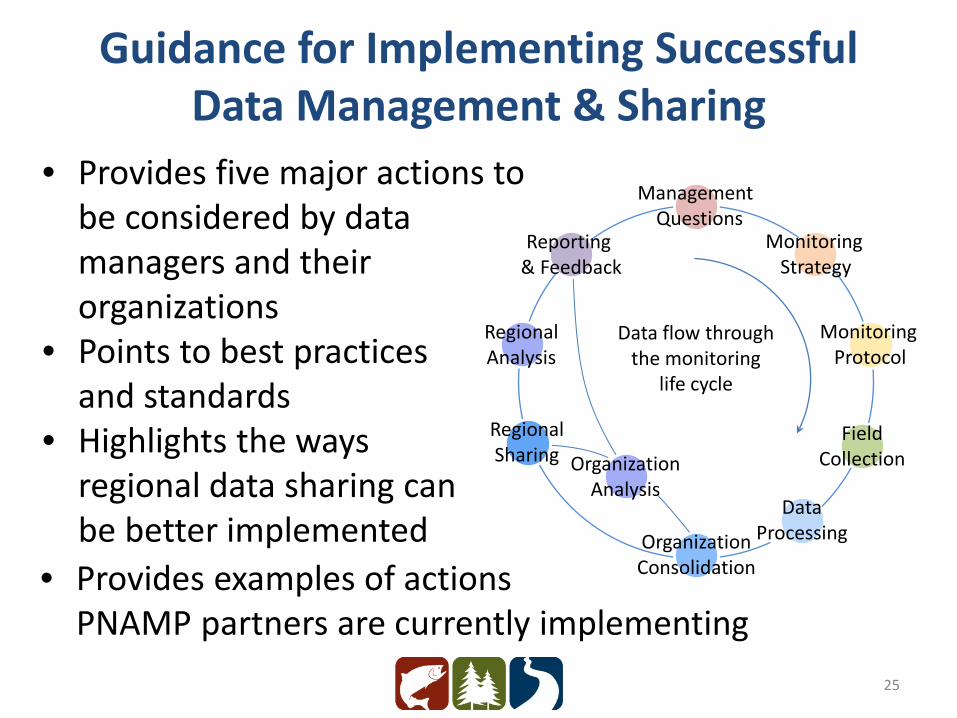
Guidance for Implementing Successful Data Management & Sharing
• Provides five major actions to be considered by data managers and their organizations
• Points to best practices and standards
• Highlights the ways regional data sharing can be better implemented • Provides examples of actions PNAMP partners are currently implementing
Data flow through the monitoring
life cycle
Management Questions
Monitoring Protocol
Monitoring Strategy
Reporting & Feedback
Regional Analysis
Regional Sharing
Organization Consolidation
Field Collection
Data Processing
Organization Analysis
25

Habitat Data Sharing (HDS) Project • Many partners want to access others’ ‘habitat data’ • Conversation includes:
– What are priority habitat characteristics? • Fish habitat, restoration effectiveness, land management • Macroinvertebrate data • Remote sensing data
– Need for habitat indices – Partner readiness to share habitat data – Need for Data Exchange Formats (DEF) – Discovery of partner habitat data
26

Identify & prioritize decisions, questions, and objectives
Determine adequacy of existing programs, potential efficiencies, existing gaps
Identify monitoring designs, sampling frames, protocols, and analytical tools
Use trade-off analyses to develop recommendations for monitoring including
priorities and range of budgets Recommendations for implementation, data
management, reporting, and adaptive management
Monitoring Design & Methods for Data Collection, Management, & Sharing
Focus on Alignment of Existing Programs (from PNAMP ISTM Demonstration Project)
27

PNAMP Integrated Status & Trends Demo
• Document and score monitoring priorities • Evaluate current monitoring
• documented criteria for VSP indicators assess bias & precision of methods
• Identify monitoring gaps (difference between priority and current monitoring)
• Define specific monitoring needs based on gaps • Could be used to refine ASMS results, repeat in future
NEW TOOLS Assess Alignment of Fish Monitoring Programs
28

ISTM RESULTS: Lower Columbia River ESU Oregon Coho
• Development led by ODFW, WDFW, LCFRB
• Deployed first time in Lower Columbia River ESU
• Future use under consideration by other Fish Recovery Boards, states, BPA
Fry/Parr Juvenile Migrants
Adult Recruits (Harvest)
Spawners
Age Stucture
Migration/Spawn Timing Sex Origin
Fry/Parr Distribution
Spawner Distribution
Youngs Bay Low 1.00 1.00 1.00 1.00 1.00 1.00 1.00 1.00 1.00 1.00Big Creek Low 1.00 1.00 1.00 1.00 1.00 1.00 1.00 1.00 1.00 1.00Clatskanie High 0.75 1.00 0.25 0.25 0.25 0.25 0.75 1.00 1.00 1.00Scappoose High 0.75 1.00 0.25 0.25 0.25 0.25 0.75 0.75 1.00 0.50Clackamas High 0.25 0.25 0.25 0.25 0.25 0.25 0.75 0.75 0.25 0.25
Sandy High 0.25 0.25 0.25 0.25 0.25 0.25 0.75 0.75 0.25 0.25Lower Gorge High 0.25 0.00 0.25 0.25 0.25 0.25 0.25 0.25 0.25 0.25
Hood/OR Upper Gorge High 0.00 0.00 0.25 0.00 0.00 0.00 0.25 0.25 0.00 0.00
Cascade
Gorge
Abundance Diversity Distribution
Coast
Stratum Coho PopulationRecovery
Priority
29

ISTM Habitat Partners
PNAMP
ODFW: Aquatic
Inventory
WA Ecology: WHSR
ODEQ: NRSA
USFS & BLM: AREMP
NOAA: CHaMP
Clark Co: Long-term Index Site
Monitoring
SRFB: Reach-Scale
Effectiveness Monitoring
NEW: all stormwater
permittees in SW
Washington
30

ISTM RESULTS: 1000+ Habitat Attributes Measured by Programs
Seven (Programs Measure…) Six Five
Bankfull Depth Channel Unit Composition Embeddedness Bankfull Height Macroinvertebrates Fish Cover Bankfull Width Shade Flow Gradient Substrate Particle Size Number Of Pools Large Wood Temperature Riparian Vegetation Pool Max Depth Pool Tail Crest Depth Four Three Sinuosity Amphibians Presence DO Substrate Composition Bearing Nitrogen Wetted Depth Channel Form Number Of Channel Units Wetted Width Conductivity Phosphorus
Erosion Pool Tail Fines Fish Presence pH Pool Area Residual Pool Volume
Solids Turbidity 31

Data Provider => AREMP CHaMP Clark Co. ODEQ ODFW SRFB WADOE
Data User =>
CHaM
P Cl
ark
Co.
ODE
Q
ODF
W
SRFB
W
ADO
E AR
EMP
Clar
k Co
. O
DEQ
O
DFW
SR
FB
WAD
OE
AREM
P CH
aMP
ODE
Q
ODF
W
SRFB
W
ADO
E AR
EMP
CHaM
P Cl
ark
Co.
ODF
W
SRFB
W
ADO
E AR
EMP
CHaM
P Cl
ark
Co.
ODE
Q
SRFB
W
ADO
E AR
EMP
CHaM
P Cl
ark
Co.
ODE
Q
ODF
W
WAD
OE
AREM
P CH
aMP
Clar
k Co
. O
DEQ
O
DFW
SR
FB
Bankfull Width X X X X X X X X X X X X X X X X X X X X X X X X X X X X X X X X X X X X Residual Pool Depth X X X X X X X X X X X X
All Large Wood Metrics X X Large Wood Volume
and # of Pieces* X X X X X X X X X X X X X X X X X X X X Shade at Mid-channel X X X X X X X X X X X X
Sinuosity X X X X X X X X X X X X X Substrate Particle Size
(e.g. D50) X X X X X X X X X X Temperature X X X X X X X X X X X X X X X X X X X X
Macroinvertebrates Counts X X X X X X X X X X X X X X X X X X X X Riparian Veg Methods X X X X X X X X X X X X
X indicates entities that can use site averaged data from another entity based on 2011 collection methods
* for wood >5m length & >30cm diameter
RESULTS: Sharability Among 7 Programs
32

33

Can anyone afford to independently collect, manage, analyze, and archive all
the information they need?
NO. But if goal is to gather enough scientifically sound
information to adequately assess results & make decisions about future work, how do they get the information?
34

How can we, as a group, collect, manage, analyze, and archive all the information
we need?
Collaborate & coordinate on data collection efforts o Knowledge of who is doing what o Common definitions o Consistent documentation o Common data storage platforms o Data sharing agreements
35
How can we, as a group, collect, manage, analyze, and archive all the information
we need?
F&W Program – FY07-09 project review called for: o More consistent reporting o Establishing a coordinated data management system
Recommendations for best practices o From PNAMP and others
Strategies for RME, Data Management o MERR & Data Access Framework o BPA DM Strategy
36

Help each other gain a better understanding of who’s collecting what information, why and how o Scientific integrity o Promote collaboration and coordination o Better use of limited funds o Institutional memory o Accountability, reporting o Minimize uncertainty about utility of others’ data
For these needs, we need to have more thorough, consistent documentation available about our
monitoring programs and projects.
Better Documentation
37

PNAMP developing tools to make it easier to: o Design and document o Collaborate o Discover data
Promote consistency in documentation Encourage use of common terminology Share info between many systems USGS
Web Resources
KWA KWA KWA 38

Web Resources
MonitoringResources.org
MonitoringMethods.org
Monitoring Sample Designer
Monitoring Site Manager
Program Implementation
Data Repositories
Salmon Monitoring Advisor
Metadata Builder
39

In development; provide central homepage that integrates all tools Provide underlying framework for single sign on Provide guidance, details of users, projects/programs, repositories
40

Promote consistent documentation
Improve access to information Promote community discussions Streamline creation of metadata Help increase interoperability
between data systems
41
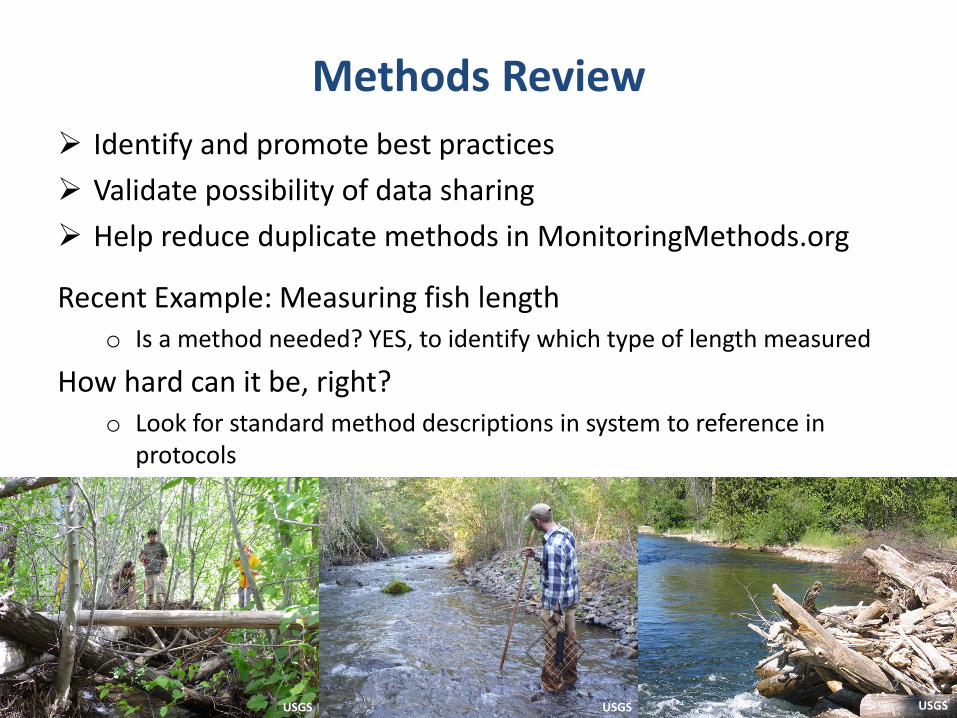
Identify and promote best practices Validate possibility of data sharing Help reduce duplicate methods in MonitoringMethods.org
Recent Example: Measuring fish length o Is a method needed? YES, to identify which type of length measured
How hard can it be, right? o Look for standard method descriptions in system to reference in
protocols
Methods Review
USGS USGS USGS
42

Various descriptions- examples: o Adult fish captured in the Lower Granite Dam adult trap will be
measured from the tip of the snout to the fork in the caudal fin (forklength) in mm.
o Length measurements of juvenile and adult fish are made with measuring boards or tapes according to methods described in Anderson and Neumann 1996. Measurements include total length, fork length, midorbital-hypural length, and postorbital-hypural length.
o WDFW personnel will measure hatchery smolts from the tip of the snout to the fork in the tail in millimeters (mm). Hatchery and wild origin adults captured at adult traps or found during spawning grounds surveys, or hatchery origin adults from the program captured in fisheries (after the program expands) will be measured from the tip of the snout to the fork in the tail to the nearest centimeter (cm).
Methods Review
43

44

New methods; cited from AFS Fisheries Techniques
Methods Review
45

Approve Methods
46

In development; intended user group knowledgeable about GRTS design
Support development of statistically robust GRTS design using a Master Sample, document your design
Output shapefile of sample sites Will offer basic analysis functions
47

In development; works with Sample Designer
Site management– import existing sites (legacy), add attributes – use in designs
View master samples & designs ‘Explorer’ feature – proposed 48

Search, find information about, and see regional monitoring projects displayed on a map With continued support for entering and updating
content, this tool will support many ‘inventory’ needs Gather content via web services and manually
49

Metadata Builder (prototype) Concept from PNAMP Metadata WG – support for development
of a complete metadata record for datasets o Pull information from existing online resources into a metadata
record template (prototype BPA-focused) • Different organizations = different web services • Not all elements will be found; users will need to fill in some
elements
50

51

Complete website transferred from NCEAS Educational resource – monitoring program design
Salmon Monitoring Advisor
52

Complete website transferred from NCEAS Educational resource – monitoring program design Integrate generic concepts into MonitoringResources.org Future – add topics beyond salmon
Monitoring Advisor
53

Offer web services to exchange information; stay up to date Encourage use of bi-directional web services - content is dynamic;
always up to date in both systems
Web Services with Regional Systems
54

Cbfish.org exchanges info with Monitoring Resources
Links to protocols
Screenshot of portion of a proposal in cbfish.org
Web Services with Regional Systems
55

Pisces & Monitoring Resources exchange information o Protocols & Repositories for SOW o Contract info/contact info for Metadata Builder; Monitoring
Methods
Web Services with Regional Systems
56
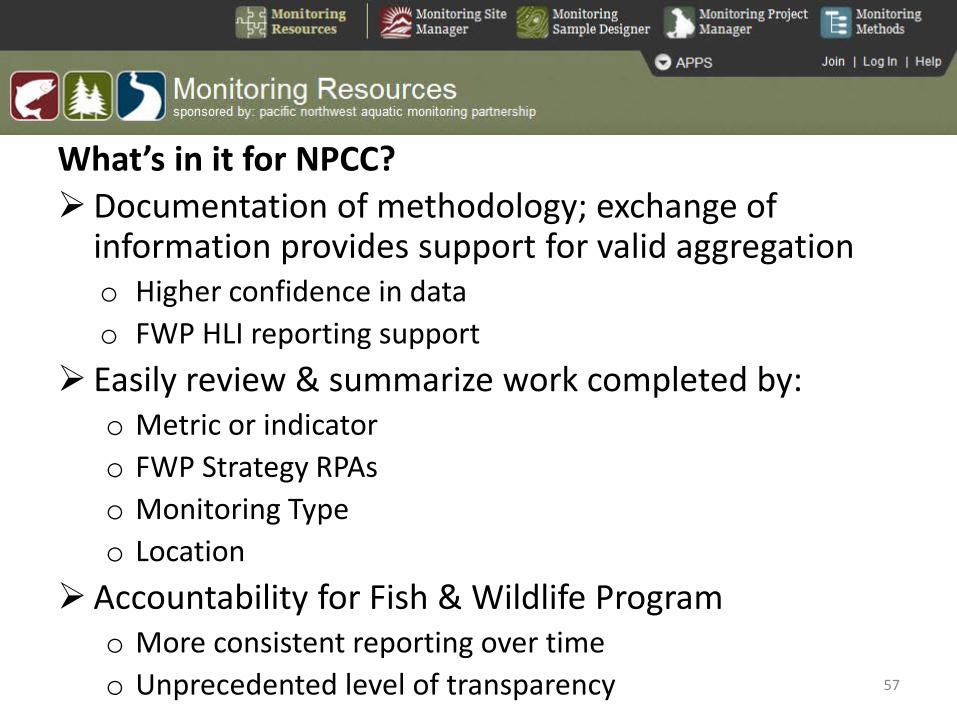
What’s in it for NPCC? Documentation of methodology; exchange of
information provides support for valid aggregation o Higher confidence in data o FWP HLI reporting support
Easily review & summarize work completed by: o Metric or indicator o FWP Strategy RPAs o Monitoring Type o Location
Accountability for Fish & Wildlife Program o More consistent reporting over time o Unprecedented level of transparency
57

What’s in it for users? Improved communication
o Documentation of ‘Who’s doing what, where, how?’ o Opportunities for collaboration/coordination
Access to data management and sharing standards & best practices
Overall, less entry of project info: o Automated metadata record creation o Associate documented info with datasets, SOW, reports o Long term storage of content
Potential to lead to more efficient use of limited funds; more informed funding decisions o Consistent reporting of metrics & indicators o Allow for aggregation of data
58

BUT… System creation, support & training require considerable effort
o Many people help create tools and content Users are often not happy, especially when use is required
o Change from past practice o Some initial work to learn
On the other hand, folks have started to come around… “I wasn’t sure how I was going to fulfill the needs of this process/database. But with the ability to get those closest to the field work/method able to edit the method descriptions in your database directly I think we can achieve what the region seeks here – this works so much better than me having to get the info from the field guys and trying to enter it myself – and makes the end product much more complete and accurate too.”
Bill Bosch, Confederated Tribes & Bands of the Yakama Nation, comment about Monitoring Methods
59

Need commitment to support usage of systems so the results can be fully realized o ISRP Comments from Final Review of Resident Fish, Data Management,
and Regional Coordination Category Review Proposals (ISRP 2012-06):
“The continuation of PNAMP activities, particularly web-based coordination and standardization of study protocols and field methods, is beneficial to the region.” “PNAMP has developed the web-based resource, MonitoringMethods.org, to support data management and sharing. Feedback from users of MonitoringMethods.org should be actively solicited and used to improve the resource. Other web-based tools have been developed or are proposed. The ISRP supports these efforts.” “The ISRP supports the continued development of the standardized protocols and methods in MonitoringMethods.org.” 60

Coordinate
(PNAMP, SN,
CBFWF)
Data Stewards
(e.g., StreamNet
DS SC)
Funding Agencies
(e.g. BPA FWP, OWEB,
WA SRFB)
Monitoring Projects
(e.g. AREMP, CHaMP, LCREP)
Data
Repositories & Exchange Networks
(e.g., Data Store, )
Method/Design Documentation
Monitoring Resources.org Sample Designer
Site Manager Monitoring Methods
Metadata Builder Monitoring Explorer
NPCC &
BPA
Governors &
Federal Caucus
Researchers
Reports
How Projects Fit
61
Project Tracking Systems (e.g. HWS,
Pisces/Cbfish)
Data Access
(e.g. SOTR, Data Store,
IBIS)

What We Need From NPCC
• Continued support & participation: we need long term commitment for maximum benefit
• Details of your priority information needs for – Reporting – Fish & Wildlife Program amendment process
• Your help encouraging states to participate
62
Thanks!
NPCC was one of the organizations that started PNAMP and has been a strong
participant for the duration.
63

Questions?
www.pnamp.org www.MonitoringResources.org
64