partnership returns, 1984 - internal revenue service · partnership returns, 1984 ... of special...
TRANSCRIPT

Partnership Returns, 1984
By Alan Zempel*
Large losses reported by partnerships,frequently generated by deductions in excess ofthe amount invested, allow many taxpayers toshield other income from taxation [1, 21. Thistrend is again evident for Tax Year 1984, al-though to a somewhat lesser extent. For sev-eral years, the two leading industries in termsof losses generated have been oil and gasextraction and real estate. For 1984, oil andgas extraction produced a positive amount ofnet income for the first time since 1976 ($0.8billion) while real estate continued to show alarge loss ($21.2 billion).
DATA HIGHLIGHTS
The number of returns filed by active part-nerships for 1984 rose to more than 1.6 million[3]. This was a 6.6 percent increase over thenumber filed for 1983. The increase was inline with those experienced for other recent
years. Overall, partnerships for 1984 reporteda loss in. excess of $3.5 billion, almost $0.9billion more than the $2.6 billion loss postedfor 1983. Figure A shows, by industrial divi-sion, a comparison of the number of partner-ships and the net income less deficit for 1983and 1 984. .
Losses incurred by real estate partnerships,particularly operators and lessors of build-ings, dominate the 1984 statistics as they havein previous years. Only about 42 percent ofthe returns in this industry had a positive netincome amounting to less than $15 billion.Losses in this industry totalled more than $33billion, which was more than 54 percent of thetotal partnership deficit of $73 billion. Thenet income (less deficit) in this industryexceeded that of any other industry and allindustrial divisions except services, which hadalmost $25 billion in net income (less deficit).
Figure A.. --NLunber of Partnerships and Not Income Less Deficit, by Industrial Division, 1983 and 1984
[All figures are estimates based on samples -- money amounts are in thousands of dollars)
Number of partnerships
Industrial division
1983Change
Nuinber
Total I/ ...................Agriculture, forestry, andfishing ......................
Mining .........................Construction ..................Manufacturing .................Transportation and publicutilities ....................
Wholesale and retail trade ....Finance, insurance, and realestate .......................Services ......................
1/Includes Nature of business not
(1)
1,541,539
136,60359,59663,59226,451
20,132194,360
730,067306,294
1984
(2)
1,643,581
139,30656,54864,60729,.606
(3)
102,042
2,703-3,0481,0153,155
20,578184,841
790,902331,103
446-9,519
60,83524,809
allocable, which is not shown
Percentage
(4)
6.6%
2.0-5.1
1.611.9
2.2-4.9
8.38.1
separately.
Net income less def
1983
(5)
$-2,610,041
-144,856-4,109,760
2,167,975-744,064
-703,4951, 539,779
-13,105,21112,456,811
1984
(6)
$-3,500,024
-749,03069,112
2,193,322-1,100,943
-2,007,0321,666,476
-19,243,71815,583,256
cit
Change
(7)
$-889,983
-604,1744,178,872
25,347-356,879
-1,303,537126,697
-6,138,5073,126,445
*Corporation Special Projects Section. Prepared under the direction ofThomas Petska, Chief. 37

38 Partnershio Returns, 1984
Figure B shows, by industrial division, thepercentage of returns with net loss for 1983and 1984. The decline in. the percentage ofreturns in mining that showed a loss' -from 60to 46 percent, is most flotable. *For the firsttime in a number of years this industry showedpositive net income - (less defili [4]. Formost of the other divisions, there are very fewchanges from one-year to the.next.
Figure BPercent of returns with net loss,by industrial division, 1983 and,1984
AllIndustries
Mining
Construction
T ra n s po rl at ion,Cornmun ica ~ ion, 1983
Electric, GL'Aa and lq34
Sanitary Services
~Vhol,Eale and 1983Ret,jil Trade 1984
Finance,lnsuranc,, 1983and Rea! Estate 19811
Overall partnership statistics for 1984 areonce again dominated by one industrial: div'i-:,
sion, finance, insurance, and' real 'estate.This division accounted for 790,902 partner-ships, nearly one-half of all partnerships.Within Ahis division, one. industry, operatorsand lessors of buildings, accounted -for 536,216returns, or almost one-third
'of all * partner-
ships. , In addition, operators ah'd*
lessors' ofbuildings accounted for almost 50 percent-ofthe total assets- reported by all partnerships.
Partnerships -in the services division showedthe highest level of. net income (less deficit)($15.8 billion). Within. this division, palnerships operating as legal
,services showedthe
largest,.amount of niet...income (less deficit)
($10A 'bill-ion). Other service Andustishowing significant amounts of net income weremedical and health service ($4.6 billion) -andaccounti.ng, auditing, and. bookkeeping services($2.3 billion)
.
Of special interest in Table 2 is the firstpublication Jn 'a'' recent partnership
'Bulletin
article -of the depreciation deduction. Inprevious
Iarticles the"amount of depreciation
has. not - been - presented ' because- it is incom-pl etely reported on the - deduction schedule forpartnerships. in the - fai and in real, estatei,ndustries. The depreciation deduction shownin Table 2 was tabulated from thle Form 4~62,Depreciation and Amortization, and is the totaldepreciation deduction available, to the part-nershio.
Table .2 also contains' an entry for payrollwhich is,new for 1984. This item is' the 'sum oftwo deduction items from.
'the . partnership form,
,salaries And wages before the jobs credit~reduciion and cost -of Tabor from the. cost ofgoods. sold schedule
*'The last data
.introduced
in Table 2 are the number.of. limited partner-ships . These were ..defined as 'partnerships 'withat le~st..o
.ne, partner with liability limited to
-the-_--amountactual-ly-in vested~tnL-the-pa7rt-nei * By law,., every partnership, must haveat least one gen
'eral partner liable for the
partnership,"s obligations.
.Impact of Tax Shelters on Partnership~Data
Tax shelter activity has a major impact on~profits reported, by partnerships. Tax sheltersprovide investors- with a means of realizing a
.profit, while minimizing- the-taxable incomethey must report on their tax returns [5].'Partnerships, a re an effective vehicle foraccomplishing .-these..goals, because partners'investment resources can. be pooled for. a-particul-ar -acti.vity, -and - business- income (orlosses) can be passed through to the partners.-Partnership income is not taxed-directly* [6].
A tax shelte,r creates a mismatching of incomeand deductions to create tax losses and con-verts ordinary income (which is fully taxed)i into tax~favored capital gains income, whiiieffectively taxed at lower rates ~71. ''Forexampl~e, oil and
igas partnerships initially
produce deductions . (and resulting :losses)ma.inly through the expensing of dry hole -andintangible 'drilling costs; only later (if atal 1 ) does , the .. oi 1 o r gas prod ucti on , resul t i nincome.~. In addition, once wells become p
.roduc-
tiiv6,, they are often sold by the partnership,
and the, resulting profit receives favorablelong-term,ciapital gains treatment..
.Two of the most common,means by whi,ch -a tax
shelter pa.rtnership -generates deductions .(and
thereby losses) are through. .borrowing, w~hichcreates :.a. deducti~on for. interest paid,
I
I
Partnership Returns, 1984
through acquiring property, for which a deduc-tion for accelerated depreciation may betaken. Because real estate is usually acquiredby means of a mortgage and buildings areentitled to accelerated depreciation deduc-tions, this industry is well suited to gener-ating these deductions. When property is heldfor more than a year, there is a further taxadvantage because any gain on the sale of thatproperty is a long-term capital gain.
There are other reasons why real estate taxshelters are attractive to investors. Onereason is that real estate activities areexempt from the "at risk" rules. These ruleslimit the amount of losses most investors maydeduct to the amount the investors have "atrisk" in the activity [8]. For partnerships ingeneral, the "at risk" amount is equal to theamount of cash or value of property contributedto the partnership by the partner, plus anyamounts borrowed by the partnership for whichthe partner is personally liable.
Exemption of real estate from the "at risk"rules has made this industry particularlyattractive since the partner may be entitled todeduct losses far in excess of actual invest-ment in the activity. In fact, losses deductedfor the first year of operation can be 10 (ormore) times the size of investment required tobecome a partner. A high ratio of losses-deducted -to-investment can subject the activityto scrutiny by the Internal Revenue Service todetermine if it is "economically viable." Ifit is not, the losses are disallowed.
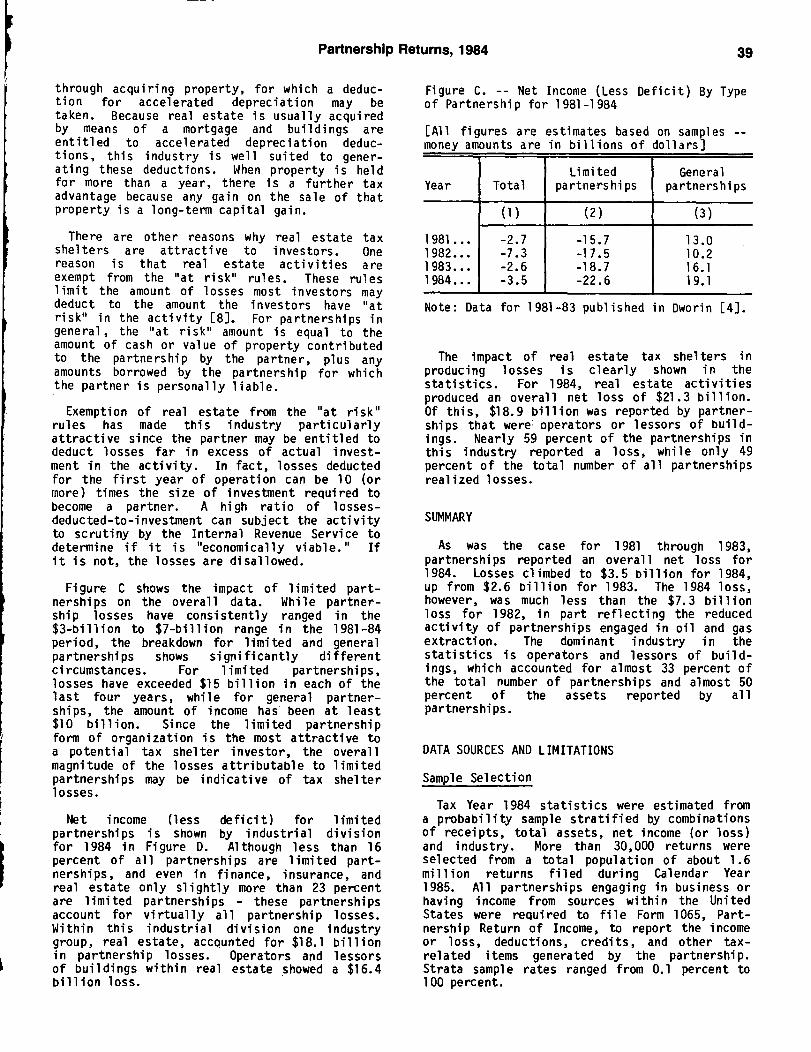
Figure C shows the impact of limited part-nerships on the overall data. While partner-ship losses have consistently ranged in the$3-billion to $7-billion range in the 1981-84period, the breakdown for limited and generalpartnerships shows significantly differentcircumstances. For limited partnerships,losses have exceeded $15 billion in each of thelast four years, while for general partner-ships, the amount of income has been at least$10 billion. Since the limited partnershipform of organization is the most attractive toa potential tax shelter investor, the overallmagnitude of the losses attributable to limitedpartnerships may be indicative of tax shelterlosses.
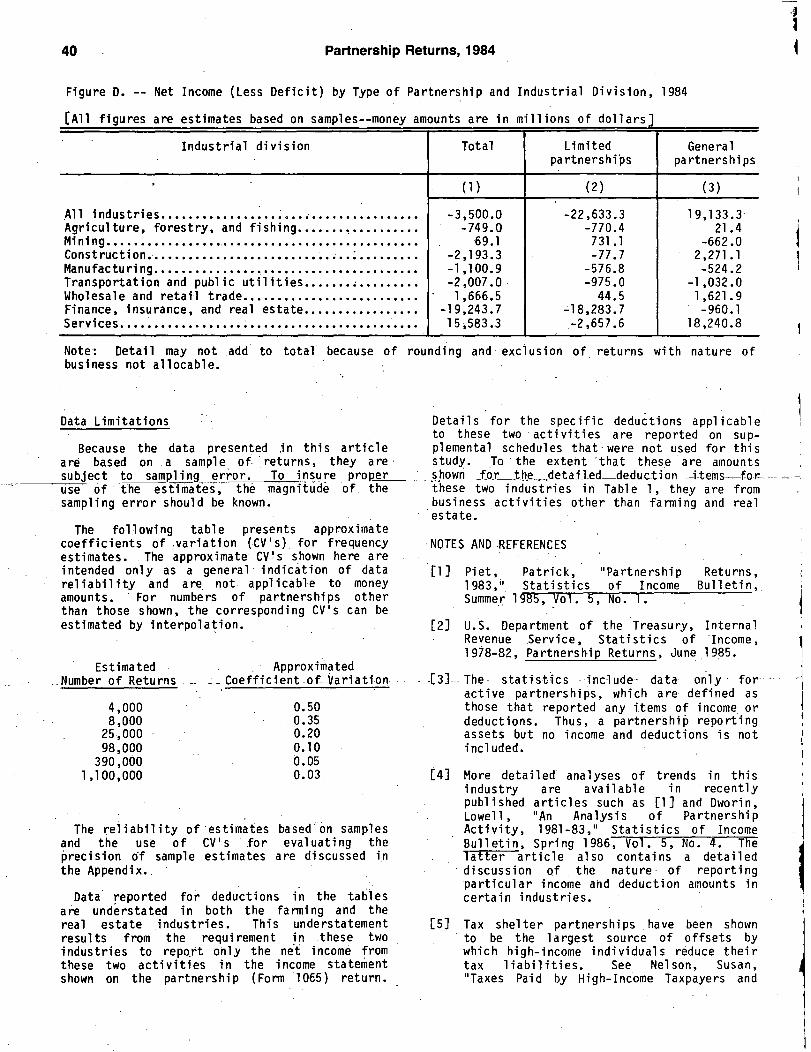
Net income (less deficit) for 1 imi tedpartnerships is shown by industrial divisionfor 1984 in Figure D. Although less than 16percent of all partnerships are limited part-nerships, and even in finance, insurance, andreal estate only slightly more than 23 percentare limited partnerships - these partnershipsaccount for virtually all partnership losses.Within this industrial division one industrygroup, real estate, accounted for $18.1 billionin partnership losses. Operators and lessorsof buildings within real estate showed a $16.4billion loss.
39
Figure C. -- Net Income (Less Deficit) By Typeof Partnership for 1981-1984
[All figures are estimates based on samples --money amounts are in billions of dollars]
Limited GeneralYear Total partnerships partnerships
(1) (2) (3)
1981... -2.7 -15.7 13.01982 ... -7.3 -17.5 10.21983 ... -2.6 -18.7 16.11984 ...
-3.5 1 -22.61
19.1
Note: Data for 1981-83 published in Dworin [4].
The impact of real estate tax shelters inproducing losses is clearly shown in thestatistics. For 1984, real estate activitiesproduced an overall net loss of $21.3 billion.Of this, $18.9 billion was reported by partner-ships that wem operators or lessors of build-ings. Nearly 59 percent of the partnerships inthis industry reported a loss, while only 49percent of the total number of all partnershipsrealized losses.
SUMMARY
As was the case for 1981 through 1983,partnerships reported an overall net loss for1984. Losses climbed to $3.5 billion for 1984,up from $2.6 billion for 1983. The 1984 loss,however, was much less than the $7.3 billionloss for 1982, in part reflecting the reducedactivity of partnerships engaged in oil and gasextraction. The dominant industry in thestatistics is operators and lessors of build-ings, which accounted for almost 33 percent ofthe total number of partnerships and almost 50percent of the assets reported by allpartnerships.
DATA SOURCES AND LIMITATIONS
Sample Selection
Tax Year 1984 statistics were estimated froma probability sample stratified by combinationsof receipts, total assets, net income (or loss)and industry. More than 30,000 returns wereselected from a total population of about 1.6million returns filed during Calendar Year1985. All partnerships engaging in business orhaving income from sources within the UnitedStates were required to file Form 1065, Part-nership Return of Income, to report the incomeor loss, deductions, credits, and other tax-related items generated by the partnership.Strata sample rates ranged from 0.1 percent to100 percent.
40 Partnership Returns, 1984
Figure D. -- Net Income (Less Deficit) by Type of Partnership and Industrial Division, 1984
LAII figures are estimates based on samples--money amounts are in millions of dollars]
Industrial division Total Limited-
Generalpartnerships partnerships
(2) (3)
All industries ...................... ................ -3,500.0 -22,633.3 19,133.3-Agriculture, forestry, and fishing ....... .......... -749.0 -770.4 21.4Mining ............................................... 69.1 731.1 -662.0Construction .............................. ; ......... -2,193.3 -77.7 2,271.1Manufacturing ....................................... -1,100.9 -576.8 -524.2Transportation and public utilities ....... ......... -2,007.0 -975.0 -1,032.0Wholesale and retail trade .......................... 1,666.5 44.5 1,621.9Finance, insurance, and real estate ................. -19,243.7 -~18,283.7 -960.1Services ............................................. 15j583.3 -2,657.6 18,240.8
Note: Detail may not add to total* because of rounding and exclusion of. returns with nature ofbusiness not allocable.
I
Data Limitations Details for the specific deductions applicableto these two -activities are reported on sup-
Because the data presented in this article plemental schedules that-were not used for thisare based on a sample of.*returns, they are - study. 'To*the extent 'that thes.e'are amounts
re prop r ~n~for__the_detai1ed-de d u cti on-i tems-for-subject to sampling error. To insu showUse of the estimates, the magnitude of the these two industries in Table I , they are fromsampling error should.be known. business activities other than fanning and real
estate.The fol 1 owi ng table presents approximate
coefficients of variation (CV's), for frequencyestimates. The approximate CV's s.hown here areintended only as a general- indication of datareliability and are not applicable to moneyamounts. For numbers of partnerships otherthan those shown, the corresponding CV's can beestimated by interpolation.
Estimated Approximated-Number of Returns .------Coefficient of Variation
4,000 0.508,000 0.35
25,000 0.2098,000 0.10
390,000 0.051,100,000 0.03~
The reliability of estimates based*on samplesand the use of CV s for evaluating theprecision 6f sample estimates are discussed inthe Appendix..
Data reported for deductions in the tablesare understated in both the fanning and thereal estate industries. This understatementresults from the requirement in these twoindustries to repQrt only the ne*f income fromthese two activities in the income statementshown on the partnership (Form 1065) return.
,NOTES AND-REFERENCES
P I Piet, Patrick, "Partnership Returns,1983," Statistics of Income Bulletin,.Summer 1985, Vol. 5, No. 1.
r2l U.S. Department of the Treasury, InternalLRevenue Service, Statistics of 'Income,1918-82, Partnership Returns, June.1985.
31--- The- statistics -include- data - only.- foractive partnerships, which are defined asthose that reported any items of income. ordeductions. Thus, a partnership reportingassets but no income and deductions is notincluded.
[41 More detailed' analyses of trends in thisindustry a re available in recentlypubl i shed arti cl es such as [11 and Dwori n,Lowell, "An Analysis of PartnershipActivity, 1981-83," Statistics of
-Income
Bulletin, Spring 1986, Vol. 5, No. 4. TFeT-aTTe-rarticle also contains a detaileddiscussion of the nature. of reportingparticular income and deduction amounts incertain industries.
[51 Tax shelter partnerships have been shownto be the largest source of offsets bywhich high-income individuals reduce theirtax liabilities. See Nelson, Susan,"Taxes Paid by High-Income Taxpayers and

Partnership Returns, 1984
the Growth of Partnerships," Statistics ofIncome Bulletin, Fall 1985, voT-.5,*No. 2.
[61 The partnership (Form 1065) income "bottomline" is not reflective of the totalincome or loss from partnerships that mustbe reported on the tax returns ofpartners. For a discussion of this issueand an analysis of the difference betweenthese two measures, see Dworin, Lowell,"An Analysis of Partnership Activity,1981-83," Statistics of Income Bulletin,Spring 1986, Vol. 5, No. 4.
41
71 For mo re detailed information on taxshelters, see, for example, Skiba,Jonathan W. and Sullivan, Joseph P., TheTax Shelter Answer Book, Pa'~-elPublishers, Inc., Greenvale, NY-1 1984.
rL 8 IJ The "at ri s V rules are detailed, forexample, in the following works: Skibaand Sullivan, op. cit., pp. 71-77, andWillis, Arthur 9-.-,Rennell, John S., andPostlewaite, Philip F., PartnershipTaxation, McGraw-Hill Book Company, NewYork, 1 3.

42 Partnership Returns/1984Table I-Total Assets and Income Statement for Selected Industries[All figures are estimates based on samples--monery amounts are in thousands of dollars]
Partnerships With aridWithout Net Income
Number of partnerships ............................................Number of partners .................................................Tote
............................................................Tota: raescs,elt1sis ..........................................................Sreceipts .....................................................Bu iness
Income from other partnerships and fiduciaries .............Nonqualifying interest and dividends ....... :...................Rents received .......................................................Royalties ...............................................................Farm net profit .......................................................Not gain, noncapital assets .......................................Other receipts .......................................................
Total deductions .................................................. ; ...Cost of sales and operations ...................................
Inventory, beginning of year ..................................Purchases ..........................................................Cost of labor .....................................................Other costs .......................................................Less: Inventory, end of year .................................
Salaries and wages ................................. ; ..............Less: Jobs credit .................................................
Guaranteed payments to partners .............................Rent
paid .............
** ....... ** ...... * ......... *** -...........
interest paid .............* .... * ... * ...... - ............... *
...........Taxes paid ............................................................Bad debts .............................................................Repairs ................................................................Depreciation ..........................................................Depletion ..............................................................Pension, profit sharing, annuity and bond purchase
plans ................................................................E yee benefit programs ......................................'m' loNet oss from other partnerships and fiduciaries ..........Rent net loss .........................................................Royalty net loss ......................................................Farm not loss ........................................................Net loss. noncapital assets .......................................Other deductions .....................................................
Not Income (less deficit) ...........................................Net income ............................................................
-Deficit ..................................................................
Partnerships With Net Income
Number of partnerships .............................................Number of partners .........................................Total assets ....................................................Total receipts ...........................................................
Business receipts ....................................................Income from other partnerships and fiduciaries .............Nonqualifying interest and dividends .............
...Rents received ...............i ..............................Royalties ...................................................... 1: ~::::: ~Farm not profit .......................................................Not gain, noncapital assets .......................................Other receipts ........................................................
Total deductions .......................................................Cost of sales and operations ..........................
Inventory. beginning of year .........................Purch sas ..........................................................Cost of labor .....................................................Other costs .......................................................Lessr. Inventory, end of year ................. : ...............
Salaries and wages ................................................Less: Jobs credit ................................................
Guaranteedpayments to pann Is .............................
-Rent paid .......... ............ ...... .........*.......
interest paid ..........................................................Taxes paid ............................................................Bad debts .............................................................R:pairs ................................................................
preciation ..........................................................Depletion ..............................................................
nsion, profit sharing, annuity arid bond purchaseplans .......................................................
Employee benefit programs .............................Net loss from other partnerships and fiduciaries ..........Rent not loss ................................. : ......................Royalty net loss ......................................................Farm not loss .......................................................Net loss, noricapital assets ......................................Other deductions ....................................................
Not Income .............................................................
Ali
1,643,"l12,426,721
1,030,848,519375,192,511318,342,380
4,136,68516,651,20519,112,M
1,139,5861,587,3262,892,749
11,329,715378,692,535180,857,82241.480,731
100,358,7817,826,231
70,638,08239,"6,01428,522,626
22,517,517,5037,533.29
25,437,6 :'73
7:1'2.
1
530,11871 .210021,420,421
26,
398,850
2,
669.01389,944252,03
58.1-3,500,02
_69,696,9:2473,196,94Q
633664.1421,1647'~3
258,326,98214,347.924
3 1133,: :.49245
15,21111,goo0:.
1.557,856~2,080,29717,784,233'
168,629,321
'r_
16: l:4
6620318~5 ~_7 ~5729 111 112,237,921,370,912
18,2523,482,5555,176.2208.365,1304,057.822
301,6281.290,767
192,824
72"6406Z41:214 2. 0740,287
. 22.109
1297100230,394,97769,696,922
Total
(2)
139,3064914,39.3
9]
26,738.828,4935 1~688 '7'22
258,27482,782
1.503,518297,195111,499
'9,242,2293,498,298
505,8282,321.413
177.80985,8707492.64378.8220
31254.8
76,1363,29088.03131
519:411 ,
5.85
12,571
8.18196,6503,635
25.554-
. 2.505,90~9
27 11.205:369-,?49,03~
~Z478,1513,227.181
72,835230,866
9,688,7836,131,4954,003,756
1j.:371317
177,98265.6871
1,479114:2'51''641314
3 42,296,64
278,2711,452,3115
552. 3.:,8261
195,655216,718
1176,66935,0119273048:712
76:6'1
6,03~
56743~3$5,16~3,s51
603:
5
55
32,41 1511
Total
(3)
'677fi:
3.1122
Vil2130213.8177.80
1.464,85246,0 4
67,9316,092,0582,110.767
356,1631.408.612
70,128650,867375,018152,190
11199,68736,422
194,73440.12817,84644,102
1,351
3,8565,701
176,99322,472
-2,300,380622
24:568098-606,945
~2,038,86q2.645,8061
58,788197,598
8,449,5284,275,1262,239,529
19,624204,434171,658
60,965
1'44 ' 1 6'1 05:2 7 ,132,484
2,236,2661,572,853
237,3499911,072
49.795469,948180,325
83,76411
61,30919.7376496623:993
22:.497
30
3,544,2,3675,101
711
25~4334
Field crop
(4)
41".6
7,563,ojis
.6
1,990.6
13'14
24169.2439151,39
732.6137,698
9,0411,597,877
445,414173,40290.627
38,876108,702166,213
80,3692
70,33916,94146,85022.115
1135~28.24~
1 ,
2,53~
5.01901317:02;-
607.853
10,066180,148392,779
-1.023,547630,769
27,5702,34,003.5
11,561,76
537,1513.171,09
145.16151,37
726,16913,2324,412
538,216282,280133,970171.46fi
34,15355,786
113,10942,678
.233,825
8,91515,99415,663
78114,704
2,5361,8161.087
163
8,4702,369
81,5451,023,547
(5)
380
262,80671,548
1813,382
2,0611,712
170.015164
3,90799,37458,982
70140,336
2,18118.58912,825,672
94,866
1321,905
738JP
851
-
-130
3,082412-
13,39142
7,852163,432182,323'18,8901
1,594,331
326,605240,687
55,856-
11,75239-
170.010157
2,76758,26544,557
59437,884
-8,7322,6532,649
9-1,110
40379475-
546
3,044
1,40'
3,073,2,32
Agricultme. forestry, and fishing
(6)
a25~r764,111 22
404,30300213.044.5,4857,333 0314,922
-86727297;~076976
00,
7 365
is
1117:2217,32.272718.9658,20,0511,931-
25,7273,509
38,3726.85
12,956
4257
12,9501,379
-460:~27.~f 7
73,944-369,356-150,974
520,331
3,67730,678
1,471,202274,263117,998
5,40138,21112,142-
81,49416,802
2,214123,289
61,58510,16526,0409,351
25,9559,9254,796-
1,1421,600
10,6682.504
922,004
429~53
930
5
::2'271150,97
Farms
Fnjit. andtree nut
Beef cattlefeedlots
(7)
16"62
43853294
11266634
3,41,50
572013
2
02 095 0221 ~Oeg18.75
219.1801,23
1518,228,2-
7218
3'
'2
1 .073
21841'~7
2113:~ITJ
24.47
29,230,071If
1,1483,413
373,643207,371179,943
3463,2581,265
5720,135
281,820
178,127140,14415,222
138,64845-
13,7708.224-
1,722611
3,015515
1,CW7
2984
U!21A,24
Bee came.fMCePteadlots
11:5 ~87~'a33,83,6
aa~:738'l13..12112
3,3
1
048814
1)1,8920.7
1,206,822"9,7172,393
387,5531,179
93.910105.315
6,941
-30.3866421
":3821723
10
31353
140,2085-
3933602
11,'96~.2344,282
-212,244556,526
8,80921,780
797,992649,905398,396
45449,970
7.8508,032
120,85058,532
5,822437MI344,308
15,008275,361
1,01161,0958,1682,056-
1782.051
12.8448042~2210
1
2
32 237
'r241212 4
Hogs.sheep.
and goats
5: 117326
7"
1
2":4141.761611
1,413
--42,1712.1.15.033
264,894178,009
4,37594,237
-91,05911,661
346
-6,02391
4.1061,8
-1111
i2~-
58 80
6~1711;1-16,4800
-45; 061,48~
3,6247,767
59,798182,361133,170
-1,399--
42,171658
4,963137,359125,19
3.2060.82
-61,215
49199-
5,725
2.073
1'-1~
-
4,090~4S,0021
ItemDairyterms
18,32842,257
2,173,120579,"l336,130
1618,031
8.5357,815
170,61434.9.73.313
664,101231,42952.10994,895
2,27487,8255,6736,640-
43,4054,4409.4242,290
861,6D4
184
-515624-
331,947.,231
16,671-84,740-227,359312,099
8,12917,700
758,383507,580319,407
1612,569
3,542515
161,2147,8322,486
280,222224,33652,10987,6232,274
87,4165,0863,627-
10,033--4,2368.0191,943
861,543
-
184
435
-11,161--
10,657227,359

Partnership Returns/1984Table 1-Total Assets and Income Statement for Selected Industries-continued(All figures are estimates based on samples-money amounts are in thousands of dollars]
43
Agriculture, forestry. and fishing-Continued Mining Construction
Farms-ContinuedA
Special TradeContractors
Item General&ou
services TotalOil arid
gasOther Total General
Poultry ivestockinckidirg
Other forestry., extractionmining contractors
Totaland eggs
animalfarms and fishing
specialty(11) (12) (13) (14) (15) (16) (17) (18) (19) (20)
Partnerships With andWithout Net Income
Number of partnerships ............................................ 978 6.418 4,544 26,489 56,548 50,980 5,568 64,607 26,574 39,001Number of partners ................................................. 2,552 20,607 10,316 104,718 2,007,460 1,883,264 124,196 173,273 65,095 108,083rotal assets ............................................................ 542,866 1,776,755 384,709 4,694,915 52,415,093 41,265,5" 11,149,563 13,783,426 11,750,740 2,032,616rotal receipts .......................................................... 357,354 354,107 140,713 3,008,087 22,054,470 17,460,989 4,593,481 23,847,838 16,326,709 7,483,613
Business receipts ................................................... 324,627 200,974 85,538 2,772.581 18,637,767 14,177,318 4,460,449 23,198,439 15,746,593 7,414,330Income from other partnerships and fiduciaries ............ - 578 - 920 1,114,131 1,098,259 15,872 123,454 121,102 2,352Nonqualltying interest and dividends .......................... 645 27.605 4,903 51,811 423,420 379,247 ",173 212,516 191,606 20,910Rents received ...................................................... 315 3,048 1,544 44,458 41,585 30,012 11,573 74,895 52,056 22,839Royalties .............................................................. - 4,919 - 4,980 551,565 545,610 5,955 1.933 583 1,350Farm not profit ...................................................... 31,618 41,004 48.719 38,658 1,966 1,895 71 122 122 -Net gain, noncapital assets ...................................... 6 61,315 - 51,111 154,482 150,836 3,646 36,963 28,399 8,563Other receipts ....................................................... 142 14,664 10 43,568 1,129,554 1,077,812 51,742 199,516 186,247 13,269
total deductions ...................................................... 350,197 673,554 175,892 3,160,171 21,985,357 16,673,646 S,311,711 21,654,516 15,213,565 6,429,629Cost of sales and operations ................................... 230,516 153.156 35,215 1,387,532 5,924,109 3.356,057 2.568,051 17,192,497 12.975,383 4.217,114
Inventory, beginning of year .................................. 2,102 5,540 9,246 149,665 433,155 173,984 259,171 3,239,050 2,969,751 269,299Purchases .......................................................... 66,722 158,822 23,964 91Z8011 1,930.832 1,434,720 496.112 5,369,539 3,065.851 2,303,688Cost of labor ..................................................... 730 1,845 2,849 107,680 450,426 61,919 388,507 1,776,600 1,221.946 554,654Other costs ....................................................... 165,306 20.090 6.724 335,012 3,586,182 1,894,954 1.691,227 9,998,213 8,471,944 1,526,269Less: Inventory, end of year ................................. 4,344 33,137 7.568 117,627 476,486 209,520 266,966 3.190,907 2,754,108 436,799
Salaries and wages ................................................ 8,667 9,634 13,756 226,636 535,355 300,402 234,953 837,080 321,132 515,948Less: Jobs credit ................................................ - - - 303 229 229 - 1,096 358 738
Guaranteed payments to partners ............................. 2,909 7.268 7,051 55,163 132,832 116,652 16,181 405,140 249.972 155,167Rent paid ............................................................. 1,465 961 1,652 39,758 285,384 227,013 58,371 119,355 65,919 53.436Interest paid .......................................................... 7.065 19,273 19,663 168,556 1.446,686 1,151,108 295,579 475,227 372,544 102,683Taxes paid ............................................................ 1,168 1,534 1.914 47.903 626,753 471,390 165,363 223,235 116,253 106,982Bad debts ............................................................. 2 14,155 17 1,571 30,780 25,164 5,616 10,531 5,799 4,732Repairs ................................................................ 3,413 1,367 939 71,754 85.882 36,498 49,384 99,231 35,066 64,165Depreciation ..........................................................Depletion .............................................................. - 15 - 11.229 204,971 22.642 182,329 745 455 290
Pension, profit sharing, annuity and bond purchaseplans ................................................................ 122 221 24 4,329 23.366 6,677 16,689 8,731 4,63 4,095
Employee benefit programs ...................................... 153 214 - 949 25,469 6,184 19,28$ 10,590 5,950 4.640Not loss from other partnerships and fiduciaries .......... - 9,552 - 16,642 686126 611,881 74,245 19,334 18,620 714
Rent not loss ........................................................ - 1,845 3,082 6:792 5,617 1,175 50,205 49.775 430Royalty net loss ..................................................... - - - - 12,138 11,929 209 6 6 -
Farm net loss ....................................................... 23,444 379,071 4,078 205,523 9060 9,060 - - - -
Net loss, noncapital assets ...................................... - 742 - 3,296 53:863 52,126 1,737 9,641 9,476 165
Other deductions .................................................... 58,006 38,967 64,648 637,272 8,946.145 7,932,128 1,014,017 1,742,544 831,757 899,463
Not Income (loss deficit) .......................................... 7,156 -319,447 -35,178 -142,084 69,112 787,343 -718,230 2,193,322 1,113,145 1,053,985
Not income ..........** ........... ** ................. ** ....... * ... * ...
5205 61,930 5418 439,291 7,857,115 7.348,703 508,411 2,966,387 1,707,116 1,233,078Deficit ..................................................................... 44:8 381,377 89:3 581,375 7,788,002 6.561,361 1,226,642 773,065 593.971 179,094
Partnerships With Net IncomeNumber of partnerships............................................ 641 1,688 2,002 14,047 30,606 26,813 3,794 46,921 15,428 31,461
Number of partners ................................................. 1,554 3,495 4,520 33,268 1,359,138 1,320,479 38,659 110,082 40,431 69,557
Total assets ............................................................ 391,777 200,509 66,081 1,239,255 24,208,151 21,583,632 2,624,520 7,807,779 6,358,493 1,449,116
Total receipts .......................................................... 332,751 209,670 108,875 1,856,368 17,792,218 14,575,138 3,217,080 19,419,157 13,151,784 6,229,858
Business receipts ................................................... 300.063 140,746 56,792 1.764,227 14,713.880 11,596,671 3,117,208 18,943,340 12,724,409 6,181.415Income from other partnerships and fiduciaries ............ - 241 - 755 1.102,200 1,086,359 15,841 122,215 119,922 2,293Nonqualifying interest and dividends .......................... 607 10,891 4,685 23.883 263,924 231,762 32,161 177,830 159,643 18,186Rents received ...................................................... 315 438 902 6,325 24,571 18,067 6,504 25,241 15,519 9,722
Royalties .............................................................. - 473 - 4,722 517,989 512,323 5,667 1,906 555 1,350Farm not profit ...................................................... 31,618 41,004 46,489 38,658 1,759 1,734 25 122 122 -
Not gain, noncapital assets ...................................... 6 8.026 - 8,983 113,301 111,213 2,088 31,652 23,503 8,149Other receipts ....................................................... 141 7,852 8 8,816 1,054.594 1,017,009 37,585 116,851 108,109 8,742
Total deductions ...................................................... 280,699 147,740 54,689 1,417,077 9,935,103 7,226,435 2,708,668 16,452,771 11,444,669 4,996,779
Cost of sales and operations ................................... 205,790 119,891 24,764 723,795 4,019,098 2,430.629 1,588,469 13,745,488 10,288,076 3,457,412Inventory, beginning of year .................................. 2,102 4,526 "a 40,922 235,900 123,526 112,374 1,741,484 1,533,929 207,555Purchases .......................................................... 55M5 125,805 16,573 456,313 1.380,887 1,051,497 329.389 3,968,176 1,949,041 2,019,135Cost of labor ..................................................... 730 - 2,230 33,757 324,702 42,068 282,633 1,443,709 1,030,280 413,430Other costs ....................................................... 151,456 12,199 6.094 208,134 2,322,648 1.333,383 989,265 7,976,475 6,895.557 1,080,916Less: Inventory, end of year ................................. 4,344 22,640 580 15,331 245.038 119,845 125,193 1,384,358 1,120,731 263,627
Salaries and wages ................................................ 8,616 4,983 5,935 132,954 259.976 84,262 175,714 627,044 218,193 408,851Less: Jobs credit ................................................ - - - - 3 3 - 1,092 356 735
Guaranteed payments to partners ............................. 2,839 3,818 918 15,360 81,208 72,637 8,572 158,202 92,410 65,792Rent paid ............................................................. 455 945 884 15,274 127,754 92.980 34,774 69,546 25,516 44,030Interest paid .......................................................... 3,480 2,665 5,826 27,765 422,292 378,255 44.037 171,805 121,787 50,018Taxes paid ............................................................ 1,041 650 708 24,718 486,771 376,965 109.806 155,340 85,420 69,920
Bad debts ............................................................. 2 37 17 610 18,169 16.591 1,579 7,945 4,093 3,851Repairs ................................................................ 1,939 593 264 63,713 57,375 27,162 30,213 65,688 24,774 40,914
-Depreciation ..........................................................
; ; ; -Depletion .............................................................. - 14 - 6,00 173,930 2,30 171,62 745 455 290
Pension. profit sharing, annuity and bond purchaseplans ................................................................ 122 221 24 2,129 15,185 3,896 11,289 6,272 2,942 3.33C
Employee benefit programs ...................................... 153 131 - 867 9,869 Z149 7,720 8,485 4,952 3.532Not loss from other partnerships and fiduciaries ...........
-
12 61 159,295 158 602 693 4,576 4,107 469Rent not loss ......................................................... 3,08
8
3,323 3305: 18 9,218 8,788 430Royalty net loss ...................................................... - - - - 6 6 -
Farm net loss ........................................................
1
2 744 5,985 5,985 - - - -
Not loss, noncapftal assets .......................................
1
- 6,435 4.763 1,672 356 272 84Other deductions ..................................................... 49
"180
10.0
13,232 319,989 2,950.893 2,573,666 377,227 1,188,287 487,010 689,954
Net Income .............................................................. 62-05 61
'93
54,186 439,291 7,857,115 7,348,703 608,411 2,966,387 1,707,116 1,233,070

44 Partnership Returns/1984.Table I-Total Assets and Income Statement for Selected Industries-Continued[All figures are estimates based on samples-money amounts are in thousands of dollars]
C~ortstructxrn-Ciontinued manufacturingSpecial trade contractors -Continued
Item F~Eq. Painting, .paper
Masonry.Stonework Contractorsi,
ontractors
Lumberand wood Machinery Other
Ins"flu-hanging
,his set. not
notTotal Wrxiticts.
except and alliedexcept
electrical lecturingcondition- and
tar
elsewhereclassified
allocable furniture industries industriesing decorating
-P rig(21) (22) (23) (24) (25) (26) (27) (28) (29) (30)
Partnerships With andNth-out Net, Income
Numberof p rtn rehips ............................................
: 8. .4,252 4,199 24, 31 29,606 2,162 4,414 1,018 22,012
Number of p ... ................................................. . 11,279 14,156 - 9,072 73,577 94 93,601 6,SM 19,094 2,M 65,673Total assets ............................................................ . 298,494 98,408 96,867 1,538,747 170 19,674,057 2,053.582 1,260,481 337,851 15'92Z143Total receipts ........................................................... 1,230,657 . 580,228 798,252 4,874,476 37,515 18,944,907 2,254,788 1,688,556 240,360 14,761203Business receipts ...................................................
Income from other partnerships and fiduciaries1,214,737- .573,770
1 807796.947
- 4,828.877544
37.515 18,326,3825 52
2.213,383 1,561.892 168,348 14.382:759............Nonqualifying interest and dividends .......................... 2,106
,475 738 17,592
- ,2134,206
67111,679
-14 527
-18 287
4,58189 713Rents received ...................................................... 11,739 4,115 187 6,798 78,663 3,398
,2,816
,51,976
,20,472
Royalties ..............................................................Farm not profit ......................................................
--
--
-- 1.350
-82.737- 8,318- 63.469 - 10,950
Net gain, noricapital assets ...................................... 27 62 6 8,469 110,411 7,308-
5,075-32 97 996Other receipts .......................... 6 ............................ 2,047 - 375 1OM7 - 207,254 10,031 40,776 1,715
,154,731Total deductions ...................................................... 977,856 398,373 718,229 4,335,171 11,323 20,045,849 Z474,642 1,653,738 200,515 15,716,954Cost of sales and operations ................................... 716,868 211,148 367,445 2,921,653 - 14,237,424 1,760,942 788.160 140 619 11 547 703Inventory, beginning of year ..................................
Purchases30,340 827 4,381 233.752 1,506.345 208,669 40,546
.31,340
, .1,225,790..................... : ....................................
Cost of labor ............ : ........................................455,50172,338
85,42936,831
211,14369 147
1,551,615376 337
9,571,4591 437 464
826,702317 169
315,443119 655
95,2608 030
8,334,054992 609Other costs ..: ....................................................
Less: Inventory, and of year ..................................217,49658 808
88,839779
,112,28629 512
,1,107,648
3470
, ,3.804,3612 082 208
,622,465214 065
,357,727
,34,076
,2,790,092
Salaries and wages ................................................Less: Jobs credit .
,42,040 53,653
,158,353 26 31
, ,928.755
,69,829
45,211227,527
28.0875,890
1.794,845625,509.................. ..............................
Guaranteed payments to partners .............................-
7,686-
25,211-
25,4313
96,8F81,372
132.861294
18,488445
38 559-
2 464633
73 351Rent paid .................................... : ........................Interest paid
14,2957596
1.063 6.750 31,328 205,701 27,123,
20.046,
1,223,
157,310..........................................................Taxes paid :
,13 013
2.10815 952
12,2042
81,612 614,043 146,083 42,849 11,104 414,007............. .............................................. . , 1 ,407 65,610 209.394 43,364 29,026 829 136,175Bad debts .......................... : ..................................Repairs
1,9003 742
- . 753 2,078 37,025 5,919 6,245 191 24,670................................................................Depreciation ..........................................................
, 955 16,920 42,548 160,486 74,339 5,883 339 79,925Depletion .............................................................. 263 27 37,627 33,148 - - 4,479Pension, profit sharing, annuity and bond purchase
plans ................................................................Employee benefit programs ......................................
-379
1,9142.146
2,1802,115
24,57662,247
2,4114,699
5,13113 634
259102
6,77543812Not loss from other partnerships and fiduciaries .......... 59 21 11 624 23,216 3.160
.276 - 19:781Rent net loss ........................................................ 51 52 - 327 27,996 104 a 27 885Royalty net loss ..................................................... - - - 113 - ,
113Farm net loss .......................................................Net loss noncapital assets
-76
- 4,783 1,749 - 3,035-, . . . . .. . .........-_.. ......-Other-deductions - - -
89- -
7,503-
2,602-
52- -
4,850........... ; .......... ;.;.-. ........... **'
.MM. o ..... 126,848 .79,370 96,877 596,368 11 .323 2,241,024 160.308 43 6,617 29,753 1,614,346Net Income (less deficit) ................................. ......... 252,801 181,655 . 80,023 539,305 26,192 -1,100,943 -219,853 34,818 39,944 -955752Net income ..........................**..... * .... * ..... **"**
..........Deficit
263,268 186,834 86,475 696,502 26,192 1,165,440 73,457 212,446 51,331 828:207...................................................... : ............ 10.466 4,979 6,451 157,197 - 2,266,383 293,310 177,628 11,486 1,783,959Partnerships Nth Net Income
Number of partnerships ............................................. 3,S87 4,298 3,949 19,628 31 14,943 1,638 2,941 493 9,870Number of partners ................................................. 9,704 9,092 8,572 42,189 94 37,144 4,512 7,059 1,017 24,SS7Total assets ............................................................ 268,818 87,285 48,782 1,044,232 -170 S,521,206 433,053 721,306 192,920 4,173,926Total receipts ............... : ..................................... :... : -1,121,590 433,195 700,690 3,974,383 37,515 10,350,644 913,736 1,175,762 217,678 8,043,447Business receipts ...................................................Income from other partnerships and fiduciaries
1,116,799 426,9931 807
699.511- 3,938.11
4837,515 10.062,865 893,951 1,146,633 155,747 7,866,533............
Nonqualifying interest and dividends .......................... 2.106.475 611 14,995
4,96055,338
6367,326
-12,603
-8 206
4,32427 203Rents received ......................................................
Royalti;s623-
3,859 187 5,053 61,041 354 12,730,
51,978,
5,979..............................................................Farm not profit ...................................................... - -
- -- 1,350- 9.573- 1- 61-
- 9,511Net gain, noncapital assets ......................................
.27 62 6 8,055 104,829 6,071 4
,961
-32 93 765Other receipts ....................................................... 2,035 - 375 6,332 52,039 5,398 8,794 1,715
,36,133ToW deductions ...................................................... 858,322 246,361 614,215 3,277,881 11,323 9,185,204 840,280 963,336 166,Ua 7,215,240Cost of sales and operations ...................................
Inventory beginning of year641,80030 151
134,357147
336,0154 223
2,345.24C7
- 6,914,599 613,290 553,062 134,053 5,614,195, ..................................Purchases ............................ m ............. ...............
,447,192 48,885
,185,614
1 3,0331.337,444
675.7844,700,467
52,919358,523
25,761258,975
29,27189 499
667,8323 993 469Cost of labor .....................................................
Other costs.55,011 '26,328 69,147 262,944 674,650 79,511 111,049
,7.545
, ,476,545.......................................................
Less: Inventory, end of year .................................168,065
58.61959.141
145-
81,8734,843
771,S39200.021
11753688889:99C
192,45170,116
187,71130,435
33,76726,030
1,339,759763,410Salaries and wages.:.... ::.!:....... 34,683 - 27,804 130,979 215,385 5513,919 43,354 139,035 3 799 370 731Less: Jobs credit .................................................... * ...... * .... * *'*'* ........... - - - 735 814 175
, ,200Guaranteed payments to partners .............................. 3,466 - .15,782 46,544 64,167 11,967 15,152 249 36 800Rent paid ...............................................................Interest paid
13,7994 159
1,06329
5,815 23,353 84,718 6,271 15,987 303,
62,157.................................................... .......Taxes paid .............................................................
,9,320
1, 46,550
5,3196,508
39,24647,542
168,527115,032
17,7079,533
18,64422.058
9,924595
122,25382,845Bad debts .......................... ...................................
Repairs .1,585
. 3 742-
- 0753 1,514 19,533 2,405 3,694 14 13,420.............. ................................................ ..
Depreciation ............................ .............................., 7 7 16.535 19,930 83,702 29,074 4,500 249 49,879
Depletion ............................................ .................. 263 27 4,273 - - - 4,273Pension, profit sharing, annuity and bond purchaseplans ................................................ ; ................
Employee benefit programs ................................*..... 379
1,9142,146
1,4151,007
12,16832,787
4991,295
3,4755,648
214-
7,98025 844Net loss from other partnerships and fiduciaries .......... 59 - 11 399 152 6 - ,
146Rent net loss ........................................................ 51 52 - 327 623 - 8 615Royalty not loss ........................................ ............ - - -Farm net loss ............ ............................. ............Net loss, noncapital assets..~ .................
-76
-8
3,030 1,688--
-1,443..................
Other deductions ........... : ..... ................................... 13,762 6,342 3.070 26,780 1,T23 0914'l
-77,063
28152,180
-12.714
89672,554Net Income .............................................................. 263,266 186,834, 86,475, 696,502 26,19 ':41 73,457 212,446 51,331 11128,207

Partnership Returns/1984Table I-Total Assets and Income Statement for Selected Industries-Continued(All figures are estimates based on samples-money amounts are in thousands of dollars]
45
Transportation. commirtication, electric, Wholesale and retail tradegas, and sanitary servioes;
Transportation Retail tradeCommni- Building
ItemTrucking
tion.electric, Wholesa
materials,hardware. General
TotalTotal and
Othertrans-
asn~ Total trade Total
7
gardenand
"u
merchan~disewere-
housingportation sanitary Mile" stores
Services hor:,deal
(31) (32) (33) (34) (35) (36) (37) (38) (39) (40)
Partnerships With andWithout Net Income
Number of partnerships ............................................. 20,570 13,783 9,980 3,803 6,795 164,841 21,359 163,473 7,999
4,937Number of partners .................................................. 142,091 54,697 33,285 21,412 87,393 "3,712 56,782 386,907
~9211 22 10,574
rotal assets ............................................................. 21,109,071 6,385,163 1,561,858 4,823,305 14,723,908 21,222.015 7,775,074 13,434,830
0.09
91,96! 395,985otal receipts ........................................................... 11,324,902 7,11ID0,782 3,343,131 3,757,651 4,224,121 73,373,547 28,680,398 44,760,051
1:.01
2,49C 11
856,617Busi ass receipts ................................................... 10.732,715 6,765.928 3,181,860 3,584,068 3,966.787 72,335.387 20,169,882 44,132,98 2,440,53 846,329Inco= from other partnerships and fiduciaries ............ 30,528 30,109 28,804 1,305 419 52,945 7,499 45.446 82 820Nonclualifying interest and dividends .......................... 146,970 57,668 22,231 35,436 89,303 241,350 142,008 99,279 10.7 Z177Rents received ...................................................... 108,157 105,400 43,336 62.064 2.757 87,755 24,978 62,377 3,57 766Royalties .............................................................. 40 39 39 - 2 3,531 2,049 1,482 - -Farm net profit ...................................................... 321 321 92 229 - 11,417 11,046 371 - 296Not gain, noncapital assets ...................................... 113,633 53,961 25,071 28,890 29,672 57,836 7.308 50,487 912 66Other receipts ....................................................... 222,538 87,356 41,699 45,658 135,182 583,326 215.6 367,622 39,457 6,165
rotal deductions ...................................................... 13,331,935 6,755,184 3,226,276 3,528,906 6,576,751 71,707,071 28,209, 43,465,129 2~339,303 850,660Cost of sales and operations ................................... 5,572,292 4.038.167 2,043,105 1,995,062 1,534,125 56,135,446 24,923,035 31,183,8a8 1,662,313 587,322
Inventory. beginning of year .................................. 63,794 35,819 22,140 13,679 27,975 5,596,321 1,732.329 3,859.933 376,628 106,108Purchases .......................................................... 3,616,391 2,762,639 1,650,016 1,112,623 853.753 52,816,665 23.267,996 29,520.022 1,633,171 598,170Cost of labor ..................................................... 261,867 214,530 125,911 88,619 47,337 1,020,361 300,501 719,860 8,060 3,123Other costs ....................................................... 1.689,054 1,038,226 246.755 791,471 650,82 2,934.073 1,503,796 1,430,216 53,833 7,600Less: Inventory, and of year ................................. 58,813 13,047 1,717 11,330 45,7 6,231.949 1,881.570 4,346,135 409.377 127,680
Salaries and wages ................................................ 687,837 245.212 160,215 84,998 442,625 4.200,645 725,574 3,473,487 176.133 76,777Less: Jobs credit ................................................ 7 1 - 1 6 5,254 100 5,154 53 59
Guaranteed payments to partners ............................. 102,303 81,447 73,982 7,466 20,855 777,739 224,577 553,089 54,335 23,129Rent paid ............................................................. 189,893 68,594 51,001 17,593 121,299 1,555,041 146.291 1,408,686 38,766 32,100Interest paid .......................................................... 1,253,616 376,289 95.949 280,340 877,327 913,839 359,969 553,832 46,144 10.634Taxes paid............................................................ 183,646 72,709 46,178 26,530 110,937 8M,974 135,505 748,274 4Z941 15,126Bad debts ............................................................. 44,037 4,805 867 3,938 39,231 97.612 47,134 50,435 7,128 917Repairs ................................................................ 151,040 119,806 91,724 28,082 31,234 327,448 78,369 248,924 11,676 1.999Depreciation ..........................................................Depletion .............................................................. 3,848 - - - 3,848 5,938 4,575 1,363 - -Pension, profit sharing. annuity and bond purchase
plans ................................................................ 9.273 2,539 1,325 1.214 6,734 33,964 16.816 17,147 1.801 764Employee benefit programs ...................................... 40,050 13,855 12,180 1,675 26.195 84,400 31,743 52.605 9,339 635Net loss from other partnerships and fiduciaries .......... 199,881 20,371 18,447 1,924 179.510 6,499 3,378 3,121 5 -Rent not loss ........................................................ 52,980 45,892 9,79() 36,102 7,088 57,007 12,989 43,724 5,648 3,677Royalty not loss..................................................... - - - - 41 41 - - -Farm not loss ....................................................... 53 - - - 25,4D9 23.268 2,142 1Net loss, noncapital assets ...................................... 6,377 2,447 2,243 203 3,930 19,928 985 18,942 - -Other deductions .................................................... 2,961,912 1,026,501 431,625 594,876 1,935,411 5.548.418 1,235,130 4,312,014 244,236 78,219
Net Income (less deficit) .......................................... -2,007,032 345,698 116,856 228,742 -2,352,630 1,666,476 371,099 1,294,922 156,633 5,757Net income ........................................................... 1,280,499 972.883 183,689 789,195 307,616 3,238,481 839,618 2,398,115 208,625 55,889Deficit .................................................................. 3,287,532 627,285 66,833 560,452 2,660,246 1,572.005 468,519 1,103,193 51,992 50,132
Partnerships With Net IncomeNumber of partnerships ............................................. 13,653 10,169 8,390 1,778 3,384 97,879 14,731 03,141 2,918 1,739Number of partners .................................................. 42,949 34,040 27,645 6,495 8,909 231,710 34,896 196,795 7,606 4,060Total assets ............................................................. 5,200,772 3,026,465 1,075,166 1,951,300 2,174,307 12,412,133 4,359,868 8,040,801 818,446 1134,8410Total receipts ........................................................... 7,804,023 5,982,628 3,075,912 2,906,7116 1,821,404 47,823,585 14,752,910 33,037,569 2,096,543 634,67C
Business receipts .................................................... 7,445.377 5,742,580 2,936,843 2,805,737 1,702,797 46.959,208 14,439,798 32,486,892 2,050,242 527,159Income from other partnerships and fiduciaries ............. 28.870 28,804 28,804 - 66 51,645 6,640 45,005 826 505Nonqualifying interest and dividends ........................... 72.739 39.036 21,250 17,787 33,703 194,791 107,234 87,493 9.410 2,052Rents received ....................................................... 53,033 51,743 37,775 13,968 1,290 70,970 18,150 52,421 2,601 54ERoyalties ............................................................... 40 39 39 - 2 3,521 2,044 1,477 -Farm net profit ...................................................... 321 321 92 229 - 11,388 11.026 362 - 29ENet gain, noncapital assets ...................................... 67,955 52,354 23.672 28,682 15.601 43,614 5.979 37,595 827 41Other receipts ....................................................... 135,698 67,751 27,438 40.314 67,947 488,448 162,047 326,324 32,636 4,07E
Total deductions ...................................................... 6,523,533 5,009,745 2,892,223 2,117,622 1,613,788 44,565,104 13,913,300 30,639,04 1,887,918 478,787Cost of sales and operations ................................... 4,283,095 3,481,438 1,951,826 1,529,611 801,657 34,631,489 11,819,790 22,783,176 1,400.597 370,751
Inventory, beginning of year .................................. 39,450 31,673 22,056 9,616 7,777 3,578,470 827,129 2,747,283 291,080 71,551Purchases.......................................................... 3.231,772 2,706,228 1,642,653 1.063,575 525,5" 32.433,358 10,727,658 21,677,053 1.392,754 377.22ECost of labor ..................................................... 173,075 163,270 108,909 54.361 9,805 700,341 249,403 450,938 5,433 60EOther costs ....................................................... 856,322 588,763 179,298 409,465 267,559 1.982,031 1,042,325 939,646 21,476 55CLess: Inventory, end of year .................................. 17,523 8,496 1,089 7,406 9.028 4,G62,690 1,026,725 3,031,721 310,146 79,19C
Salaries and wages ................................................. 284,280 180,101 136,935 43.166 104,179 2,930,126 504,328 2,474,214 133,984 35.60ELess: Jobs credit ................................................. 1 - - - 1 4,894 28 4,866 31 5f
Guaranteed payments to partners .............................. 73,060 6Z831 57,334 5,497 10,230 527,136 17ZO21 354.242 38.427 9,011Rent paid .............................................................. 61,047 46.149 36,200 9,948 14,898 889,229 100.420 788,745 26,313 15,53-,Interest paid ........................................................... 215,598 122.560 58,820 63,741 93.038 401.485 137,033 264,414 23,707 2,07E
1Taxes paid ............................................................ 79.414 55,449 38,750 16,699 23,965 591,813 94,570 497,D49 32.559 4,85 ,Bad debts .............................................................. 9,332 2,475 528 1,947 6.857 57,502 21.495 35,963 5,986 SMRepairs ................................................................ 116,377 102.349 86,825 15,524 14.026 198,299 41,724 156,420 7,656 1,321Depreciation ...........................................................Depletion .............................................................. - - - - - 5.724 4,575 1.149 - -Pension, profit sharing. annuity and bond purchase
plans ................................................................ 2,533 1,879 1,325 554 654 24,616 13,538 11,078 1.772 761Employee benefit programs ...................................... 16,552 11.156 10,480 676 5,396 64,502 23,438 41,012 9.208 42.Net loss from other partnerships and fiduciaries .......... 1,720 322 - 322 1,398 3,955 2,314 1,641 5 -Rent not loss ........................................................ 1,735 1,735 1,735 - 5,394 1,289 4,105 -Royalty net loss ..................................................... - - - - - - - -Farm net loss ....................................................... 53 - - 53 4,334 21405 11929 1Not loss, noncapital assets ...................................... 2,560 2,443 2,243 200 117 1,018 43 586 - -Other deductions .................................................... 961,862 673,145 367,717 305,428 288.717 3,672,656 874.05 2,797,326 186,874 34,771
Not Income ............................................................. 4 1,280,4991 972,883 183,6891 789,119~ 307,616 3,238,481 639,61 2,398,115 208,625 65,881
46 Partnership Returns/11984Table I-Total Assets and Income Statement for Selected Industries-Continued[All figures are estimates based on samples-money amounts are in thousands of dollars]
Wholesale and retail trade-00rdimed
Retail trade-Coritimed
item Food stores Automotive dealers and service stations Apparel Furniturs
TotalGrocery
I
Otherfood Total
Mouxvehicle
Gasolineservice
Otherautomotive
andaccessory
and hometurnishings
EaUNplaces
storesstores dealers stations dealers stores stores
(41) (42) (43) (44) (45) (46) (47) (48) (49) (50)
Partnerships With andWithout Net Income
Number of partnerships ............................................ 23,657 11,674 11,982 14,080 3,982 6,059 4,038 12,266 1 10,056 31,539Number of partners ................................................. 51,787 25,461 26,327 33,155 8,964 13,525 40,667 29,319 21,925 88,894Total assets ............................................................ 1,387,041 903,871 483,170 Z452,932 657,992 987,940 1806,992 807,707 794,871 Z707,639Total receipts .......................................................... 8,874,0" 6,163,775 2,710,265 11,687,706 3,298,085 6,463,107 1,826,514 1,765,784 Z 146,440 8,383,081
Business receipts ................................................... 11,802214 6.1 se
01 1
2.701,049 11,451,086 3,227,087 6.418,584 1,805,415 1,739,302 2,096,662 8,297,935Income from other partnerships and fiduciaries ............
1~: .03
~ 138 42,082 35,594 5,588 900 330 265 300
Nonqualifying interest and dividends ..........................
, 1 .,
' 36 3,674 24,819 5.717 12,379 6.722 4,845 12,424 18,294Rents received ........... : ............................................ 12,271 11,838 433 8.572 1,816 3,937 2,819 250 5.869 16,884Royalties .............................................................. 1,222 4 1,217 - - - - - - 241Farm net profit ...................................................... 9 9 - 16 - 16 - - - -Net gain, noncapital assets ...................................... 3,166 3,094 72 4,300 623 1,849 1,829 10,932 375 16,599Other receipts ....................................................... 43,206 39.423 3,783 56,831 27.248 20,754 8,828 10,124 30,845 32,828
Total deductions ...................................................... 8,600,010 6,020,610 2,579,394 11,336,159 3,180,159 6,384,133 1,771,867 1,758,419 1,994,807 8,202,188Cost of sales and operations ................................... 6,964,358 5,004,176 1,960,183 9,723,441 2,806,631 5,723,188 1,193,622 1,098,751 1,416,801 3.844,633
Inventory, beginning of year .................................. 451,884 355,939 95,945 949,063 316,185 329,173 303,706 367,310 285.606 122.031Purchases .......................................................... 6,663.729 4,850,361 1,813.367 9,392,155 2,733,454 5,470,230 1,188,471 1,169.520 1,473,726 3.216,120Cost of labor ................ : .................................... 98,691 31,935 66,756 111,445 44,763 39,154 27,529 44 29,054 390,617Other costs ....................................................... 269,882 143.938 125,945 226,658 102.692 98.698 25,268 19,517 33,246 251,551Less: Inventory, end of year ................................. 519,831 377,999 141,831 955,876 390,458 214,066 351,352 457,642 404,811 135,699
Salaries and wages ................................................ 519,589 367,032 152,557 433.708 110,262 167,123 156,324 173,104 130,059 1,352,981Less: Jobs credit ................................................ 2,229 2,185 45 665 131 21 1 513 - 103 1,353
Guaranteed payments to partners ............................. 38.798 26,383 12,415 132.512 25,372 50,037 57,103 32,614 25,038 92,536Rent paid ............................................................. 144,522 69,479 75,042 135,327 20,046 76.088 39,193 132,666 78,095 559,021Interest paid .......................................................... 54,636 37,757 16,879 108,165 34,892 39,451 33,822 17,184 22,505 168,247Taxes paid ............................................................ 103,586 63,421 40.165 93.558 20,721 52,897 19,940 38,195 30.237 271,087Bad debts ............................................................. g'5M 8,286 1,301 9,856 3.042 4,262 2,552 944 3,887 1.385,Repairs ................................................................ 33,412 22.411 11,001 35,943 13,081 14,520 8,343 9,239 6,729 104,429Depreciation ..........................................................Depletion .............................................................. 202 169 33 690 44 .6Pension, profit sharing. annuity and bond purchase
plans ................................................................ .6,857 6,673 184 1.118 496 209 413 320 365 1,072Employee benefit programs ...................................... 8,930 7,691 1,239 12,880 5,228 2,899 4,752 1,376 893 9,403Net loss from other partnerships and fiduciaries .......... 203 203 - . Soo 109 33 659 603 386 1,102Rent net loss ......................................................... 567 220 347 26,902 82 3,032 23,787 . 728 622 1,512Royalty net loss ...................................................... - - - - - - - - -Farm netloss ........................................................ 918 918 - 714 56 145 513 - 376Net loss, noncapital assets ........ 1.862 1,852 10 346 156 42 148 - 22 15,675Other deductions ..................................................... 60 344 342,292 263.052 -518,295 25.119 -202,481 ~190,694 -222,826 -254,748 -.1-,487,537
Net-Income-l(lia-s-s-deficity ....... ................................. 274,030 143,159 130,871 251,547 117,925 ,. 78,974 54,647 7,365 151,633 180,893Not income ............................................................ 373,226 193,019 180,206 382,947 137,596 136,764 108,587 79,820 189,110 547,523Deficit ................................................................... 99,195 49,860 49,335 131,400 19,671 57,790 53,940 72,455 37,476 366,630
Partnerships With Net IncomeNumber of partnerships ............................................ 16,213 7,930 8,282 .9,783 2,643 4,212 2,92S 7,348 5,503 16,308Number of partners ................................................. 35,389 17,344 18,045 23,391
-6,217 9,325 7,848 15,183 11,813 43,904
Total assets ............................................................ 960,445 683,103 277,341 1,519,639 578,126 488,670 45Z&43 -572,282 695,253 1,460,725total receipts .......................................................... 7,168,536 5,088,218 2,080,318 8,424,303 2,901,946 3,947,168 1,575,189 1,346,071 1,680,839 5152,354Business receipts ................................................... 7,102.488 5,030,006 2,072,482 8,309.755 2,835,001 3,916,398 1.558,356 1,325,387 1.635,295 5:083,982Income from other partnerships and fiduciaries ............ . 140 103 38 42,08 35.594 5,588 900 330 265
1300
Nonqualifying interest and dividends .......................... 11,128 7,866 3,260 22,71 5,125 10,947 6.641 4,124 12,317 13,224Rents received ...................................................... 11,251 10,818 433 7,054 1,728 3,015 2,312 250 3,309 14,506Royalfies, .............................................................. 1,217 - 1,217 - - - - - 241Farm net profit ...................................................... - - - 16 - 16 - - -Net gain, noncapital assets ...................................... 3,069 3,012 58 1,382 665 511 306 7,114 320 12,323Other receipts ....................................................... 39,241 36,412 2.829 41,299 23,933 10,692 6,675 8,867 29,333 27,777
rotal deductions ...................................................... 6,795,310 4,895,199 1,900,111 8,041,356 2,764,350 .3,810,404 1,466,602 1,266,251 1,491,730 4,604,831Cost of sales and operations .................................... 5,573,173 4.100,469 .1,472,704 6,895,441 2,451,388 3,401,549 1,042,504 831.642 1,096,592 2,236,623
Inventory, beginning of year .................................. 310,931 263,384 47,548 687,671 250,187 209,214 228,269 282,732 234.902 82,955Purchases .......................................................... 5,271,661 3,951,232 1.320,429 6,707,587 2,373,265 3,281,261 1,053,062 857,518 1,117,415 1,872.791Cost of labor ..................................................... 84,850 31,186 53.663 74,840 42.453 9,811 22,576 43 24,584 .220,846Other costs ....................................................... 248,241 140,400 107,840 127,572 100,378 14,773 12,421 17,608 25,285 148,063Less: Inventory, end of year ................................. 342,511 285.735 56,776 702.225 314.891 113,510 273,824 326,260 305,574 88,033
Salaries and wages .................................................. .
409,23C 304,179 , 105.051 348,680 . 99,507 - -114,520 134,653 136,184 98,737 8110,882Less: Jobs credit .. .............................................. 2,185 2,185 - 665 131 21 513 - 1
103 1.131Guaranteed payments to partners ............................. 28,310 19,367 8,943 87,095 15,219 25,432 46,444 10,891 23,555 50,267Rent paid ............................................................. 104.453 58,263 46,190 95,380 , 17,385 44,408 ~33,587 76.973 41,091 288,122Interest paid .......................................................... 28,561 22,427 6,133 64,041 26,090 21,681 16,271 11,021 13.248 55,056Taxes paid ............................................................ 75,240 49,320 25,921 71,468 18,708 36,649 16,110 28,646 25,172 159,376Bad debts............................................................. 5,325 5,104 221 7,242 2,178 3,184 1,879 746 3,056 492Repairs ................................................................. 21,351 15,132 6,219 25,923 12,521 9,928 3,473 6,924 4,491 57,135Depreciati n ........................... ...............................Depletion ............................................................... 33 - 33 .6 - .6 - - -Pension, profit sharing, annuity and bond purchase
plans ................................................................ 1,246 1,174 7 1,077 496 168 41 320 3651
046Employee benefit programs ...................................... 6,118 5,017 1,10 9,584 4,697 933 3.95 1,264 414 ':428Net loss from other partnerships and fiduciaries .......... 2 2 - 146 109 33 5 - 386 - 1,102Rent net loss ........................................................ 523 176 .. 347 75
609
80 224 622 329Royalty net loss ..................................................... - - -
- - - -
Farm net loss ....................................................... 851 851 513 - 376.Net loss, noncapital assets ...................................... 51 51
20
2 9 22 110Other deductions .................................................... 473,395 269,991 203,404 374, 7 10 2
118704 152,780 138.389 166,015 808,021
at Income ....................... ........ 373,226 193,019 180,206 .382, 4 137,
"r
136:
.
. 108,587 79,820 189,110 547,523N

Partnership Returns/1984Table I-Total Assets and Income Statement for Selected Industries-Continued[All figures are estimates based on samples-money amounts are in thousands of dollars]
47
Wholesale arrid retail Vade-Continued Finance, insurance, and real estate
Retail trade-Continued Finance
ItemWholesale
andBanking, security Holding
Insurance
UCP"Otherretail retail trade
TotalTotal
and creditagencies
andcommodity
andandstores
stores riot allocable other brokers and investmentservice
than banks servicecompanies
(51) (52) (53) (54) (55) (56) (57) (58) (59) (60)
Partnerships With andWithout Not Income
Number of partnerships........................................... 3,591 3,167 52,186 a 790,902 144,175 3,708 5,906 134,562 9,808Number of partners ................................................. 7,631 7,176 117,518 24 7,408,313 2,163,0 4 252,698 98,360 1,811,777 114,077Total assets ............................................................ 160,629 394,940 2,367,994 12,111 770,457,317 168,934,031 17,281,211 54,851,976 96,800,843 3,098,157Total recelpts .......................................................... 267,313 1,S39,106 6,823,948 33,098 94,362,434 37,526,636 1,638,650 26,830,663 9,057,323 3,117,331
Business receipts ................................................... 276,895 1,515,271 6,666,751 32.518 54,902,201 26,170,236 732,280 22,699,407 2,738,548 2,720,885Income from other partnerships and fiduciaries ............ 126 - 556 - 2,504,153 1,374,825 2,427 108,955 1.263.443 30Nonqualifying interest and dividends .......................... 35 881 13,289 63 13,980,659 7,201,836 477,581 2,722,757 4.001,498 102.522Rents received ...................................................... 883 2,846 10,459 400 16,350,442 357,182 17,537 781 338,864 28,780Royalties ............................................................. - 10 9 - 287,700 227,090 - 55,476 171,614 2,002Farm not profit ...................................................... - - 50 - 61,459 3,641 - 59 3,582 -Not gain, noricapital assets ...................................... 4,785 1,343 8,009 40 1,536,076 83,942 1,008 1,470 81,463 645Other receipts ....................................................... 4,589 18,754 124,824 76 4,739,745 2,107,884 407,816 1,241,757 458,311 262,467
Total deductions ...................................................... 288,312 1,490,164 6,604,838 32,644 113,606,153 36,166,708 1,061,359 26,921,644 8,183,706 2,516,990Cost of sales and operations ................................... 1 ".543 1,211,429 4,530,295 28,523 38,507.475 22.016,952 600,043 20,284,623 1,132,286 403,175
Inventory, beginning of yew .................................. 4,318 168.827 1,028.159 4,059 14,841,115 5,592,431 17,187 5,216,346 358,897 749Purchases .......................................................... 117,184 1.209,177 4,047,070 28,647 18,879,619 12,953,175 112,273 12,536,183 304,718 121.690Cost of labor ..................................................... 21,679 22 57,124 - 365,579 173,432 - 110,828 62,603 5.464Other costs ....................................................... 6,358 2,861 558,710 60 15,585,327 4,371,730 487,246 3,121.013 763,471 276,870Less: Inventory, end of year ................................. 4,996 169,458 1,160,767 4,244 11,164,164 1,073,816 16,664 699,748 357,404 1,598
Salaries and wages ................................................ 22,147 88,369 500,620 1,584 2,591.200 1,157,727 74,676 888,751 194,300 216,244Less: Jobs credit ................................................ 4 - 687 - 1,099 195 17 153 25 162
Guaranteed payments to partners ............................. 5.225 7,828 141,074 73 1,392.157 419,345 13.397 236,070 169,878 78,559Rent paid ............................................................. 15.660 21,085 251,445 64 735,671 198,099 11,722 148,237 38,140 33.314Interest paid .......................................................... 10.874 18,621 96,821 37 15,487,083 5,097,467 212,081 3,273,752 1,611,634 34,675Taxes paid ............................................................ 15,110 26,078 112.355 194 1,859,838 286,617 5,908 77,463 203,246 33,619Bad debts ............................................................. 40 1,668 15,022 43 194,731 80,009 6,929 13,935 59,145 39.127Repairs ................................................................ 5.390 6,213 33,895 155 470,394 33,994 1,105 7,378 25,511 3.250Depreciation ..........................................................Depletion .............................................................. - 470 - 1.918 464 - 166 299 -Pension, profit sharing, annuity and bond purchase
plans ... - - 4,850 - 45.035 28,232 2,602 24,558 1,072 6.318Employee 173 130 8,847 53 71,725 33,629 2,706 22,570 8,353 5,091Not loss from other partnerships and fiduciaries .......... - - 21 - 8,338,189 2,017,922 8,446 260,257 1,749,218 5,353Rent not loss ........................................................ 1,513 2.557 294 25,038,973 376.664 2,328 - 374.335 12,597Royalty not loss ..................................................... - - - 2,303 1,104 - 1.104 -Farm not loss ....................................................... - 132 113,202 38,824 409 38.415 758Net loss. noncapital assets ...................................... 838 6 194 210,009 58,923 - 42,577 16.345 65Other deductions .................................................... 47,587 81,816 771,405 1,273 13.366,407 3,732,363 108,072 1,610,605 2,013.686 1.620,910
Net Income (less deficit) .......................................... -999 48,962 219,111 454 19,243,718 1,359,929 577,292 -90,981 873,618 600,341Not income ........................................................... 15,200 64,661 481,114 748 25,646,379 6,413.803 650,711 1,1S4,823 4,578,269 684,586Deficit .................................................................. 16,198 15.709 262,004 294 44,890,098 5,053,874 73,419 1.275,804 3.704,651 84,245
Partnerships iffith Net IncomeNumber of partnerships............................................ 3,101 2,183 19,047 7 349,777 $1,296 2,472 1,933 76,891 6,959Number of partners ................................................. 6,413 4,919 44,108 19 3,599,939 1,568,510 246,665 36,572 1,285,274 ",239Total assets ............................................................ 36,365 297,404 1,545,396 11,464 299,690,708 103,179,987 16,711,361 29,513,944 56,954,683 2,583,195Total receipts .......................................................... 181,818 1,201,959 5,250,469 33,098 70,234,425 30,715,022 1,445,016 22,508,438 6,761,568 2,842,975
Business receipts ................................................... 173,533 1,178,382 5,100.668 32,518 39,247,900 21,228.618 587,165 19,058,216 1,583,237 2,500,237Income from other partnerships and fiduciaries ............ - - 556 - 2,339,883 1,281,212 1,205 99,815 1,180,192 30Nonqualifying interest and dividends .......................... 30 Sall 11,614 63 10,637,383 6,006,112 451,443 2.259,311 3,295,358 92,647Rents received ...................................................... 790 2,846 9.267 400 13,192,554 267,902 13,933 549 253.420 28,656Royalties .............................................................. - 10 9 - 209,746 152.888 - 345 152,543 1,813Farm net profit ...................................................... - - 50 - 55,927 142 - 59 83 -Net gain, noncapital assets ...................................... 4,785 1,343 6,390 40 1,080,088 43.789 55 1,470 42,265 497Other receipts ....................................................... 2,681 18,497 121.915 76 3,470,945 1,734,358 391,215 1,088,672 254,470 219,097
Total deductions ...................................................... 166,618"' 37'1
4 71 1: 1 32.3. 44,1581111,046 24,301,219 794,305 21,323,615 2,183,299 2,168,389Cost of sales and operations ................................... 85,336 .47-2-
:3 34 :28,523 27.895,951 18,056,840 446,599 17,098,180 512,062 320.456
Inventory, beginning of year .................................. 2,221 112,920 670.320 4,059 9.716,761 5,300,951 17,187 5.158,147 125,617 749Purchases .......................................................... 72,206 940,249 3,067.642 28,647 15,197,194 11,828.635 112,273 11,588,858 127.503 121,690Cost of labor ..................................................... 12,085 22 27,629 - 161,513 61,964 - 53,708 8,256 5,464Other costs ....................................................... 1,658 2,861 346,328 60 7,762,346 1,595.087 333,802 928,271 333.015 194,151Less: Inventory, end of yew ................................. 2.834 108.230 766,718 4,244 4,941,863 729,797 16,664 630,805 82.329 1,598
Salaries and wages ................................................ 14,416 67,360 419,134 1,584 1,542,676 830.261 60,727 702,752 66.782 196,313Less: Jobs credit ................................................ 4 - 687 - 447 169 17 151 - 162
Guaranteed payments to partners ............................. 1,672 3,954 101,054 73 542,643 219,584 4,326 166,882 48.376 71,396Rent paid ............................................................. 10,048 11,128 119,706 64 413,848 145,346 7,750 124,847 12,749 30,555Interest paid .......................................................... 4,169 10.395 52,138 37 5,497,567 3,145,298 193,365 2,350,377 601,557 27,198Taxes paid ............................................................ 11,037 16,757 71,937 194 722,186 145,067 4,244 57,354 83,470 29,937Bad debts ............................................................. 3 542 11,763 43 43,104 23,368 3,577 4,306 15.485 2,800Repairs ................................................................ 3,165 5,248 23,207 155 157,774 13,639 903 6,163 6.574 3.065Depreciation ..........................................................Depletion .............................................................. - 470 - 1,183 439 - 166 273 -Pension, profit sharing, annuity and bond purchase
plans ................................................................ - 4,488 - 37,050 23.993 1,069 22,246 677 6,312Employee benefit programs ....................................... 13
853 42,652 23 5 2,60
0 19 'q6
1 81
4,623Net loss from other partnerships and fiduciaries ........... - 230,949 65 9
1
6717:47:39 5,351
Rent not loss ......................................................... 1,513 684,637 31 05 31
'
518 1,766Royalty not loss ...................................................... - 15
~
- -
Farm netloss ........................................................
'3
33,644 4 35 4,735 -Net loss, noncapital assets ....................................... -
1.1
32,770 1 87 -391]
896 65Other deductions ..................................................... 28,897 55.8 8 530, 1,273 5,318,845 1,297 35 62,309 731,553 503,774 1,438,214
Not Income .......................... ................................... 15,200 641
481,
'l
748 25,646,379 6,413 03 650,711 1,184,82
4,578,269 694,686

48 Partnership Returns/1984Table I-Total Assets and Income Statement for Selected Industries-Continued[All figures are estimates based on samples-money amounts are in thousands of dollars]
Finance. insurance. arid real astate-Continued Services
Real estate Hotels and other IOVN placeii Penionalserv"Ce's
It=Operators Lessors. Real estate
Totalmot .
Total andlessors Of
othe,ffian
Dowreal Total hotels, and
OtherTotal
buildings buildrigs arid estate touristRVU11981M courts
(61) '(62) (63) (64) (65) (66) (67) (68) (69) (70)
Partnerships With andWithout Net Income
Number of partnerships ............................................ 636,920 536,21 32,668 10,049 50,096 131 111 11 111 1,995 13,922 33,282Number of partners ................................................. 6,131,192
510'S24 2K681 138,403 267,585
:''66 156,598 84,567 79,816
Total assets ......... I .................................................. 598,425,129
:026,6
508
69
12,948,716 9,015,244 68,434,478 87,984,07 33,129,585 9,283,527 23,846,OSa 867,678Total receipts .......................................................... 63,718,466 31,860,27 965,269 2,622,868 18,270,057 97,822,377
115,188,701 4,235,605 10,953,096 2,300,988
Business receipts ................................................... 26,011,081 8,010,78
1
227,656 2,123,896 15.648,747 90,243.644 14,019,645 3,957,395 10,062,251 2,245,631Income from other partnerships and fiduciari a ............. 129,294
889.81 44591 11,869 183.0209
283.39 27,729 2,952 24,777 97Nonqualifying interest and dividends ........................... 76,30 5,382.52 96164 214,697 982,916 1,092,615 220,101 91.066 129,034 8,606Rents received ................................
........ 15,9CA.479 15,071.82 478,195 142,446 272,014 2.103,200 478,651 88.243 390,408 3,MRoyalties
............................................ -........ 58,608 30,29 25,832 178 2.301 117,051 163 157 6Farm net profit ...................................................... 57,818 .12,661 42.857 343 1.958 8,525 , 29
--
2 --Net gain, noncapital assets ...................................... 1,451,488 1,195,127 22,747 15,162 218,452 615,022 103,51 62
2'
6
77,891 2,280Other receipts ....................................................... 2,369,394 1,267,241 27,227 114,277 960.649 3,358,926 338,8:
7014
14
268,729 40,426Total deductions ...................................................... 74,922,455 50,746,110 1,470,640 2,844,617 19,861,088 82,239,117 17,298, 4 '.7, 12,791,046 2,086,698
Cost of sales and operations ................................... 16.087,348 3,401.992 84,462 581,840 12,019.054 16.818,253 5,510,31
1
717.931
13I
4,792,388 446.966Inventory, beginning of year .................................. 9,247,935 1,268,691 80,395 225,930 7,672.919 814.268 121,47 18.00 103,472 21,247Purchases.......................................................... 5,804,755 984.057 46,557 403,991 4,370,150 5,287,303 1,089,7 305,799
799
783,967 237,210Cost of labor ..................................................... 186,684 66,069 57 19,187 101,371 2,289,097 639,04 192,2
2
"6,787 88,986Other costs ....................................................... 10,936,726 2,017,453 70,990 203.034 8,645.249 9,263,062 3,777.53 222,88 3,554,651 119,369Less: Inventory, end of year ................................. 10,088,751 934,278 113,536 270.303 8,770,633 835.492 117, 21..01 96,489 19,847
Salaries and wages ................................................. 1.217.22 696,918 28,911 209,012 282,389 10,321,018 1,861,796 609,643 1,252,153 388,159Less: Jobs credit ................................................ 74 409 1 76 255 13.144 2,689 533 2,156 1
Guaranteed payments to partners ............................. 894,253 611.115 5,368 140,573 137,197 2.998.483 - 90,669 33,336 57,332 103,513Rent paid ............................................................. 504258 373,254 5,291 61,603 64,110 4,332,236 246,138 78,640 167,498 158,315Interest paid ........................................................... 10,354:941 7,050,216 179,002 324,876 2,800,848 4,817,21 2,463.792 744,M 1,718,843 47,501Taxes paid ............................................................. 1,539,602 1,120,793 30,535 65.114 323,161 2,5113,20 636,313 201,538 434,775 54,629Bad debts............................................................. 75,596 50,791 117 1,866 22,833 216,556 33,312 8,013 25,299 3.775Repairs ................................................................ 433,150 322,597 34,746 36,362 39,445 873,290 314,750 128,642 186,108 35.29Depreciation ..........................................................
-Depletion .............................................................. 1,454 97; 174 - 303 9.838 2,431 - 2,431 -Pension, profit sharing, annuity and bond purchaseplans ................................................................ 10,485 5,062 2,210 1,409 1,803 376,184 6,623 1,105 5,518 470
Employee benefit programs ...................................... 33,005 23,138 2,022 1,154 6,690 566,989 113,012 14,920 98,092 3,515Nei loss from other partnerships and fiduciaries .......... 6.314,915 5,280,226 85,018 327,769 621,902 529,58 115,295 3,981 111,314 .848Rent not loss ...... :................................................. 24,649,711 22,855,648 702,265 134,480 957,319 1,115,79 205,111 43.214 161,897 6.142Royalty not loss ...............................
.......... * .......... 99 11199-
--
5,826 - - - -Farm not loss ....................................................... 73619
856, 79 61016, 130 9,475 1,246
Net loss, noncapital. assets .......................................- - .
151,021- 65,448~ _65 _2,778 _82,73C _54,705 _8477 2.049 6.428 -94Other deductions ... .. ........ M.-......... : ..........................
-013,1348, 4,845,300 134,455 802,139 2,231,241 21.978,091 -3,870:211 1,305,282 2,564,929 684,074Not Income (less deflclt) ..... .................................... -21,203,988 -18,885,837 - -505,372 -221,749 -1,591,031 15,583,256 -2,109,805 -271,055 -1,837,950 214,290
Net income ....................
..........
18,547,990 14,696,416 562.541 432,887 2.856,146 24,800,274 817,886 339,449 478,437 358,422Deficit ..................................................... * ....................................... 33,582,253 1,067,913 654,636 4.447,177 9.217,019 2.927,692 611,305 2,316,387 , 144,132Partnerships With Net Income
Number of partnerships ............................................ 261,522 221,716 14,912 5,803 19,091 204,282 8,831 4,925 3,906 23,512Number of partners ................................................. 1,987,189 1,7S6,213 103,984 31,798 93,194 843,410 99,558 76,852 22,706 57,124Total assets ............................. ...... 193,927,526 166,291,617 4,086,440 3,511,559 20,037,910 34,749,015 7,012,517 2,777,579 4,234,938 458,489Total receipts .......................................................... 36,676,420 22,290,462 698,460 1,554,299 12,133,207 77,349,648 6,529,310 2,009,781 4,519,529 1,574,605
Business receipts ................................................... 15,519,044 3,904,302 105,457 1,282,817 10,226,468 71,651,828 5,827,335 1,845,848 3,981,487 1.566,780Income from other partnerships and fiduciaries ............ 1,058,641 836,569 44,591 9,386 168,096 272,180 26.129 2,766 23.363 97.Nonqualitying interest and dividends .......................... 4,538,624 3,679,360 69,178 108,902 681,184 706,566 124,556 59,417 65,139 4,384Rents received ...................................................... , 12.895,996 12,288,782 393,417 68.255 145,542 1,605,716 313,342 60,728 252,614 1,327Pollas
.............................................................. 55,046 28,299 25,300 43 1,403 80,097 157 157 - -Farm net profit ...................................................... 55,784 10,628 42,857 343 1,957 8.525 29 29 - -Net gain, noricapital assets ...................................... 1,035,802 843,525 8,269 13,771 170,237 523,476 61,381 19,029 42,352 817Other receipts ......................................................... 1,517,490 698,997 9,392 70,782 738,319 2,421,262 176,380 21,805 154,575 1,199
Total deductions ....................................................... 18,128,438 7,51i,11,046 135,919 1,121,412 9,277,061 52,549,374 5,711,423 1,670,331 4,041,092 1,216,183Cost of sales and operations ........ ; ........................... 9,518,654 1,795,016 18,823 362,976 7.341,839 10,285,719 2,442,921 259,322 2,183.599 323,602Inventory, beginning of year ................................... 4.415,060 633,907 57,457 163.023 3.560,673 519,098 49,028 7.358 41,671 .12,591
Purchases ........................................................... 3,246,870 613,811 21,752 181,843 2,429,463 3,"0,430 370,562 121,831 248,731 203,288Cost of labor ......... : ............................................ 94,085 5,129 - 17,363 71,592 1,443,188 174,689 67,278 107,410 .64,165Other costs ........................................................ 5,973,108 951,280 -5.573 137,244 4,890,157 5,372,739 1,889,798 70,408 1.819,390 57,347Lqss: Inventory, end of year .. . ................ ............. 4,210,468 409111 54,812 136,498 3,610.047 , 489,748 41,156 7,553 - 33,603 13,789
Salaries and wages ................. : .............................. 516,103 272,070 22.673 116,608 104,753 14,879,595 629,225 261.616 367,610 153,438Lem: Jobs credit ................................................ . 116 31 1 1 76 8 10,991 740 265 475 -
Guaranteed payments to partners ............................. 251,664 158.029 2,786 45,959 44,889 1,955,956 39,402 15,321 24,081 54,176Rent paid ............................................................. 237.947 183.486 3,877 34,596 15,988 3,478,299 88,101 44,265 43,836 85,423Interest paid .......................................................... 2,325,070 1,523,362 29,349 82.229 690.131 1,376,474 373,254 176,815 196,440 18,683Taxes paid ............................................................ 547,182 414,008 8,197 30,649 94,327 1,849,891 246,518 90,326 156,192 31,819Bad debts ............................................................. 16,936 13,266 17 589 3,065 142,964 8.171 2,712 5,460 1,981Repairs ................................................................ 141,070 107,569 1.927 16,891 14,683 519.478 133.435 65,715 23,872Depreciation ..........................................................Depletion .............................................................. 744 33~ 174 240 937 - - -Pension, profit sharing, annuity and bond.purchase
plans ................................ ; ................................ 6.746 2,308 2,210 1,088 1,140 36033 4,139 58 3559 449Employee benefit programs ....................................... 14,584 9,081 1,579 444 3,481 423.03 29,957 7,6 22:293 2,379Net loss from other partnerships and fiduciaries ........... 160,519 125,109 107 3,725 31,578 63,565 1,380 510
C
0
291Rent not loss ......................................................... 651,268 593,587 1,517 11 707 44,458 31,502 5,463 847 8704,617 664Royalty not loss ...................................................... 15 15 - ~ - - I - - -Farm net loss ........................................................ 26,909 28,729 180 - - 2,053 - - -
1
1,246Nei loss, noncapital assets ....................................... 31,418 18,931 44 621 11,822 24,289 239 233 2Other deductions ..................................................... 2,582.997 1,375.964 18,342 370,554 818,136 14,673,397 1,357,094 557,084 800,010 433,731
Not Income .............................................................. 18,547,990 14,696,416 562,541 .432,887 2,856,146 24,800,274 817,886 339,449 478,43 .358,422
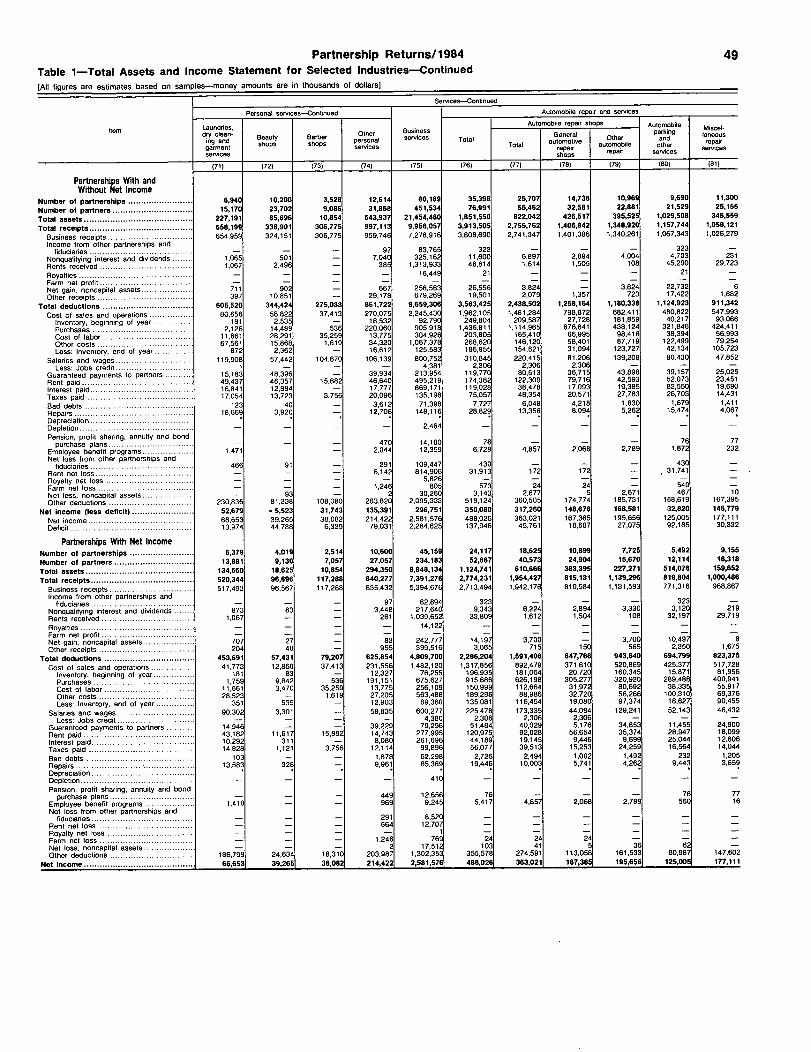
Partnership Returns/1984Table 1-Total Assets and Income Statement for Selected Industries-continued[All figures are estimates based on samples-money amounts are in thousands of dollars]
Services-Continued
49
Personal services-Continued Automobile repair and services
LaundriesAutomobile repair shops Automobile Mi lItem ,
dry clean-ing and Beauty rBarbs
OtherersonalP
Businessservices Total
Generalutomotwea
Otherparking
and
scelaneousrepair
garment shops shopsservices Total
repairautomobile
iother
servicesservices hops
repa r services
(7 1) (72) (73) (74) (75) (76) (77) J78) (79) (80) (81)
Partnerships With andWithout Net Income
umber of partnerships ........................ 6,940 10,200 3,528 12,614 80,189 36,396 25,707 14,738 10,969 9,690 11,300umber of partners .............................. 15,170 23,702 9,086 31,858 451,534 76,991 55,462 32,581 22,881 21,529 25,15:
otal assets ......................................... 227,191 85,696 10,854 543,937 21,454,480 1,851,550 622,042 426,517 395,525 1,029,508 345,56
otal receipts ....................................... 658,199 338,901 306,775 997,113 9,956,057 3,913,505 2,755,762 1,406,842 1,348,920 1,157,744 1,058,121
Business receipts ........................... - ... 654,959 324,151 306,775 959,746 7,278,916 3,808,690 2,741,347 1,401,086 1,340,261 1,067,343 1,026,279Income from other partnerships and 323 -
fiduciaries .......................................Nonqualitying interest and dividends .......
-1,065
-501
- 977,040
83,765325.162
32311,600
-6,897
-2,894
-4,004 4,703 231
Rents received .., ................................ 1,067 2,496 385 1,313,933 46,814 1,614 1,505 108 45,200 29.723Royalties .......... ................................ - - - 16,449 21 - - - 21-
--
Farm net profit ...................................Net gain, noncapital assets ...................
-711
-902
-667
-258,563
-26,556
-3,824 -
-3,824 22,732 6
Other receipts .................................... 397 10,851 - 29,178 679,269 19,501 2,079 1.357 723 17.422 1,882Total deductions .................................. 605,520 344,424 275,033 861,722 9,659,306 3,563,425 2,438,502 1,258,164 1,180,338 1,124,923 911,342
Cost of sales and operations ................ 80,656 58,822 37,413 270,075 2,245,430 1,962,105 1,481,284 798,872 682,411 480,822 547,993Inventory, beginning of year ... ........... 181 2,535 - 18,532 92,790 249,804 209,587 27,728 181,859 40,217 93,066Purchases ...................................... 2,126 14,489 536 220,060 905,918 1,436.811 1,114,965 676,841 438,124 321.846 424,411Cost of labor ................. ............... 11,661 28,291 35,259 13,775 304,926 203,805 165,410 66,995 98,416 38,394 56,993
..............................Other costs 67,561 15,868 1.619 34,320 1,067,378 268,620 146,120 58,401 87,719 122,499 79,254......Less: Inventory, end of year .............. 872 2,362 - 16,612 125,583 196,955 154,821 31,094 123,727 42,134 105,723
Salaries and ages .......... .................. 119,908 57,442 104,670 106,139 800,752 310,845 220,415 81,206 139,209 90,430 47,852Less: Jobs credit ................ ............ I - - - 4,381 2,306 2,306 2,306 - - -
Guaranteed payments to partners .......... 15,183 48,396 - 39,934 213,954 119,770 80,613 36,715 43,898 39,157 25,025Rent paid ................................
.. . ..49,437 46,357 15,882 46,640 495,219 174,382 122.309 79.716 42,593 52,073 23,451
Interest paid ....................................... 16,841 12,884 - 17,777 869,171 119,028 36,478 17,093 19,385 82,550 19,690Taxes paid .......................... ........ 17,054 13,723 3,756 20,096 135,198 75,057 48,354 20,571 27,783 26,703 14,431
.............................. ........Bad debts . 123 40 - 3,612 71,398 7,727 6.048 4,218 1,830 1,679 1.411.Repairs .................................... ........ 18,669 3,920 12,706 148,116 28,829 13,356 8,094 5,262 15,474 4,067Depreciation .......................................Depletion ........................................... - 2,464 - - -Pension, profit sharing, annuity and bond 76 77purchase plans ...................... .........Employee benefit programs ...................
-1,471 -
4702,044
14,18012,359
766,729
-4,857
-2,068
-2.789 1,872 232
Net loss from other partnerships and466 91 291 109 447 430 - - - 430 -
fiduciaries .......................................Rent net loss ....................... ............. - - 6,142
,814,906 31,913 172 172 31,741
Royalty net loss .................................Farm net loss ........... ........................ -
-1,246
5,826805
-573
-24
-24
-549
Net loss, noncapital assets ............... - 93 - 2 30,260 3,143 2,677 5 2,671 467 1COther deductions ..... ................ ......... 230,836 81,338 106,080 263,820 2,095,333 519,124 360,505 174,774 185,731 158.619 167,395
Net income (less deficit) ....................... 52,679 -5,523 31,743 135,391 296,751 350,080 317,260 148,678 168,581 32,820 146,779.................. - ..................Not income 66,653 39,265 38,082 214,422 2,581.576 488,026 363,021 167,365 195,656 125,005 177,111.
Deficit ........ ................................ - .... 13,974 44,788 6,339 79,031 2.284,825 137,946 45,761 18,687 27,075 92,185 30,332
Partnerships With Net IncomeNumber of partnerships ........................ 6,379 4,019 2,514 10,600 45,159 24,117 18,625 10,899 7,725 5,492 9,15ENumber of partners .............................. 13,881 9,130 7,057 27,057 234,183 52,687 40,573 24,904 15,670 12,114 18,316Total assets ......................................... 134,660 18,625 10,854 294,350 8,948,134 1,124,741 610,666 383,395 227,271 514,076 159,652Total receipts ....................................... 520,344 96,696 117,288 840,277 7,391,276 2,774,231 1,954,427 815,131 1,139,296 819,804 1,000,48C
Business receipts ................................ 517,493 96,567 117,268 835,432 5.394.676 2,713,494 1,942,176 810,584 1,131,593 771,318 968,WIncome from other partnerships and 323fiduciaries ... ..................................Nonqualitying interest and dividends .......
-873
-63
- 973,448
82,894217,640
3239,343
-6,224
-2,894
-3,330 3,120 21E
Rents received ........................... .... - 1,067 - 261 1,039,652 33,809 1,612 1,504 108 32,197 29.71 GRoyalties ........................................... - - 14,122 - - - - - -Farm net profit ............... ...................Net gain, noncapilal assets ..................
-707
-27
-83
-242,777 14,197-
-3,700 -
-3,700
-10,497 E
Other receipts ............... .......... .......... 204 40 955 399,516 3,065 715 150 565 2,350 1,67ETotal deductions ................................... 453,691 57,431 79,207 625,864 4,809,700 2,286,204 1,591,406 647,766 943,640 694,799 823,37f
Cost of sales and operations ................. 41,773 12,860 37,413 231,556 1,482.120 1.317,856 892,479 371,610 520,869 425,377 517,72EInventory, beginning of year ................ 181 83 - 12,327 76,255 196,935 181,064 20,720 160.345 15,871 81,95(Purchases ....................................... 1,759 9,842 536 191,151 675,627 915,686 626,198 305,277 320.920 289,488 400,941
-Cost of labor ................................... 11,661 3,470 35,259 13,775 256,109 150,999 112,664 31,972 80,692 38,335 55,91 1Other costs ..................................... 28,523 - 1,619 27,205 563,488 189,296 88,986 32,720 56,266 100,310 69,37(Less: Inventory, end of year .. ............. 351 535 - 12,903 89,360 135,081 116,454 19,080 97,374 18,627 90,45,1
Salaries and ages ...................... ....... 90,302 3,301 - 59,835 600,277 225,478 173,335 44,094 129,241 52.143 46,43,Less: Jobs credit .............................. - - - 4,380 2,306 2,306 2.306 - - -
Guaranteed payments to partners ........... 14,946 - - 39,229 79,296 51,484 40,029 5,176 34,853 11,455 24,90(Rent paid ........................................... 43,182 11,617 15,882 14,743 277,995 120,975 92,028 56,654 35,374 28,947 18'MInterest paid ..................... - ................ 10,292 311 - 8,080 261,696 44,189 19,145 9,446 9,699 25,044 12,80ETaxes paid ..................... ................... 14,828 1,121 3,756 12,114 99,896 56.077 39,513 15,253 24,259 16,564 14,04,Bad debts .......................................... 103 - - 1,878 62,298 2,726 2,494 1,002 1,492 232 1,20!Repairs ........................... ................... 13,583 328 9,961 65.389 19,446 10,003 5,741 4,262 9,443 3,MDepreciation ........................................Depletion ............................................ - 410 - - -Pension, profit sharing, annuity and bond 76 71purchase plans ...................
......... ...- 449 12,656 76 - - -
Employee benefit programs ..... - ........... 1,410 969 9,245 5,417 4,857 2,068 2,789 560 1(Net loss from other partnerships and
fiduciaries ........................................ - 291 8520 - - - - -Rent net loss ................................... 664 12:707 -Royalty net loss ..................................
-
1 - - -Farm net loss .....................................
1'
246 769 24 24 24 - -Net loss, noncapital assets .................... - - 2 17,512 103 41 5 36 62Other deductions ............................. ... 186,799 24,634 18310 203987 1 302,353
'355,578 274,591 113,058 161.533 1870
414; M
Net Income ........................................... 1 66,653 39,265 38:082 214:422 2,581,576 488,026, 363,021 , 167,365 , 195,656~~:
20.,
,
NN
:, "11

so Partnership Returns/1984Table 1-Total Assets and Income Statement for Selected Industries-Continued(All figures are estimates based on samples-money amounts are in thousands of dollars)
Services-Continued
Amusementi
Medical and health services A=.nlng, auditingsepingservi
, aridces Nature
ar d Engineering ofItem oation
services, OfficesOther
medicalL age]
andarchim Certified
Other
O-n'Other busine
notinclud~7 Total
ofand tectund Total
public ud"ng7 earvice- ocablemotphyscums health services accour, and book
pictures sennces tents keepingservices
(82~ (83) (84) (85) (86) (87) (881 1891 (901 (911 (92)
Partnerships With andWithout Net Income
Number of partnerships ........................ 31,832 30,160 10,062 20,098 25,152 6,704 14,253 8,233 6,020 43,916 26'ag INumber of partners .............................. 193,392 130,874 37,3413 93,534 121,066 18,166 55,293 39.319 15,974 184,250 86,177Total assets ......................................... 10,293,588 5,991,946 988,987 5,002,959 5,218,289 799,987 2,501,793 2,218,028 283,765 5,529,623 17,564,638Total receipts ....................................... e,316,328 14,646,090 7,117,5S4 7,528,536 24,265,190 3,271.429 10,481,371 9,830.9% 650,415 4,424,592 24,968,840
Business receipts ................................ 7.209,294 13.598.013 6,289.003 7,309,010 23,519,781 3.222.065 10,383,136 9.743,642 639,494 3 932 201 24 080 177Income from other partnerships and
, . . ,
fiduciaries ........................................ 90,590 3,839 2.300 1,539 6,902 4.264 7,633 7,633 - 58,252 687Nonqualitying interest and dividends ........ 81,870 78,514 19,170 59,344 81,346 26,828 56,835 48,262 8.573 521201 87 348Rents received .................................... 73,842 53,277 5,471 47.806 58,016 446 1,259 1,224 35
,43,291
.9,896
Royalties ............................................ 46,670 22 - 22 315 5 2,496 2,496 - 50,910 12 245Farm net profit .................................... 77 - - - - - - - - 8,418
,-
Net gain, noncapilal assets .................. :. 192,140 .13,281 540 12.741 4.648 1,039 541 92 448 12 455 1 133Other receipts ....... .................. ; .......... 621,855 899,144 801,070 98,074 594,182 16,782 29,472 27,608 1,864
,117,545
,777.355
Total deductions .................................... 9,149,886 10,006,107 3,922,768 6,083,339 14,259,061 2,933,566 8,172,191 7,626,224 545,967 4,199,028 24,880,307Cost of sales and operations ................. 2.139,205 1,042,148 53,703 988,446 236.101 975,248 155,187 141,863 13,324 1,557,551 22,972 027
Inventory, beginning of year ................ 102,703 34,942 727 34,215 882 7,524 899 202 696 88 934,
14 480 855Purchases .............. q ........................ 442,489 240,624 16.053 224,572 16,761 19,443 23.847 19,392 4,455
,450 024
, ,565 559Coal of labor ......... - ........................ 149,905 225.607 4,534 221,074 10,602 205,105 76,422 67,421 9,002
,327.705
,47 028
Other costs ..................................... 1,559,730 575.378 33,099 542,279 208,590 752,652 56,726 56,726 - 797,830,
22 791 933Less: Inventory, end of year ............... 115,622 34,400 706 33,694 734 9,476 2,707 1.877 830 106,944
, ,14.913,350
Salaries and wages .............................. 1,056,259 2,771.735 1,279,894 1,491,841 6,085,190 701,049 3,735,918 3.545,345 190,574 561,461 41 910Less: Jobs credit .............................. 176 587 24 563 2.910 7 as '88 - -
,-
Guaranteed payments to partners ........... 159,652 416,461 217,905 198,556 638.068 217,438 826,569 741,637 84,932 187,364 1,321 138Rent paid .......................................... 220,800 622,317 344,105 278,212 1,599,442 115,079 570,234 534,947 35,287 106,860
,33,837
Interest paid ....................................... 500,704 312,796 34,946 277,850 184,177 31,802 104,900 98,520 6,380 163.650 66 590Taxes paid ........................................ 174,138 315,158 106,333 208,825 634,875 75,984 345,293 324,764 20.529 122,125
,15,115
Bad debts ......................................... 27,009 22,140 9.027 13,113 17,548 7,388 19,843 19,690 153 5,004 4676Repairs ............................................. 74,956 74,706 25,792 48,913 102,068 8,609 48,413 43,326 5.088 48233
,19 360
Depreciation .......................................- - - - -
, ,
Depletion ........................................... 2,210 2,206 - 2,206 205 322 - - - - .1.Pension, profit sharing, annuity and bond
purchase plans ................................ 21,374 82,277 66,655 15.621 159.877 18,740 69,398 68,635 762 3 092 801Employee benefit programs ................... 19,667 131,665 .84,814 46,852 149,428 23,812 75,676 73,211 2,465
,30 693 3 176
Not loss from other partnerships and, ,
fiduciaries ....................................... 163,664 12,317 226 12,091 6,061 847 10,160 7,508 2,652 100,518 25 027-Renl-net-loss ..................................... 1,084 5,385 36 15,249 6.285 -5,652 67-1 -671 - 8.647
.-231545Royalty net loss ..................... ...........
Farm nelloss ....................................-
6,837- - - - - - - -
14-
1 125Net loss, n6ncapital assets ................... 11,319 102 12 90 690 .152 131 130 - 126
,2
Other deductions ................................ 3,153,722 , 3,855,606 1.632.306 2,223,300 3,891,032 699,573 1,983,324 1,821,084 162,240 1,058,697 262,122Not Income (less deficit) ....................... -833,558 4,639,983 3,194,786 1,445,196 , 10,006,130 337,863 2,309,180 2,204,732 104,448 225,564 88,533
Net income ........................................ 1,098,605 5,222,888 3,201,877 2,021.011 10,056,899 408,510 2,349,895 2,223,639 126,256 1,240,455 264 195Deficit ............................................... 1,932,163 582,905 7,091 675,815 50,769 70,648 40,714 18,907 21,808 1,014,891
,175,662
Partnerships With Net IncomeNumber of partnerships ........................ 10,130 23,654 9,671 13,983 24,074 3,717 10,815 7,056 -3,759 - 21,119 13,943Number of partners .............................. 60,985 86,840 36,211 50,630 112,752 8,970 47,299 36,601 10,698 64,695 48,129Total assets .......................................... 3,821,220 2,936,711 728,135 2,208,577 5,119,356 420,969 2,216,723 2,071,932 144,791 2,530,502 1,142,614Total receipts ..... : .................................. 5,239,466 12,890,260 6,841,596 6,048,665 23,750,822 2,695,120 10,108,025 9,550,867 557,158 3,396,047 1,421,684
Business receipts ................................ 4,589,965 11,896,687 6.018,932 5,877,756 23,039,529 2,668,507 10,012.389 9,464,367 548,022 2 973 596 1 319 771Income from other partnerships and
, , , ,
fiduciaries ........................................ 82,712 3.584 2,300 1,283 6.902 3.763 7,633 7,633 - 58 144 -Nonqualitying interest and dividends ........ 52,361 46,638 18,384 28,254 80,970 12,097 55,258 47,538 7,721
,183,100 75 565Rents received .................................... 48,352 48,004 5,471 42,532 57,966 396 1,259 1,224 35 31.890
,9.879
Royalties .: .... ..................................... 24,058 - - - 315 5 2,496 2,496 - 38 944 12 245Farm net profit .................................... 77 - -
,8 418
.-
Net gain. noncapilal assets .................... 179,941 7,838 539 7,299 4,646 429 514 66 448,
10 929 1 127Other receipts .................. .................. 262,001 887,510 795,970 91,540 560,492 9,923 . 28,476 27,544 932
,91,025
,3,096
Total deductions ................................... 4,140,861 7,667,372 3,639,719 4,027,653 13,693,923 2,286,610 7,758,130 7,327,228 430,902 2,155,593 1,157,488Cost of sales and operations ................ 1,224,815 810,516 53,265 757,253 210,007 709,727 133,662 120,339 13,324 1.112,764 892 239
Inventory, beginning of year ............... 40,898 20,335 727 - 19,608 882 5.573 - 899 -- 202 - - 696 33.747,
- 31 188-Purchases ...................................... 307,607 207,814 16,053 191.761 16,761 12,365 5,611 1,155 4,455 324 168,517398
Cost of labor .................................. 96,957 162,693 4,534 158.159 10,602 110,044 71,578 62,576 9,002,
289 435,
42 846Other costs .................................... 830,330 440,036 32,C~ ~ 407,374 182,495 588,242 56,432 56,432 -
,505.898
,430 814
Less: Inventory, end of year .............. 50,978 20,356 706 19,650 734 6,498 856 26 830 40,485,
11.128Salaries and wages ............................. 535,272 2,298,592 1.255,139 1,043,454 5,933,183 636,307 3.615,261 3,449,658 165,603 206 129 23 578
Less: Jobs credit ............................. 3 558 24 533 2,910 7 88 88 -,-
,-
Guaranteed payments to partners ... ...... 63,450 275,744 197,038 78,706 488,038 87.733 711,722 669,028 42,694 80 014 3 510Rent paid .......................................... 107,308 517,281 335,379 181,903 1,553,320 96,651 543,670 515,360 28,310
,69 476
,76816Interest paid ....................................... 158,585 158,045 32,805 125,239 1177,376 15,823 90,239 85,511 4,728
,65 778
,18 652Taxes paid ......................................... 91,524 251,710 104,099 147,611 622,336 68,948 334,740 316,453 18,286
,32,279
,8,665
Bad debts ......................................... 6,441 17,275 9,027 8,248 17,548 2,102 19,680 19,662 18 3 537 0341Repairs .................................... ........Depreciation ............................... .......
38,688 59,823 25,365 34,458 101,245 7,344 45.794 41,360 4,434,
20,784,
15,463
Depletion ........................................... - - - - 205 322Pension, profit sharing, annuity and bond
purchase plans ................................ 13.066 81,324 66,572 14.752158.469 is 318 69,228 68.465 762 2 534 223
Employee benefit programs ................... 9,523 117,538 84,239 33.299 148.709 20249: 75,244 72 779 2 465,
4 761 2 705Not loss from other partnerships and, , , ,
fiduciaries ..................** ........ ... .......
25,341 2,779 226 2,553 15,474 519 8,926 7508 11417 335 2 633Rent net loss ...................................... 3,553 586 136 451 5,606 56 653 6531 -1 2122,-
Royalty net loss .................................. ,
Farm netloss .....................................4 -29Not loss, noncapital assets .............. ..... 5,180 12 12 - 890 143 131
3.~
j
C7
,-
Other deductions ................................. 1,524,094 2,847,432 1,412,017 1,435,415 3,738,242 584.884 1,892,453 1 762 8631295,89 489,935 135,191
Net Income ........................................... 1,098,605, 5,222,688 3,201,8771 2,021,0111 10,056,8991 408,610 2,349,895 2:223" 126:251.
240.455 . 264,195'The deduction for depreciation is not shown separately because the amounts reported on the partnership return, Form 1065, are understated. The understatement results from the reporting characteristics of
partnerships in farming and real estate. A more accurate estimate of the depreciation deduction. obtained from the Form 4562, the form on which depreciation is computed. can be found in Table 2-SelectedItems, by Industry.

Table 2- Selected Items, by Industry(All figures are estimates based on samples--money amounts are in thousands of dollars]
Number of partnerships Number of Total Businesscost of
l nd D r ciationTaxes paid Interest
Pa rollGuaranteeda ments to
Net income NetDeficitIndustry
Total Limited partners assets receipts'es aaa
perationsep e deduction paid y p y
partners(loss deficit) income
(1) (2) (3) (4) (5) (6) (7) (8) (9) (1 m (11) (12) (13) (14)
All industries ............................................. 1,643,581 257,164 12,426,721 1,0309848,519 357,802,613 180,8579822 469939,395 6,673,186 25,437,588 36,348,857 7,517,503 -3,500,024 69,6969922 73,196,946
Agriculture, forestry, and fishing ........................... 139,306 9,950 494,392 26,738,825 5,885,672 3,498,298 29380,076 88,031 363,290 556,635 254,850 -749,030 2,478,151 3,227,181Farms .............................................................. 112,817 7,548 389,673 22,043,910 3.113,091 2,110,767 2,019.052 40.128 194,734 222,319 199,687 -606.945 2,038,860 2,645,806
Field crop ..................................................... 41,997 1,415 156,679 7.563,058 891,685 445,414 628,488 22,115 46,850 119,244 70,339 392,779 1,023.547 630,769Vegetable and melon ...................................... 1,968 150 5,385 o7l,935 71,548 58,982 63,894 738 1,905 7,853 4,856 163,432 182,323 ie,890Fruit and tree nut .......................................... 11,379 3,698 76,204 4,691,527 213,040 107,225 274,796 6,856 38,372 30,894 25,727 -369,356 150,974 520,331Horticultural specialty ................. .................... 4,054 25 9,223 358,294 85,538 35,215 40,262 1,914 19,444 16,604 996 -30.339 54,186 84,525Beef cattle feedlots ............ ........................... 1,646 to 6,286 438,539 266,690 221,099 26,652 521 3.687 9,467 1,722 -828 29,244 30,071
Beat cattle, except feedlots ............................. 19,845 915 55,878 3,633.820 535,249 449,719 2,874 44,389 8,120 30,386 -344,282 212,244 556,526
Hogs, sheep. and goats .................................. 5,714 - 13,509 267,581 187,610 178,009 59,540 118 4,106 346 6,023 -16,480 45.002 61,482Dairy terms ................................................... 18,328 1,015 42,257 2,173,120 336,130 231,429 519,592 2,290 9,424 8,914 43,405 -84,740 227,359 3`12.099Poultry and eggs ........................................... 978 8 2,552 542,866 324,627 230,516 55,018 1,168 7,065 9,397 2,909 7,156 52,052 44,896General livestock, including animal specialty ....... 6,418 306 20,607 1,776,755 200,974 153,158 145,048 1.534 19,273 11,479 7,268 -319.447 61,930 381,377Farms not allocable ....................................... 490 5 1.093 26,415 - - 5,872 - 219 - 6,054 -4,839 - 4,839
Agricultural services ............................................ 20,349 835 63,512 2,750,055 1,955,181 1,000,845 249,864 39,022 82,178 248,522 23,502 -56,460 357,435 413,895Veterinary services .......................................... 593 149 6,676 71,712 155,362 19,118 5,624 2,362 1,331 19,673 2,401 7,294 65,718 58,424Livestock breeding .......................................... 2,185 499 14,076 883,965 137,159 72,248 93,866 3,680 17,739 20,878 3,650 -174,295 24,267 198,562Animal services, except livestock breeding and
veterinary ................................................... 3,824 182 10,412 529,633 134,318 94,125 35,882 1,685 3,581 11,173 605 -52,299 23,564 75,883Landscape and horticultural services .................. 6,313 - 14,020 355,432 660,801 241,443 24,074 21,286 18,426 117,970 11,933 142,662 164,793 22.131Other agricultural services ................................ 7,432 4 18,327 909,312 867,541 573,912 90,418 10,009 41,100 78,628 4,913 20,178 79,073 58,895
Forestry ........................................................... 2,473 33 30.050 1,374,173 397,397 182,073 31,812 6,425 45,375 37,963 21,362 -43,335 43,039 86,374Fishing, hunting, and trapping ............................... 3,667 1,534 11,157 570,687 420,003 204,613 79,348 2,456 41,003 47,831 10,299 -42,290 38,817 81,106
Mining ............................................................... 56,548 21,028 2,007,460 52,415,093 16,637,767 5,924,109 3,238,631 626,753 1,446,686 985,781 132,632 69,112 7,657,115 7,786,002Metal mining .................................................... 2,037 1,329 38,559 4,493.521 1,095,520 803,069 299,063 56,059 141,144 119,214 732 -559,439 112,812 672,251Coal mining ..................................................... 2,323 50 77,473 4,827,240 2,520,109 1,278,841 284,585 89,920 108,829 325,450 8,292 -77,410 330,377 407,787Oil and gas extraction ....................................... 50,980 18,932 1,883,264 41,265,540 14,177,318 3,356.057 2,525,663 471,390 1,151,108 362,321 116,652 787,343 7,348,703 6,561.361Nonmetallic minerals, except fuels ........................ 1,208 717 8,164 1,828.792 844,820 486,142 129,319 9,383 45,606 178,797 7,156 -81,381 65,222 146,603
Construction ...................................................... 64,607 3,024 173,273 13,783,426 23,198,439 17,192,497 556,881 223,235 475,227 2,613,680 405,140 2,193,322 2,966,387 773,065General building contractors and operative builders. 23,729 831 60,950 9,293,978 10,093,291 8,235,145 143,475 95,354 327,731 816.144 237,375 520,887 1,006,968 486,080
General building contractors ............................. 22,857 643 58,418 7,541,857 9,381,045 7,694,233 115,179 88,828 288.008 792,818 236,717 405,337 824,612 419,275Operative builders .......................................... 873 188 2,532 1,752,120 712,246 540,913 28.296 6,525 39,723 23,326 658 115,550 182.356 66,805
Heavy construction contractors ............................ 1,845 69 4,145 2,456,762 5,653,302 4,740,238 118,453 20,900 44,813 726,934 12,597 592.257 700,148 107,891Highway and street construction ....................... 146 63 522 256,833 821,625 762,043 15,514 2.598 7,323 66,283 1,680 29,157 44,780 15,623Heavy construction, except highway .................. 1,698 6 3,624 2,199,929 4.831,677 3,978,195 102,940 18,302 37,491 660,651 10,918 563,101 655,368 92,268
Special trade contractors .................................... 39,001 2,124 108,083 2,032,516 7,414,330 4,217.114 294,953 106,982 102,683 1,070,602 155.167 1,053,985 1.233,076 179,094Plumbing, heating. and air conditioning .............. 4,252 11,279 298,494 1,214,737 716.868 39,192 13,013 6,759 114,378 7,686 252,801 263,268 10,466Painting, paper hanging, and decorating ............. 6,345 - 14,156 98.408 573,770 211,148 10,063 15.952 2,108 90,484 25,211 181,855 186,834 4,979Electrical work ............................................... 4,599 - 10,711 280,8a4 759,450 430,061 20,197 8,401 11,124 142,008 723 124,147 126,637 2,490Masonry, stonework, tile setting, and plastering ... 4,199 1,500 9,072 96,867 796,947 367,445 16,703 12,407 12,204 227,500 25,431 80,023 86,475 6.451Carpentering and flooring ................................ 4.326 - 8,914 47,918 359,735 142,191 6,291 4,514 2,451 51,345 24,781 90,388 91,809 1,421Rooting and sheet metal work ......................... 1,126 - 2.739 74,579 365,692 227,075 7,223 4,957 4,034 74.604 11,017 49.573 51.038 1,465Concrete work ............................................... 1,589 - 3,179 111,964 557,477 362,612 16,407 19,444 5,891 75,885 109 77,808 85,003 7,195Water well drilling .......................................... 485 - 970 - 1,542 1,281 1.314 14 1,155 - - -3,439 - 3,439Miscellaneous special trade contractors ............. 12,081 624 47,064 1,023,402 2,784,980 1,758,432 177,564 28,280 56,957 294,399 60,207 200,827 342,015 141,188
Contractors not allocable .................................... 31 - 94 170 37,515 - - - - - - 26,192 26,192 -
Manufacturing .................................................... 29,606 1,116 93,601 19,574,057 18,326,382 14,237,424 1,481,903 209,394 614,043 29366,219 132,861 -1,100,943 1,165,440 2,266,383Food and kindred products ................................. 465 49 1,758 1,347,257 2,535,348 1,949.258 78,974 29,493 50,643 312,160 8,476 13,543 77,841 64,298Textile mill products ............. ................... 236 495 93,980 279,249 211,060 5,305 1,784 4,746 45,557 436 16,561 18.342 1.781Apparel and other textile products ........................ 2712 6 5,487 649,652 1,189,089 860,912 14,649 10.210 34,932 148,272 1,906 45,996 60,011 14,015Lumber and wood products, except furnitur. ........... 2:162 32 6,534 2,053,582 2,213,383 1,760,942 178,406 43.364 146,083 386.999 18,488 -219,853 73,457 293,310.........Furniture and fixtures ......................................... 1,757 4,016 129,662 269,131 224,167 5,996 306 6,716 58.972 198 -14,181 6,952 2`1,134Printing, publishing, and allied industries ................. 4,414 , 467 19,094 1,260,481 1,561,892 788,160 99,420 29,026 42,849 347,183 38,559 34,816 212,446 177,628
Footnotes at end of table.

Table 2- Selected Items, by Industry - Continued[All figures are estimates based on samples--money amounts are in thousands of dollars]
Number of partnerships
Total(1)
29!
4,1431.041
2,4861,018
132
8,719-
20,5781,090
61,084
9,9808,9251,055
498442
1,i7379
2731,421
3,8921,3871,516
184,641:
7752.13575320965
2,2443,667
4571,97Q1.372
1,503102
5,19216
163,473
7,992,51
2682.332,237
637
4,9372.6352.30
Limited(2)
172
64
9736,12
222-
4,394
1,5351,349186
271~
83-1964
2,2A210
11,17t
246
5~9
658
23
112096-
10,928
4035
53503
Number ofpartners
(3)
7,379
8,36;2,099
5,9222.2991,491
28,405-
142,0912,196
122,184
33,2819,45913,827
5,2561,626
12,334233
3,8588,244
63:243'.1E
44'
5; 7821:9465,1072,087
5672,074
5399:874
9634.3716.548
3,742646
13,42833
386,907
18,9275,9691,0495,0225,5531,334,
10,574~5,80914,7651
Totalassets
(4)
/
5,788,126
319,46;867,437
904,218337,851451,862
5.256,782-
21,109,07153,14315,30137,841
1,561,858631,649930,209
1,766651330:355
2,673,15734,959
113,8772,524,322
, 1 ,1:6131 5044 :2, 1
B~
7,775,074264,480245476222:365120,325223,379
760,886.2,018,108
169123275:08440,664
765,266164,490
2,097.1478,281
13,434,830
1,965,093688,06835,050
209,193865,721167,060
395,985,178,165,217,8201
Businessreceipts'
(5)
2,478.046
256.93;1,294,391
1,094,528168,348407,574
4,480,88~-
10,732,71599,891
9,56190,330
1:410: 731,771,587
760021115:901
2,608,255144,399307,751
2J56.106
2,550,0391,284,659
132,088
72,335,387
28,169,882,668,203
1,362,694376,443263,739411.766
1,302,3442,921,399
601,868985,566
2,965,926
2,668256738:105
12,879,75023,822
44,132,987
2,440,5391,256,681
129,048524,804319,210210.796
846 329362:879483,449
Cost ofsales andoperations
(6)
2,172,006
178.101,045.500
786,882140.619288,75
3,754,895-
5,572,29A14.05110,4263,625
4073291,635,776
52051232:9
18
1,427,58195,995
101,151,230,43
681,918806,10546,10
56,135,446
24,923,035442,023
1,065,872294,728193 77317:9M
936,5672,450,023
483,186711,617
2,576.835
2,474,415597,535
12,363,55314;827
31,183'.8881~
1,662.313905.600
55,907338,142188,687173,976
587322218:576~368,747
Depreciation
(7)
423.372
-19,37071,302
52,187,84671128012
496,20.-
2,112,71612,1753,4368,739
18243341,371
2.21 416
1:52
306,7314,901
17,319284,511
717,595541,569
27,903
11,1199,719~
301,7149,090
23.2378,52522524:747
74,2182
51,6808,1776,217
17,148,
50,5717,00
38.22562
897,894
64,82521,843
2,7414,78
.20,79714.6621
21 4215:7830~
5,637
Taxes paiddeduction
(8)
25,412
-10.23510,495
14,420829
4,092
28,244-
183,6464,997-
4,997
39,4556,723
4,0943,367
14,07211029
28912,754
Bi.78525,166
3,987
883,974
135,5055,5709,034,295,344,42
13.40214,914
2,7085,399
17,683
10,0455,439
37,241-
748,274
42,94113,0554,821
12,8219,7782.466
1:,126
8,
36,513
Interestpaid
19)
99.822
-3.34834,399
31,67311,104
4,162
140,279-
1,253,614.2001,2732.927
68,49427,456
124,91923,582
27,64011 6
1:347 0118,69~
577,012279,035
21,279913,839
359,9699,273
120112:166
.051
8,214,
57,08990,330
5,61010,95812.588
368155:042
103,401423
553,832
46,14416,9933,2103,884
13,1018,9
'
55
10,6341 114~9:U01
payro"
(to)
169,685
-53,775201,335
159,22713,92089,674
361,943-
949,70425,869
6,22719,642
253:13132
,99
85,71113.366
48,670555747
35,643
463,89410,288.15,780
5,221,00~
1,026,07531,33885,952424631:23925,780
86,259122,72723,023
164,156121 968'
76'69346
14.193.347~
184,19473,70317,37653,265~29
'
8889,962
79,90132,56447,337~
Guaranteedpayments to
partners
2,309
47:4.
a..42,4,~
40,080-
102,303---
45,98827,993
1,986760
47201:894-
2,82
18,8001,427
62.~
777,739
224,5773,787
16,806132 34:2885,663
23,93591,873
75~2,41 ~'
18,706
10902
553,089
54,33513,658
109825:74512,589
1
:24.5
23
12
12,38310,746
Not i-me(few deficit)
(12)
-481,380
-
3,92;11.976
18.38939.844
-1,403
-552.740-
-2,007,0313,81
-5,88719,697
91,63725,219
-171,336-24,116
410 385~10:1094
,359
395.917
-1.393.291-953.797
-5,542
1,666,476
371,09952.54967,46012,167
75923,323
10,988,45,68933,01971.36859
'
236
-
1086631:706
-26,694396
1.294,92Z
156,633104,40711901631'5851
6~.45.8~- 4
5.7!152716,9,11,185
Notincome
(13)
247,356
20,11842,902
97,85851,33144,684
207,53;-
1,280,49920,253-
20,253
13040553.283
64,98728,856
675.098075
17644646,379
159,459125,29322,865
3,238,481
839,618'66,947i80,6325,071;12.3226,933
76,171117,833
41:7717653677,389
36,09638.725
162,7923961
2.398,115
208.625124,359
19,01637,07924 6~~793: 1,
- .0:21~4'15,656
Manufacturing--Continued
Chemicals and allied products ..............................Leather and leather products ...............................Stone, clay, and glass products .................... : .......Primary metal industries ......................................
Fabricated metal products ...................................Machinery, except electrical .................................Electrical and electronic equipment .......................Transportation equipment ............ ............Other manufacturing industries ... : .................. .......Manufacturing not allocable ..................................
Tritinsportation, communication,* electric, gas, andsanitary services .............................................Local and interurban passenger transit ...................
Taxicabs .........."' " " * .. .. .................. .... -Other passenger'bans'poWtolion...........................
Trucking and warehousing ...............................Trucking. local and long distance .......................Public warehousing and trucking terminals ...........
Water transportation ...........................................Air transportation ..................... .........................
Transportation services .......................................Passenger transportation arrangement .................Freight transportation arrangement .....................Other transportation services .............................
Communication .................................................Electric, gas, and water services ..........................Sanitary services ................................................
Wholesale and retail trade...................................
Wholesale trade ................................................Motor vehicles and'automotive equipment ..........Lumber and construction materials ~ ...................Electrical goods ............................................Hardware, plumbing, and heating equipment ........Farm machinery and equipment ........................
Other machinery, equipment, and supplies ..........Other durable goods ......................................Drugs, chemicals, and allied products ................Apparel, piece goods, and notions ....................Groceries and related products ........................
Farm-product raw materials ..............................Alcoholic beverages ....... : ...............................Other nondurable goods ..................................Wholesalers not allocable ................................
Retail trade.............. - ...................... -*-- .....Building materials, paint, hardware, garden supply,
and mobile home dealers .............................Lumber and other building materials dealers ....Paint. glass, and wallpaper stores ..................Hardware stores .........................................Retail nurseries and garden supply stores .......Mobile home dealers ...................................
General merchandise stores .............................Variety stores .............................................Other general merchandise stores .................
Footnotes at end of table.
Industry Deficit
(14)
728,735
24,04130.926
79,46911,48646,088
760,270-
3,287,5326,4435,887
556
3876928,064
236,32452,972
264,713966Z~,2
85250,463
1.552,7491,079,090
28.407
1,572,005
468.51914.39813,17512,90511,5633,610
65,18372,144
8,7525,168
18,153
46,9627.019
189,485-
1,103,193
51,99219,953-
5,494111,o21
8,524
50,13223,29126,841
(n

Table 2- Selected Items, by Industry- Continued
[All figures are estimates based on samples-money amounts are in thousands of dollars]
Number of partnerships Number of Total BusinessCost ofsa as and
. .Deprecation
Taxes paid Interest PayrollGuarantpayments to
- I
Net in me NetDeficitIndustry
Total Limitedpartners assets receipts' opsrations
deduction paid partners (loss deficit) Co.in
(1) (2) (3) (4) (5) (6) (7) (8) (9) (10) (11) 1 (12) (13) (14)
Wholesale and retail trade-Continued
-
Food stores .................................................. 23,657 573 51,787 1,387,041 8,802,217 6,964,358 106,353 103,586 54,636 618.28C 38,798 274,030 373,226 99,195
Grocery stores ........................................... 11,674 254 25,461 903,871 6,101,168 5,004,176 64,2118 63,421 37,757 398,967 26,383 143,159 193,019 49,860
Meat and fish markets, including freezerprovisioners ............................................. 1,993 4,164 97,362 667,422 656,430 12,812 6,959 2,970 38,872 1,942 70,833 74,820 3,987
Fruit stores and vegetable markets ................ 276 165 619 29,336 159,335 127.225 1,327 2,108 1,143 9,674 2,086 6,956 6,984 28
Candy, nut. and confectionery stores .............. 79 - 404 9,667 38,479 20,692 1,677 1,481 515 7,765 - 4,527 5.568 1,041
Dairy products stores .................................. 653 - 1,329 62.265 86,257 52,759 5,150 3,053 4,627 8.361 155 -2,214 1,699 3,913
Retail bakedes ........................................... 1,702 3,426 15,265 266.655 151,472 4,030 10,267 43 69,449 1,609 37,076 37.076 -
Miscellaneous food stores ............................ 7,279 151 16,386 269.274 1,282,901 951,405 17,068 16,297 7,582 85,191 6,623 13.694 54,059 40,365
Automotive dealers and service stations ............. 14,080 458 33,155 2,452,932 11.451,086 9,723,441 128,500 93,558 108,165 545,153 132,512 251,547 382.947 131,400
Motor vehicle dealers - now car dealers(franchised) ............................................ 903 50 2,486 540,554 2,125,750 1,850,774 11.301 14,030 20,596 113,976 11,946 82.719 86,218 3,500
Motor vehicle dealers - used cars only ........... 3,079 165 6.478 117,438 1,101,337 955,857 4,889 6,691 14,297 41,048 13,426 35.207 51,378 16,171
Auto and home supply stores ....................... 2,022 13 5,402 289,910 1,093.513 713,507 12,081 12.376 10,376 132,255 35,343 60,316 62.811 2,495
Gasoline service stations ............................. 6,059 30 13,525 987,948 6,418,584 5.723,188 51,276 52,897 39,451 206,276 50,037 78,974 136,764 57,790
Boat dealers .............................................. 548 - 1,097 28,224 30,632 20,304 1,083 297 1,210 1,355 407 610 4,012 3.402
Recreational vehicle dealers ......................... 226 - 453 16,693 105,318 67,394 851 119 745 1,957 11.615 9,177 9,177 -
Motorcycle dealers ...................................... 383 16 1,175 117,599 206,944 168.953 1,554 2,183 4.457 14,077 3,109 -2,391 2,921 5,312
Miscellaneous aircraft and automotive dealers.. 859 184 2,540 354,566 369,008 223,465 45,463 4,965 17,034 34,207 6,631 -13,065 29.666 42,731
Apparel and accessory stores .......................... 12,268 -1,162 29.319 807,707 1,739,302 1,098,7511 71,091 38.195 17,184 173,148 32,61 7,365 79.820 72,455
Men's and boys' clothing and furnishings
-stores ....................................................
Women's ready-to-wear stores ...................... 2,601 485 7,235 31,20; 185.80; 120,373 1,408 5,168 5,583 18,040 9,738 -19,415 6,55; 25,966
Women's accessory and specialty stores ........ 1,020 6 2,064 25,721 73,390 56,949 1,597 148 644 1,861 - -5,828 - 5,828
Children's and infants' wear stores ................ 1,014 - 2,029 90,447 219.115 131,433 5,776 2,000 520 26,520 - 1,109 1,109 -
Family clothing stores .................................. 997 2,439 156,048 316,785 193,779 44,205 5,376 11,948 40.941 7,617 16,741 18,565 1,824
Shoe stores ............................................... 2,205 4,468 66,319 242,825 149,426 2,618 3,608 2,369 26,107 296 23,699 23,822 123
Furriers and fur shops .................................Apparel and accessory stores. not elsewhere
classified ................................................ 3,924 667 9,886 268,953 493,384 310.227 12,057 19.550 1,018 41,531 9,921 -9,086 18,791 27,878
Furniture and home furnishings stores ............... 10,056 1,363 21,925 794,871 2,096,662 1,416,801 24,508 30,237 22,505 159,113 25,038 151,633 189,110 37,476
Furniture stores ........................................... 3,609 332 7,518 427,358 860,021 550,662 7,503 15,905 11,463 67,519 19,112 67,911 81,551 13,640
Floor covering stores ................................... 767 - 1,552 100,803 202,607 123,775 3,192 3,382 4,931 23,636 175 29,609 29,609 -
Drapery, curtain, and upholstery stores ............ 149 - 298 - 6,191 3,215 3 59 123 706 - 588 588 -
Home furnishings and equipment stores, exceptappliances ............................................... 2,753 1,014 5,517 53,595 216,659 144,587 4,596 2,964 2,138 20,689 777 -11,552 8.881 20,434
Household appliance stores ........................... 1,353 - 3,004 152,444 491,216 364,902 4,891 4.010 1,317 23,198 4,242 53,731 53.761 30
Radio and television stores ........................... 710 - 2,391 28,568 171,311 130,224 1,923 2,553 695 12,309 - 10,339 11,469 1,130
Music stores .............................................. 716 16 1,646 32,102 148,658 99.437 2,399 1.365 1,839 11,055 732 1.008 3,250 2,242
Eating and drinking places ............................... 35,130 2,897 96,525 2,868.268 8,574,830 3,989,177 310,089 286,198 179,121 1,787,424 97,761 179,894 562,723 382,829
Eating places ............................................. 31,539 2,873 88,894 2,707,639 8,297,935 3,844,633 289,9154 271,087 168,247 1,743,598 92,536 180.893 547,523 366,630
Drinking places .......................................... 3,591 24 7,631 160,629 276,895 144,543 20,105 15,110 10,874 43,826 5,225 -999 15,200 16,198
Miscellaneous retail stores ............................... 54,866 4,379 123,708 2,755,542 8,109,211 5,681,640 170,976 138,345 115.039 640,154 139,941 275,360 545.342 269,982
Drug stores and proprietary stores ................. 1.874 98 4,276 241.692 658,942 442,040 8,694 9,556 5,612 66,603 24,804 56,056 57,396 1,340
Liquor stores ............................................. 3,167 1,023 7,176 394,940 1,515,271 1,211,429 32,721 26,078 18,621 88,391 7,828 48,952 64,661 15,709
Used merchandise stores ............................. 2,079 - 4,644 34,021 104,015 74,241 873 843 1,858 2,620 391 2,760 6.556 3,796
Sporting goods and bicycle shops ................. 4,608 711 11,024 114,931 515,140 345,191 6,730 6,618 2,660 45,333 11,102 -10,337 22,358 32,695
Book stores ............................................... 2,013 555 5,127 64,364 83,178 50,601 6,343 845 5,884 7,775 - -2,907 8,294 11,201
Stationary stores .............................- * '
131 405 40,190 82,096 58,689 840 1,097 499 9.554 2,038 3,887 3,887~~~:Jewelry stores .................................. . .
20'1 1- 2,755 1 66,509 445,144 286,012 6,218 9,760 7,857 85.075 13,851 37,353 37.598 244
Hobby, toy, and game shops ..............,
:2472 - 4,944 15,649 38,215 33,508 2,077 300 239 45 - -5,090 156 5,246
:::::::Camera and photographic supply stores 971 1 1.944 351 76,487 46,164 4,398 2,692 3,437 9,543 - 4,587 5,708 1,121
Gift, novelty, and souvenir shops ........ 4,111 18 10,493 64,373 354,215 211,815 5,600 10,016 1,734 14576 153 43,574 51,425 7,851
Luggage and leather goods stores ......
j- - - - - - - -
T -1 -~ -~ -JSewing, needlework, and piece goods stores ....
,B
4,98 - 9,973_1 28.91 1 431,8261 267,832 1 5,474 1 16,251 1 8,942 21 29.7 34,160 421 - 13, 1 13, 31 1 26, 3
Footnotes at end of table.

Table 2- Selected Itemsi by Industry- Continued[All figures are estimates based on samples-money amounts are in thousands of dollars]
I d tNumber of partnerships Number of Total Business Cost of
sales andIDe reciation
Taxes paid . Inferss'
PayrollGuaranteedpayments to
Not income NotDeficitn us ry
Total Uniftedpartners ssetsa recelpts'
operationsp
Ideduction paid partners (ion deficit) r!come
(1) .(2) (3) (4) (6) (7) (8) (9) (10) (12) (13) (14)
Wholesale and retail trade-Continued
Retail trade-Continued
Miscellaneous retail stores-Continued
Mail order houses ........................................ 1,467 2,947 99,307 399,048 266,815 1,428 1,996 325 29,894 321 38,865 39,224 359Merchandising machine operators .................. 636 1,422 23,767 34,242 17,307 4,655 342 54 3,475 553 2,676 2,676 -
Direct selling organizations ........................... 3,154 7,325 88,304 279,498 113,522 5,174 2,611 8,664 15,043 204 47,229 54,937 7.709Fuel and ice dealers, except fuel oil dealers
and bottled gas dealers ............................ 217 499 22.541 202.073 173,782 3,789 3.007 1,432 8,243 522 2,196 3,936 1,740Fuel oil dealers .......................................... 169 4 431 51.181 302,810 257,517 3,032 3.382 1,612 14.168 3,974 6,268 6,787 519Liquilied petroleum gas (bottled gas) dealers ... 64 - 145 17,979 77,313 68,945 2,679 276 197 1.412 141 1,867 1.927 60Florists ...................................................... 3,080 1,014 6,159 42,388 169,708 118,172 3,555 4,333 750 19,464 16 -33,745 8,021 41.766Cigar stores and stands ............................... -News dealers and newstands ........... :........... -Other miscellaneous retail stores ................... 17,624 949 42.020 1.144,144 2,369,990 1,636,057 66,696 38,341 44,664 189,147 39,882 44,210 156,165 111,955
Retail trade not allocable ................................ 487 987 7,391 72,812 60,085 133 87 403 5,981 8,961 -7,297 433 7,730Wholesale and retail trade not allocable ................. 8 24 , 12,111 32,518 28.523 ill 194 37 1,584 73 454 748 294
Finance, Insurance, and real estate ................. 790,902 183,578 7,408,313 770,457,317 94,362,434 38,507,475 26,384,809 11,859,83111 15,407,083 2,956,779 1,392,157 19,243,718 25,646,379 44,890,098
Finance ........................................................... 144,175 39,934 2,163,044 168,934,031 37,526,636 22.016,952 1,217,707 286,617 5,097,467 1,331.159 419,345 1.359.929 6,413,803 5,053.874Banking ....................................................... - 1,090 . 3 236,749 15,072.696 1,332,028 564,314 2,792 831 . 116,229 43,342 2,332 561,590 561.952 363Credit agencies other than banks ..................... 2,617 1,142 16.149 2,208,515 306,622 _ 35,729 10,332 5,077 95,853 31.334 11,066 15,702 88,756 73.057Security and commodity brokers and services ..... 5,906 3,494 98.369 .54.851,976 26,830,663 20,284,623 26,954 77,463 3,273,752 999,579 236,070 -90,981 1.184,823 1,275,804
Security underwriting syndicates .......** .......
1,050 13 3,885 1,583,284 1.366,821 914,577 2,233 6,439 140,110 144,858 17.956 148,066 166,449 18,383Security brokers and dealers, except
underwriting syndicates ............................. 1,325 351 12,345 44,412,686 19,591,472 14,124,556 .16,017 60,499 2,946,483 749,522 205.985 123.572 609,770 686,198Commodity contracts brokers, exchanges, and
services ................................................. 3,530 3,130 82,`140 8,856,006 5,872,369 5,245,490 8,703 10,525 187,158 105,200 12,129 -362,619 208 603 571,222Holding and investment companies ................... 134,562 35.295 1,811.777 96,800,843 9,057,323 1.1,32,286 1,177,630 203,246 1,611,634 256,903 169,878 873,618 4.578:26 3,704.651
Investment clubs .......... : ............................. 17,057 .4,234 159,915 3,644,730 254,283 7,337 8,751 3,149 11,751 5,353 657 96.732 . 187.914 91,182Common trust funds .................................... 2,559 126 565,681 11,270,448 1,011.294 58,077 3,740 410 45,903 - 6,608 870.159 936,023 65,664.Other holding and investment companies ........ 114,946 30.935 1,086,281 81,885.665 7,791.74 1,066,871 1,165,138 199,687 1,553,980 251,550 162,613 -93,273 3.454.333 3,547,606
Insurance agents, brokers, and services ................ 9,808 208 114,077 3,098,157 3,117,331 403,175 36.266 33,619 34,675 221.707 78,559 600,341 684,586 84.245
Real estate ............... ........ ............................. 636,920 143,436 5,131,192 598,425,129 53.718,466 16,087,348 25,130,837 1,539,602 10,354.941 1.403,913 894,253 - 21,203,988 18,547,990 39.751,979Operators and lessors of buildings ..................... 536,216 120,193 4,510.523 508,026,692 31,860,273 3,401,992 23,387,506 1,120,793 7,050,216 762,987 611.115 - 18,885,837. 14,696,416 33.582.253Lessors, other than buildings ........................... 32,558 6,274 214,681 12.948.716 965,269 84,462 766,442 30,535 179.002 28,967 5.368 -505.372 562,541 1,067,913Real estate agents, brokers, and managers ........ 18,049 3,740 138.403 9,015,244 2,622,868 581,840 236,465 65,114 324,876 228,199 140,573 -221,749 432,887 654,636Title abstract companies ................................. 358 - 1,430 160,559 10,624 5,431 9,675 154 4,273 243 - -.8,543 149 8,692Subdividers and developers, except cemeteries ... 48,716 12,921 253,596 66,844,031 17,861,991 11,774.107 724,196 320.733 2,763,494 377,717 134,546 -1,651,760 2.761,092 4,412.853Cemetery subdividers and developers ................ - 199 46 1.031 . 195,700 24,203 10.573 1 1,433 1.448 3,786 4,582 342 -7.305 3,889 11,193Combined real estate," insurance, loans, and law
offices ...................................................... 823 263 11,527 1,234,189 373,239 228,943 5,120 826 29,294 1,218 2,309 76,577 91,016 14,439
Services ............................................................ 331,103 22,117 1,577,704 87,984,078 90,243,640 16,818,253 9,506,970 2,583,201 4,817,213 20,610,115 2,998,483 15,583,256 24,800,274 9,217,019
Hotels and other lodging places ........................... 18,917 5.106 241,166 33,129,585 14,019,645 5,510,319 2,000,634 636,313 2,463,792 2.500,836 90,669 -2.109,805 817,886 2.927,692Hotels ..~
......................... * ......................
I..... ~2.431 1,342 38,505 20,396,294 9,408,081 4,564.646 1,147,771 400,056 1,584,241 1,634,716 40,211 -1,729,091 353,431 2.082,522
Motels, motor hotels, and tourist courts ............. 9,995 2,772 156,598 9,283,527 3.957,395 717,931 646,973 201,538 744.949 801,896 33,336 -271,855 339.449 611.305Rooming and boarding houses ......................... 1,618 236 24,844 921,194 96,920 30,040 49,980 5,506 17,863 12,024 335 -36,384 28,456 64,840Sporting and recreational camps ....................... 1,198 10 3,508 147,708 45,731 12,472 -5,877 1.656 6,998 5,048 1,577 -11,858 3,360 15,218Trailering parks and camp sites for transients .... . 3.648 723 .16,667 2,244,839 453,480 185,334 135,393 24.486 99,814 - .30,605 15.164 -39.735 92,928 132.663Organizational hotels and lodging houses, on a
membership basis..: ..................................... 28 23 .1,044 - 136,023 58,040 9,897 14,640 3,071 9,927 16.547 45 -20,881 262 21,143
Personal services ............................................... 33,282 588 79,816 867,678 .2,245,631 446.966 157,697 54,629 47,501 477,145 103.513 214,290 358,422 144,132Coin-operated laundries and dry cleaning ......... :.. 2,964 6.247 166.147 360,188 39,231 43,198 10,710 13,315 51,582 360 32,203 43,323 11,120Other laundry, 6leaning, and garment services ..... 3,976 8,923 61,044 294,771 41,425 13,205 6.344 3,525 79.987 14,823 20,476 23,330 2,854Photographic studios, portrait ..~ ......................... 1,541 3,653 20,573 72,983 17,456 3,626 1,511 1,225 7,603 - 3,154 3,720 566Beauty shops .... :...... : ..................................... 10,200 23,702 85,696 324,151 58,822 21.107 13,723 12,884 85,734 48,396 -5,523 39,265 44,788Barber shops ................................................. 3,528 9.086 * 10,854 306,775 37,413 6,002 3,756 - 139,928 - 31,743 38.082 6.339Shoe repair and hat cleaning shops .................. 485 1,456 - 7,830 2,899 203 287 2,523 - 1,917 1,917 -
Funeral service and crematories ....................... 999 a 2,157 213,684 274,380 88.95 22,135 932 10869 37,653
71650 35,535 42,852 7,318Miscellaneous personal services ....................... 9,589 573 24,592 309,680 604,554 160,766 48.222 8:97 5:683 72,135 32,284 94,785 165,933 71,148
Business services ............................................. 80,189 5,990 451.634 21,454,480 7,278,916 2,245,430 3,495,424 135,198 869,171 1,105.678 213,954 296,751 2,581,576 2.284,825Advertising ................... : ................................ 2,202 138 7,102 839,092 766,168 420,148 1 49,780 6,330 92,341 117,103 28,697 256 74,834 74,578Services to buildings .........: ......... :.................. 3,756 34 8,856 142,437 173.412 91,855 25.658 2,903 3,212 41.048 2,836 50.491 71,897 21,406Computer and data processing services ............. 5,556 133 24,347 1,150,941 522,481 196,582 141.952 6,038 26,546 54,675 10.098 -59.759 89,133 148,892Management and public relations ...................... 8,981 1.430 36,387 1 11668,449 1 1,220,310 104,964 62,438 31,561 39,366 295,493 96.166 266.873
'380.531 113,659
Equipment refital_and leasing ............................ 39,286 3,405 2:7 775 1 13,778,620 1 1, 841093 503542 2'923,568 34,614 534,142 82,219 54,187
155413 Z,~,311.735 1.467,148
Other business services ................................... 1 20,408] 8501 7:068 1 3,874,941 1 2,755:4521 928:338 292,027 53.752 173,564 515,140 21,970 194:305 653,446 459,141
Footnotes at end of table.
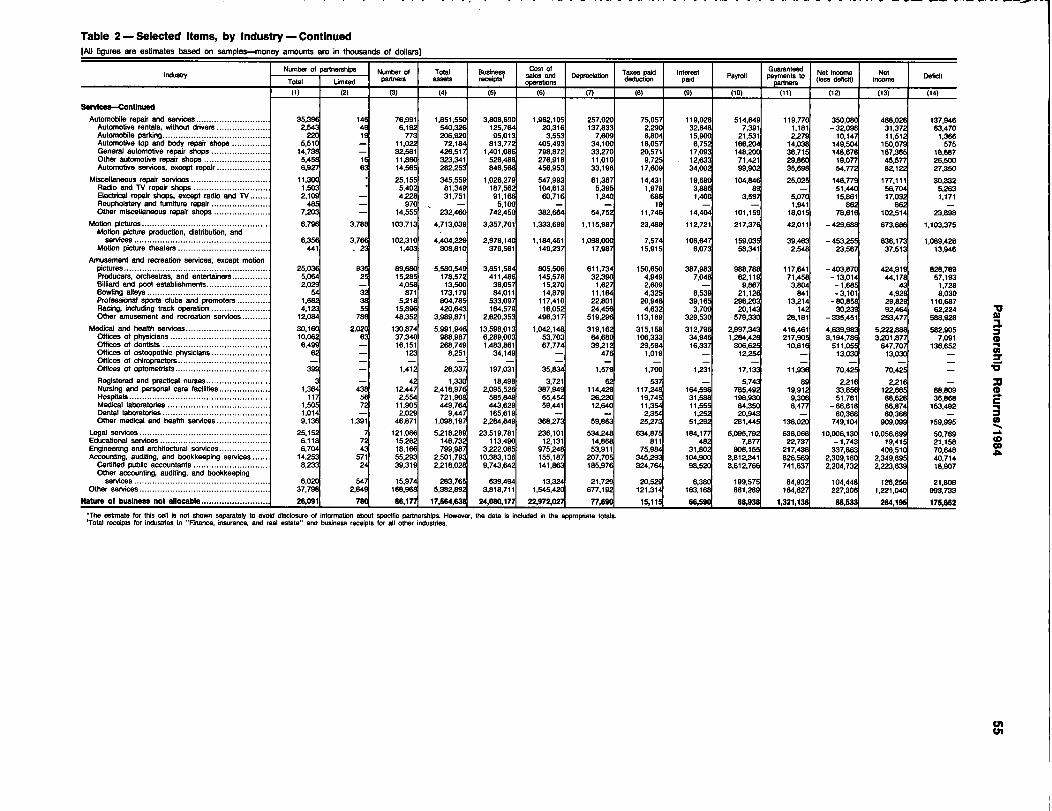
Table 2- Selected Items, by Industry- Continued[All figures are estimates based on samples--4noney amounts are in thousands of dollars]
I d tNumber of partnerships
Number of Total BusinessCost of
Taxes paid InterestGuaranteed
Net inixime Notn us ryTotal Limited Partners assets receipts' sales and
operationsDepreciation deduction paid Payroll payments to
partners(lezzi deficit) inoom Deficit
(2) (3) (4) (6) (7) (8) (9)-
(10) (11) (12) (13) (14)
Serviceso-Continued
Automobile repair and services ............................. 35,396 146 76,991 1,851,550 3,808,690 1,962,105 257,020 75,057 119.028 514,649 119,770 350,080 4WO26 137,946Automotive rentals, withicrut drivers ..................... 2.543 49 6,192 540,326 125,764 20,316 137,833 2,290 32,648 7,391 1,181 -32.098 31.372 63,470Automobile parking .......................................... 220 is 773 206,929 95,013 3,553 7,609 6,804 15,900 21,531 2.279 10,147 11,512 1,366Automotive top and body repair shops ............... 5,510 - 11,022 72,184 813,772 405,493 34,100 18,057 6,752 166,204 14,038 149,504 150.079 575Genera) automotive repair shops ....................... 14.738 - 32,581 426.517 1,401,086 798,872 33,270 20,571 17,093 148,200 36,715 M,678 167,365 18,687Other automotive repair shops ......................... 5,458 16 11,860 323,341 526,488 276,918 11.010 9,725 12,633 71,421 29,860 19,077 45,577 26,500Automotive services, except repair .................... 6,927 63 14,565 282,253 846,566 456,953 33,198 17.609 34,002 99,902 35,698 54,772 82,122 27,350
Miscellaneous repair services .............................. 11,300 25,155 345,559 1,026,279 547,993 61,387 14.431 19,690 104,846 25,025 146,779 177,111 30,332Radio and TV repair shops ............................. 1,503 5,402 81,349 187,562 104,613 5,395 1.979 3,886 89 - 51,440 56,704 5,263Electrical repair shops, except radio and TV ....... 2,109 - 4,228 31,751 91,166 60,716 1,240 686 1,400 3,597 5,070 15,861 17,032 1,171Reupholstary and furniture repair ...................... 485 - 970 - 5,100 - - 19 - - 1,941 862 862 -Other miscellaneous repair shops ..................... 7,203 - 14,555 232,460 742,450 382,664 54,752 11,746 14,404 101,159 18,015 78,616 102.514 23,898
Motion pictures ................................................. 6,796 3,788 103,713 4,713,039 3,357,701 1,333,699 1,115.987 23,489 112,721 217,376 42,011 -429,688 673,686 1,103,375Motion picture production, distribution. and
services .................................................... 6,356 3,766 102,310 4,404,229 2,978,140 1,184,461 1.098,000 7,574 106,647 159,035 39.463 -453,255 636,173 1,089,428Motion picture theaters ................................... 441 23 1,403 308,810 379,561 149,237 17,987 15,915 6,073 58,341 2,548 23,567 37,513 13,946
Amusement and recreation services, except motionpictures ........................................................ 25,036 936 89,680 5,580,549 3,851,584 805,506 611,734 150,650 387,983 988,788 117.641 - 403,870 424,919 828,789Producers, orchestras, and entertainers .............. 5,064 25 15,285 178,572 411,486 145,578 32,390 4,949 7,048 62,119 71,458 -13.014 44,178 57.193Billiard and pool establishments ........................ 2,029 - 4,058 13,600 38,057 15,270 1.627 2,609 - 9,867 3,804 -1,685 43 1,728Sovifing alleys ............................................... 54 32 871 173,179 84,011 14,879 11,164 4,325 8,539 21,126 841 -3,101 4,928 8,030Professional sports clubs and promoters ............. 1,682 38 5,216 804,785 533,097 117,410 22,801 20.946 39.165 296,203 13,214 -80.858 29,829 110,687Racing, including track operation ....................... 4,123 55 15,896 420,643 164,579 16,052 24.456 4.632 3,700 20,143 142 30,239 92,464 62,224Other amusement and recreation services ........... 12,084 786 48,352 3,989,071 2,620,353 496,317 519.296 113,189 329,530 579.330 28,181 -335.451 253,477 588,928
Mod" and health services ................................. 30.160 2.020 130,874 5.991,946 13,598,013 1,042,148 319,162 315,158 312,796 2.997,343 416,461 4,639.983 5,222.888 582,905Offices of physicians ....................................... 10,062 63 37,340 988,987 6.289,003 53,703 64,680 106,333 34,946 1,284,428 217,905 3,194,786 3,201,877 7,091Offices of dentists .......................................... 6,499 - 16,151 268,749 1,483,861 67,774 39,212 29,594 16.337 306,625 10,816 511,055 647,707 136,652Offices of osteopathic physicians ....................... 62 - 123 8,251 34,149 - 476 1,019 - 12,254 - 13,030 13,030 -Offices of chiropractors .................................... - - - - - - - - - - - - - -Offices of optometrists ..................................... 399 - 1,412 26,337 197,031 35,834 1,679 1,700 1,231 17,133 11,936 70,425 70,425 -
Registered and practical nurses ........................ 3 - 42 1,330 18,498 3,721 62 537 - 5,743 89 2,216 2,216 -Nursing and personal care facilities ................... 1,364 438 12,447 2,418,976 2,095.526 387,949 114,429 117,248 164,596 785,492 19,912 33,856 122,665 88.809Hospitals ...................................................... 117 66 2,554 721,908 585,848 65,454 26,220 19,745 31,588 198,930 9,306 51,761 88.628 36.868Medical Laboratories ....................................... 1,505 72 11 905 449.764 443,629 59.441 12,640 11,354 11,555 84,350 8.477 -66,618 86.874 153,492Dental laboratories ......................................... 1,014 - 2:()29 9,447 165.619 - - 2,354 1,252 20,943 - 80,368 80,368 -Other medical arid health services .................... 9,136 1.391 46,871 1,098,197 2,284,849 368,273 59,863 25,273 51,292 281,445 138,020 749.104 909,099 159,995
Legal services .................................................. 25,152 7 121,066 5,218,289 23,519,781 236,101 534,248 634,875 184,177 6,095,792 638,068 10,006.130 10,056.899 50.769Educational services .......................................... 6,118 72 15,282 146,732 113,490 12,131 14,868 Bit 482 7,877 22.737 -1,743 19,415 21,158Engineering and architectural services ................... 6.704 43 18,166 799,987 3,222,065 975.248 53,911 75.984 31,802 906,155 217,438 337,863 408,510 70,648Accounting, auditing, and bookkeeping services ....... 571 55,293 2,501,793 10,383.136 155,187 207,705 345,293 104,900 3,812,341 826,569 2,309.180 2,349,895 40,714
Certified public accountants .............................. 8.233 24 39,319 2,218,026 9,743,642 141,863 185,976 324,764 98,520 3,612,766 741,637 2,204,732 2,223,639 18,907Other accounting, auditing, and bookkeeping
services ..................................................... 6.020 547 15,974 2113,765 639,494 13,324 21,729 20,529 6,380 199,575 84,932 104,448 126,256 21.808Other servic:as ................................................... 37.798 2,849 168,968 5,382.892 3,818.711 1,545,420 677,192 121,314 163,168 881,289 164,627 227,306 1.221,040 993.733
Nature of business not allocable .............:;~
26,091 780 86,17A 17,564,6A 24,080,177 22,972,027 77,690 15,114 66,50 88,9381 1,321,14 88,54 264,119~ 175,662
*The estimate for thiscell
IS not sho" separately to wok! disclosure of information about specific partnerships. Hoirever, the data is included in the appropriate totals.'Total receipts for industries in "Finance, insurance. and real estate" and business receipts for all other industries.