passaic county needs assessment 2020
TRANSCRIPT

1
Passaic County
Needs Assessment 2020
August 31, 2020
Authored by: JANUS Solutions, Consultants to the
Passaic County Department of Human Services
2
NEEDS ASSESSMENT
Table of Contents
PART 1 Executive Summary
Introduction
County Description
Needs Assessment Methodology
PART 2
Key Findings Across All Needs
Key Findings for Each Basic Need Area
• Housing
• Food
• Health Care
• Community Safety
• Employment and Career Services
• Child Care
PART 3
Key Findings for Specialized Service Need Areas
• Services for Families Caring for a Child of a Relative
• Behavioral/Mental Health Services for Children
• Behavioral/Mental Health Services for Adults
• Substance Use Disorder Services
• Domestic Violence
• Parenting Skills Services
• Legal and Advisory Services

PART 1

4
Executive Summary Narrative: In the Words of the County
When the NJ Department of Children and Families requested that Passaic County complete a
Needs Assessment focused on children and their families, County leadership decided to use this
opportunity to review the needs of all of its residents - including seniors and the disabled (which
were not included in the DCF protocols). With the assistance of JANUS Solutions, the Passaic
County Department of Human Services completed this comprehensive needs assessment,
conducted April to August 2020.
By definition, a needs assessment is an opportunity to examine the strengths, gaps and areas in
need of development for a community. While we used multiple methods to gather information
from the very diverse constituencies, from Paterson to West Milford, we intend with this report
to communicate in ways that county government and community stakeholders get perspective
needed to take action to help improve the community. During these months of information
gathering we engaged with more than 2,600 residents and stakeholders, including 15 focus
group gatherings (171 individuals), individual interviewees with key social service providers and
other stakeholders (48), and, most importantly, from the 2450 residents who completed the
needs assessment survey. As this report illustrates, data collected enables the reader to get a
cogent picture of a County with tremendous diversity, a lot of will to make things better, and
numerous challenges on which to focus attention.
While significant challenges exist – lonely seniors, struggling families, debilitating addictions, housing limitations, homelessness, to name a few – recommendations in each of the report’s sections offer means gleaned from the community for addressing them. County stakeholders – governments, business, non-profits, faith communities, health care, and the like – have, within this report, a useful look into life in the county. Stakeholder determination to collaboratively address the county’s needs will result in a legacy of what can be achieved when all work together for the common good.
Following is a summary of Findings and Recommendations:
Positive Strengths: While Passaic County government, service providers, and community
members face significant challenges in achieving good quality of life for all or most residents, a
significant and uncommon powerful positive force emerged during the assessment. That force
is made up of the will expressed by many individual, organizational, and governmental
stakeholders to collaborate in new ways to address community issues. From the Bengali,
Palestinian, and Dominican communities of Paterson, to the suburban communities of West
Milford and Ringwood, to the Latin communities scattered throughout both lower county and
5
upper county, multi-sectoral stakeholders and residents have expressed strong desire to work
together for the betterment of the county.
An additional strength for Passaic County are the rich diversity and community supports that
are available for many of the individuals who make up the cultural-language communities of the
County.
Obstacles faced by many residents: Residents identified many of the obstacles they or
their friends, families, or neighbors face when seeking help for social service need areas. A
summary of the most commonly identified needs are:
* Limited housing, particularly scarce affordable housing results in multi-family settings and often substandard housing; enormous rental burdens diminish the ability to afford other, safer housing.
* Systemic racism (“It’s in the air we breathe”) prevents many from equal access to opportunities and impacts social determinants of health and social and health inequity across all life spans.
* Reducing the complexity in accessing services, including safety net services, * Significant intergenerational poverty that creates a sense of hopelessness with
prolonged exposure to disadvantaged neighborhood environments and reduced child
developmental outcomes. * Systems and resources that do not have significant and consistent service user input
in the design and delivery for optimal use. * Addictions and mental illness and their stigma debilitate many with resources
stretched to capacity. * Many seniors are isolated, living in long term care facilities, and face elevated health
risks from COVID, and may also face discrimination from ageism. * Current national environment threatens the physical and mental health of the undocumented
population. * Nonprofits are challenged by reduced funding, increased needs and sustainability. * Transportation options limit job seekers and those needing services, and impact the
mobility of the community. * Increased isolation from COVID-19 increases struggles, particularly for individuals with a disability
and their families
An often-overlooked aspect of needs within a county concerns the concept of episodes of
need. These are times of heightened need, triggered for residents by a birth/new
dependent, job loss, disability, or health crisis of self/loved one. These episodes are
occurring more frequently during COVID and are well-documented. Data during COVID is
difficult to come by, as it changes frequently, but the responses from some residents tells
an important and sobering story.
Inequity and systemic racism persist in Passaic County and across the country; understanding their

6
dynamics is requiring some deep listening and conversation. The needs assessment began this
process by engaging almost 3,000 residents in discussing their experiences, needs, and aspirations.
Solutions to systemic issues can be forged out of the lived experience of those facing consequences
of these disparities, and we received many comments from residents and stakeholders about the
need for systemic change. Many commented that service needs and delivery must be examined in
the context of racial justice and equality, and others gave examples of how their access to services
is negatively affected by who they are, where they live, or their legal status.
The needs assessment highlighted the fact that the current human service systems are designed to
deal with crises, rather than bend the curve and make investments towards proactive, preventive
solutions. There are no organized systems of care to address needs, both short term and longer
term, while bending the curve and making investments towards proactive, preventive solutions. An
example of this is the need to focus on the management of the homelessness/potential
homelessness as a result of the devastating effect that COVID has had on the economy, while also
trying to address the longer term issue of affordable housing and homelessness in Passaic County.
Improvements in operations at the County DHS were also reviewed, since DHS should be the key
entity with a coordinating responsibility for many established human services planning bodies. It is
critical to improve the functioning and image of DHS, in order to support their role in
implementation of accepted needs assessment recommendations. The interest and commitment of
the larger human service system is needed to support this larger community mobilization effort to
make things better for residents of the county. To accomplish this, there needs to be a
comprehensive approach to establishing better relationships among DHS, service providers, other
human service stakeholders and residents. Representative members of the diverse faith
community and civic organizations should be included as crucial partners in community
mobilization.
Recommendations Related to Systemic Findings:
✓ The County should launch a public-private comprehensive community mobilization, to
implement the accepted recommendations of this report. This would be accomplished by
establishing the Passaic County Collective Impact Council. The Council would leverage the
7
tremendous interest and expressed commitment of the Steering Committee, other key
stakeholders and community residents to map out and implement strategies and systemic
solutions to the priorities and challenges identified by this needs assessment. This will require high
level, visible leadership from County Freeholders and County administration, and partnerships with
municipalities and stakeholders around local human service needs (e.g., prevention, financial
recovery, prisoner reentry, etc.).
✓ The Council will integrate the goal of racial justice as a priority in all planning,
implementation and monitoring activities, including inequities in representation, resource
allocation and service provision.
✓ The Council would over time serve to integrate and coordinate the planning, funding,
implementation and evaluation of all human service related activities, beginning with collective
impact initiatives related to homelessness, the opioid epidemic and financial recovery and
empowerment. The Council will also review and prioritize the many recommendations in this
report for consideration for action.
✓ The Council would review all county investments and related state and federal funding in
human services to assure effectiveness, efficiency, resident satisfaction and consistency with
forward-looking strategies.
✓ The Council will work towards establishing organized systems of services and supports to
address current and future needs of residents utilizing the framework of this assessment as a guide.
This can be done while providing immediate response to crises with a shift towards proactive
prevention and early intervention. Organized systems of services and resources will assure that
residents know how to find what they need, have resident-friendly access and can navigate
connected provider networks based on their needs and aspirations.
✓ The Councill will monitor the implementation of accepted recommendations and provide
transparent reports to the public about progress and continuing challenges based on measurable
benchmarks and outcomes.
✓ Establish a “Collective Impact Cabinet,” internal to County government, to assure
coordination of all county departments in support of Council activities.
8
✓ Explore and encourage partnerships with and among municipalities around local human
service needs (e.g., prevention, homelessness, prisoner reentry, etc.).
✓ With County leadership, develop strategies to maintain/enhance relationships with
municipalities that result in coordinated, effective services and supports for residents.
✓ Continue to improve the functioning and image of the Passaic County DHS, in order to
support its role in implementation of accepted recommendations from the needs assessment.
• Continue to focus on internal operations, especially regarding procurement and contract
management, and relationship with funders.
• Enhance DHS staff skills and reputation for leadership, communication, and problem
solving on human service issues.
Community Mobilization for Collective Impact will require a well-conceived and well-executed
communication strategy informed, trusted and embraced by the membership of the Council and
members of the greater Passaic County community. Ultimately, the Council will demonstrate progress
by targeting and benchmarking concrete improvements in the quality of life for Passaic County
residents through the use of hard facts, or data and growing trust of residents through community voice.

9
Recommendations:
Our recommendations for implementation are based upon a systemic approach to change, including a focus on the coordination of planning, development and tracking for various issues, populations, and communities. Specific recommendations are made in the report to address:
• Homelessness and affordable housing • Unmet service needs, especially “up-county” • The lack of mental health services and interpreters for those who speak languages other
than English • Transportation to higher paying wage jobs, and for seniors and families to services • Residents, particularly immigrant and undocumented persons and seniors, that often do
not know about, or have difficulty accessing, services and resources • The dynamics of intergenerational poverty that reinforce poverty as the status quo for a
small but significant portion of the population. • Both violent crime and juvenile crime in Passaic County • Opioid overdoses • Babies being born with moms receiving no/late prenatal care. • Lack of child care, particularly in this COVID environment • The human services planning system and County Department of Human Services
Please note that much of the formatting of the full report that follows has been proscribed by the NJ Department of Children and Families. Passaic County has added additional information that covers the strengths and needs of residents not emphasized by DCF and utilizing the individual and family success framework to guide the process. That full report can be found on the Passaic County website.

10
Introduction Purpose
The N.J. Department of Children and Families is partnering with human services organizations in each
county to undertake an assessment of local strengths and needs. The goal of this assessment is to
collect the information needed to make sure the right mix of services and activities are available in
every county in New Jersey to support families. The findings from the needs assessment can be used
to support the development of local recommendations to assist with decision making; the
identification of high priority human service needs and barriers to service delivery for New Jersey’s
communities; the coordination and improvement of services to the Departments' target populations;
the planning, funding, coordination and implementation of Department Initiatives.
This statewide approach to county-specific needs assessments aligns with DCF’s existing county based
continuous quality improvement review cycle, in which each county is evaluated every two years. The
findings from the needs assessment will be embedded into the DCF’s existing ChildStat process and
shared with DCF staff and stakeholders during the county’s ChildStat session. ChildStat is a learning,
management, and accountability tool used by DCF to support continuous quality improvement, foster
a shared sense of accountability and promote system-wide problem solving around critical issues
affecting child and family outcomes. A ChildStat session incorporates analysis and interpretation of
administrative data to support planning and dialogue between DCF executive management and
senior leadership and system partners.

11
County Description
Narrative: In the Words of the County
Passaic County in northern New Jersey is home to approximately 504,041 residents. Of that number,
41,961 are under age 6, 39,106 are between 6 and 11 years of age, and 41,837 are between 12 and
17 years of age.
The County celebrates the diversity of its residents, where approximately 29% of the population are
foreign born, and bring with them the traditions and values of their diverse cultures. In Passaic
County, 65% of the population is Caucasian, 41% identifies as Hispanic, 14% are African American, 6%
are Asian, and 17% are classified as "other" (including Arabic). Besides English, many residents
throughout the County speak Spanish, Arabic, Bengali and Syleti. Unfortunately, 10.4% of the
population are "linguistically isolated", meaning that their inability to communicate in English effects
their quality of life.
There are 16 municipalities in the County, and a generally acknowledged division of the county to
categorize those areas outside of the Paterson/Passaic/Clifton area as "up-county." While many in
the County are thriving, other residents struggle with trying to manage on median incomes ($66,476)
that are well below the New Jersey average ($79,363). The estimated cost of living for Passaic County
is $97,512, the 9th highest in the state. Incomes in the county range from a median income of
$116,198 in Ringwood, to $34,920 in Paterson. Poverty in the county affects the very young (34,408
kids under 4 live in poverty), the older residents (26% of the senior population in Paterson live in
poverty), and individuals and families across the county.
In Passaic County, on average 26% of a family's income is spent on housing - this is the highest
percentage in the state. Food insecurity is estimated to affect at least 9.85% of the population.
Passaic County has the second highest teen birth rate in New Jersey - 11.1 per 1,000 teens, and too
many babies born after little or no prenatal care. The County also experiences high levels of violent
crime and juvenile crime, both the 5th highest in the state. Like many other counties in New Jersey,
Passaic also has seen an increase in opioid overdoses.
Additionally, the effects of COVID 19 have been severe on the county, as one of the "hot spots" in the
state with higher positive results and individuals dying. Incomes, food security, and housing stability
have all been severely impacted for many Passaic County residents. Passaic County (as of August of
2020) had 1,094 total deaths and 17,665 total confirmed cases. According to the NJ COVID
dashboard, Passaic County had the fifth highest impact in positive COVID-19 cases.

12
Needs Assessment Methodology
Quantitative and qualitative data from various sources and stakeholders related to housing, food, health care, community safety, employment and career services, child care, services for families caring for a child of a relative, behavioral/mental health services for children, behavioral/mental health services for adults, substance use disorder services, domestic violence services, parenting skills services and legal and advocacy services were collected to inform this needs assessment.
County Data Profile
DCF provided a county data profile to the county Human Service Advisory Council (HSAC) to support
the HSAC in identifying key topics to be explored in more depth. The data profile consists of the most
recently available administrative data related to demographic population and selected indicators of
poverty, housing, food security, childcare, health care, transportation, employment, community safety,
mental health and substance use. The sources for the data included in the profile include a combination
of federal databases. The primary purpose of the county data profiles is to support the HSAC needs
assessment team in identifying key areas to prioritize during the focus group data collection efforts.

13
Approach for Prioritizing Needs
In addition to the data provided by DCF, JANUS Solutions also presented data to the Steering Committee, some specific to municipalities, in the areas of demographics and other indicators for additional populations within the county, such as seniors and the disabled. JANUS used the Family Success Framework (described below) to structure the data gathering, discussion and development of recommendations. The premise of the individual and family success framework is that comprehensive, holistic investments in organized local systems of family and individual support and community improvement will, over time, produce dramatically better results for children, youth, individuals and families and thus improve quality of life for residents. This approach acknowledges that developmentally appropriate resources and services are required to successfully support people’s developmental journeys through life.
The developmental stages of life represent the journey, and its goals are:
* Early Childhood Success (0-8 years old) - All young children will be safe, healthy, and ready to learn.
* Positive Youth Development (9-15 years old) - All school-age children and youth will be living in
a permanent home, achieving in school, and connected to their families and communities.
* Strong Transitions to Adulthood (16-26 years old) - Youth transitioning to adulthood will be
on positive pathways to economic and social independence with strong and responsible
family and community ties.
* Productive Adulthood (27- 62) - adults will achieve their greatest potential for economic and
social independence as responsible and contributing community members.
* Successful Aging (63 and over)- aging adults will maintain their greatest level of
independence, functioning, and dignity as valued members of their families and communities.
The family success framework was developed by JANUS Solutions and adopted by the New Jersey-
based Family Success Institute. The developmental model, “Journeys of Family Success”, provides a
unifying vision for stakeholders’ goals around child development and individual and family support in
their community across four life areas, or pillars:
1. Family and Community Connections 2. Safety and Financial Security 3. Health and Well Being 4. Learning and Education
As material is presented throughout this report, we will refer to these pillars of support that
individuals and families need to be successful. They differ slightly from the structure that DCF has
requested be followed for this report: breaking down needs, findings and recommendations into the
categories of "basic needs" and "service needs." A separate summary report, that includes
attachments, has also been prepared for Passaic County by JANUS Solutions and is posted on the
14
Passaic County website.
The process began with the formation of a Needs Assessment Steering Committee, which met a total
of 4 times, and served as ambassadors for the entire process - not only guiding it and providing input,
but also in engaging the community to participate in focus groups and complete the survey that was
developed. The group considered data and feedback from professionals, but were primarily guided by
the significant responses of residents throughout the county. The county made special efforts to
outreach the community by producing the survey in 4 languages - English, Spanish, Arabic, and
Bengali - and by outreaching community organizations and faith-based leaders to engage their
constituents in providing feedback about their needs and experiences. After a review of data,
discussion with the various planning bodies in the county, and deliberation by the Steering
Committee, several areas were chosen upon which to focus our outreach and information gathering
efforts.
Based upon the information provided by DCF/Rutgers, that compiled by JANUS Solutions, and
discussion of the Steering Committee, the four need areas selected by the county to be the focus
areas and primary topics in the qualitative data (e.g. focus groups and key informant interviews)
collection included:
1. Housing and Poverty
2. Substance Use Disorder and Prevention Services (Adults and Adolescents) 3. Crime/Community Safety 4. Isolation
Please note: These areas/categories differ from those potential areas identified in the DCF format of
Basic and Service Need priorities. For the discussion of needs and recommendations in this report,
the DCF format will be followed, and the additional basic need of food was identified as a PRIORITY.
15
Focus Groups
In an effort to implement a uniform needs assessment approach across counties to support statewide trend analysis, DCF required HSACs to conduct a series of focus groups. The purpose of the focus groups was to collect qualitative information to better understand the scope, nature and local context related to addressing community needs that influence families.
Focus groups sessions were scheduled for approximately one and a half hours with the first thirty minutes being designated for introductions and survey completion and the remaining hour being designated for the focus group dialogue. In each focus group session, participants were asked to complete a standard survey to gather data about the key topic areas outlined in the aforementioned data profiles. The survey was developed to identify areas of strength and areas in need of improvement related to county-based supports and service array. The survey consists of demographic data and approximately 10 questions related to each of the eleven basic and service needs. Six of the questions are based on a five-point Likert scale ranging from Strongly Disagree to Strongly Agree. Upon completion of the surveys, the focus group participants were asked to transition into the dialogue
component of the session. The dialogue requirement was intended to allow participants to highlight
their experiences and perceptions as community members and provide opportunity for a deeper
discussion and assessment of top barriers in each area of need. Group members discussed two selected
basic and service need priority areas. Facilitators use a structured protocol to explain the purpose,
goals, confidentiality and informed consent and objectives of the focus group.
Recruitment.
The Steering Committee was extremely helpful in helping to identify organizations, formal and
informal, that could be outreached for participation in the surveys and focus groups. Unfortunately,
because of the existing COVID pandemic, focus groups were extremely difficult to convene. Focus
groups were primarily facilitated by JANUS Solutions team members via Zoom, with some additional
support from Steering Committee members. Focus groups were facilitated in English, Spanish and
Bengali.
Focus Group Participants. A total of 15 focus groups were conducted in the county as part of this needs assessment. These focus groups were conducted from May 18, 2020 to July 16, 2020. There was a total number of 171 participants. The number of participants in each focus group ranged from a minimum of 8 and a maximum of 18 participants. During the focus group sessions, a total of 171 surveys were completed.

16
Key Informant Interviews. Key informant interviews were conducted with 48 individuals to gather additional feedback from agency directors and other identified stakeholders selected by the HSACs regarding considerations for addressing the needs and concerns that were highlighted in the data profiles and focus group sessions. Facilitators used a structured protocol to explain the purpose, goals and objectives of the focus group. Recruitment. Recruitment of participants for Stakeholder interviews was broad, and interviewing served as a basis
of relationship building/enhancement between the Passaic County DHS and the community, a
suspected issue which was confirmed by the interviews. Interviews were also used to begin the
process of designing solutions to identified issues by engaging stakeholders in agreeing to work
collectively to resolve issues identified. Many different sectors were represented for Stakeholder
interviews including elected government officials.

17
Key Informant Interview Participants. A total of 48 interviews were conducted in this county as part of this needs assessment. The total number of participants included was 48. These interviews were conducted from April 20, 2020 to July 31, 2020. There was a total of 48 surveys completed during the interview sessions. Participant Demographics
As described in the above sections, both focus group and interview participants completed the needs
assessment survey. Below we combine information for all participants to provide an overview of the
participant demographics.
Role in the Community (not mutually exclusive)
Number of Participants
County Resident 2300
Staff or Volunteer with a Community-Based Organization (e.g., Health and Human Services providers, Planning Board Participants)
15
Staff or Volunteer with a Public Service Organization (e.g., paramedics, fire fighter, police officers, air force, judges)
0
Local Business Owner in the County 70
Community leader and advocate in the county (e.g., hold a volunteer office, clergy, activist)
103
Other 0
Age
Number of Participants
Under 18 73 18-24 91 25-34 213 35-44 912 45-54 830 55-64 176 65 and over 45
Gender
Number of Participants
Female 1948 Male 362 Non-binary, third gender/transgender 6
Prefer Not to Say 18
Other 1

18
Race
Number of Participants
American Indian or Alaska Native 17 Asian 178 Black or African-American 235 Native Hawaiian or Other Pacific Islander 0 White or Caucasian 881 Multi-Race (2 or More of the Previous) 112 Other 949
Ethnicity
Number of Participants
Hispanic, Latino or Spanish Origins 1228
No Hispanic Latino or Spanish Origins 1092
Education Level
Number of Participants
Grades Preschool-8 0
Grades 9-12-Non-Graduate 75 High School Graduate or GED 334
High School/GED and Some College/Trade 764 2 or 4-Year College/Trade School Graduate (Bachelor’s Degree or Higher) 1099 Graduate or Other Post-Secondary School See Above
Employment Status
Number of Participants
Employed: Full-Time 1214 Employed: Part-Time 291 Unemployed-Looking for Work 425 Unemployed-Not Looking for Work 0
Retired 45 Student 0 Self Employed 127 Unable to Work 101
Services Accessed by a Household Member within the last 2 Years
Number of Participants
Yes 486 No 1749
19
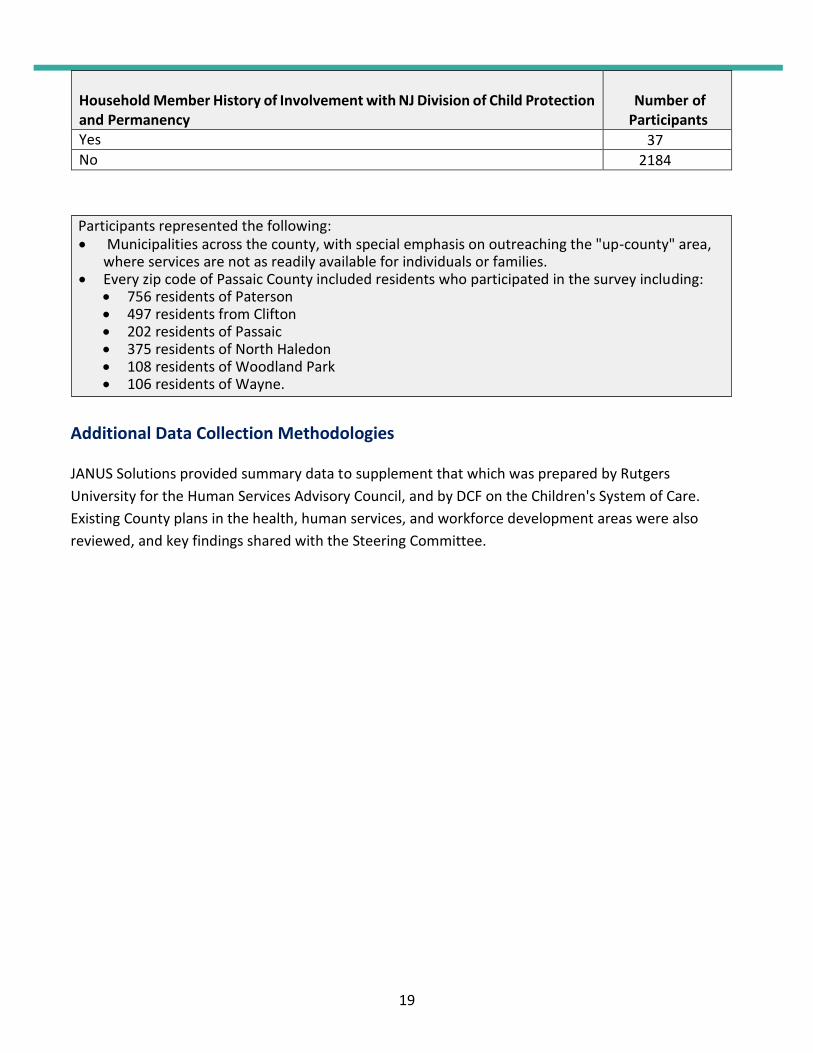
Household Member History of Involvement with NJ Division of Child Protection and Permanency
Number of Participants
Yes 37 No 2184
Additional Data Collection Methodologies
JANUS Solutions provided summary data to supplement that which was prepared by Rutgers
University for the Human Services Advisory Council, and by DCF on the Children's System of Care.
Existing County plans in the health, human services, and workforce development areas were also
reviewed, and key findings shared with the Steering Committee.
Participants represented the following: • Municipalities across the county, with special emphasis on outreaching the "up-county" area,
where services are not as readily available for individuals or families. • Every zip code of Passaic County included residents who participated in the survey including:
• 756 residents of Paterson • 497 residents from Clifton • 202 residents of Passaic • 375 residents of North Haledon • 108 residents of Woodland Park • 106 residents of Wayne.

PART 2

18
Key Findings Across Needs

19
20
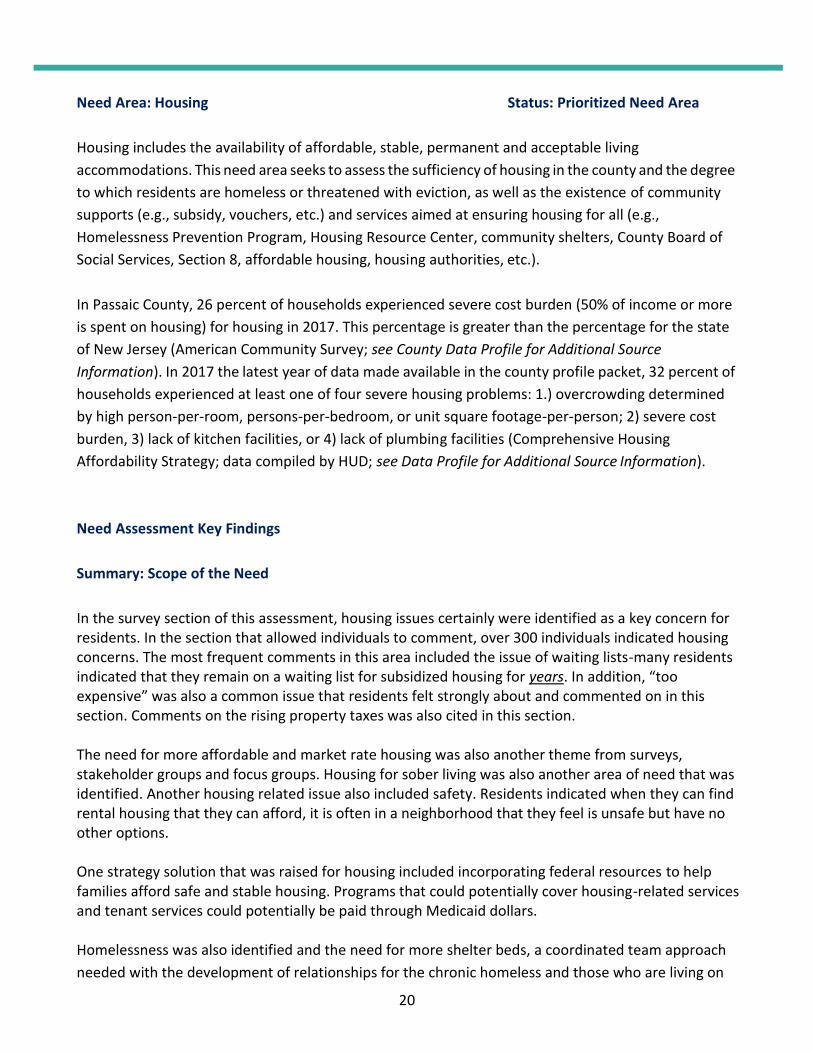
Need Area: Housing Status: Prioritized Need Area
Housing includes the availability of affordable, stable, permanent and acceptable living
accommodations. This need area seeks to assess the sufficiency of housing in the county and the degree
to which residents are homeless or threatened with eviction, as well as the existence of community
supports (e.g., subsidy, vouchers, etc.) and services aimed at ensuring housing for all (e.g.,
Homelessness Prevention Program, Housing Resource Center, community shelters, County Board of
Social Services, Section 8, affordable housing, housing authorities, etc.).
In Passaic County, 26 percent of households experienced severe cost burden (50% of income or more
is spent on housing) for housing in 2017. This percentage is greater than the percentage for the state
of New Jersey (American Community Survey; see County Data Profile for Additional Source
Information). In 2017 the latest year of data made available in the county profile packet, 32 percent of
households experienced at least one of four severe housing problems: 1.) overcrowding determined
by high person-per-room, persons-per-bedroom, or unit square footage-per-person; 2) severe cost
burden, 3) lack of kitchen facilities, or 4) lack of plumbing facilities (Comprehensive Housing
Affordability Strategy; data compiled by HUD; see Data Profile for Additional Source Information).
Need Assessment Key Findings
Summary: Scope of the Need
In the survey section of this assessment, housing issues certainly were identified as a key concern for residents. In the section that allowed individuals to comment, over 300 individuals indicated housing concerns. The most frequent comments in this area included the issue of waiting lists-many residents indicated that they remain on a waiting list for subsidized housing for years. In addition, “too expensive” was also a common issue that residents felt strongly about and commented on in this section. Comments on the rising property taxes was also cited in this section. The need for more affordable and market rate housing was also another theme from surveys, stakeholder groups and focus groups. Housing for sober living was also another area of need that was identified. Another housing related issue also included safety. Residents indicated when they can find rental housing that they can afford, it is often in a neighborhood that they feel is unsafe but have no other options. One strategy solution that was raised for housing included incorporating federal resources to help families afford safe and stable housing. Programs that could potentially cover housing-related services and tenant services could potentially be paid through Medicaid dollars. Homelessness was also identified and the need for more shelter beds, a coordinated team approach
needed with the development of relationships for the chronic homeless and those who are living on

21
the street with service providers so that trust can be developed and maintained.
Summary: Nature of the Need
A number of study participants shared emotional accounts that challenge typical notions of who
experiences need for social services and in fact, the COVID-19 situation also impacted many
individuals who suddenly lost income without any time to prepare and were concerned about
most basic needs including their housing stability. One interviewee revealed that she recently
earned over $100,000, another was a recent top student in the graduating class and still
another demonstrates leadership at child’s school as President of the Parent-Teacher
Organization. The message that they wanted people to understand is that they would not want
others to know of their struggles, but also that others in the community would never think that
they are “the ones” who need assistance. This inability to suspend judgement of people in
poverty does prevent some from accessing services or living in “designated” low income
housing. In the words of someone who recently had to access services, “We are not ‘those
people.’ We are neighbors and friends and family and coworkers.”
Interview participants describe triggers for unanticipated periods of heightened poverty and rather
than chronic need or experience of generational poverty, situation poverty often includes feelings
of deep shame. Also, in several focus groups individuals commented on the lack of professionalism
and courtesy provided when accessing government services, “County is one of the scariest places
to go to obtain assistance because the employees aren’t friendly or kind. They actually take hope
away from people looking for services.”
Individuals who experience situational poverty may need services, especially basic need services, for
several months, or in some cases, particularly with medical reasons, this may be as long as several
years. One participant discusses the impact of an unexpected family medical need: “My son, who is
now 12, had three brain surgeries 4 years ago:” I lost my job [caring for him]. At the time we were
making $150,000 . . . I had plenty of savings, but now we went through all that and here I am needing
help.” The primary triggers named by participants as leading to episodes of heightened need include a
birth/new dependent, disability, job loss, and health crisis of self/loved one.
The issue of poverty is difficult to separate from the housing/homelessness issues raised by many as the top need in the County. While the DCF format does not support identifying poverty as a separate issue, in the full needs assessment report to the County, it is identified as a separate need. Unfortunately, poverty has increased as a result of the COVID pandemic, and coordinated strategies to address this have been recommended.

22
Need Area: Survey Resultsi
Item-Housing Total Number of
Respondents
Strongly Disagree
Disagree Agree Strongly Agree
Don’t Know
Total
1. There are enough services available in the county to help those who have this need.
1147 31.2% 31% 18.7% 18.0% 1.1% 100%
2. Anyone in the county is able to access services.
1147 36.0% 35.2% 16.8% 10.2% 1.8% 100%
3. Services are widely advertised and known by the county.
1147 34.8% 34% 10% 10.2% 10% 100%
4. Services take race, age, gender, ethnicity and more into account.
1147 35% 35.6% 14.7% 14.6% 6.4% 100%
5. Facilities that provide service to meet this need are of good quality (e.g., clean, well supplied).
1147 30.6% 36.6% 16.6% 10.7% 5.5% 100%
6. Staff are well-trained, knowledgeable and provide good customer service.
1147 36.5% 26.5% 20.0% 7.2% 9.8% 100%
Key Barriers
Barrier Total Number of Respondents
Number of Times Identified
Percentage of Responses
Wait Lists 1221 581 47.58% Services do not exist 1221 285 18.43%
Transportation 1221 203 16.63%
Cannot contact the service provider 1221 191 15.64%
Too expensive 1221 451 36.94%
Lack of awareness of service 1221 404 33.09%
Cultural Barriers 1221 188 15.40%
Services provided are one-size fits all, and don’t meet individual needs
1221 145 11.88%
Stigma Leads to Avoidance 1221 183 14.99%
Eligibility Requirement (explain below) 1221 531 43.49%
Other (explain below)

23
Need Area: Food Status: Prioritized Need Area
Food security is the availability and ability to acquire nutritionally adequate and safe foods. This area of need seeks to assess the level to which residents throughout the county have adequate food and the existence of community services and supports to address unmet food needs (e.g., food banks, soup kitchen, local pantry, community-based organization, Supplemental Nutrition Assistance Program (SNAP), food stamps, Women, Infants, Children (WIC) Supplemental Nutrition Program, etc.).
In Passaic County, the food insecurity rate for households was approximately 9.8 percent in 2018, the most recent date of available data (U.S. Census Bureau Current Population Survey and U.S. Department of Agriculture Economic Research Service; see County Data Profile for Additional Source Information). This percentage is greater than the percentage rate for New Jersey.
Need Assessment Key Findings
Summary: Scope of the Need
As a result of the COVID pandemic, more individuals and families in Passaic County are
experiencing food insecurity. Food insecurity, even pre-COVID, was estimated to effect 16.2% of
all children, and 9.8% of all adults in the county. In 2017, 43,065 children had their food needs
partially met in school by participating in the free/reduced lunch programs across the county. .
Food insecurity is also a result of poverty, which has been identified as a major barrier to
individual and family success for many residents.
While many in the County are thriving, other residents struggle with trying to manage on median
incomes ($66,476) that are well below the New Jersey average ($79,363). The estimated cost of living
for Passaic County is $97,512, the 9th highest in the state. Incomes in the county range from a median
income of $116,198 in Ringwood, to $34,920 in Paterson. Poverty in the county effects the very young
(34,408 kids under 4 live in poverty), the older residents (26% of the senior population in Paterson live
in poverty), and individuals and families across the county. While the statewide average of children
living in poverty is 12%, in Passaic County that number is 25.8%; in Paterson it is 36.6%; in Prospect
Park it is 24.2%; and, in Haledon it is 14.5%.
Quotes from participant to demonstrate need related to food insecurity:
“I'm autistic and people with intellectual disabilities are twice as likely to be obese. I don't know if they
don't have access to, or if they don't know about, the food shelf or healthy foods.”
“I don’t want people to think I can’t provide for my kids and I’m just looking for a handout. I work my butt

24
off, but I still do need help, I’m a single mom. I am wise with my money, I go to work every day, and work a
lot. The last thing I want to do is look for a handout, I don’t want people to think that’s what I’m doing. If it
comes down to breaking the bank or asking for help before I’m judged, I’ll break the bank.”
“I guarantee, if somebody needs food assistance, they probably need some assistance with other areas
beyond that.”
Summary: Nature of the Need
Since food is a basic need, it is important to know that when ranked in the survey, it was
determined to be a top need and almost half of the individuals indicated food was their second
priority after housing and for 15% of individuals food was more critical than housing. We learned
that accessing food pantries can have many barriers and access to nutritional food was even
more concerning. Individuals requiring specific food for dietary needs commented on the
difficulties to have nutritional food that met their dietary requirements, such as gluten free, low
sodium. One focus group also indicated that the WIC staff had the second worst customer service
and this was stated as a barrier to service. Convenient hours for food pantries, convenient
locations, and increased selection were all top areas that could be improved.
It should be noted that almost all of the County funds planned for by the Human Services
Advisory Council go to address food insecurity in the county.

25
Need Area: Survey Results
Item Total Number of
Respondents
Strongly Disagree
Disagree Agree Strongly Agree
Don’t Know
Total
1. There are enough services available in the county to help those who have this need.
1066 28.2% 30.0% 20.4% 16.4% 5.0% 100%
2. Anyone in the county is able to access services.
1066 40.0% 41.6% 5.1% 6.0% 7.3% 100%
3. Services are widely advertised and known by the county.
1066 40.4% 38.2% 9.4% 10.0% 2.0% 100%
4. Services take race, age, gender, ethnicity and more into account.
1066 30.8% 35% 10.2% 10.2% 8.0% 100%
5. Facilities that provide service to meet this need are of good quality (e.g., clean, well supplied).
1066 30.5% 39.5% 10.9% 14.9% 4.2% 100%
6. Staff are well-trained, knowledgeable and provide good customer service.
1066 20.5% 49.7% 11.00% 10.5% 8.3% 100%
Key Barriers
Barrier Total Number of Respondents
Number of Times Identified
Percentage of Responses
Wait Lists 1024 230
21.78%
Services do not exist 1024 118
11.17%
Transportation 1024 205
19.41%
Cannot contact the service provider 1024 126
11.93%
Too expensive 1024 263
24.91%
Lack of awareness of service 1024 350
33.14%
Cultural Barriers 1024 152
14.39%
Services provided are one-size fits all, and don’t meet individual needs
1024 142
13.45%
Stigma Leads to Avoidance 1024 175
16.57%
Eligibility Requirement (explain below) 1024 409 38.73%
Other (explain below)

26
Need Area: Health Care Status: General Need Area
Health care service providers deliver medical care, including health promotion, disease prevention and
diagnosis and treatment services, to children and adults. This need area seeks to determine the level of residents in the county with health care needs, the availability of insurance coverage, and the existence of community services and supports that address health and wellness (e.g., doctors and clinics, hospitals, Medicaid Services, Home Visiting Programs, Family Success Centers, etc.).
In Passaic County, the estimated proportion of children under 18 years old (minors) with no health
insurance coverage was 5.4 percent in 2018. This percentage is greater than the estimated percentage
of minors with no health insurance for New Jersey in the same year (ACS; see Data Profile for Additional
Source Information).
In Passaic County in 2018, there were 525 reports of lack of or no prenatal care. This was an increase
of 69 reports from the previous year (Center for Disease Control and Prevention; see Data Profile for
Additional Source Information).
Need Assessment Key Findings
The costs associated with health care were identified as a concern for residents, this included medical care and prescriptions. Also, dental care expansion for adults was also identified as an area of need. Health Care was also the third highest ranking need. In the survey data, healthcare concerns ranked third as the highest priority, 18% of individuals listed healthcare as their second highest concern and 44% of survey respondents listed this as their third highest priority. In addition, comments on Health Care also included a lack of medical professionals who accept Medicaid and concerns of health equity in accessing medical services and services with very limited languages.
Summary: Scope of the Need
The scope of need is expansive, including access to healthcare, affordable healthcare, and culturally competent healthcare. Summary: Nature of the Need
Health Care and healthy communities require positive community resources, support and
engagement. Health care is not a sole influencer of health, but rather, it is strongly influenced by
access to living wage employment, access to quality education, stable, safe and affordable housing,
access to food, healthy environments and air quality, access to transportation and a host of quality of
life issues.
In 2018, babies 525 babies were born in Passaic County after their moms received no/late prenatal

27
care. his number rose from 476 two years earlier. However, the trend for children having health care
coverage is increasing, with only 5.4% of children in the county without coverage. Adults do not fare
as well, however, with 17.8% of adults up to age 64 having no health coverage, even prior to COVID
causing individuals to lose their jobs and accompanying health coverage.
Access to specialists, especially psychiatrists or providers those speaking languages other than
English, is also a need.
The issue of stigma for individuals experiencing mental health and/or addiction issues was raised
repeatedly, and Passaic County DHS has made significant progress in working with the communities
in addressing this issue.

28
Summary: Local Considerations for Addressing the Need for County Prioritized Need Area
Access to more and earlier pre-natal care is needed for women in Passaic County. This includes outreach, engagement in services, and ongoing support. Community health workers (CHW) are needed, particularly for undocumented immigrants and those from cultural/language communities that are underserved. Individuals such as this are at particular risk of isolation, as are many older residents in the county, particularly during the COVID pandemic.
29
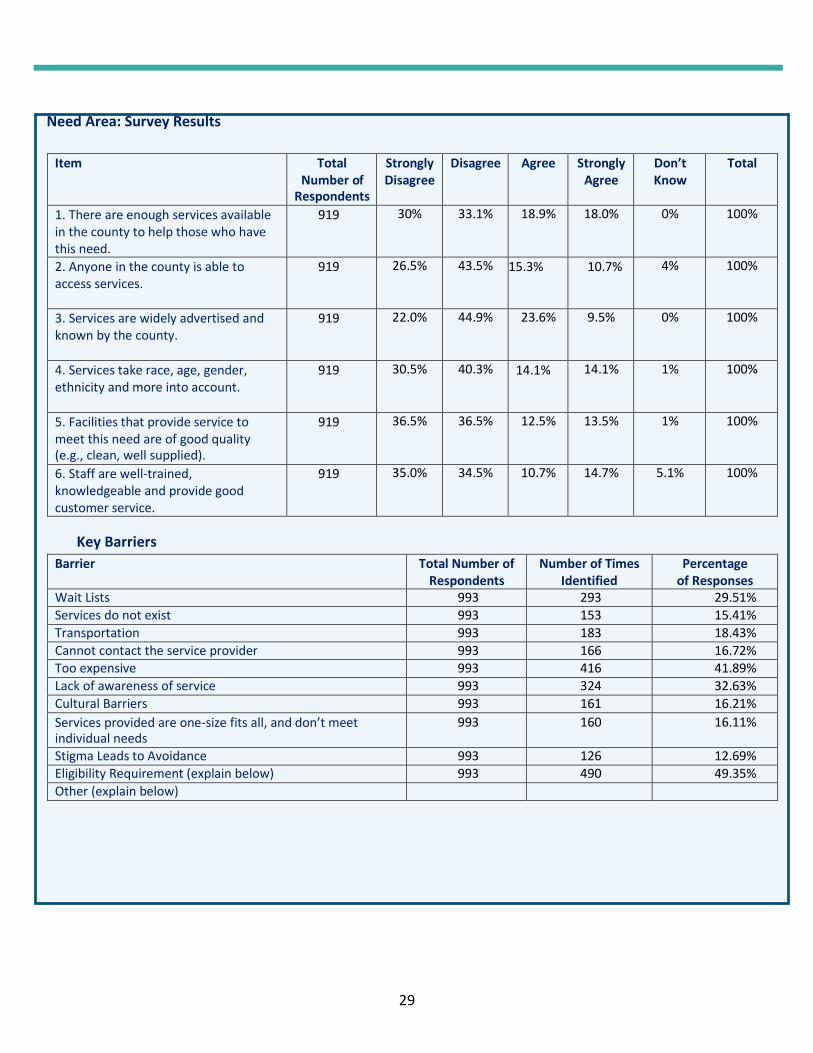
Need Area: Survey Results
Item Total
Number of Respondents
Strongly Disagree
Disagree Agree Strongly Agree
Don’t Know
Total
1. There are enough services available in the county to help those who have this need.
919 30% 33.1% 18.9% 18.0% 0% 100%
2. Anyone in the county is able to access services.
919 26.5% 43.5% 15.3% 10.7% 4% 100%
3. Services are widely advertised and known by the county.
919 22.0% 44.9% 23.6% 9.5% 0% 100%
4. Services take race, age, gender, ethnicity and more into account.
919 30.5% 40.3% 14.1% 14.1% 1% 100%
5. Facilities that provide service to meet this need are of good quality (e.g., clean, well supplied).
919 36.5% 36.5% 12.5% 13.5% 1% 100%
6. Staff are well-trained, knowledgeable and provide good customer service.
919 35.0% 34.5% 10.7% 14.7% 5.1% 100%
Key Barriers
Barrier Total Number of Respondents
Number of Times Identified
Percentage of Responses
Wait Lists 993 293 29.51%
Services do not exist 993 153 15.41%
Transportation 993 183 18.43%
Cannot contact the service provider 993 166 16.72% Too expensive 993 416 41.89%
Lack of awareness of service 993 324 32.63%
Cultural Barriers 993 161 16.21%
Services provided are one-size fits all, and don’t meet individual needs
993 160 16.11%
Stigma Leads to Avoidance 993 126 12.69%
Eligibility Requirement (explain below) 993 490 49.35%
Other (explain below)

30
Need Area: Crime/ Community Safety Status: Prioritized Need Area
Community safety is the ability to be and feel safe from crime or violence in one’s community and
public spaces. This need area seeks to assess the level to which residents throughout the county are
safe from crime or violence and the existence of community services and supports to assist residents
with being and feeling safe in their community (e.g., local police, DCF’s Child Protection and
Permanency, Family Success Centers, security companies, neighborhood watch, safe havens, hospitals,
etc.)
In Passaic County there was a total of 1,881 violent crimes in 2018 and the violent crime rate per 1,000
was 3.7 percent (NJ Department of Law and Public Safety, Division of NJ State Police, Uniform Crime
Reports, Updated 8/15/19; see Data Profile for Additional Source Information). Of the non-violent
crimes committed there was a total of 18 arson, 1077 motor vehicle theft, 5718 larceny and 1690
burglary in Passaic County (NJ Department of Law and Public Safety, Division of NJ State Police, Uniform
Crime Report, Updated 8/15/19; see Data Profile for Additional Source Information).
Need Assessment Key Findings
Summary: Nature of the Need In answering questions regarding community safety only 33% indicated that they felt the community
was safe and there were adequate resources. Many individuals have stated that the streets are not
safe and they frequently witness illegal drug transactions. Comments also indicated that residents want
the police departments to be more visible and to be representative of the people in the community.
More accessible “sub-stations” that are in the community where law enforcement would be more
accessible was an area identified as a possible strategy for improving neighborhood safety. Another
area that was also identified to improve community safety involved more prevention programs to deter
youth from juvenile justice system through additional Station House Adjustment programs. Juvenile
Detention Alternative Initiatives have had an impact on reducing system involvement and more
interventions are needed.
“There needs to be more prevention interventions. Often families call asking for help, but help
is only available once the youth is legally involved or DCP&P. There needs to be more
mentoring accessible without system (DCP&P, legal, or CMO) involvement. We need to fund
and empower community workers/ messengers who can come alongside those engaged in
gang and drug activities.”
A frequent comment was also, “Too many guns, too much violence, too many gangs.”
Community safety concerns were also more prevalent in certain zip codes by survey respondents.
Passaic, Paterson and Clifton while had more responses in general, also had more concerns around
community safety. Many indicated that they were victims of a crime or they live in a neighborhood that

31
they feel is unsafe and has too much violence. Gangs were also commented on and gang violence was
cited as another community safety concern.
Summary: Local Considerations for Addressing the Need for County Prioritized Need Area
✓ Communities should be encouraged to complete neighborhood assessments on safety and
crime issues and develop new solutions for crime mapping.
✓ “Neighborhood Watch” and other police-community partnerships to address crime should be
explored across the county and should be encouraged and supported by the county and its
municipalities.
✓ Volunteer supports for these and other activities aimed at increasing community safety should
be developed and supported.
✓ Continue to examine and take steps to address racial justice and minority overrepresentation
in the juvenile justice system, and to use trauma-informed practices to serve youth.
✓ Continue to develop the Prisoner Reentry program through existing and new partnerships.

32
Need Area: Survey Results
Item Total
Number of Respondents
Strongly Disagree
Disagree Agree Strongly Agree
Don’t Know
Total
1. There are enough services available in the county to help those who have this need.
812 30.0% 33.0% 23.1% 10.9% 3% 100%
2. Anyone in the county is able to access services.
812 38.0% 38.4% 12.5% 11.7% 0% 100%
3. Services are widely advertised and known by the county.
812 41.35% 37.35% 11.3% 12.5% 1.5% 100%
4. Services take race, age, gender, ethnicity and more into account.
812 34.5% 37.4% 13.9% 13.0% 1.2% 100%
5. Facilities that provide service to meet this need are of good quality (e.g., clean, well supplied).
812 35.0% 35.0% 13.5% 13.5% 3.0% 100%
6. Staff are well-trained, knowledgeable and provide good customer service.
812 38.8 39.0% 10.0% 12.2% 0% 100%
Key Barriers
Barrier Total Number of Respondents
Number of Times Identified
Percentage of Responses
Wait Lists 884 154 18.16%
Services do not exist 884 201 23.70%
Transportation 884 116 13.68%
Cannot contact the service provider 884 129 15.21%
Too expensive 884 121 14.27%
Lack of awareness of service 884 393 46.34%
Cultural Barriers 884 211 24.88%
Services provided are one-size fits all, and don’t meet individual needs
884 160 18.87%
Stigma Leads to Avoidance 884 147 17.33%
Eligibility Requirement (explain below) 884 204 24.06%
Other (explain below)

33
Need Area: Employment and Career Services Status: General Need Area
Employment is the condition of having paid work or an alternate ability to earn a living. This need area seeks to determine the employment status (e.g., full or part-time, permanent or temporary) of county residents and the employment opportunities within a county, as well as the existence of community services and supports to assist in ensuring employment (e.g., unemployment services, career development, County One-Stop Centers, Family Success Centers, County Board of Social Services, etc.)
Summary: Nature of the Need
In this section of the report, we will highlight issues related to access to services, both to secure
employment and to access needed supports. People need better transportation to work, school and
play.
“75% of the resources I wasn't even aware of. I may have heard about them but to have them all in
one place, especially for people who aren't internet savvy, on a very basic and easy to read and
understand level. We need that in this community.”
“Ideally we would have a one-stop shop. The community is not set up to serve people efficiently. It
is all so frustrating for people in need. They just give up.”
“There is so much red tape behind everything. It is hard to navigate.”
“We make things almost too college level, which doesn’t work for people in crisis.”
Summary: Local Considerations for Addressing the Need for County Prioritized Need Area
✓ Ensure that supports and benefits are made available to residents who are eligible. This
includes educating the community on the availability of the One Stop Career Center, SNAP, Work First
NJ, Medicaid, and Family Care (including Children’s Health Insurance Program/CHIP), EITC, Child Care Tax
Credits, etc.
✓ Increase the accessibility of online applications for these services at locations across the county,
especially in Family Success Centers, other CBOs, libraries, etc.
✓ Support the development of programs and services that focus on residents’ accessing financial
support services, such as VITA, EITC, first time homeowner programs, financial planning and other
related services.

34
Need Area: Survey Results
Item Total
Number of Respondents
Strongly Disagree
Disagree Agree Strongly Agree
Don’t Know
Total
1. There are enough services available in the county to help those who have this need.
746 38.0% 38.0% 17.1% 16.3% 1.0% 100%
2. Anyone in the county is able to access services.
746 39.0% 38.5% 11.0% 11.5% 0.0% 100%
3. Services are widely advertised and known by the county.
746 35.0% 35.0% 13.5% 12.5% 4.0% 100%
4. Services take race, age, gender, ethnicity and more into account.
746 34.5% 33.0% 16.4% 16.0% .1% 100%
5. Facilities that provide service to meet this need are of good quality (e.g., clean, well supplied).
746 38.0% 38.7% 12.2% 10.1% 1.0% 100%
6. Staff are well-trained, knowledgeable and provide good customer service.
746 39.1% 39.0% 11.0% 10.9% 0.0% 100%
Key Barriers
Barrier Total Number of Respondents
Number of Times Identified
Percentage of Responses
Wait Lists 821 253 30.82%
Services do not exist 821 178 21.68%
Transportation 821 181 22.05% Cannot contact the service provider 821 151 18.39%
Too expensive 821 83 10.11%
Lack of awareness of service 821 370 45.07%
Cultural Barriers 821 184 22.41%
Services provided are one-size fits all, and don’t meet individual needs
821 158 19.24%
Stigma Leads to Avoidance 821 114 13.89%
Eligibility Requirement (explain below) 821 321 39.10%
Other (explain below)

35
Need Area: CHILD CARE Status: General Need Area
Child care services include agencies that provide care and supervision to children; as well as, before-
and after- school care programs. This need area seeks to assess the level to which residents throughout
the county need child care and before and after school care and the existence of community services
and supports that address the need for child care (e.g., licensed daycares providers, subsidized and
unsubsidized childcare, Child Care Resource and Referral Agencies, Boys & Girls Clubs, YMCAs, Family
Success Centers, County Board of Social Services, etc.)
In Passaic County in 2019 the median monthly center-based child care cost for an infant was equal to
the median monthly cost for NJ. The median monthly center-based child care cost for a toddler was
equal to the median monthly cost for NJ. Median monthly center-based child care cost child care cost
for Pre-K in Passaic County was equal to the median monthly cost for NJ.
Need Assessment Key Findings
Summary: Scope of the Need
There is a lack of affordable day care options for many, particularly in Passaic and Paterson and in the up
county area. This is a critical challenge during the COVID 19 pandemic.
Summary: Nature of the Need
Summary: Local Considerations for Addressing the Need for County Prioritized Need Area
✓ Work with the Child Care Resource and Referral Agency, and the County Council for Young
Children, to develop strategies to increase the number and quality of Registered Family Day Care
Providers, licensed childcare centers, and the safety of child care services.
✓ Continue collaborative efforts to improve school performance, and continue to support
teens in their efforts to transition successfully to adulthood through programs such as summer
youth
✓ Continue collaborative efforts among County DHS, the One Stop Career Center, and the
Workforce Development Board to address the unemployment situation in the county, during and
post-COVID, including the needs of those with disabilities or criminal histories.
36
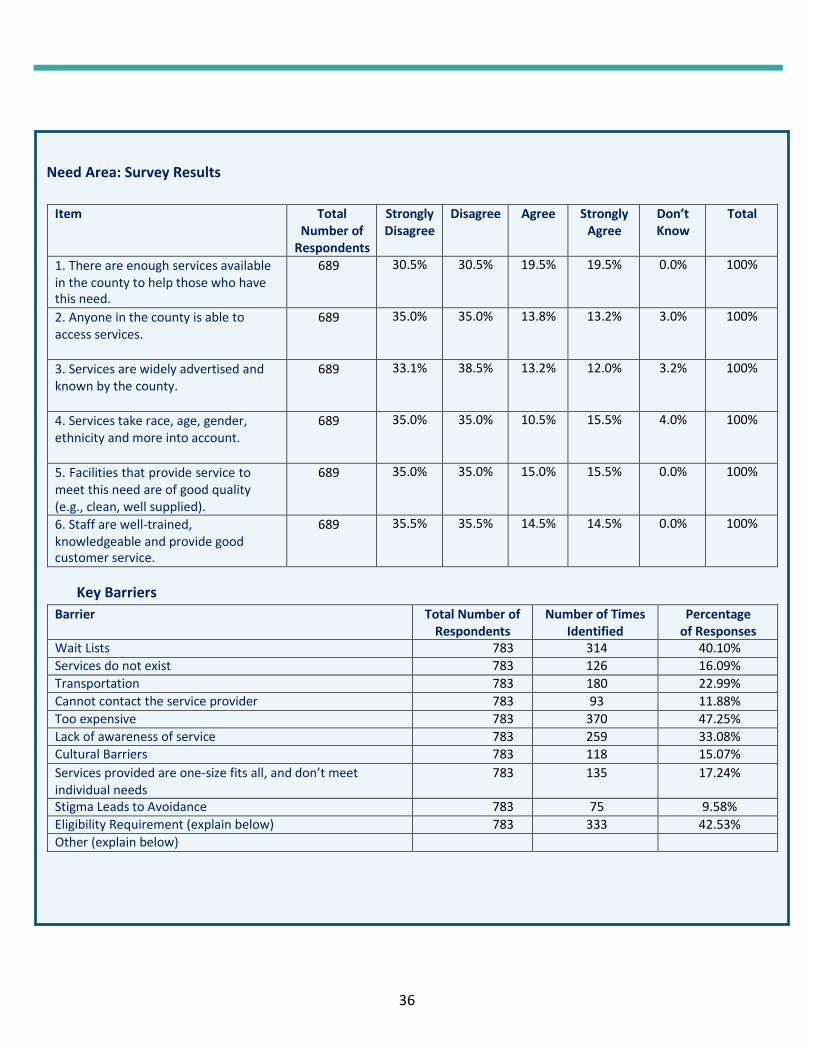
Need Area: Survey Results
Item Total
Number of Respondents
Strongly Disagree
Disagree Agree Strongly Agree
Don’t Know
Total
1. There are enough services available in the county to help those who have this need.
689 30.5% 30.5% 19.5% 19.5% 0.0% 100%
2. Anyone in the county is able to access services.
689 35.0% 35.0% 13.8% 13.2% 3.0% 100%
3. Services are widely advertised and known by the county.
689 33.1% 38.5% 13.2% 12.0% 3.2% 100%
4. Services take race, age, gender, ethnicity and more into account.
689 35.0% 35.0% 10.5% 15.5% 4.0% 100%
5. Facilities that provide service to meet this need are of good quality (e.g., clean, well supplied).
689 35.0% 35.0% 15.0% 15.5% 0.0% 100%
6. Staff are well-trained, knowledgeable and provide good customer service.
689 35.5% 35.5% 14.5% 14.5% 0.0% 100%
Key Barriers
Barrier Total Number of Respondents
Number of Times Identified
Percentage of Responses
Wait Lists 783 314 40.10%
Services do not exist 783 126 16.09%
Transportation 783 180 22.99%
Cannot contact the service provider 783 93 11.88%
Too expensive 783 370 47.25%
Lack of awareness of service 783 259 33.08%
Cultural Barriers 783 118 15.07%
Services provided are one-size fits all, and don’t meet individual needs
783 135 17.24%
Stigma Leads to Avoidance 783 75 9.58%
Eligibility Requirement (explain below) 783 333 42.53%
Other (explain below)

40
Need Area: Services for Families Caring for a Child of a Relative
Status: General Need Area
Kinship services are supports for caregivers who have taken on the responsibility of caring for kin,
including financial assistance, support groups, navigation of government benefits and assistance, and
more. This need area seeks to assess the level to which residents require kinship services and the
existence of community services and supports to support caregivers’ ability to care for their kin (e.g.,
Kinship Navigator Program, DCF’s Division of Child Protection and Permanency, Family Success Centers,
County Board of Social Services, etc.).
Need Assessment Key Findings
Summary: Scope of the Need
Passaic County has 2,649 relatives caring for children.
Summary: Nature of the Need
This was a particularly difficulty topic to address in the COVID environment. This topic area was not a
focus area during the assessment, as we were not very successful in engaging those families who
have worked with the Division of Child Protection and Permanency in DCF, nor relative caregivers of
children.
We assume these residents have similar needs as others in the county who are struggling to meet
their needs, with the additional challenge of caring for a relative. Many may be challenged by health
issues, be older individuals, and need support to help the child deal with separation issues related to
the birth family.
41
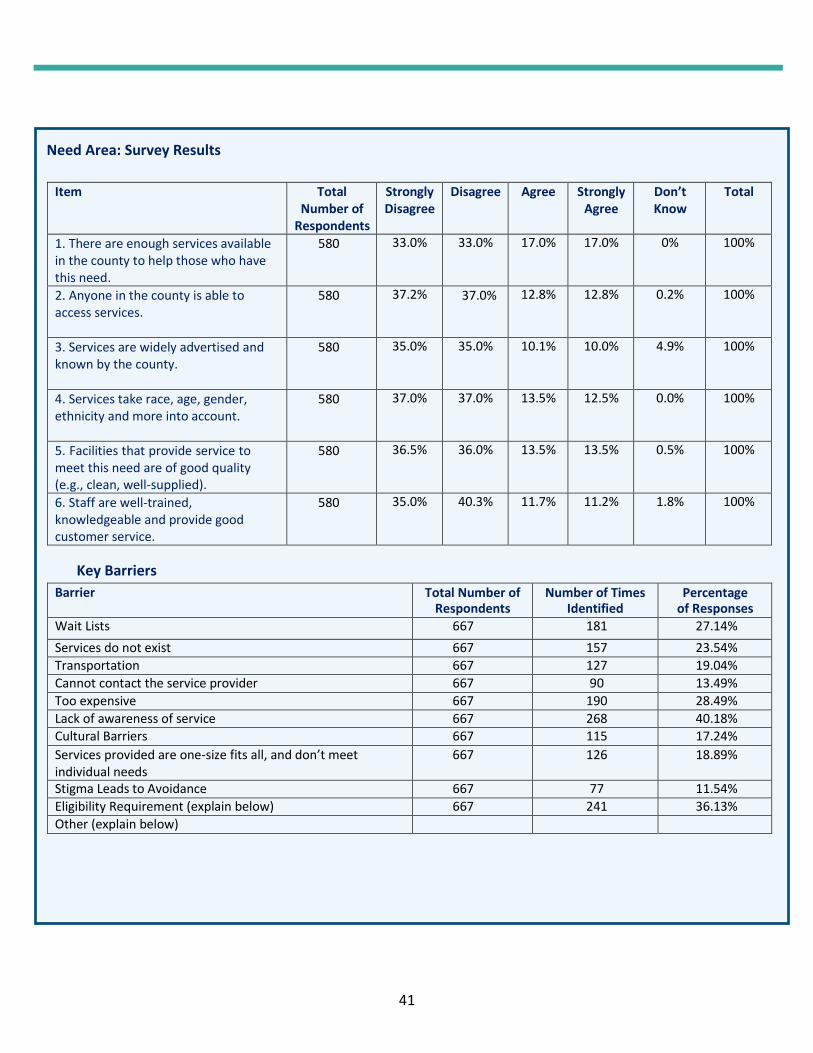
Need Area: Survey Results
Item Total
Number of Respondents
Strongly Disagree
Disagree Agree Strongly Agree
Don’t Know
Total
1. There are enough services available in the county to help those who have this need.
580 33.0% 33.0% 17.0% 17.0% 0% 100%
2. Anyone in the county is able to access services.
580 37.2% 37.0% 12.8% 12.8% 0.2% 100%
3. Services are widely advertised and known by the county.
580 35.0% 35.0% 10.1% 10.0% 4.9% 100%
4. Services take race, age, gender, ethnicity and more into account.
580 37.0% 37.0% 13.5% 12.5% 0.0% 100%
5. Facilities that provide service to meet this need are of good quality (e.g., clean, well-supplied).
580 36.5% 36.0% 13.5% 13.5% 0.5% 100%
6. Staff are well-trained, knowledgeable and provide good customer service.
580 35.0% 40.3% 11.7% 11.2% 1.8% 100%
Key Barriers
Barrier Total Number of Respondents
Number of Times Identified
Percentage of Responses
Wait Lists 667 181 27.14%
Services do not exist 667 157 23.54%
Transportation 667 127 19.04%
Cannot contact the service provider 667 90 13.49%
Too expensive 667 190 28.49%
Lack of awareness of service 667 268 40.18%
Cultural Barriers 667 115 17.24%
Services provided are one-size fits all, and don’t meet individual needs
667 126 18.89%
Stigma Leads to Avoidance 667 77 11.54%
Eligibility Requirement (explain below) 667 241 36.13%
Other (explain below)
42
Need Area: Behavioral/Mental Health Services for Children
Status: General Need Area
Child behavioral/mental health services are services designed to assess, address and support the
emotional, psychological and social well-being of children. This need area seeks to assess the level to
which children throughout the county have behavioral/mental health disorders, their ability to cope
and function, and the existence of community services and supports to address children’s
behavioral/mental health needs (e.g., hospitals, in/out-patient therapy, individualized counseling,
medication management, PerformCare, DCF’s Children’s System of Care, Family Support Organizations,
etc.)
Need Assessment Key Findings
Summary: Scope of the Need
From the Care Management Organization, we understand that 88 Passaic County youth are in residential
placements, and 15% overall reside outside their homes. in OOH. The percentage of youth in out of home
placements have increased, and challenges include court orders for youth to placement prior to CMO
involvement. The majority of families, 85% come from Paterson, Clifton and Passaic, and less than 2% come
from West Milford.
Fortunately, there are an array of programs in Passaic County to address family relationships, including:
❖ 3 Family Success Centers and 3 Family Friendly Centers
❖ 8 School-Based Youth Services Programs
❖ Kinship Navigator Program
❖ Healthy Families/TIP
❖ Parents as Teachers Program
❖ 2 Parent Linking Programs

43
Need Area: Survey Results
Item Total
Number of Respondents
Strongly Disagree
Disagree Agree Strongly Agree
Don’t Know
Total
1. There are enough services available in the county to help those who have this need.
554 32.1% 32.1% 17.9% 17.9% 0.0% 100%
2. Anyone in the county is able to access services.
554 33.0% 38.0% 11.8% 12.0% 5.2% 100%
3. Services are widely advertised and known by the county.
554 36.5% 36.5% 13.8% 13.2% 0.0% 100%
4. Services take race, age, gender, ethnicity and more into account.
554 34.6% 34.6% 15.8% 15.0% 0.0% 100%
5. Facilities that provide service to meet this need are of good quality (e.g., clean, well supplied).
554 33.5% 34.5% 15.3% 15.7% 1.0% 100%
6. Staff are well-trained, knowledgeable and provide good customer service.
554 34.8% 32.7% 14.5% 15.5% 2.5% 100%
Key Barriers
Barrier Total Number of Respondents
Number of Times Identified
Percentage of Responses
Wait Lists 673 222 32.99%
Services do not exist 673 157 23.33%
Transportation 673 122 18.13% Cannot contact the service provider 673 111 16.49%
Too expensive 673 188 27.93%
Lack of awareness of service 673 316 46.95%
Cultural Barriers 673 141 20.95%
Services provided are one-size fits all, and don’t meet individual needs
673 138 20.51%
Stigma Leads to Avoidance 673 162 24.07%
Eligibility Requirement (explain below) 673 235 34.92%
Other (explain below)

44
Need Area: Behavioral/Mental Health Services for Adults
Status: General Need Area
Adult behavioral/mental health services include services designed to assess, address and support the
emotional, psychological and social well-being of adults. This need area seeks to assess the level to
which adult residents throughout the county have behavioral/mental health disorders, their ability to
function and the existence of community services and supports to address adult behavioral/mental
health needs (e.g., hospitals, in/out-patient therapy, individualized counseling, medication
management, Statewide Parent Advocacy Network, Division of Mental Health and Addiction Services,
PerformCare, etc.).
Need Assessment Key Findings
Summary: Scope of the Need
Summary: Local Considerations for Addressing the Need for County Prioritized Need Area
✓ Use established planning bodies to examine the availability of services, especially up county,
and make recommendations about service expansion, including languages in which services will be
provided, as needed.
45
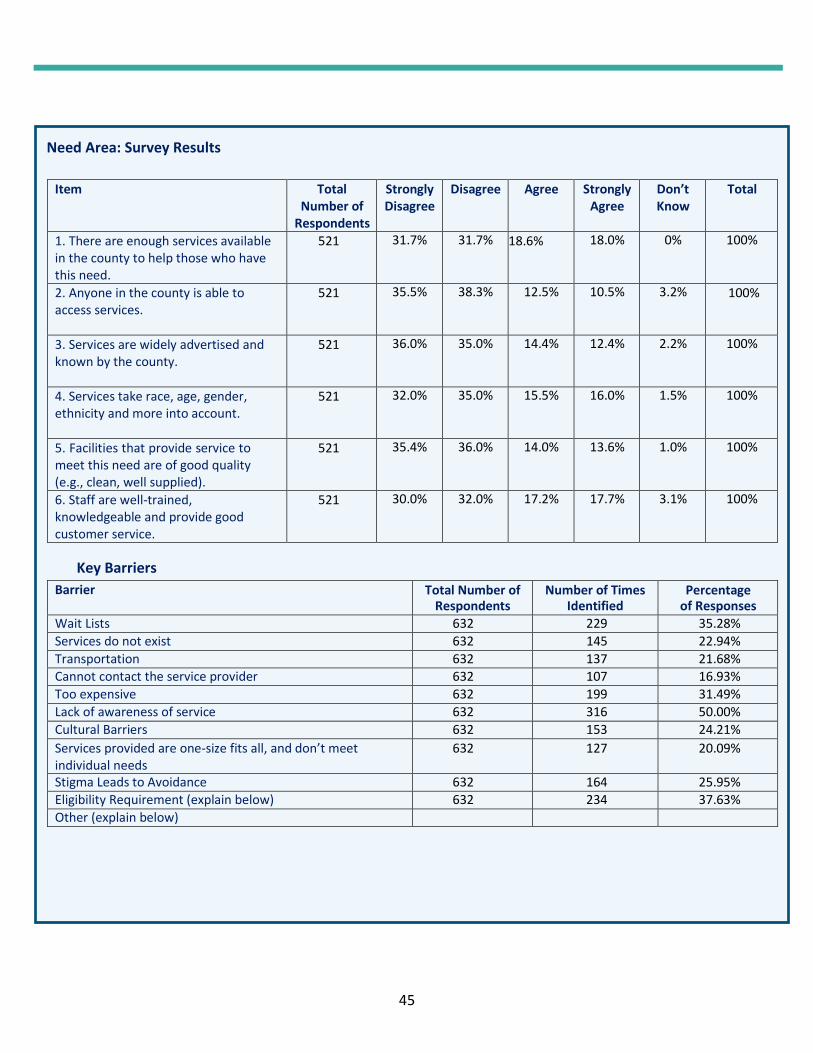
Need Area: Survey Results
Item Total
Number of Respondents
Strongly Disagree
Disagree Agree Strongly Agree
Don’t Know
Total
1. There are enough services available in the county to help those who have this need.
521 31.7% 31.7% 18.6% 18.0% 0% 100%
2. Anyone in the county is able to access services.
521 35.5% 38.3% 12.5% 10.5% 3.2% 100%
3. Services are widely advertised and known by the county.
521 36.0% 35.0% 14.4% 12.4% 2.2% 100%
4. Services take race, age, gender, ethnicity and more into account.
521 32.0% 35.0% 15.5% 16.0% 1.5% 100%
5. Facilities that provide service to meet this need are of good quality (e.g., clean, well supplied).
521 35.4% 36.0% 14.0% 13.6% 1.0% 100%
6. Staff are well-trained, knowledgeable and provide good customer service.
521 30.0% 32.0% 17.2% 17.7% 3.1% 100%
Key Barriers
Barrier Total Number of Respondents
Number of Times Identified
Percentage of Responses
Wait Lists 632 229 35.28%
Services do not exist 632 145 22.94%
Transportation 632 137 21.68% Cannot contact the service provider 632 107 16.93%
Too expensive 632 199 31.49%
Lack of awareness of service 632 316 50.00%
Cultural Barriers 632 153 24.21%
Services provided are one-size fits all, and don’t meet individual needs
632 127 20.09%
Stigma Leads to Avoidance 632 164 25.95%
Eligibility Requirement (explain below) 632 234 37.63%
Other (explain below)
46
Need Area: Substance Use Disorder and Prevention Services (Adults and Adolescents)
Status: Prioritized Need Area
Substance use treatment services includes services that provide a range of assessment and supportive
treatment for substance use disorders. This need area seeks to gauge the substance use needs and the
existence of community services and supports to address substance use disorder needs throughout the
county (e.g., detoxification, short- and long-term inpatient treatment services, outpatient treatment
services, medication management, Division of Mental Health and Addiction Services, NJ 2-1-1, etc.)
Need Assessment Key Findings
Summary: Scope of the Need
The opioid epidemic, although somewhat overshadowed currently by the COVID epidemic,
continues to have a significant impact on the lives of residents of Passaic County. Overdoses have
increased by 110% in recent years (up to 171 in 2019), as have Naloxone administrations – a 450%
increase from 2015 to 2019, with 846 life-saving incidents occurring in 2019. Substance use
disorder treatment services are available within the county, with the largest admissions coming
from the major cities in the county: Paterson (2,892), Passaic (577), and Clifton (476). There are
also 47 programs cross the county that provide mental health treatment services, and a directory of
services on the County DHS website.
The issue of stigma, for individuals experiencing mental health and/or addiction issues was raised
repeatedly, and Passaic DHS is involved in addressing this issue.
Summary: Local Considerations for Addressing the Need for County Prioritized Need Area
Consider coordination, and possible integration, of the planning bodies to address these behavioral
health needs. Focus on the development of an organized system of services and supports in the areas of
prevention, early intervention and aftercare.
47
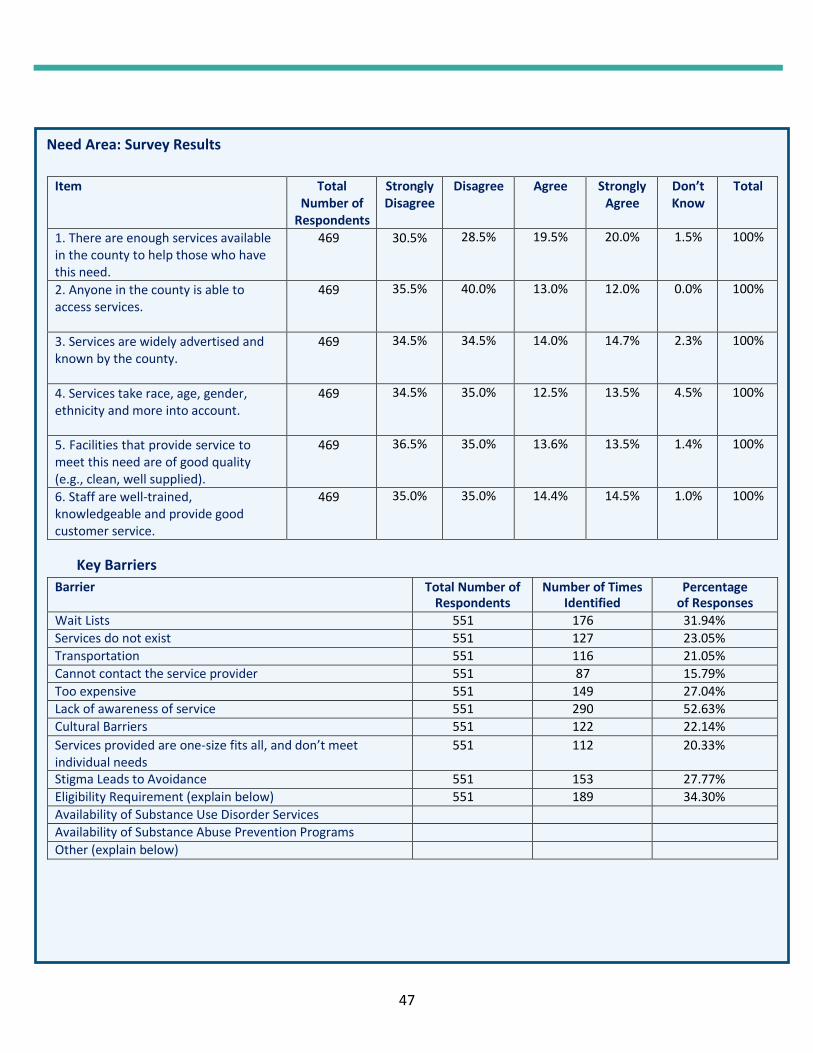
Need Area: Survey Results
Item Total
Number of Respondents
Strongly Disagree
Disagree Agree Strongly Agree
Don’t Know
Total
1. There are enough services available in the county to help those who have this need.
469 30.5% 28.5% 19.5% 20.0% 1.5% 100%
2. Anyone in the county is able to access services.
469 35.5% 40.0% 13.0% 12.0% 0.0% 100%
3. Services are widely advertised and known by the county.
469 34.5% 34.5% 14.0% 14.7% 2.3% 100%
4. Services take race, age, gender, ethnicity and more into account.
469 34.5% 35.0% 12.5% 13.5% 4.5% 100%
5. Facilities that provide service to meet this need are of good quality (e.g., clean, well supplied).
469 36.5% 35.0% 13.6% 13.5% 1.4% 100%
6. Staff are well-trained, knowledgeable and provide good customer service.
469 35.0% 35.0% 14.4% 14.5% 1.0% 100%
Key Barriers
Barrier Total Number of Respondents
Number of Times Identified
Percentage of Responses
Wait Lists 551 176 31.94%
Services do not exist 551 127 23.05%
Transportation 551 116 21.05%
Cannot contact the service provider 551 87 15.79%
Too expensive 551 149 27.04% Lack of awareness of service 551 290 52.63%
Cultural Barriers 551 122 22.14%
Services provided are one-size fits all, and don’t meet individual needs
551 112 20.33%
Stigma Leads to Avoidance 551 153 27.77%
Eligibility Requirement (explain below) 551 189 34.30%
Availability of Substance Use Disorder Services
Availability of Substance Abuse Prevention Programs
Other (explain below)

53

49
Need Area: Domestic Violence Services
Status: General Need Area
Domestic violence is violence or other forms of abuse by one person against another in a domestic
setting, e.g., husband and wife, child and parent, sibling and sibling, etc. This need area seeks to assess
the level to which domestic violence impact residents throughout the county and the existence of
community services and supports that will keep families safe from physical, sexual, financial, digital,
mental and emotional forms of domestic violence (e.g., shelter services, victim services, batterers
intervention services, DCF’s Office of Domestic Violence Services, domestic violence liaisons, domestic
violence hotline, Family Success Centers, etc.)
Need Assessment Key Findings
Summary: Scope of the Need
Relationships among family members are, unfortunately, sometimes problematic. Domestic violence
reports in Passaic County are declining, from 4,013 in 2012 to 3,367 four years later. Most incidents
occur in Paterson, Passaic, and Clifton.

50
Need Area: Survey Results
Item Total
Number of Respondents
Strongly Disagree
Disagree Agree Strongly Agree
Don’t Know
Total
1. There are enough services available in the county to help those who have this need.
458 32.0% 32.0% 18.8% 18.0% 0.0% 100%
2. Anyone in the county is able to access services.
458 34.8% 35.0% 14.7% 13.0% 2.5% 100%
3. Services are widely advertised and known by the county.
458 35.0% 32.0% 15.0% 16.0% 2.0% 100%
4. Services take race, age, gender, ethnicity and more into account.
458 32.0% 37.0% 14.5% 15.5% 1.0% 100%
5. Facilities that provide service to meet this need are of good quality (e.g., clean, well supplied).
458 34.5% 33.8% 15.2% 14.5% 2.0% 100%
6. Staff are well-trained, knowledgeable and provide good customer service.
458 38.9% 32.0% 15.3% 13.8% 0.0% 100%
458
Key Barriers
Barrier Total Number of Respondents
Number of Times Identified
Percentage of Responses
Wait Lists 519 104 20.04%
Services do not exist 519 118 22.7%
Transportation 519 78 15.03%
Cannot contact the service provider 519 89 17.15% Too expensive 519 72 13.87%
Lack of awareness of service 519 300 57.80%
Cultural Barriers 519 138 26.59%
Services provided are one-size fits all, and don’t meet individual needs
519 113 21.77%
Stigma Leads to Avoidance 519 138 26.59%
Eligibility Requirement (explain below) 519 151 29.09
Other (explain below)

57

58
Need Area: Parenting Skills Services
Status: General Need Area
Parenting skills services are programs that aim to enhance parental capacity and skills, improve
parenting practices and behaviors, and teach age appropriate child development skills and milestones.
This need area seeks to assess the level to which residents require parenting skills services and the
existence of community services and supports which address parenting skills (e.g., Home Visiting
Program, Nurse-Family Partnership, Family Preservation, Family Success Centers, Family Service
Organizations, Parents Anonymous, Parent Mentors, SPAN, etc.).
Need Assessment Key Findings
Summary: Scope of the Need
Respondents to the survey focused on the need for child care. About one-half, or 47% of survey respondents indicated that the cost of childcare was too expensive. It was also noted that transportation for childcare is also an issue. Other needs that were indicated included cultural barriers to accessing childcare and another issue that was identified in this key area included eligibility requirements-this may relate to legal status for subsidized child care assistance. Summary: Nature of the Need
Parenting programs are provided by the Family Success centers in the County, and by other service
providers.
59
Summary: Local Considerations for Addressing the Need for County Prioritized Need Area
Fortunately, there are an array of programs in Passaic County to address family relationships, including:
❖ 3 Family Success Centers and 3 Family Friendly Centers
❖ 8 School-Based Youth Services Programs
❖ Kinship Navigator Program
❖ Healthy Families/TIP
❖ Parents as Teachers Program
❖ 2 Parent Linking Programs
❖ Numerous localized Faith Based Programs
.

60
Need Area: Survey Results
Item Total
Number of Respondents
Strongly Disagree
Disagree Agree Strongly Agree
Don’t Know
Total
1. There are enough services available in the county to help those who have this need.
440 32.0% 32.0% 17.5% 18.5% 0.0% 100%
2. Anyone in the county is able to access services.
440 34.5% 34.5% 13.5% 13.0% 4.5% 100%
3. Services are widely advertised and known by the county.
440 34.0% 39.0% 12.5% 13.5% 0.0% 100%
4. Services take race, age, gender, ethnicity and more into account.
440 31.1% 31.5% 15.9% 15.0% 6.5% 100%
5. Facilities that provide service to meet this need are of good quality (e.g., clean, well supplied).
440 32.5% 35.5% 16.4% 15.6% 0.0% 100%
6. Staff are well-trained, knowledgeable and provide good customer service.
440 32.5% 32.5% 14.7% 15.3% 5.0% 100%
Key Barriers
Barrier Total Number of Respondents
Number of Times Identified
Percentage of Responses
Wait Lists 525 113 21.52%
Services do not exist 525 140 26.67%
Transportation 525 82 15.62%
Cannot contact the service provider 525 65 12.38%
Too expensive 525 79 15.05%
Lack of awareness of service 525 289 55.05%
Cultural Barriers 525 121 23.05%
Services provided are one-size fits all, and don’t meet individual needs
525 108 20.57%
Stigma Leads to Avoidance 525 90 17.14%
Eligibility Requirement (explain below) 525 144 27.43%
Other (explain below)

61

Summary: Local Considerations for Addressing the Need for County Prioritized Need Area
62
Legal and advisory services include legal assistance, advocacy and support in various types of legal
matters, including child support, child custody, paternity, immigration, domestic violence, housing and
eviction, criminal, etc. This need area seeks to assess if the level to which residents throughout the
county have unresolved legal issues for which they need assistance and the existence of legal and
advisory services to meet those needs (e.g., Legal Aid, pro-bono attorneys and clinics, court system,
ombudsman, etc.)
Need Assessment Key Findings
Summary: Scope of the Need
It is notable that the most skipped question in the survey was the Legal and Advocacy Services
question, 2,255 respondents skipped this question. The conclusion is that many residents who do not
have legal status while willing to take an anonymous survey, still have concerns that revealing any
information regarding what they perceived to be questions about their legal status, caused more
than 95% of respondents to skip all of the questions labeled as Legal and Advocacy Services.

63
Need Area: Survey Results
Item Total
Number of Respondents
Strongly Disagree
Disagree Agree Strongly Agree
Don’t Know
Total
1. There are enough services available in the county to help those who have this need.
426 30.0% 30.0% 20.4% 19.6% 0.0% 100%
2. Anyone in the county is able to access services.
426 32.0% 31.8% 17.2% 14.5% 4.5% 100%
3. Services are widely advertised and known by the county.
426 36.4% 36.4% 13.0% 13.0% 1.2% 100%
4. Services take race, age, gender, ethnicity and more into account.
426 30.1% 35.0% 15.5% 16.9% 2.5% 100%
5. Facilities that provide service to meet this need are of good quality (e.g., clean, well supplied).
426 34.5% 35.0% 15.7% 15.2% 0.0% 100%
6. Staff are well-trained, knowledgeable and provide good customer service.
426 35.5% 34.5% 14.7% 14.0% 1.3% 100%
Key Barriers
Barrier Total Number of Respondents
Number of Times Identified
Percentage of Responses
Wait Lists 517 139 26.89%
Services do not exist 517 118 22.82%
Transportation 517 78 15.09%
Cannot contact the service provider 517 81 15.67%
Too expensive 517 157 30.37%
Lack of awareness of service 517 279 53.77%
Cultural Barriers 517 111 21.47%
Services provided are one-size fits all, and don’t meet individual needs
517 83 16.05%
Stigma Leads to Avoidance 517 80 15.47%
Eligibility Requirement (explain below) 517 164 31.72%
Other (explain below)
i *In some instances survey respondents were confused by the scale and did not identify to what degree of agreement or disagreement they were with some of these questions/categories. In these cases, the scale percentage was taken from the total and in the hundreds of cases of comments, when N/A was utilized; these became the “Don’t Know” category.