passenger perceptions of the helicopter: ride-quality
TRANSCRIPT
sit systems on which 84 percent of the occupants of an untilted forward-facing standard transit seat will remain securely within their seats is 0.47 g. To ensure retention of 84 percent of the occupants at a side-facing seat, the best estimate is 0 .41 g; for the occupants of a facingforward seat tilted back 5°, the best estimate is 0.52 g.
Consequently, these data support the use of forwardfacing, back-tilted seating to permit high decelerations with a low incidence of passe1Jger dislodgment. (Obviously, backward-facing seating permits higher decelerations; however, many AGT systems operate bidirectionally, and many users prefer facing the direction of movement.)
The small observed differences in the data obtained under different rates of change of deceleration are not attributable to treatment effects, nor are the small differences observed between the two different sizes of subjects.
The results of this study should be applied cautiously; no attempt was made to distinguish independently among the effects, if any, of subject age, sex, and size. Although no significant effects of jerk were found, further studies of jerk should not be precluded because only six subjects participated and only a limited, poorly controlled range of jerk levels was possible in this study.
17
ACKNOWLEDGMENTS
This report is based on research supported by the Transportation Systems Center, U.S. Department of Transportation and sponsored by the New System and Automation Division, Urban Mass Transportation Administration.
REFERENCES
1. G. F. Hirshfield. Disturbing Effects of Horizontal Acceleration. Electric Railway Presidents' Conference Committee, Bulletin No. 3, Sept. 1932.
2. A. C. Browning. Human-Engineering Studies of High-Speed Pedestrian Conveyors. Royal Aircraft Establishment, Technical Rept. No. 71104, Oct. 1972.
3. Forward and Side Loads to Unseat Passengers: Comparison of Flat Seat With Contoured Seat. American Seating Co., March 14, 1975.
4. J. N. Fox af1d R. D. Dryden. Biomechanical Modeling of Transit Passengers Subjected to Accelerative Forces. Public Transportation Center, Univ. of Texas, Arlington, August 31, 1975.
5. A. Damoud, H. W. Stroudt, and R. A. McFarland. The Human Body in Equipment Design. Harvard Univ. Press, 1966.
Passenger Perceptions of the Helicopter: Ride-Quality Considerations Michael B. Schoultz,* IBM Federal Systems Division, Owego,
New York William J. Snyder, Langley Research Center, National
Aeronautics and Space Administration, Hampton, Virginia
A summary of the i\lational Aeronautics and Space Administration civil helicopter ride-quality research is presented. Three components of the ride-quality problem are discussed: passenger preconditioning; in-flight cabin conditions, such as noise and motion; and flight duration. Passenger anxiety and motivation for flying were studied as potentially important factors influencing perceptions of ride quality. In addition, the relation between these factors and previous flight experience is examined. The relative importance of cabin noise and vibration is determined for a range of noise and vibration combinations, and changes in passenger comfort due to ride improvements are evaluated. The importance of flight duration on ride satisfaction is discussed.
In the highly competitive field of public transportation, consideration of the needs of the user is essential. Accordingly, to make the helicopter a feasible transportation alternative, one must, among other things, understand how to design the system to be attractive to potential users. It is important to identify the relations between the attributes of the helicopter and the passenger's evaluation of the effects of these attributes as they relate to his or her satisfaction. One source of this information is passenger evaluation based on actual experience of these attributes.
One of the more important attributes of a transportation system, and especially of the helicopter, is the ride environment. The multiharmonic nature of helicopter vibration presents a special problem in evaluating subjective responses to this environment. Previous studies
of subjective evaluation of this type of environment have shown that the levels of each of the component rotor harmonics can be well within acceptable limits and still combine to produce an unacceptable ride (1). An equally important part of the helicopter environment is the noise level. Thus far, there have been few investigations of the interactive effects of different combinations of noise and vibration on a passenger's satisfaction with the ride. Therefore, it is important to extend ride-quality research into these areas and to identify and evaluate passenger responses to the helicopter environment. Also requiring attention are the modifying effects of other ride-quality variables, such as flight duration, lowfrequency motion, temperature, and visual cues, as well as such passenger psychological variables as anxiety, attitude toward flying, and flight experience.
The passenger-acceptance flight-research phase of the National Aeronautics and Space Administration (NASA) Civil Helicopter Technology Program is designed to investigate all of these variables through controlled experiments that use a large transport helicopter configured to commercial-type specifications. The experiments are designed to simulate real-world conditions as closely as possible. This paper discusses the objectives and results of the first phase of the program. An overview of other flight research activities of the program can be found elsewhere (2).
18
OBJECTIVES
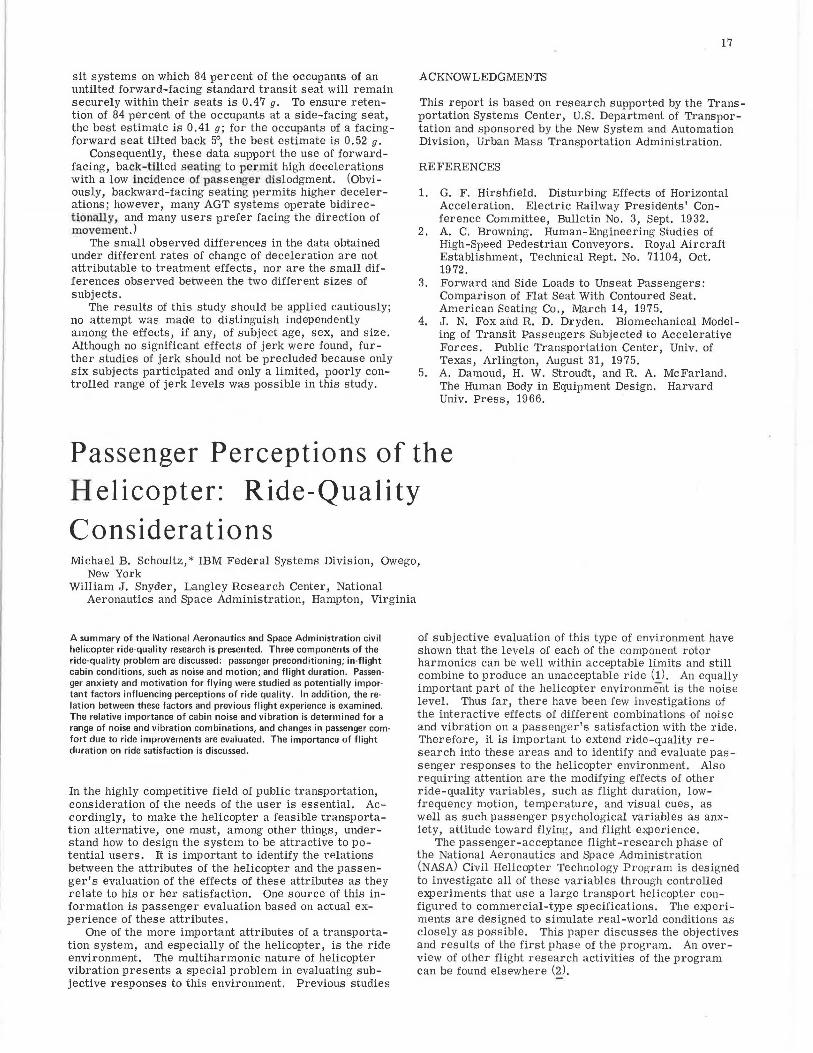
The primary objective of the passenger-acceptance flight tests is to evaluate the ride environment of the helicopter. Figure 1 illustrates the three components of the ride-quality problem that were studied: (a) factors affecting a passenger's preconditioning, (b) cabinenvironrnent conditions, and (c) fli ght duration. Previous studies (3, 4) have shown that all of these components ue important in determining a passenger's evaluation of his or her environment and, therefore, his or her satisfaction with the ride.
The helicopter as an alternative mode of transportation is a relatively new concept to most travelers; few have actually experienced this kind of travel. Therefore, preconditioning may be an especially important factor in determining a passenger's satisfaction. Three preconditioning factors appear particularly important: attitude toward flying, previous experience with air travel and with helicopter flight, and anxiety about and motivation for flying.
A second component of the ride-quality problem is the cabin environment and how it is perceived by the passenger. Motion, noise, temperature, and visual cues all contribute to this environment. In this part of the research, the object is to identify the relative importance of each of these factors and to determine the improvements that could best increase passenger satisfaction.
A previous investigation (5) of the helicopter ride environment showed passengers to be reasonably well sat-
Figure 1. Components of ride-quality problem.
EXPOSURE DURATI ON
RIDE PASSENGER ENVIRONMENT - TRANSFER
FUNCTION
PRECONDITIONING FACTORS
DEGREE OF
PASSENGER RIDE
SATISFACTION
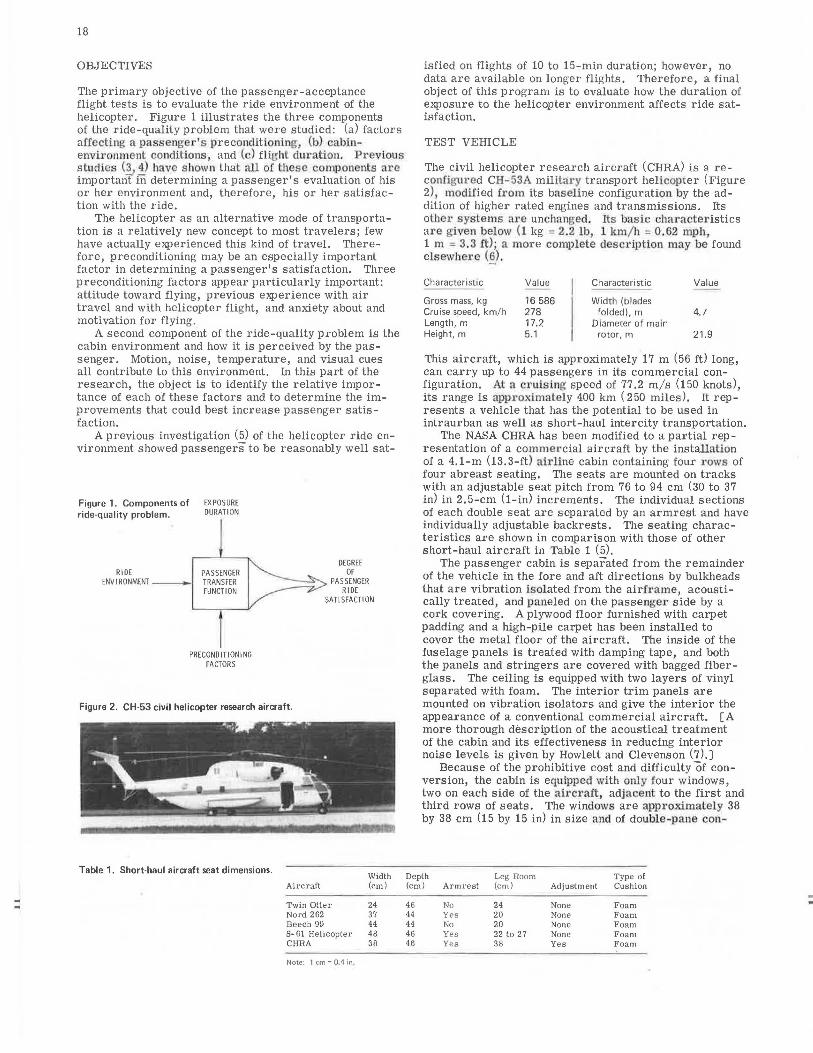
Figure 2. CH-53 civil helicopter research aircraft.
Table 1. Short-haul aircraft seat dimensions. Width
Aircraft (cm)
Twin Otter 24 Nord 262 37 Beech 99 44 S-61 Helicopter 48 CHRA 38
Note: 1 cm= OA in.
isfied on flights of 10 to 15-min duration; however, no data are available on longer flights. Therefore, a final object of this program is to evaluate how the duration of exposure to the helicopter environment affects ride satisfaction.
TEST VEHICLE
The civil helicopter research aircraft (CHRA) is a reconfir,rured CH-G3A military transport helicopter (Figure 2), modified from its baseline configuration by the addition of higher rated engines and transmissions. Its other systems are unchanged. Its basic cha1·actedstics ai·e given below (1 kg = 2.2 lb, 1 km/ h = 0.62 mph, 1 m = 3.3 ft); a more complete description may be found elsewhere (6).
Characteristic Value Characteristic Value
Gross mass, kg 16 586 Width (blades Cruise speed, km/h 278 folded), m 4.7 Length, m 17.2 Diameter of main Height, m 5.1 rotor, m 21.9
This aircraft, which is approximately 17 m ( 56 ft) long, can carry up to 44 passengers in its commercial configuration. At a cruising speed of 77.2 m/s (150 knots), its range is approximately 400 km ( 250 miles). It represents a vehicle that has the potential to be used in intraurban as well as short-haul intercity transportation.
The NASA CHRA has been modified to a partial representation of a commercial aircraft by the installalion of a 4.1-m (13.3-ft) airline cabin containing four rows of four abreast seating. The seats are mounted on tracks with an adjustable seat pitch from 76 to 94 cm (30 to 37 in) in 2.5-cm (1-in) increments. The individual sections of each double seat are separated by an armrest and have individually adjustable backrests. The seating characteristics are shown in comparison with those of other short-haul aircraft in Table 1 (5).
The passenger cabin is separated from the remainder of the vehicle in the fore and aft directions by bulkheads that are vibration isolated from the airframe, acoustically treated, and paneled on the passenger side by a cork covering. A plywood floor furnished with carpet padding and a high-pile carpet has been installed to cover the metal floor of the aircraft. The inside of the fuselage panels is treated with damping tape, and both the panels and stringers are covered with bagged fiberglass. The ceiling is equipped with two layers of vinyl separated with foam. The interior trim panels are mounted on vibration isolators and give the interior the appearance of a conventional commercial aircraft. [A more thorough description of the acoustical treatment of the cabin and its effectiveness in reducing interior noise levels is given by Howlett and Clevenson (7).]
Because of the prohibitive cost and difficulty of conversion, the cabin is equipped with only four windows, two on each side of the aircraft, adjacent to the first and third rows of seats. The windows are approximately 38 by 38 cm (15 by 15 in) in size and of double-pane con-
Depth Leg Room Type of (cm) Armrest (cm) Adjustment Cushion
46 No 24 None Foam 44 Yes 20 None Foam 44 No 20 None Foam 46 Yes 22 to 27 None Foam 46 Yes 38 Yes Foam
struction, with the inner pane attached to the acoustical treatment, lightly tinted, and provided with an opaque shade. The temperature in the cabin is maintained by heating and air-conditioning systems, and individually adjustable air vents for recirculated air are provided for each passenger.
DESIGN AND PROCEDURE OF EXPERIMENT
Figure 3 shows the variables studied and the degree of control of these variables during the flight experiments. In this phase, eight flights were conducted, each with a complement of 15 passengers . Two groups of passengers were selected from among both NASA and non-NASA applicants. Each group represented equivalent mixes and numbers of four types of passenger, reflecting previous flight experience and attitude toward Hying : (a) never flown before, (b) like flying and some flight experience, (c) no strong feeling about flying and some flight exi)erience, and (d) like flying and a frequent ai.r traveler (defined as at least 6 flights/year on the aver age). None of the subjects had previously flown in a helicopter. The seating arrangements were controlled to ensure that each type of passenger was represented throughout the cabin.
Each group of passengers flew four flights, one at each of four durations: 25, 50, 75, and 100 min. The order of flight-duration presentation was different for each group, and passengers flew only 1 flight/d and never on consecutive days. The total series of flights took place within a 15-d period. Because of scheduling conflicts, some passenger substitution was required; 13 substitutes were used during the eight flights.
Passenger evaluations were taken by questionnaires during and after each flight. Each flight consisted of a number of 10-min test segments, as shown below.
Flight Duration (min)
25 50
Test Segments per Flight
2 3
Flight Duration (min)
75 100
Test Segments per Flight
4 5
The segments were equally spaced over the duration of the flight. Each was divided into four 1. 5-min evaluation periods during which a prescribed combination of noise and vibration was presented.
As Figure 3 illustrates, neither noise nor motion is precisely controllable. However, certain helicopter airspeeds were found to result in highest and lowest vibration levels in the cabin. Similarly, by opening and closing the rear door to the passenger cabin, the interior noise level could be varied between a high and a low condition. Typical ranges of these noise and vibration levels are shown below; more details of the characteristics of this environment are given by Snyder (2) and Snyder and Schlegel (~). -
Factor High Low
Motion, 9rms
a, (vertical) 0.13 to 0.17 0.10 to 0.12 av (lateral) 0.08 to 0.11 0.05 to 0.07
Noise, dB(A) 88 to 92 83 to 85
The four combinations of noise and vibration were presented randomly during each test segment. At the end of each period, the passengers were given 20 s to record their evaluations of the comfort and the ride by using a seven-point comfort scale on which one represented very comfortable and seven represented very uncomfortable (~ !, 1Q). In addition, they were asked to identify which factor(s) they found most objectionable (including no fac-
19
tors objectionable). These evaluations were designed to identify changes in ride quality as a function of exposure duration and to study the relative importance of cabin noise and vibration. Noise, motion, and temperature data were recorded to correlate the subjective responses with the environmental conditions.
A passenger's apprehension and motivation were evaluated by the SPielberger State-Trait Anxiety Inventory (8), a two-part qL1estionnaire designed to meast1re (a) the usual or typical level of anxiety (trait anxiety) and (b) the present level of anxiety (state of anxiety). The trait-anxiety questionnaire was administered to the passengers several weeks before the flights began, and the state-anxiety questionnaire was administered just before takeoff, after the helicopter rotor had been engaged.
Finally, the passengers were given a brief postflight questionnaire in the briefing room at the end of each flight. On these questionnaires, they were to evaluate their overall reaction to the flight, indicate which factors contributed the most to their evaluation, and identify the system improvements they felt could best be made.
DISCUSSION OF RESULTS
Preconditioning Factors
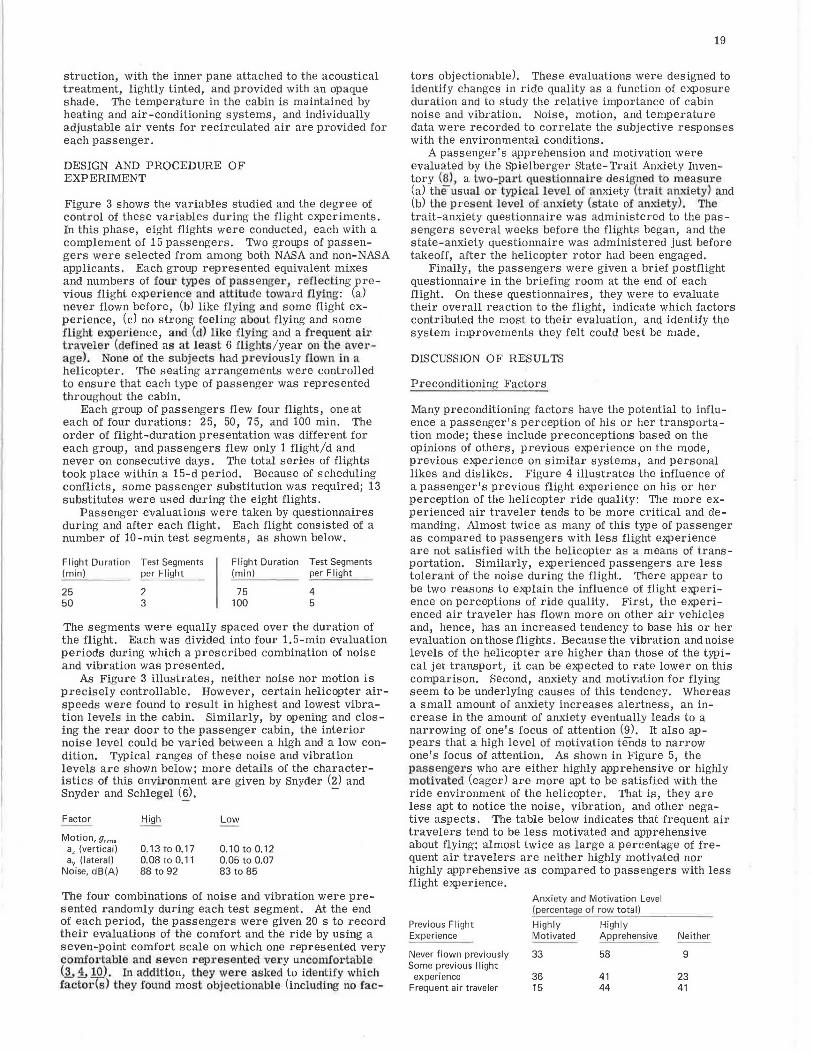
Many preconditioning factors have the potential to influence a passenger's perception of his or her transportation mode; these include preconceptions based on the opinions of others, previous experience on the mode, previous experience on similar systems, and personal likes and dislikes. Figure 4 illustrates the influence of a passenger's previous flight experience on his or her perception of the helicopter ride quality: The more experienced air traveler tends to be more critical and demanding. Almost twice as many of this type of passenger as compared to passengers with less flight experience are not satisfied with the helicopter as a means of transportation. Similarly, experienced passengers are less tolerant of the noise during the flight. There appear to be two reasons to explain the influence of flight experience on perceptions of ride quality. First, the experienced air traveler has flown more on other air vehicles and, hence, has an increased tendency to base his or her evaluation on those flights. Because the vibration and noise levels of the helicopter are higher than those of the typical jet transport, it can be expected to rate lower on this comparison. Second, anxiety and motivation for flying seem to be underlying causes of this tendency. Whereas a small amount of anxiety increases alertness, an increase in the amount of anxiety eventually leads to a narrowing of one's focus of attention (9). It also appears that a high level of motivation tends to narrow one's focus of attention. As shown in Figure 5, the passengers who are either highly apprehensive or highly motivated (eager) are more apt to be satisfied with the ride environment of the helicopter. That is, they are less apt to notice the noise, vibration, and other negative aspects. The table below indicates that frequent air travelers tend to be less motivated and apprehensive about flying; almost twice as large a percentage of frequent air travelers are neither highly motivated nor highly apprehensive as compared to passengers with less flight experience.
Previous Flight Experience
Never flown previously Some previous flight
experience Frequent air traveler
Anxiety and Motivation Level (percentage of row total)
Highly Highly Motivated Apprehensive
33
36 15
58
41 44
Neither
9
23 41
20
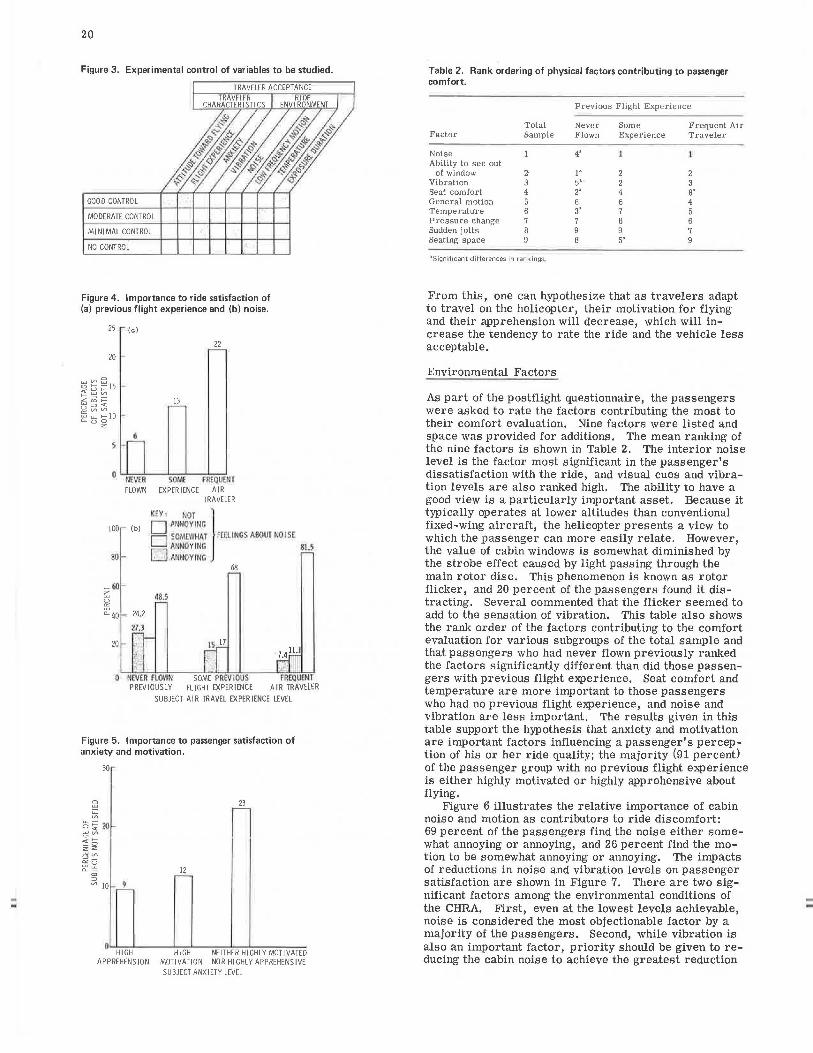
Figure 3. Experimental control of variables to be studied.
TRAVELER ACCEPTANCE
GOOD CONTROL
MODERATE CONTROL
MINIMAL CONTROL
NO CONTROL
Figure 4. Importance to ride satisfaction of (a) previous flight experience and (b) noise.
25 (a)
22
20 -
~ >-- 15
~ 13 ~ ~ ID 0
O NE VER SQMf. FRf.QLIENl FLOWN EXPERIENCE AIR
TRAVELER
100 (b) D ANN~0:1NG l D SOMEIV».-.T FEf:LINCS Af!OUT NOi SE
D ANNOYINC 81.5
80 ANNOY INC 68
>-- 60 ~ ~8_ .5 ~ ~40 - 24,2
Zl.J
20 15 17
~. 7.411.1
,:· I NEV£ff FLOWN SOME PAEV IOUS FREQUENT PREVIOUSLY FLIGHT EXPERIENCE A IR TRAVELER
SUBJECT AIR TRAVEL EXPERIENCE LEVEL
Figure 5. Importance to passenger satisfaction of anxiety and motivation.
30
12
HIGH HIGH NEITHER HIGHLY MOTIVATED APPREHENSION MOTIVATION NOR HIGHLY APPREHENSIVE
SUBJECT ANXIETY LEVEL
Table 2. Rank ordering of physical factors contributing to passenger comfort.
Previous Flight Experience
Total Never Some Frequent Air Factor Sample Flown Experience Traveler
Noise 4' Ability to see out
of window i 1' 2 2 Vibration 3 5' 2 3 Seat com fort 4 2· 4 8' General motion 5 6 6 4 Temperature 6 3• 7 5 Pressure change 7 7 8 6 Sudden jolts 8 9 9 Seating space 9 5•
11 Significant differences in rankings.
From this, one can hypothesize that as travelers adapt to travel on the helicopter, their motivation for flying and their apprehension will decrease, which will increase the tendency to rate the ride and the vehicle less acceptable.
Environmental Factors
As part of the postflight questionnaire, the passengers were asked to rate the factors contributing the most to their comfort evaluation. Nine factors were listed and space was provided for additions. The mean ranking of the nine factors is shown in Table 2. The interior noise level is the factor most significant in the passenger's dissatisfaction with the ride, and visual cues and vibration levels are also ranked high. The ability to have a good view is a particularly important asset. Because it typically operates at lower altitudes than conventional fixed-wing aircraft, the helicopter presents a view to which the passenger can more easily relate. However, the value of cabin windows is somewhat diminished by the strobe effect caused by light passing through the main rotor disc. This phenomenon is known as rotor flicker, and 20 percent of the passengers found it distracting. Several commented that the flicker seemed to add to the sensation of vibration. This table also shows the rank order of the factors contributing to the comfort evaluation for various subgroups of the total sample and that passengers who had never flown previously ranked the factors significantly different than did those passengers with previous flight e:xperience. Seat comfort and temperature are more important to those passengers who had no previous flight e:xperience, and noise and vibration are less important. The results given in this table support the hypothesis that anxiety and motivation are important factors influencing a passenger's perception of his or her ride quality; the majority (91 percent) of the passenger group with no previous flight e:xperience is either highly motivated or highly apprehensive about flying.
Figure 6 illustrates the relative importance of cabin noise and motion as contributors to ride discomfort: 69 percent of the passengers find the noise either somewhat annoying or annoying, and 26 percent find the motion to be somewhat annoying or annoying. The impacts of reductions in noise and vibration levels on passenger satisfaction are shown in Figure 7. There are two significant factors among the environmental conditions of the CHRA. First, even at the lowest levels achievable, noise is considered the most objectionable factor by a majority of the passengers. Second, while vibration is also an important factor, priority should be given to reducing the cabin noise to achieve the greatest reduction
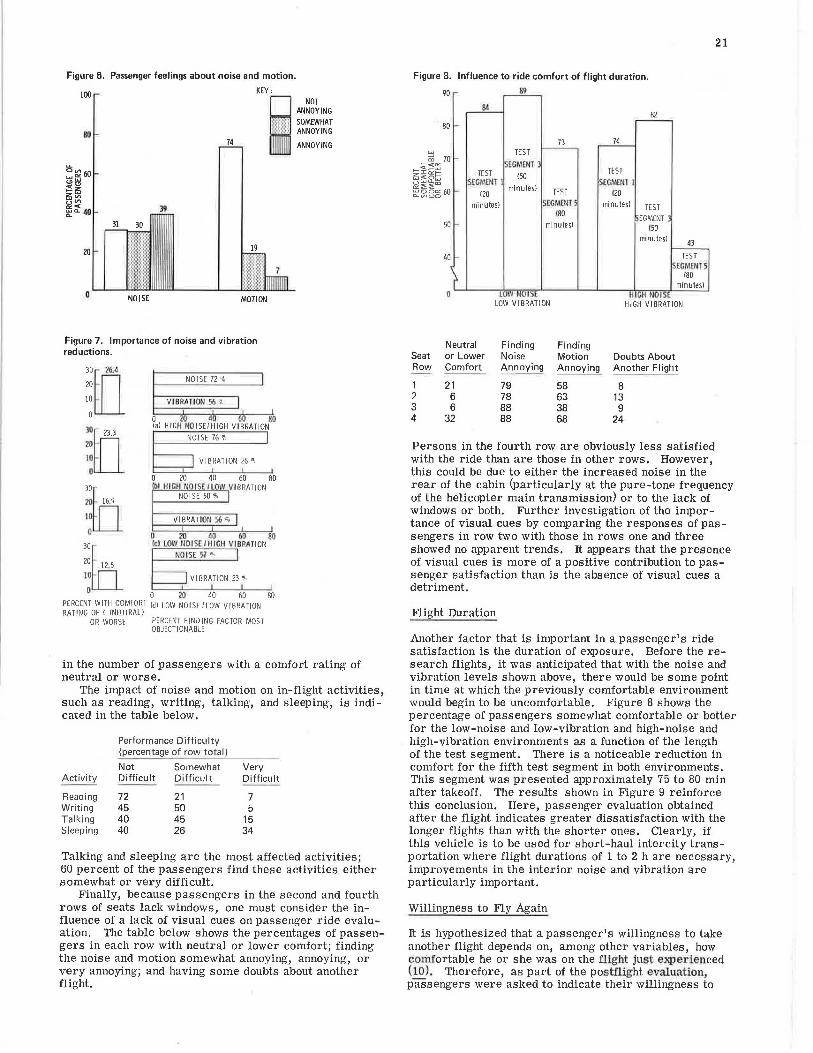
Passenger feelings about noise and motion.
KEY:
Figure 6.
100
80 74 I
NOT ANNOYING SOMEWHAT ANNOYING
ANNOYING
)9
31
20 19
NOISE MOTION
Figure 7. Importance of noise and vibration reductions.
20 30[1.4 NOISE 72%
JO
0 0 80 lal HIG fl NO ISE/HIGH VI BRATION
20 -30[]3.3 NOISE 76 % I
10 -
0 I VIBRATION 26 %
I----,--' ' 0 20 40 60 80 bl HIGH I
NOISE 50% VIBRATION
30to 20 16.9
10 VIBRATION 56 %
0 0 20 4(1 60 80 l•I LOW NOISE 1111011 VIBRATI ON
NO ISE 57 % 30b_ 20 12.5 10
a VIBRATION 23 %
0 20 40 60 PERCENT WITH COMFORT (di LOW NOISE/LOW VIBRATION RATING OF 4 INEUTRALI
OR WORSE PERCENT FINDING FACTOR MOST OBJECTIONABLE
80
in the number of passengers with a comfort rating of neutral or worse.
The impact of noise and motion on in-flight activities, such as reading, writing, talking, and sleeping, is indicated in the table below.
Activity
Reading Writing Talking Sleeping
Performance Difficulty (percentage of row total)
Not Somewhat Very Difficult Difficult Difficult
72 45 40 40
21 50 45 26
7 5
15 34
Talking and sleeping are the most affected activities; 60 percent of the passengers find these activities either somewhat or very difficult.
Finally, because passengers in the second and fourth rows of seats lack windows, one must consider the influence of a lack of visual cues on passenger ride evaluation. The table below shows the percentages of passengers in each row with neutral or lower comfort; finding the noise and motion somewhat annoying, annoying, or very annoying; and having some doubts about another flight.
21
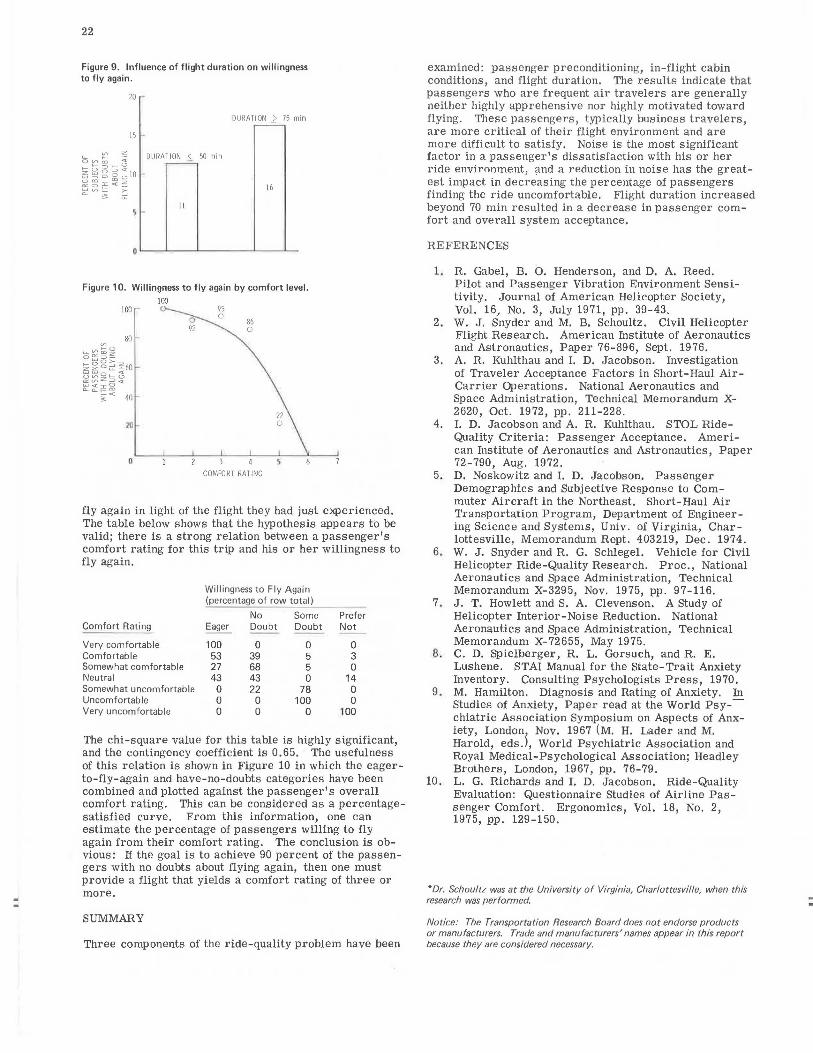
Figure 8. Influence to ride comfort of flight duration.
90 89
82 80 -
73 74
~ 70 TEST
""""""' EC MEN I «e-~ TEST I°'~ TEST 150 ~~~ SEGMENT l
minutes) SEGMENT l
OOC:::6Q 120 TEST 120 V>UO
minutes) SEGMt'NT minutes I TEST 180
EGMENT 50 minulesl !50
minutes) 43
40 TEST SEGMENT 5
180 minutes I
HIG~I N LOW VIBRATION HIGH VIBRATION
Neutral Finding Finding Seat or Lower Noise Motion Doubts About Row Comfort Annoying Annoying Another FI ight
1 21 79 58 8 2 6 78 63 13 3 6 88 38 9 4 32 88 68 24
Persons in the fourth row are obviously less satisfied with the ride than are those in other rows. However, this could be due to either the increased noise in the rear of the cabin (particularly at the pure-tone frequency of the helicopter main transmission) or to the lack of windows or both. Further investigation of the importance of visual cues by comparing the responses of passengers in row two with those in rows one and three showed no apparent trends. It appears that the presence of visual cues is more of a positive contribution to passenger satisfaction than is the absence of visual cues a detriment.
Flight Duration
Another factor that is important in a passenger's ride satisfaction is the duration of exposure. Before the research flights, it was anticipated that with the noise and vibration levels shown above, there would be some point in time at which the previously comfortable environment would begin to be uncomfortable. Figure 8 shows the percentage of passengers somewhat comfortable or better for the low-noise and low-vibration and high-noise and high-vibration environments as a function of the length of the test segment. There is a noticeable reduction in comfort for the fifth test segment in both environments. This segment was presented approximately 75 to 80 min after takeoff. The results shown in Figure 9 reinforce this conclusion. Here, passenger evaluation obtained after the flight indicates greater dissatisfaction with the longer flights than with the shorter ones. Clearly, if this vehicle is to be used for short-haul intercity transportation where flight durations of 1 to 2 hare necessary, improvements in the interior noise and vibration are particularly important.
Willingness to Fly Again
It is hypothesized that a passenger's willingness to take another flight depends on, among other variables, how comfortable he or she was on the flight just experienced (10). Therefore, as part of the post.flight evaluation, passengers were asked to indicate their willingness to
22
Figure 9. Influence of flight duration on willingness to fly again.
20 -
15 -
DURATION < 50 min ----=-
11
DURATION > 75 min ----=-
16
Figure 10. Willingness to fly again by comfort level.
100
20 -
0
100
COMFORT RATING
22 0
fly again in light of the flight they had just e:iq:ierienced. The table below shows that the hypothesis appears to be valid; there is a strong relation between a passenger's comfort rating for this trip and his or her willingness to fly again.
Willingness to Fly Again (percentage of row total)
No Some Prefer Comfort Rating Eager Doubt Doubt Not
Very comfortable 100 0 0 0 Comfortable 53 39 5 3 Somewhat comfortable 27 68 5 0 Neutral 43 43 0 14 Somewhat uncomfortable 0 22 78 0 Uncomfortable 0 0 100 0 Very uncomfortable 0 0 0 100
The chi-square value for this table is highly significant, and the contingency coefficient is 0.65. The usefulness of this relation is shown in Figure 10 in which the eagerto-fly-again and have-no-doubts categories have been combined and plotted against the passenger's overall comfort rating. This can be considered as a percentagesatisfied curve. From this information, one can estimate the percentage of passengers willing to fly again from their comfort rating. The conclusion is obvious: If the goal is to achieve 90 percent of the passengers with no doubts about flying again, then one must provide a flight that yields a comfort rating of three or more.
SUMMARY
Three components of the ride-quality problem have been
examined: passenger preconditioning, in-flight cabin conditions, and flight duration. The results indicate that passengers who are frequent air travelers are generally neither highly apprehensive nor highly motivated toward flying. These passengers, typically business travelers, are more critical of their flight environment and are more difficult to satisfy. Noise is the most significant factor in a passenger's dissatisfaction with his or her ride environment, a_nd a reduction in noise has the greatest impact in decreasing the percentage of passengers finding the ride uncomfortable. Flight duration increased beyond 70 min resulted in a decrease in passenger comfort and overall system acceptance.
REFERENCES
1. R. Gabel, B. 0. Henderson, and D. A. Reed. Pilot and Passenger Vibration Environment Sensitivity. Journal of American Helicopter Society, Vol. 16, No. 3, July 1971, pp. 39-43.
2. W. J. Snyder and M. B. Schoultz. Civil Helicopter Flight Research. American Institute of Aeronautics and Astronautics, Paper 76-896, Sept. 1976.
3. A. R. Kuhlthau and I. D. Jacobson. Investigation of Traveler Acceptance Factors in Short-Haul AirCarrier Operations. National Aeronautics and Space Administration, Technical Memorandum X-2620, Oct. 1972, pp. 211-228.
4. I. D. Jacobson and A. R. Kuhlthau. STOL RideQuality Criteria: Passenger Acceptance. American Institute of Aeronautics and Astronautics, Paper 72-790, Aug. 1972.
5. D. Noskowitz and I. D. Jacobson. Passenger Demographics and Subjective Response to Commuter Aircraft in the Northeast. Short-Haul Air Transportation Program, Department of Engineering Science and Systems, Univ. of Virginia, Charlottesville, Memorandum Rept. 403219, Dec. 1974.
6. W. J. Snyder and R. G. Schlegel. Vehicle for Civil
7.
8.
9.
Helicopter Ride-Quality Research. Proc., National Aeronautics and Space Administration, Technical Memorandum X-3295, Nov. 1975, pp. 97-116. J. T. Howlett and S. A. Clevenson. A Study of Helicopter Interior-Noise Reduction. National Aeronautics and Space Administration, Technical Memorandum X-72655, May 1975. C. D. Spielberger, R. L. Gorsuch, and R. E. Lushene. STAI Manual for the State-Trait Anxiety Inventory. Consulting Psychologists Press, 1970. M. Hamilton. Diagnosis and Rating of Anxiety. In Studies of Anxiety, Paper read at the World Psy-chiatric Association Symposium on Aspects of Anx-iety, London, Nov. 1967 (M. H. Lader and M. Harold, eds.), World Psychiatric Association and Royal Medical-Psychological Association; Headley Brothers, London, 1967, pp. 76-79.
10. L. G. Richards and I. D. Jacobson. Ride-Quality Evaluation: Questionnaire Studies of Airline Passenger Comfort. Ergonomics, Vol. 18, No. 2, 1975, pp. 129-150.
*Dr. Schoultz was at the University of Virginia, Charlottesville, when this research was performed.
Notice: The Transportation Research Board does not endorse products or manufacturers. Trade and manufacturers' names appear in this report because they are considered necessary.