passivation of carbon steel through mercury … · steel corrosion, the process of implantation has...
TRANSCRIPT

11111111111111111111111111111111\1111\11111111111111111\\1111\113 1176 00167 5934
PASSIVATION OF CARBON STEEL THROUGH MERCURY IMPLANTATION
PREPARED FOR
LEWIS RESEARCH CENTER
NATIONAL AERONAUTICS AND SPACE ADMINISTRATION
GRANT NAG-3-25
Fi na1 Report
February 1981
Paul J. Wilbur and Raymond S. RobinsonDepartment of Mechanical Engineering
Colorado State UniversityFort Collins, Colorado
https://ntrs.nasa.gov/search.jsp?R=19810011716 2020-03-15T10:20:37+00:00Z

.'
1. Report No. I 2. Government Accession No. 3. Recipient's catalog No.NASA CR 165292
4. Title and Subtitle 5. Report Dilte
Pissivition of Cirbon Steel Through Mercury I'mplintation Peb.198l6. Performing Orgiinization Code
7. Author(s) e. Performing Orgiinization Report No.Piul J. Wilbur ind Raymond S. Robi nson
10. Work Unit No.9. P'erforming Organization Nilme Ind Address
Department of Mechanical Engineering 11. Contract or Grant No.Colorido Stite University NAG-3-25Fort Collins, Colorado 80523
13. Tvpe of Report and "eriod Covered12. Sponsoring Agency Name and Address Peb. 1, 1980 - Feb. 1, 1981
Nationil Aeroniutics ind Space AdministritionWashington, D.C. 20546 14. Sponsoring Agency Code
15. Supplementary Notes
Grint Monitor - Williim Kerslake, NASA Lewis Reseirch Center, Cleveland, Ohi'o 44135.
16. Abstract
An experiment, in which carbon steel samples were implinted with mercury ions from i broadbeam ion source and their corrosion characteristics in air were eViluited, is described.Mercury doses of a few rnA min/cm2 at energies of I few hundred electron volts are shown toeffect significant improvements in the corrosion resistince of the treated surfaces. Tn aWirm moist environment the onset of rusting was extended from 15 mtn. for an untreated sampleto 'V 30 hrs. for one implinted at a dose of 33 rnA min/cm2 with 1000 eV mercury ions.
17. Key Words (Suggested by Author(s)) 1/l. Distribution Statement
Broad Beim Ion Source Unclissified - Unl tmitedCorrosion
19. Security Classif. (of this report)1
20.
Security Classif. (of this page)\21. No., of "ages 122. "rice'
Unclissified Unclassified 34
• For sale by the National Technical Information Service, Springfield, Virginia 22161
NASA-C-168 (Rev. 10-75)

Experimental Apparatus and Procedure •
Test Samples •••Mercury Implantation .•Sampl e OXidation ••••
Theoretical Basis for the Interpretation ofReflectance Measurements
Results •••.•.•••
Additional Results.
Appendix A - The Qualities of and Equipment for Ion Implantation. 23•
Topic
Abstract
Introduction
Bac kground . •
Conclusion
References •
. .
. .
TABLE OF CONTENTS
. . .. . . .
i
1
1
3
458
10
14
20
20
22
Appendix B - Reflectance Measurements, MercuryImplanted Carbon Steel ••.•.•
ii
27
LIST OF FIGURES
Effects of Implanted Mercury Dose and Energy
Titl e
Effects of Oxidation Temperature • • • •
Test Sample Reflectance Characteristics.
Time History of Carbon Steel Corrosionin Warm, Moist Environment • • • •
6
11
15
18
18
. .. . . . . . . .Broad Beam Ion Source
Current Density Profile
Figure No.
l.
2.
3.
4.
5.

PASSIVATION OF CARBON STEEL
THROUGH MERCURY IMPLANTATION
During the course of the development of a mercury, electron
bombardment thruster in England, a group of researchers placed a carbon
steel plate in the beam of the thruster as part of a facility checkout
test. After a few days in the facility the plate was removed and placed
in the ambient, outdoor environment. A few years later someone noticed
that the plate was rusted overall of its surface except that region where
the mercury ion beam had impinged upon it. l The tests described in this
report were designed to investigate this phenomenon of the inhibition of
carbon steel corrosion by implanted mercury ions under more closely con
trolled experimental conditions. The purpose of this work has been to
identify the mercury ion doses and energies required to induce this
beneficial rust resisting treatment of carbon steel surfaces. The work
must be considered preliminary because much of it has been directed at
designing procedures and defining the range over which the parameters show
significant effects rather than executing a statistical study involving
large numbers of test samples.
BACKGROUND
While the phenomenon observed by the English thruster researchers
awakened interest in mercury implantation as a means of inhibiting carbon
steel corrosion, the process of implantation has been under investigation
for some time. The basic process, which evolved initially in the semi
conductor industry, has been recognized as useful for a variety of surface
treatments designed to improve hardness, wear resistance, and fatigue
2
lifetime in addition to the corrosion resistance of various materials. 2,3,4
This interest in applications other than those related to semiconductors
has however evolved within the past several years.
The basic process of ion implantation involves directing high speed
ions at a surface in a vacuum environment. Some of the ions are captured
in the material being bombarded in such a way that they can act to change
the physical properties on the surface of the material. Ion implantation
differs from such conventional processes as electroplating or vapor
deposition in that it effects a chemical or physical composition change
near the surface of the base material. Some of the advantages of ion
implantation over conventional plating, surface treating 'or alloying
procedures, which have been identified, are listed in Appendix A. Chief
among these advantages is the capability for implanting almost any ionic
species into any solid material without introducing undesirable dimen
sional changes or thermally induced transformations. Since the implanted
ions do not represent a coating, adhesion and peeling problems which can
be induced by inadequately cleaned surfaces and by thermal and mechanical
stresses in deposited films are also eliminated.
The potential for the application of this technology in the metallur
gical industries is truly phenomenal if the cost of the process can be
held at an acceptably low level. The basic research into these phenomena
seems however to have been carried out using equipment designed for ion
implantation in semiconductors and this equipment is relatively expensive
to both purchase and operate. It has capabilities that are however prob
ably not required in metallurgical applications. For example the high
purity beams produced for semiconductor treatments are almost certainly
unnecessary. The high ion energies needed to produce acceptable current
3
densities in these high purity implanters are also probably not required
in the metallurgical applications. Finally, the typical single aperture
ion implantation source has a very small areal coverage. Considerably
higher current densities, the capability for handling larger metallurgical
targets with lower capital investments in equipment and lower operating
expenses can be realized if multiaperture, broad beam ion sources are used.
These broad beam ion sources, developed initially for space propulsion use,
are just beginning to find application in the electronics industry. The
differences between the single aperture implanter and the broad beam ion
source are illustrated by the comparison of performance capabilities given
in Appendix A.
While it is difficult to anticipate the potential applications of a
simple scheme for inhibiting rust formation it would seem likely that it
might find initial application in protecting small tools such as those
used in the electronics, medical and dental areas. This procedure might
make it possible to make such tools out of conventional steels rather than
the more expensive stainless steels. Razor blades and certain decorative
trims represent other areas where ready markets for such a process might
be found. Eventually one might envision large vacuum facilities and ion
sources capable of handling individual items as large as vehicle compo
nents. Assuming the process is successful one could also foresee this
type of corrosion protection applied to metals other than steels which
tend to tarnish.
EXPERIMENTAL APPARATUS AND PROCEDURE
The basic objective of the experimental work described in this
report has been to demonstrate the beneficial effects of implanted

4
mercury in inhibiting the corrosion of carbon steel. Two parameters
associated with the implanted mercury were identified as important,
namely the dose of the delivered mercury ions and their energy of impact.
To first order the dose determines the degree of coverage while the
energy determines the depth of penetration of the mercury ions.
The procedure followed in the conduct of the experiment was to first
clean some carbon steel samples chemically, then to expose them to a
mercury ion beam characterized by an energy and a current density for the
time required to produce the desired dose. After implantation the samples
could be exposed to either a dry, oven environment or to a moist, warm
air environment to effect oxidation. Finally the reflectances of samples
implanted at different dose and energy levels and exposed to different
oxidizing environments were compared. Reflectance was selected as the
basis of comparison for this prel iminary test because it can be measured
easily and it is the property that is of primary importance in determining
the aesthetic appeal of a surface.
Test Samples
All carbon steel test samples used in the study were cut from a single
sheet of 22 gauge, cold rolled steel as supplied by a local steel yard.
This steel, designated ASTM-A-366, QQ-698, contains 0.15% carbon, 0.25 to
0.60% manganese, 0.35% max phosphorus and 0.040% max sulfur. The rec
tangular samples cut from this material were 1.1 cm x 1.7 cm. After con
sidering several possible cleaning alternatives the one yielding the most
reproducible reflectance measurements after oxidation in a dry oven
environment was selected. This procedure involved a one minute sequential
immersion in the following chemicals:
5
1. Chlorothene (degreaser)
2. 18.5 weight percent hydrochloric acid
3. Oi st i 11 ed wa ter
4. Methanol
5. Acetone
After immersion in each chemical the samples were dried with a tissue
before immers ion in the next one. After the chemical cl ean ing the sampl es
were placed in a vacuum environment for storage. Although no oxidation of
the samples was evident when the samples were stored in an ambient air
environment they were always kept in vacuum storage asa precaution against
inadvertent differential oxidation of samples because they were exposed to
ambient air for the different periods of time.
Mercury Implantation
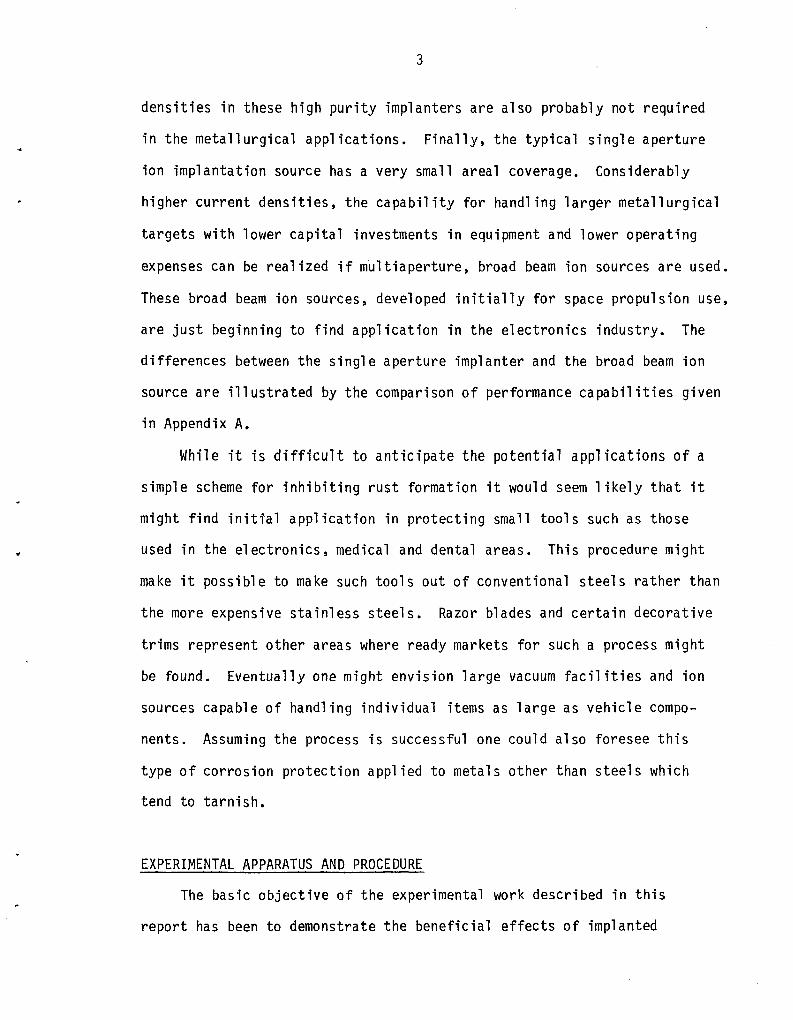
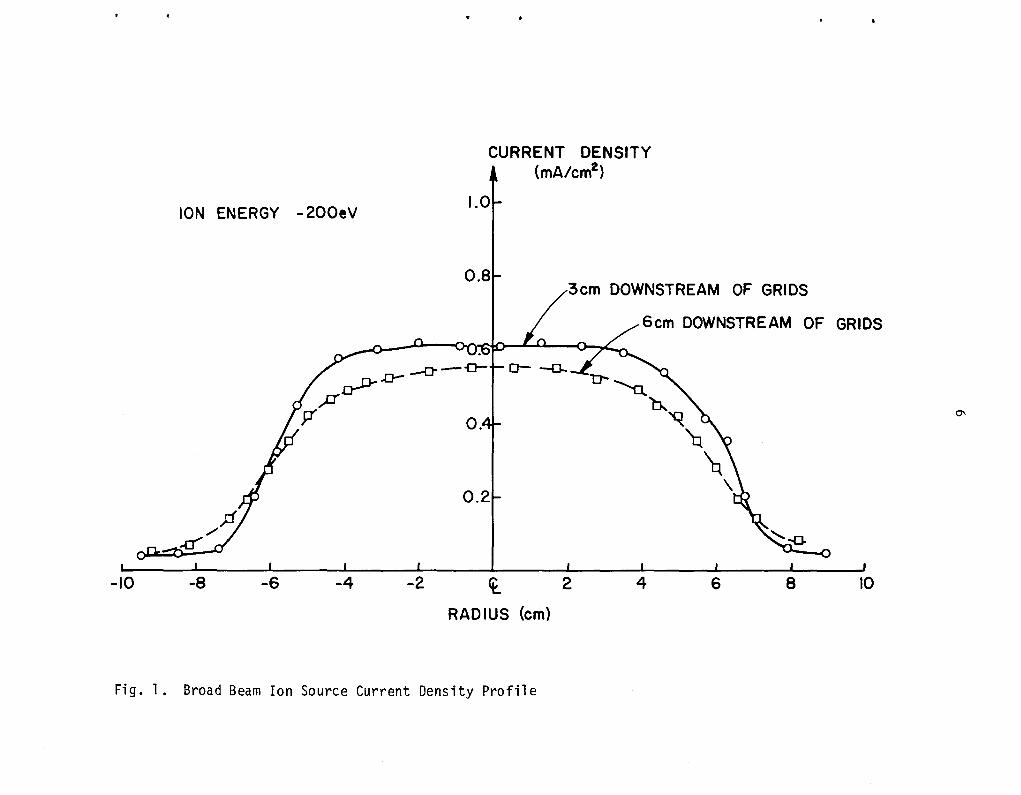
Implantation was effected in a 45 cm dia. vacuum facility. The broad
beam ion source used to accomplish this was a 15 cm dia. multipole design
with its grid masked down to a 10 cm dia. A typical current density pro-
file from the source, this one for a 200 eV ion energy, is shown in Fig. 1.
Test samples to be implanted were placed 6 cm downstream of the grids
within the central 3 cm radius circle where the current density was very
uniform. During implantation the background mercury pressure was typi-
-5 1cally 3 x 10 torr. Implantation of the test samples was accomp ished
by placing an array of twenty samples in the vacuum facility, downstream
-6of the ion source. The system was pumped down to x 10 torr before
the working fluid was introduced into the system. Next, stable ion source
operation was achieved with a shutter located 3 cm downstream of the ion
source grids positioned to shield the samples. After the desired current
CURRENT DENSITY(rnA/em!)
ION ENERGY - 200eV1.0
0.8
10864
3em DOWNSTREAM OF GRIDS
6em DOWNSTREAM OF GRIDS
-2 <t 2
RADIUS (em)
-4-6-8-10
Fig. 1. Broad Beam Ion Source Current Density Profile

..
7
density and ion energy operating conditions had been established the
shutter was opened and the twenty samples were implanted simultaneously
for the time necessary to produce the desired dose. The shutter was also
equipped with a Faraday current density sensor that could be used to
verify the uniformity and constancy of current density from one implan-
tation run to the next. During exposure the samples were cooled radia-
tively and measurements on a set of dummy samples suggested their tempera
ture rose rapidly to a value of 120 to 140°C when they were exposed to
the ion beam. Typically their temperature had risen through 90% of the
total temperature rise within about 7 minutes after the shutter had been
opened. The samples were allowed to cool under vacuum for several hours
after they had been implanted.
On the basis of a few prel iminary tests, ion energies of 200 eV and
doses as low as 5 rnA min/cm2 were shown to effect some improvement in
corrosion resistance of the carbon steel. As a result of this observation
ion doses of 1.1, 2.8, 5.5, 11 and 33 rnA min/cm2* and energies of 200, 500
and 1000 eV were selected as reasonable values which would show signifi
cant changes in the corrosion resistance of the carbon steel samples.
Tests executed after the preliminary ones were therefore conducted on
samples that had been treated with all possible combinations of the doses
and energies cited above.
* These doses correspond respectively to 4.1 x 10¹⁷ ,11 x 1017 , 21 x 1017 ,17 17 . 241 x 10 and 120 x 10 mercury lons/cm •
8
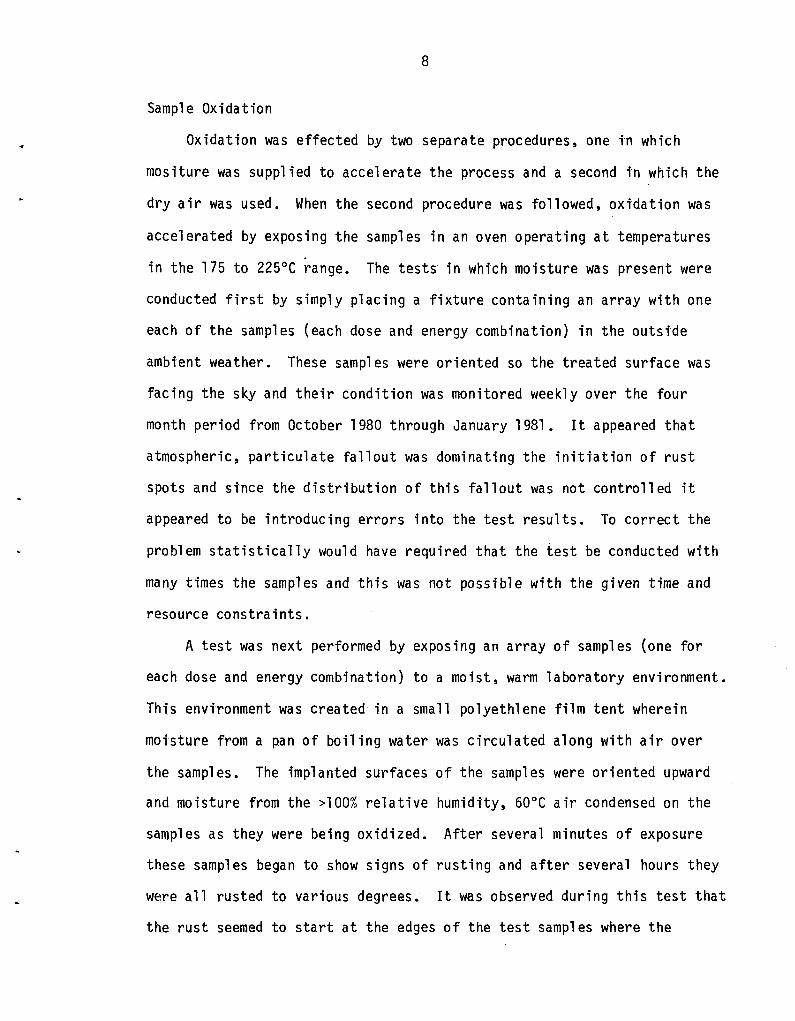
Sample Oxidation
Oxidation was effected by two separate procedures, one in which
mositure was supplied to accelerate the process and a second in which the
dry air was used. When the second procedure was followed, oxidation was
accelerated by exposing the samples in an oven operating at temperatures
in the 175 to 225°C range. The tests in which moisture was present were
conducted first by simply placing a fixture containing an array with one
each of the samples (each dose and energy combination) in the outside
ambient weather. These samples were oriented so the treated surface was
facing the sky and their condition was monitored weekly over the four
month period from October 1980 through January 1981. It appeared that
atmospheric, particulate fallout was dominating the initiation of rust
spots and si'nce the distribution of this fallout was not controlled it
appeared to be introducing errors into the test results. To correct the
problem statistically would have required that the test be conducted with
many times the samples and this was not possible with the given time and
resource constraints.
A test was next performed by exposing an array of samples (one for
each dose and energy combination) to a moist, warm laboratory environment.
This environment was created in a small polyethlene film tent wherein
moisture from a pan of boil ing water was circulated along with air over
the samples. The implanted surfaces of the samples were oriented upward
and moisture from the >100% relative humidity, 60°C air condensed on the
samples as they were being oxidized. After several minutes of exposure
these samples began to show signs of rusting and after several hours they
WE!re all rusted to various degrees. It was observed during this test that
the rust seemed to start at the edges of the test samples where the
9
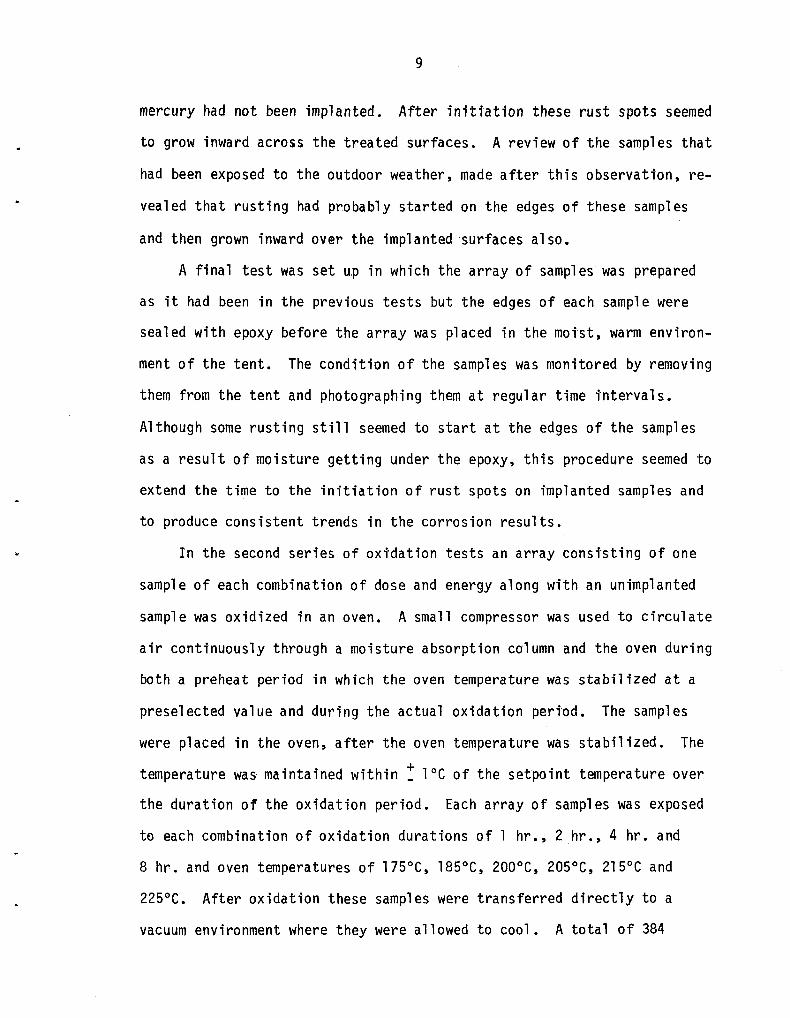
mercury had not been implanted. After initiation these rust spots seemed
to grow inward across the treated surfaces. A review of the samples that
had been exposed to the outdoor weather, made after this observation, re
vealed that rusting had probably started on the edges of these samples
and then grown inward over the implanted surfaces also.
A final test was set up in which the array of samples was prepared
as it had been in the previous tests but the edges of each sample were
sealed with epoxy before the array was placed in the moist, warm environ
ment of the tent. The condition of the samples was monitored by removing
them from the tent and photographing them at regular time intervals.
Although some rusting still seemed to start at the edges of the samples
as a result of moisture getting under the epoxy, this procedure seemed to
extend the time to the initiation of rust spots on implanted samples and
to produce consistent trends in the corrosion results.
In the second series of oxidation tests an array consisting of one
sample of each combination of dose and energy along with an unimplanted
sample was oxidized in an oven. A small compressor was used to circulate
air continuously through a moisture absorption column and the oven during
both a preheat period in which the oven temperature was stabilized at a
preselected value and during the actual oxidation period. The samples
were placed in the oven, after the oven temperature was stabilized. The
temperature was maintained within ~ 1°C of the setpoint temperature over
the duration of the oxidation period. Each array of samples was exposed
to each combination of oxidation durations of 1 hr., 2 hr., 4 hr. and
8 hr. and oven temperatures of 175°C, 185°C, 200°C, 205°C, 215°C and
225°C. After oxidation these samples were transferred directly to a
vacuum environment where they were allowed to cool. A total of 384
10
samples was required to complete this test matrix of four oxidation dura-
tions, at six oven temperatures, for samples having sixteen dose and
energy states.
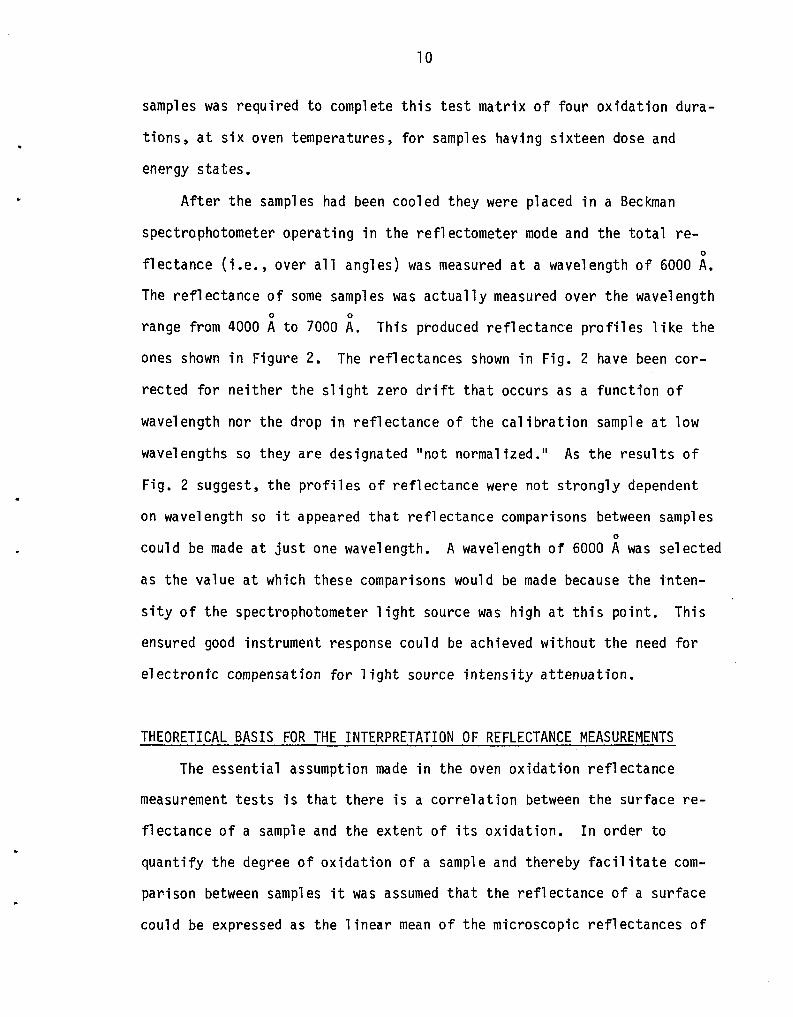
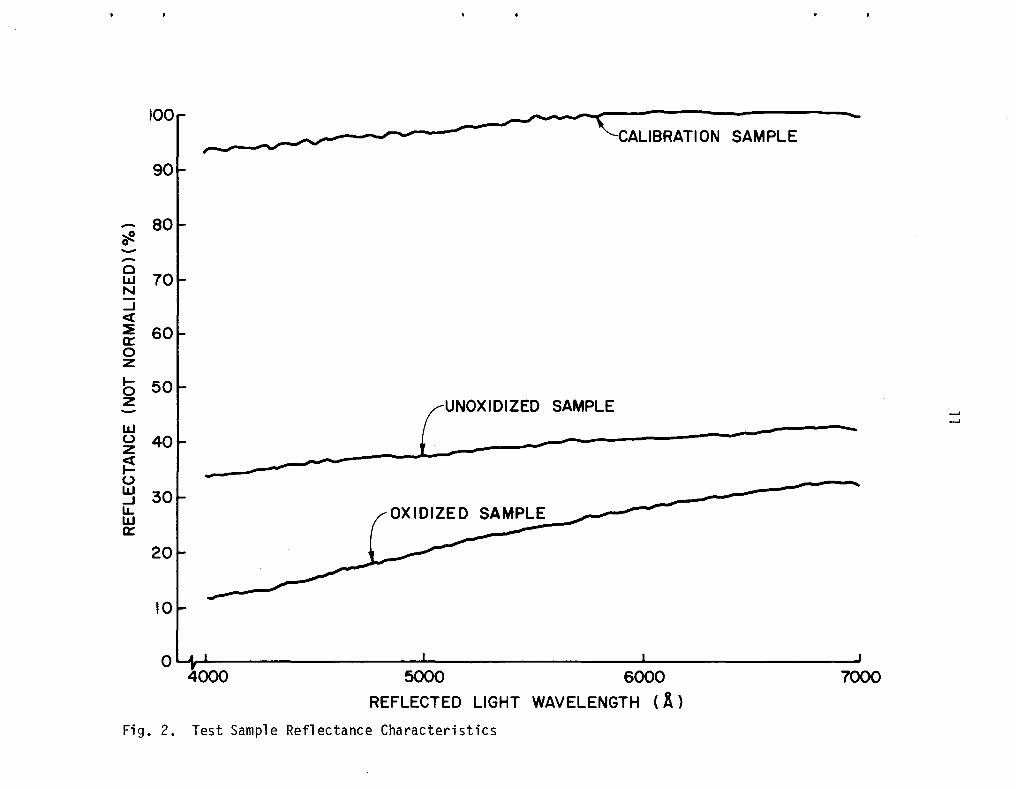
After the samples had been cooled they were placed in a Beckman
spectrophotometer operating in the ref1ectometer mode and the total re-o
f1ectance (i.e., over all angles) was measured at a wavelength of 6000 A.
The reflectance of some samples was actually measured over the wavelengtho 0
range from 4000 A to 7000 A. This produced reflectance profiles 1ike the
ones shown in Figure 2. The reflectances shown in Fig. 2 have been cor-
rected for neither the slight zero drift that occurs as a function of
wavelength nor the drop in reflectance of the calibration sample at low
wavelengths so they are designated "not normalized." As the results of
Fig. 2 suggest, the profiles of reflectance were not strongly dependent
on wavelength so it appeared that reflectance comparisons between sampleso
could be made at just one wavelength. A wavelength of 6000 A was selected
as the value at which these comparisons would be made because the inten-
sHy of the spectrophotometer light source was high at this point. This
ensured good instrument response could be achieved without the need for
electronic compensation for 1ight source intensity attenuation.
THEORETICAL BASIS FOR THE INTERPRETATION OF REFLECTANCE MEASUREMENTS
The essential assumption made in the oven oxidation reflectance
measurement tests is that there is a correlation between the surface re-
f1ectance of a sample and the extent of its oxidation. In order to
quantify the degree of oxidation of a sample and thereby facilitate com
parison between samples it was assumed that the reflectance of a surface
could be expressed as the linear mean of the microscopic reflectances of
100'=CALIBRATION SAMPLE
-90
- 80~0--0
70wN....J<t~ 60a::0z
b 50z [UNOXIDIZED SAMPLE
--I--I
W -u 40 - -z~ ~
uw 30....Ju..wa::
20
10
0'-1l....&.----------.......---------.........---------~4000 5000 6000
REFLECTED LIGHT WAVELENGTH (A)
7000
Fig. 2. Test Sample Reflectance Characteristics

12
a large number of sites making up the sample. The various sites con
sidered to be available on a mercury implanted steel sample are identified
by the following symbols:
FeO - Oxidized steel site
Fe - Unoxidized steel site
Hg - Unoxidized site protected by mercury
HgO - Oxidized site protected by mercury.
This basic assumption leads one to the following expression for the com
posite reflectance of a surface having surface site concentrations (c i )
with ref1ectances (r.).1
r = cFeO r FeO + cFe r Fe + cHg rHg + cHgO rHgOcFeO + cFe + cHg + cHgO
Reflectance measurements made on clean steel (Fe), mercury implanted
(1 )
steel (Hg) and heavily implanted steel that had been oxidized (HgO) sug-
gested that the reflectances of each of these sites was essentially the
same
:: 0.55
Using this result in Eq. (1) one obtains
(2)
or
f = r - r FeOrHg - r FeO
where I rHg" is the common reflectance of all sites that are not oxidized
steel, I rFeO" is the reflectance of a highly oxidized steel surface and
IIfll is the fraction of the surface that is unoxidized steel.

13
The basic rate equation for oxidation of the surface described as
the rate of change of the fraction of the surface that is unoxidized
steel and assuming ample available oxygen isS
(3)
In this equation kf is the rate factor and it is assumed to be described
by an Arrhenius expression5
(4 )
The quantity nAil is the frequency factor, k is the Bol tzmann constant
(8.6 x 10⁻⁵ eV/oK) and "Ea ll is the activation energy associated with the
reaction (eV). The quantity "a " in Eq. 3 is the order of the reaction.
For first order reaction (a = 1) Eq. 3 integrates to
(5)
while non-first order reactions (a f 1) give
( 6)
Equations 5 and 6 then describe the time variation of the fraction of a
surface that is unoxidized in terms of the rate factor (kf ) and the order
of the reaction (a). Inherent in these equations is the assumption that
unoxidized surfaces exhibit the same refl ectance regardl ess of the
mercury dose and energy to which they have been exposed. Reflectance
measurements made on a variety of unoxidized samples support this assump
tion. In order to determine the quantities kf and a samples were oxidized
for vari'ous 1engths of time in an oven operating at a fixed temperature.
Reflectances were measured for each of the oxidized surfaces and these
14
data were used in Eq. 2 to determine the fraction of the surface that re-
mained unoxidized after exposure to the oXidizing environment. The data
were then fitted to either Eq. 5 or Eq. 6 to determine the numerical
values for kf and a pertaining to the specified oxidation temperature and
test sample state. By using the same analysis on other test samples pre
pared at the same mercury dose and energy but oxidized at different oven
temperatures one can, by using Eq. 4, determine the activation energy
(ea ) and frequency factor (A) appropriate to each implanted mercury dose
and implantation energy state of the samples.
RESULTS
Samples exposed to a warm, moist environment showed a rapid tendency
to oxidize if they were not treated using mercury implantation. Evidence
of the beneficial effect of implanted mercury in this oxidizing environ
ment is given in Fig, 3. This figure shows a photographic time history
of the oxidation of an array of the sampl es subjected to the mercury ion
dose and energy combinations mentioned previously. The key in the upper
left hand corner of the figure identifies the mercury ion dose (mA min/cm2)
and energy (eV) treatments pertaining to the samples in the photographs.
A type 304 stainless steel sample and a carbon steel sample that received
no mercury treatment are also identified in the key and shown in each
photograph to facilitate comparison.
Initially (zero hr,) the samples are observed to be qUite uniform in
appearance. The epoxy used to seal the edges of the samples is the principal
abberation evident in this first photograph. The second photograph (after
3 hrs. of exposure) shows evidence of rust on the untreated carbon steel
sample as well as those samples treated at an energy of 200 eV and at

~
STAINLESSiJ[J~G:;JGJGJSTEEL ~~~~EJ
DOSE {mA min/cm2
} =:1_1.1 1128
1155
11" 1133
1ENERGY {eV} 500 500 500 500 500
UNTREATEDfJ~ ~Mr;l~~~:~N EJ EJEJEJ
KEYPRECORROSION IMPLANTATION CONDITIONS ZERO hr 3 hrs
~IiI~I
I-'VI
8 hrs 12 hrs 18 hrs
••I.
23 hrs 27 hrs 33 hrs
Fig. 3 Time History of Carbon Steel Corrosion in Warm, Moist Environment
16
low doses in the 500 eV samples. It is well to point out here that rust
appears in the photographs as a dark spot. Lighter spots that can be
seen on some sampl es appeared to be caused by residue from the condensed
moisture rather than rust. While the first evidence of rust shown in the
sequence of Fig. 3 is seen three hours after the test started, the first
appearance of rust on the untreated sample was actually observed and
photographed 15 min. after the start of the test. At this time, rust was
not visible on any of the other samples. As time progressed during the
test, additional rust spots began to appear on samples subjected to the
greater doses and energies. The rust spot that appeared on the 11
mA min/cm2 at 1000 eV sample after 8 hours of exposure is worthy of
mention. It appeared that this as well as many other rust spots appearing
on the treated samples actually originated at an edge where the moisture
got under the epoxy and reached an untreated region. This was not the
case with the untreated sample however because,as the three hour photo
graph shows, rust was initiated at various points over its entire surface.
Many of the photographs seem to suggest that while a rust spot may get
started at the edge of a treated sample its growth tends to be stopped
after a short period of time. This is true for example of the 11/1000
sample which shows first evidence of a rust spot at 8 hours but no signifi
cant growth of this spot through the remaining 25 hours of the test.
After 27 to 33 hours even the 33/1000 and 33/500 samples show small spots
of rust (again originating near an edge). By comparing the appearance of
the surfaces of these samples with that of the stainless steel one (upper
left side of array) it is apparent that the treated carbon steel samples
retai~n their aesthetically pleasing metall ic appearance. At the 33 hour
point it is also apparent that the untreated sample is by contrast
completely rusted over.
17
Samples oxidized in the dry, oven environment showed the same general
trends that were found in the moist, warm oxidation tests. That is, in-
creases in mercury ion dose and energy tended to effect slower oxidation
rates. This trend was apparent to the naked eye. Samples receiving the
greater doses and energies appeared to exhibit more metall ic, shi'ny sur
faces compared to the untreated surfaces which teneded to be a darker,
brownish-red color. Optical reflectance measurements showed this same
trend as a revi ew of the raw refl ectance data (Appendix B) will reveal.
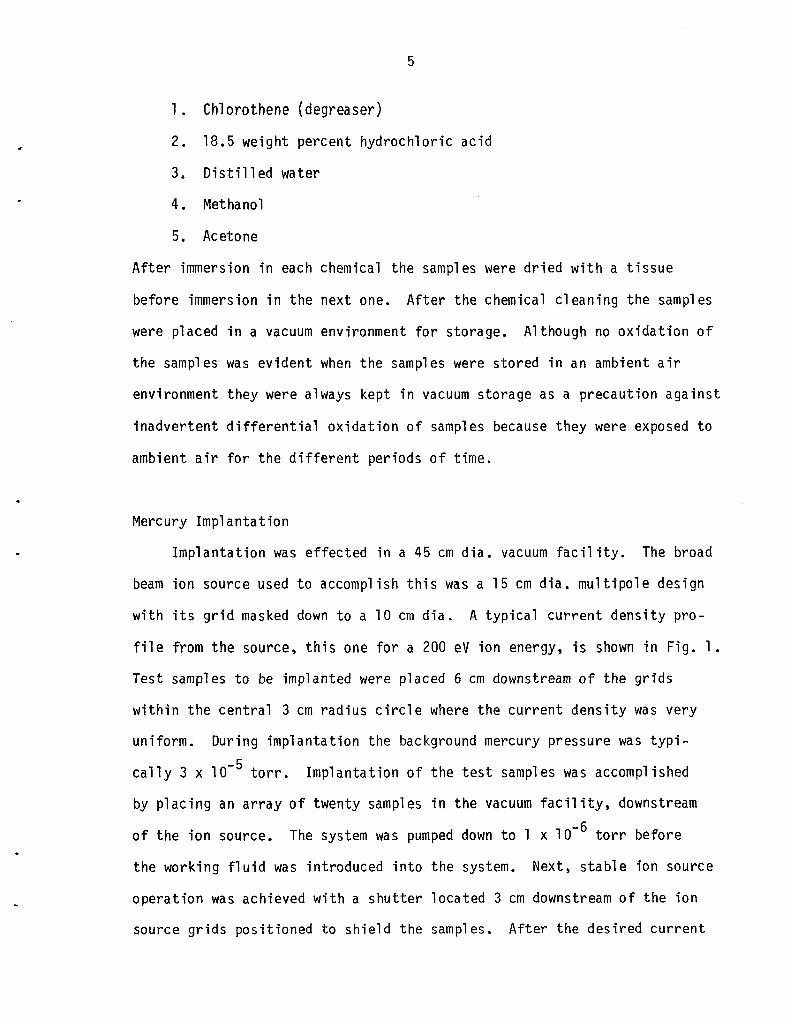
Analysis of these data using the procedure outlined previously
showed this same trend toward lower oxidation rates with dose and energy
through the rate factor kf • This factor was also found to be dependent
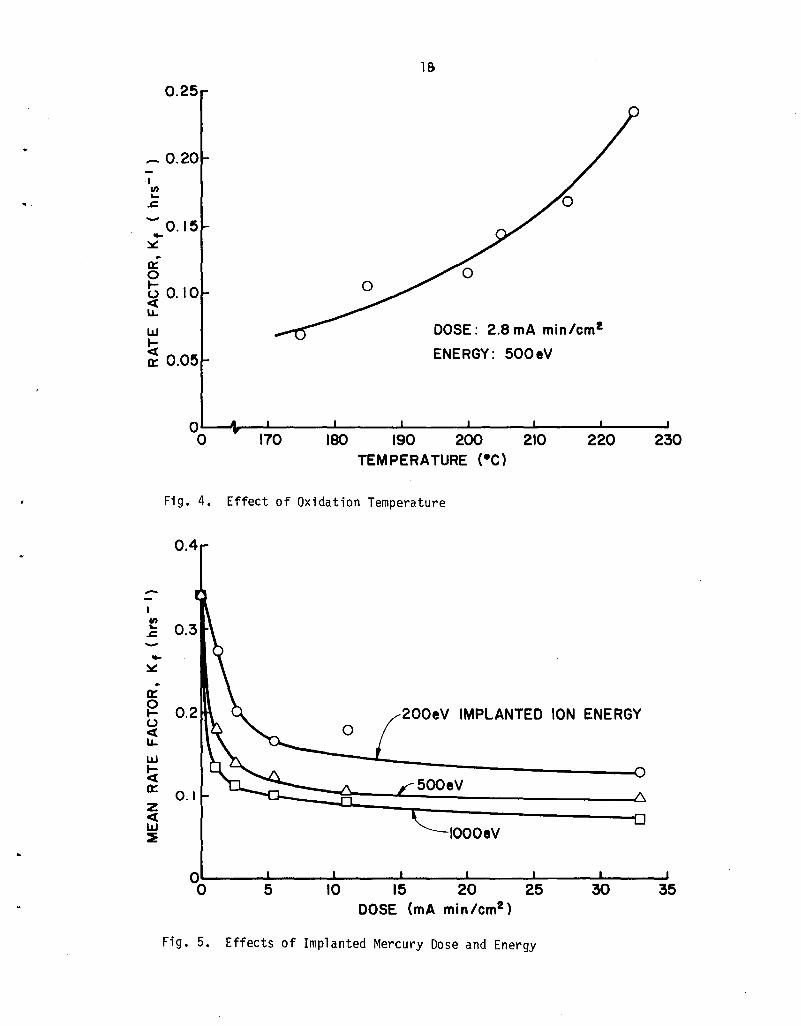
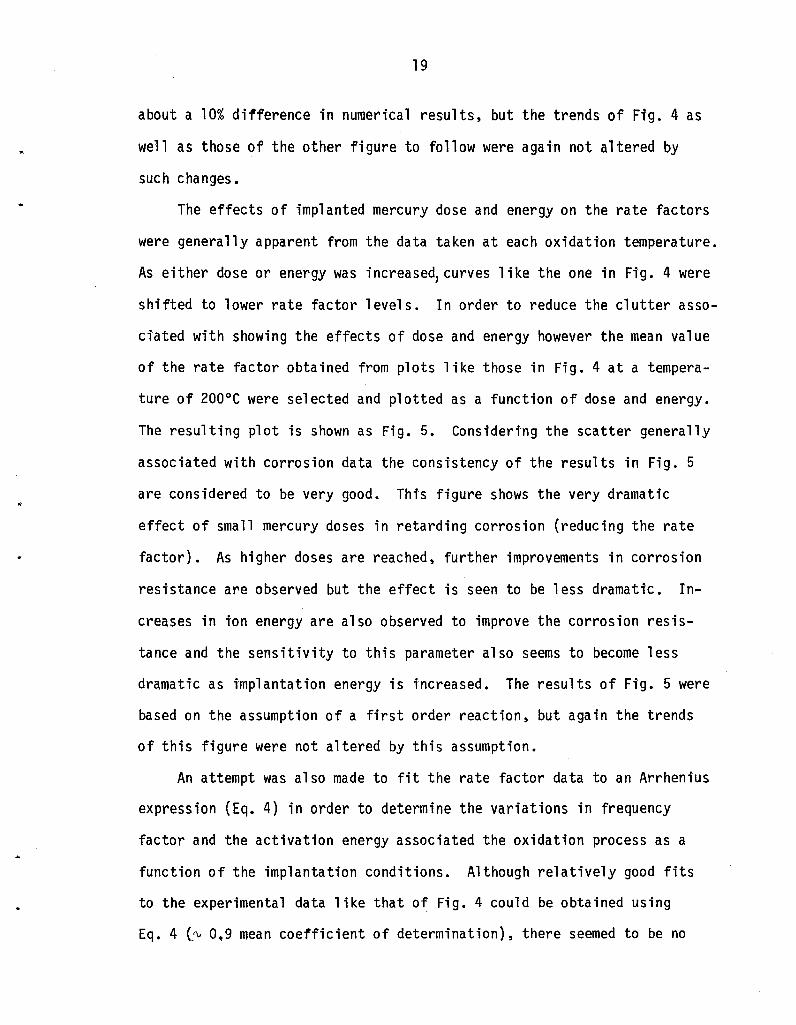
on the temperature at which the oxidation was effected. Figure 4 shows
for exampl e the variation in rate factor with oxidation temperature for
a typical surface treatment (2.8 rnA min/cm2 at 500 eV) assuming a first
order reaction. Typically rate factor results 1ike those of Fig. 4 which
were based on the first order reaction seemed to fit the Arrhenius
Equation (Eq. 4). Therefore all results represented here are based on
the assumption that the reaction is first order. It is noteworthy however
that when orders between zero and two were assumed in the data analysis
the trends shown in Fig. 4 remained unaltered. It should be pointed out
that analysis of the data in Fig. 4 were accomplished by using 0.024 aso
the reflectance of a rusted site at 6000 A (r FeO ) and 0.546 as the re-o
flectance of a metallic site at 6000 A (rHg ) in Eq. 2. These values were
selected as typical of these two surface extremes based on reflectance
measurements made on several highly oxidized and several unoxidized
samples. Using values of these constants covering the measured ranges of
variability (zero to 0.1 for r FeO and 0.5 to 0.6 for r Hg ) in Eq. 2 yielded
1&
0.25
.,
_ 0.20
- 0.15..~
~
a::ot; 0.10«u..w~a:: 0.05
DOSE: 2.8 rnA min /em!
ENERGY: 500 eV
00 170 ISO 190 200 210 220 230
TEMPERATURE (·e)
Fi g. 4. Effect of Oxidation Temperature
0.4
--Ien~
~-..~
~
a::0
200eV IMPLANTED ION ENERGY....u 0«u..w~a:: 0.1z«w 1000eV~
00 5 10 15 20 25 30
DOSE (rnA min/em2 )
Fi g. 5. Effects of Implanted Mercury Dose and Energy
19
about a 10% difference in numerical results, but the trends of Fig. 4 as
well as those of the other figure to follow were again not altered by
such changes.
The effects of implanted mercury dose and energy on the rate factors
were generally apparent from the data taken at each oxidation temperature.
As either dose or energy was increased, curves like the one in Fig. 4 were
shifted to lower rate factor levels. In order to reduce the clutter asso
ciated with showing the effects of dose and energy however the mean value
of the rate factor obtained from plots like those in Fig. 4 at a tempera
ture of 200°C were selected and plotted as a function of dose and energy.
The resulting plot is shown as Fig. 5. Considering the scatter generally
associated with corrosion data the consistency of the results in Fig. 5
are considered to be very good. This figure shows the very dramatic
effect of small mercury doses in retarding corrosion (reducing the rate
factor). As higher doses are reached, further improvements in corrosion
resistance are observed but the effect is seen to be less dramatic. In
creases in ion energy are also observed to improve the corrosion resis
tance and the sensitivity to this parameter also seems to become less
dr~matic as implantation energy is increased. The results of Fig. 5 were
based on the assumption of a first order reaction, but again the trends
of this figure were not altered by this assumption.
An attempt was also made to fit the rate factor data to an Arrhenius
expression (Eq. 4) in order to determine the variations in frequency
factor and the activation energy associated the oxidation process as a
function of the implantation conditions. Although relatively good fits
to the experimental data like that of Fig. 4 could be obtained using
Eq. 4 (~ 0.9 mean coefficient of determination), there seemed to be no
20
consistent trend in activation energies and frequency factors with tm-
planted ion dose and energy. It is considered probable that trends were
not apparent because of scatter in the reflectance data and the lack of
a large enough statistical base to minimize the mean scatter. The mean
activation energy taken from data for all implanted samples was 0.4 eV at
a standard deviation of 0.08 eV.
Additional Results
To gain some understanding of the mechanism by which mercury might
be enhancing the corrosion resistance of carbon steel, surface analysis
of two oxidized samples (one implanted and one not implanted) were under
taken. Electron Chemical Surface Analysis (ESCA) was selected as the
most promising tool for making the investigation. It was found that it
is difficult to measure the mercury concentration in a sample because the
dominant mercury signal occurs at a frequency close to a strong iron
signal. The oxygen profile with depth was measured in these samples, and
no significant difference in the oxygen depth profil es for the sampl es
obtained with and without mercury implantation was apparent from the
measurements made.
CONCLUSION
The corrosion resistance of carbon steel can be enhanced through the
process of low energy mercury implantation from broad beam ion sources.
Ion doses of the order of 10 rnA min/crn2 at implantation energies in the
range of a few hundred to one thousand electron volts are sufficient to
produce significant enhancement. In a moist, warm environment the onset
of rusting can probably be extended from ~ 15 min. for a untreated
sampl e to ~ 30 hrs. for one impl anted at a dose of 33 rnA min/cm2 with
21
1000 eV mercury ions. This represents an increase of more than two orders
of magnitude in the comparative durability of treated versus untreated
steel in a very hostile environment. In less hostile environments the
increased useful lifetime of ion implanted steels could be phenomenal.
Additional research is needed to demonstrate protective effects that
might be introduced with other implanted species. The adverse effects
of abrasion on the beneficial effects of implanted mercury also needs to
be studied.

..
22
REFERENCES
1. Day, Brian P., private communication, Royal Aircraft Establishment,
Farnborough, Hants, England, Jan. 1979.
2. Anon., ilIon Implantation as a New Surface Treatment Technology,"
U.S. Department of Commerce Report AD/A-070-379, 1979.
3. Dearnaley, G., liThe Use of Ion Beams in Corrosion Science,1I appears
in Applications of Ions Beams to Metals, (Picraux, EerNisse and
Voak, eds.) pp. 64f, Plenum Press, 1974.
4. Hirvonen, J. K, Treatise on Materials Science and Technology, Chaps 1
and 6, Academic Press, 1980.
5. Laidler, K. J., Chemical Kinetics, Chaps 1 and 3, McGraw-Hill, 1965 .
23
APPENDIX A
The Qualities of and Equipment for Ion Implantation
Ion implantation is a relatively new technology that holds considerable
promise in the area of surface treatments of materials. In particular the
corrosion resistance, surface hardnesses and fatigue 1ifetimes of struc-
tura1 material s have been improved by us ing thi s process. Some of the
relative advantages of this technology over other conventional surface
treatment processes are: 2,4
• Almost any ion species can be implanted into almost any solid
material. Differences in physical properties which prevent normal
alloying or plating operations are not generally limited with
thts process.
• Ion implantation is a low-temperature process. It can often be
added to the end of a production line without affecting existing
operations. It is in fact possible to hold the base material
temperature at almost any value considered desirable from other
considerations during implantation.
• The surface of finished products can be treated without introducing
significant dimensional changes and without changing bulk proper-
ties.
• The ion dose and energy can be easily controlled electrically by
signals applied to the ion source.
• Novel nonequilibrium structures and metallurgical phases with
properties that cannot be duplicated in bulk material can be
produced at the surface.

•
24
• Ion implantation creates no problems of disposal of w~ste products,
as does electroplating.
• The potential for reduct ion in the consumption of scare meta11 ic
el ements such as chromium is great because very small doses can
be applied and accurate control can be achieved in applying them.
• Combinations of ions can be implanted in essentially any proportion
so various beneficial effects associated with several alloytng
species can be achieved.
• It is possible to sputter clean a surface using inert ions before
implanting. Because these processes are conducted in vacuo,
contamination during the process is minimized. Further, the
absence of a discontinuous interface between the implanted
surface layer and the bulk material leads to excellent adhesion
of the implanted layer.
The major drawback of the implantation technology has been its re
latively high cost. This high cost has been a direct consequence of the
fact that high purity implanters developed for the semiconductor industry
have been used for most experiments conducted to date. The present re
search shows that similar beneficial corresion resistance effects can be
produced by using the considerably less costly broad beam ion sources.
This makes ion implantation appear much more attractive as a surface
treatment technique than it has heretofore been. The following table
proVides a comparison of the characteristics of the multiaperture, broad
beam ion source and the single aperture high purity ion implanter.
25
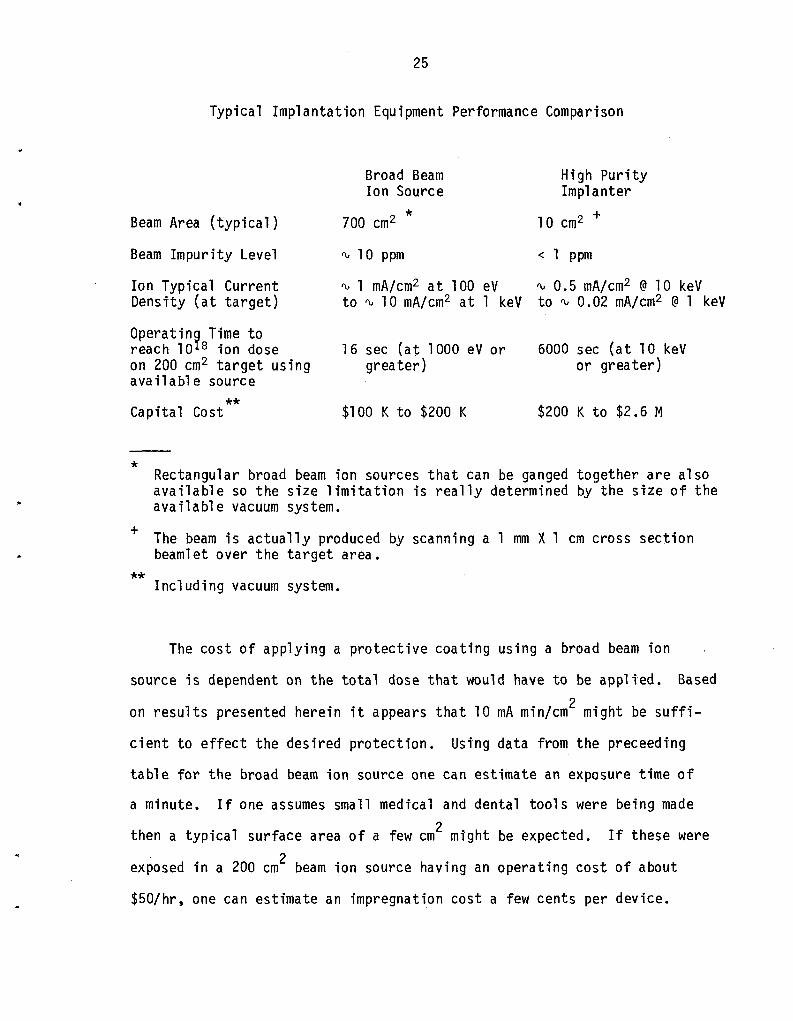
Typical Implantation Equipment Performance Comparison
IV 1 mA/cm2 at 100 eV IV 0.5 mA/cm2 @10 keVto IV 10 mA/cm2 at 1 keV to IV 0.02 mA/cm2 @1 keV
Beam Area (typical)
Beam Impurity Level
Ion Typical CurrentDensity (at target)
Operating Time toreach 1018 ion doseon 200 cm2 target usingavailable source
**Ca pita1 Co st
*
Broad BeamIon Source
*700 cm2
IV 10 ppm
16 sec (at 1000 eV orgrea ter)
$100 K to $200 K
High PurityImplanter
+10 cm2
< 1 ppm
6000 sec (at 10 keVor greater)
$200 K to $2.6 M
Rectangular broad beam ion sources that can be ganged together are alsoava ilabl e so the size 1imita tion is really determined by the size of theavailable vacuum system.
+ The beam is actually produced by scanning a 1 mm X1 cm cross sectionbeamlet over the target area.
** Including vacuum system.
The cost of applying a protective coating using a broad beam ion
source is dependent on the total dose that would have to be applied. Based
on results presented herein it appears that 10 rnA min/cm2 might be suffi
cient to effect the desired protection. Using data from the preceeding
table for the broad beam ion source one can estimate an exposure time of
a minute. If one assumes small medical and dental tools were being made
then a typical surface area of a few cm2 might be expected. If these were
exposed in a 200 cm2 beam ion source having an operating cost of about
$50/hr, one can estimate an impregnation cost a few cents per device.

•
26
One would expect this cost to come down in the future as the cost of ion
beam equipment decreases. By contract the cost of doing the same job in
a high purity implanter would be about one hundred times this amount .

..
•
27
APPENDIX ~
REFLECTANCE MEASUREMENTSof
MERCU~Y IMPLANTED CAR~DN STEELOXIDIZED IN A HOT, DRY ENVIRONMENT
IMPLANTED IONDOSE (rnA min/em2 )
HlnANTED ION
(""~ENERGY (eV)
OXIDATION TIr1E 0 1.1 2.8 5.5 11 33
DXI DATION TDIP. (·C)~ - 200 500 1000 200 500 1000 200 500 1000 200 500 1000 200 500 1000
1 .075 .238 .252 .318 .238 .284 .339 .262 .307 .357 .245 .362 .367 .306 .318 .387
2 .044 .219 .191 .253 .203 .257 .276 .213 .248 .290 .209 .290 .325 .268 .2911 .348225
4 .054 .123 .215 .253 .213 .225 .258 .239 .248 .303 .207 .292 .303 .243 .310 .321
8 .097 .024 .1611 .221 .179 .205 .244 .197 .209 .265 .212 .253 .271 .216 .279 .297
1 .193 .306 .267 .359 .25e .297 .376 .289 .341 .393 .2116 .362 .3e6 .338 .373 .413
2 .114 .2e5 .294 .336 .2e2 .319 .362 .304 .340 .371 .263 .329 .383 .324 .366 .415215
4 .200 .199 .264 .30e .255 .301 .324 .270 .302 .356 .197 .321 .343 .322 .331 .371
8 .152 .185 .251 .256 .255 .290 .336 .247 .281 .31e .242 .312 .330 .291 .319 .371
1 .223 .247 .274 .392 .248 .392 .355 .327 .370 .396 .266 .421 .412 .353 .421 .443
2 .214 .274 .277 .327 .242 .304 .343 .292 .364 .298 .276 .356 .372 .342 .376 .425205
4 .175 .229 .274 .312 .251 .320 .342 .303 .335 .346 .252 .365 .352 .313 .332 .403
8 .163 .226 .264 .310 .277 .302 .339 .2e6 .351 .389 .321 .355 .357 .316 .371 .378
1 .255 .293 .319 .349 .319 .401 ,446 .355 .401 .443 .334 .439 .458 .401 .431 .472
2 .301 .269 .331 .369 .299 .353 .383 .324 .392 .413 .311 .391 .408 .351 .403 .451200
4 .231 .286 .299 .380 .315 .373 .375 .313 .382 .420 .268 .397 .427 .360 .402 .449
8 .250 .250 .270 .344 .354 .324 .349 .329 .379 .379 .305 .384 .408 .334 .421 .458
1 .292 .346 .407 .446 .388 .439 .468 .370 .468 .507 .4511 .478 .498 .488 .493 .546
2 - .36~ .354 .381 - .393 .432 .366 .312 .405 .315 .447 .4111 .391 .398 .481185
4 .237 .285 .319 .3110 .294 .319 .382 .351 .382 .309 .322 .391 .429 .373 .418 .459
8 .253 .286 .2e9 .345 .261 .356 .384 .282 .390 .463 .316 .446 .437 .366 .422 .458
1 - .377 .434 .442 - .455 .463 .3113 .464 .492 .450 .455 .475 .465 .510 .533
2 - .359 . 391 .415 - .427 .451 .406 .4611 .459 .414 .462 .449 .440 .475 . . 516 1
1754 - .339 .383 .402 - .448 .475 .401 .438 .476 .357 .422 .454 .427 .499 .494
8 - .279 .325 .380 - .378 .388 .314 .384 .409 .321 .365 .378 .355 .412 .433
•
28
DISTRIBUTION LIST
National Aeronautics and Space AdministrationWashington, DC 20546Attn: RS/Mr. Del Williams, III
RTS-6/ Mr. Wayne HudsonRTS-6/ Mr. Jerome MullinMT/ Mr. Ivan BekeyET-6/ Mr. Ed Sullivan
National Aeronautics and Space AdministrationLewis Research Center21000 Brookpark RoadCleveland, OH 44135Attn: Research Support Procurement Section
Mr. B. Bane, MS 501-11Technology Utilization Office, MS 3-19Mr. S. Felder, MS 7-3Report Control Office, MS 5-5Library, MS 60-3Mr. N. Musial, MS 500-113Dr. M. Goldstein, Chief Scientist, MS 5-3Mr. D. Petrash, MS 501-5Mr. T. Cochran, MS 501-8Mr. R. Finke, MS 77-4Mr. B. Banks, MS 501-7Mr. D. Byers, MS 501-7Mr. W. Kers1ake, MS 501-7
Office of Naval Research800 N. Quincy StreetArlington, VA 22217Attn: Dr. Jerry Smith, Code 472
National Aeronautics and Space AdministrationMarshall Space Flight CenterHuntsville, AL 35812Attn: Mr. John Brophy
NASA Scientific and TechnicalInformation FacilityPO Box 8757Baltimore, MD 21240Attn: Accessioning Dept.
Copies
11111
511121111111
30
1
1
1
•
•
...
29
Case Western Reserve University10900 Euclid AvenueCleveland, OH 44106Attn: Dr. J. A. Mann Jr. (Chem Englg-A.W. Smith Bldg.)
Dr. J. F. Wallace (Met. &Mt 1 1. Sci.-White Bldg.)Dr. W. H. Ko (Englg Design-Bingham Bldg.)Dr. D. F. Gibbons (Bio. Med.Eng lg.-01in Bldg.)
Royal Aircraft EstablishmentSpace DepartmentFarnborough, HantsENGLANDAttn: Dr. D. G. Fearn
Mr. B. P. Day
Jet Propulsion Laboratory4800 Oak Grove DrivePasadena, California 91102Attn: Technical Library
Mr. Eugene PawlikDr. Graeme Aston
Electro-Optical Systems, Inc.300 North HalsteadPasadena, California 91107Attn: Dr. R. Worlock
Mr. E. JamesMr. W. Ramsey
TRW Inc.TRW SystemsOne Space ParkRedondo Beach, California 90278Attn: Dr. M. Huberman
Mr. H. OgawaMr. Sid Zafran
National Aeronautics and Space AdministrationAmes Research CenterMoffett Field, California 94035Attn: Technical Library
National Aeronautics and Space AdministrationLangley Research CenterLangley Field StationHampton, Virginia 23365Attn: Technical Library
1111
11
111
111
111
1
1
•
30
Hughes Research Laboratories3011 Malibu Canyon RoadMalibu, California 90265Attn: Mr. J. H. Molitor
Dr. R. L. PoeschelDr. Jay HymanDr. J. R. BeattieDr. W. S. Williamson
Princeton UniversityPrinceton, NJ 08540Attn: Mr. W. F. Von Jaskowsky
Dean R. G. JahnDr. K. E. C1 ark
Bell Laboratories600 Mountain AvenueMurray Hill, NJ 07974Attn: Dr. Edward G. Spencer
Dr. Paul H. Schmidt
Sandia LaboratoriesMail Code 5743Albuquerque, NM 87115Attn: Mr. Ralph R. Peters
Ion Tech, Inc .P. O. Box 13881807 E. MulberryFort Collins, Colorado 80522Attn: Dr. Gerald C. Isaacson
EG &G IdahoP. O. Box 1625Idaho Falls, Idaho 83401Attn: Dr. G. R. Longhurst, TSA-l04
11111
111
11
1
1
1
..
Mr. Curtis HaynesTektronix Inc.M.S. 50-431P. O. Box 500Beaverton, Oregon 97077 1
Mass. Inst. of Tech.Lincoln LaboratoryP. O. Box 73Lexington, Mass. 02173Attn: Dr. H. I. Smith
l
•
31
Mr. Jack Weigand17920 South Wato1oo Rd.Cleveland, OH 44119
Kent State UniversityCanton, Ohio 44720Attn: Dr. Ge1erinter
Dr. N. Spielberg
TME Corp.16 Flagstone DriveHudson, NH 03051Attn: Mr. H. W. Jesse
Technics Corp.7950 C1iny Ct.Springfield, VA 22153Attn: Mr. Joel Weiner
Service du Confinement des PlasmaCentre d'Etudes Nuc1eaires - F.A.R.B. P. 692260 Fontenay-aux-RosesFRANCEAttn: Dr. J. F. Bona1
International Business Machines CorporationThomas J. Watson Research CenterP. O. Box 218Yorktown Heights, NY 10598Attn: Dr. Jerome J. Cuomo
Dr. James M. E. Harper
IBM East FishkillD/42K, Bldg. 300-40FHopewell Junction, NY 12533Attn: Dr. Chalres M. McKenna
Ion Beam Equipment, Inc.P. O. Box 0Norwood,NJ 07648Attn: Dr. W. Laznovsky
Optic Electronics Corporation11477 Pagemi11 RoadDallas, TX 75243Attn: Bill Hermann, Jr.
Circuits Processing Apparatus, Inc.725 Kifer RoadSunnyvale, CA 94086Attn: Spencer R. Wilder
2
11
1
1
1
11
1
1
1
1
•
32
Physicon Corporation221 Mt. Auburn StreetCambridge, MA 02138Attn: H. von Zweck
Texas Instruments, Inc.P. O. Box 225012Dallas, TX 35265Attn: Mr. Larry Rehn, MS34
Commonwealth Scientific Corporation500 Pendleton StreetAlexandria, VA 22314Attn: George R. Thompson
Veeco Instruments Inc.Terminal DrivePlainview, NY 11803Attn: Norman Williams
eve Products525 Lee RoadP. O. Box 1886Rochester, NY 14603Attn: Mr. Georg F. Garfield, Jr.
Lawrence Livermore Lab.P. O. Box 808Livermore, CA 94550Attn: Dr. Paul Drake, Mail Code L-437
Department of Electrical andComputer Engineering
New Mexico State UniversityLas Cruces, NM 88003Attn: Dr. Robert McNeil
1
1
1
1
1
