past and future are symbolised in its two glass bulbs, a
TRANSCRIPT


The Hour Glass, that instrument of old.Past and future are symbolised in its two glass bulbs, between which the present flows.A trickle of sand,a linear passing of time.

ContentsCorporate Directory 03
Board Of Directors 04
Key Executives 08
Financial Highlights 10
Chairman’s Statement 13
Corporate Governance 16
Financial Statements 27
Statistics Of Shareholdings 83
Operations Directory 86

03
DIRECTORSDr Henry Tay Yun Chwan Executive Chairman Dato’ Dr Jannie Chan Siew Lee Executive Vice Chairman Dr Kenny Chan Swee Kheng Group Managing DirectorMr Michael Tay Wee Jin Executive DirectorMr Owen Phillimore Howell-Price Independent Non-executive DirectorMr Robert Tan Kah Boh Independent Non-executive DirectorMr Jason Choo Choon Wai Independent Non-executive DirectorMr Philip Eng Heng Nee Independent Non-executive DirectorMr Kuah Boon Wee Independent Non-executive DirectorMr Demierre Pascal Guy Chung Wei Independent Non-executive Director
AUDIT COMMITTEEMr Philip Eng Heng Nee ChairmanMr Owen Phillimore Howell-Price Mr Jason Choo Choon WaiMr Kuah Boon Wee
REMUNERATION COMMITTEEMr Robert Tan Kah Boh ChairmanMr Owen Phillimore Howell-Price Mr Philip Eng Heng Nee Mr Demierre Pascal Guy Chung Wei
COMPANY SECRETARYMs Christine Chan Meng Yook
REGISTERED OFFICE302 Orchard Road #11-01 Tong BuildingSingapore 238862Telephone: (65) 6787 2288Facsimile: (65) 6732 8683Email address: [email protected] address: www.thehourglass.comCo. Registration No.: 197901972D
SHARE REGISTRARBoardroom Corporate & Advisory Services Pte. Ltd. 50 Raffles Place Singapore Land Tower #32-01Singapore 048623
AUDITORSErnst & Young LLPPublic Accountants and Certified Public Accountants Singapore Partner-in-charge: Mr Tan Chian Khong(Since financial year ended 31 March 2011)
PRINCIPAL BANKERSDBS Bank Ltd Oversea-Chinese Banking Corporation Limited The Hongkong and Shanghai Banking Corporation Limited United Overseas Bank Limited
SOLICITORSAllen & Gledhill LLP Rodyk & Davidson LLP
corPorATe direcTory

04 the hour glass limited annual report 2011
boArd of direcTors
Seated:Dato’ Dr Jannie Chan
Standing From left:Dr Kenny Chan, Mr Robert Tan, Dr Henry Tay, Mr Philip Eng, Mr Jason Choo, Mr Owen Price, Mr Kuah Boon Wee,Mr Michael Tay, Mr Pascal Demierre

05
DR HENRY TAY YUN CHWANEXECUTIVE CHAIRMANDr Henry Tay was appointed Executive Chairman of The Hour Glass Limited in October 1987, having served as an Executive Director since 11 August 1979.
Dr Tay graduated with a MBBS (Honours) from Monash University, Melbourne and prior to co-founding The Hour Glass in 1979, was both a Medical Practitioner as well as partner in Lee Chay & Co., one of Singapore’s earliest watch retail companies. From 1986 to 2001, Dr Tay was Executive Chairman of a group of companies whose businesses were in the distribution and retail of Burberry in the Asia Pacific region. Dr Tay is an Independent Director and Chairman of the audit committee of UOB Kay Hian Holdings Limited. He also holds directorships in several private companies focused on investments and real estate development. Dr Tay served as a Committee Member of the Community Chest from 1992 and was appointed Vice Chairman from 1994 to 2004. An active fundraiser for various charitable organizations, Dr Tay has received many awards including the Friends of MCDS (Ministry of Community Development and Sports) Award in 2002 and the President’s Social Service Award in August 2005.
Dr Tay was the Founder President of the Hong Kong - Singapore Business Association from 1994 to 2000 and is presently its Honorary President. He has also served as a board member of the Singapore Tourism Board, and Patron of the Singapore Kennel Club.
boArd of direcTors
DATO’ DR JANNIE CHAN SIEW LEE EXECUTIVE VICE CHAIRMANDato’ Dr Jannie Chan was appointed to the Board of The Hour Glass Limited and served as its Managing Director since co-founding it on 11 August 1979, up till 31 March 2004. She was appointed Executive Vice Chairman on
1 April 2004 and continues to play an active role in the development of the Company.
In recogni t ion of her outs tanding profess iona l achievements, Dato’ Dr Chan was the recipient of the 2004 Monash University Distinguished Alumni Award, an institution from which she obtained both a Bachelor of Science degree in Physiology (Honours) and a Masters of Science degree in Pharmacology. She was conferred the Darjah Sultan Ahmad Shah Pahang (DSAP) which carries the title Dato’ in 2003.
Dato’ Dr Chan is the President of the Singapore Retailers Association, Chairman of The Retail Academy of Singapore and Chairman of the Retail Industry Skills and Training Council. She serves as the President of the Asean Business Forum, Chairman of the Commonwealth Business Women Leaders Network, the first female Executive Board Member of the Commonwealth Business Council and Founder President of the International Women’s Forum in Singapore.
She is also the Founder and current President of the Women’s Business Connection. She was appointed a member of the Business Advisory Council of the United Nations Economic and Social Commission for Asia and the Pacific (“UNESCAP”) in 2004. UNESCAP’s mandate is to foster cooperation between its members in order to promote economic and social development in the Asia Pacific region. Having previously served on the Women’s Leadership Board of the John F. Kennedy School of Government, Harvard University and the United Nations Office for Project Services, she was named as one of the 50 Leading Women Entrepreneurs of the World in 1997. In 2009, Dato’ Dr Chan was the first woman to receive Enterprise Asia’s APEA Woman Entrepreneur of The Year Award.
A tireless worker for charitable causes and the Arts, she has raised significant sums for the Community Chest of Singapore, the Autism Resource Centre, the Canossian School for the Hearing Impaired, the Ong Teng Cheong Music Fund and the Timor-Leste Foundation.

06 the hour glass limited annual report 2011
DR KENNY CHAN SWEE KHENG GROUP MANAGING DIRECTORDr Kenny Chan joined the Board of The Hour Glass Limited on 1 April 2004 when he was the Managing Director of the Company. He joined the Company as Group Chief Operating Officer in 2002.
A graduate of Monash University with a MBBS (Honours), Dr Chan has over 20 years of experience in the luxury goods industry. Prior to his joining The Hour Glass, he was the Managing Director of Burberry Singapore and Burberry Australia, companies that formed part of a group that was the exclusive distributors and agents of Burberry, covering a territory that stretched from Korea to New Zealand.
Dr Chan also served as a Council Member for the Singapore Retailers Association from 2000 to 2002.
MR MICHAEL TAY WEE JINEXECUTIVE DIRECTORMr Michael Tay was appointed as an Executive Director of The Hour Glass Limited on 15 August 2005, having joined the Company in January 1999 as its Business Re-Engineering Manager.
Mr Tay has developed extensive watch industry experience having headed multiple facets of The Hour Glass’ businesses from specialty watch manufacturing, global marketing and distribution to greenfield retail development. He is a member of the international advisory board of Harry Winston Rare Timepieces, a member of the jury for the Grand Prix d’horlogerie de Geneve as well as a member of the Cultural Committee and fine watch ambassador for the Foundation de la Haute Horlogerie. Mr Tay also serves on the board of the Singapore Tyler Print Institute and Mercy Relief, an international humanitarian development and relief organisation located in Singapore. Mr Tay graduated from Oxford Brookes University, United Kingdom with a First Class (Honours) in Business and International Management.
MR OWEN PHILLIMORE HOWELL-PRICEINDEPENDENT NON-EXECUTIVE DIRECTORMr Owen Price was appointed to the Board of The Hour Glass Limited on 11 April 1994. Mr Price was the Chairman of the Company’s Remuneration Committee until he stepped down to be a member on 1 April 2011. He also serves as a member of the Audit Committee. He is an independent Director of the Company.
Mr Price was the General Counsellor in Asia to C.I.E.S., the Paris based International Business Forum. He was formerly a director and CEO of Woolworths Ltd, Australia, Managing Director of Dairy Farm International Holdings Limited, and a director of The Hong Kong Land Company Ltd and DSG International Ltd, and an alternate director of Jardine Cycle & Carriage Limited.
MR ROBERT TAN KAH BOH INDEPENDENT NON-EXECUTIVE DIRECTORMr Robert Tan was appointed to the Board of The Hour Glass Limited on 18 November 1999. Mr Tan was appointed as Chairman of the Company’s Remuneration Committee on 1 April 2011. During the financial year, he was the Chairman of its Audit Committee and was also a member of its Remuneration Committee. He is an independent Director of the Company.
Mr Tan was with an international public accounting firm for 28 years serving as a senior partner before his retirement. Mr Tan is a member of the Institute of Certified Public Accountants in Singapore and was a Fellow of the Institute of Chartered Accountants in England and Wales.
boArd of direcTors

07
MR KUAH BOON WEEINDEPENDENT NON-EXECUTIVE DIRECTOR Mr Kuah was appointed to the Board of The Hour Glass Limited on 1 April 2011 as an independent Director and serves as a member of the Company’s Audit Committee. Mr Kuah is the Group Chief Executive Officer of MTQ Corporation Limited. He had served as CEO for South East Asia and Singapore Terminals as well as Chief Financial Officer of PSA International Pte Ltd. He had also served as CFO for ST Engineering Ltd. Mr Kuah is a qualified chartered accountant from the ICAEW and graduated with a Bachelor of Engineering degree from Imperial College of Science and Technology.
MR PHILIP ENG HENG NEEINDEPENDENT NON-EXECUTIVE DIRECTORMr Philip Eng joined the Board of Directors of The Hour Glass Limited on 1 October 2009 as an independent Director. Mr Eng was appointed as the Chairman of its Audit Committee on 1 April 2011. He is also a member of its Remuneration Committee. He is the Non-executive Chairman of mDR Limited and Frasers Centrepoint Asset Management Ltd. He is also Executive Deputy Chairman of Hup Soon Global Corporation Ltd and a director of several public and private companies. In addition, he is Singapore’s Ambassador to Greece and High Commissioner to Cyprus. Prior to this, Mr Eng spent 23 years with the Jardine Cycle & Carriage Group before retiring in February 2005 as Group Managing Director.
Mr Eng graduated from the University of New South Wales with a Bachelor of Commerce in Accountancy and is an Associate Member of the Institute of Chartered Accountants in Australia.
MR DEMIERRE PASCAL GUY CHUNG WEI INDEPENDENT NON-EXECUTIVE DIRECTOR Mr Demierre was appointed to the Board of The Hour Glass Limited on 1 April 2011 as an independent Director and serves as a member of the Company’s Remuneration Committee. Mr Demierre is a director and Chief Corporate Officer of the Halcyon Group. Prior to that, he worked in the legal department of the Kuok group of companies. Mr Demierre graduated from King’s College, London with Upper Second Class (Honours) in Law.
boArd of direcTors
MR JASON CHOO CHOON WAIINDEPENDENT NON-EXECUTIVE DIRECTORMr Jason Choo was appointed to the Board of The Hour Glass Limited on 1 August 2006 as an independent Director and serves as a member of the Company's Audit Committee.
Mr Choo is an Executive Chairman of Gems TV Holdings Limited and Chairman of Lonsdale Capital Pte Ltd. Mr Choo is a graduate of Colorado College where he obtained a Bachelor of Arts degree in Economics.

08 the hour glass limited annual report 2011
Key execuTives
SINGAPOREMR NG SIAK YONG CHIEF FINANCIAL OFFICERTHE HOUR GLASS LIMITEDMr Ng joined the Company in October 2004 and is responsible for the Group’s financial and accounting functions including statutory and regulatory compliance. Mr Ng holds a Bachelor in Accountancy (Honours) from Nanyang Technological University, a Master of Business Administration from the University of Strathclyde, Scotland and is a member of the Institute of Certified Public Accountants of Singapore.
MS AMANDA CHUAN LI CHOO GROUP HUMAN RESOURCE MANAGER THE HOUR GLASS LIMITEDMs Chuan joined the Company in February 1996 as HR Officer and was promoted to the position of Group Human Resource Manager on February 2000. She is responsible for the overall human resource management and development strategies of the Group. Ms Chuan graduated from the University of Wollongong with a Masters of Science (Honours).
MS WONG MEI LING MANAGING DIRECTOR (SINGAPORE) THE HOUR GLASS LIMITEDMs Wong joined the Company in October 2009 and is responsible for leading the growth and development of The Hour Glass’ Singapore business unit. Ms Wong holds a Bachelor of Arts in Economics and Psychology from the University of Sydney, Australia.
MR LIM HOCK THIAM GENERAL MANAGER THE HOUR GLASS LIMITEDMr Lim joined the Company in February 1995 as Senior Accountant and was promoted twice first to Senior Brand Manager in February 1998 and then to General Manager - Wholesale in October 1999. In April 2010, he was re-designated to General Manager and is currently responsible for the business in Singapore. Mr Lim holds a Bachelor of Economics from Monash University, Australia.
AUSTRALIAMS LIDIA EMMI GENERAL MANAGER THE HOUR GLASS (AUSTRALIA) PTY LTD Ms Emmi joined The Hour Glass (Australia) Pty Ltd in March 1994 and is responsible for the day-to-day operations of The Hour Glass’ Australia business unit. Ms Emmi holds a Bachelor degree in Commerce from James Cook University, Australia and is a member of the Institute of Certified Practicing Accountants in Australia.
HONG KONG MR CHUNG WAI YANG MANAGING DIRECTOR (HONG KONG) THE HOUR GLASS (HK) LIMITED Mr Chung holds a Master of Business Administration from the Ageno School of Business at Golden Gate University, San Francisco, USA and is responsible for the development and management of The Hour Glass’ Hong Kong business since he joined in August 1994.
JAPANMR ATSUSHI MOMOI DIRECTOR & GENERAL MANAGER THE HOUR GLASS JAPAN LTDMr Momoi joined The Hour Glass (Australia) Pty Ltd in November 1988 and was subsequently transferred to Japan to establish The Hour Glass Japan Ltd in July 1996. With more than 20 years of experience in the retail and wholesale distribution of luxury and specialty watches, he is responsible for the strategic planning, business development and sales and marketing of the company.

09
Key execuTives
MALAYSIAMR YON SHEE GUAN GENERAL MANAGER THE HOUR GLASS SDN BHD Mr Yon joined The Hour Glass Sdn Bhd in April 1991 as a Finance and Admin Manager prior to becoming appointed the company’s General Manager in 2007. He has overall responsibility for the management of the Malaysia operations. Mr Yon graduated with a Bachelor of Commerce from the University of Canterbury, New Zealand.
THAILANDMS KANITTA SAISUK DIRECTOR THE HOUR GLASS (THAILAND) CO., LTDMs Saisuk joined The Hour Glass (Thailand) Co., Ltd in November 2003 as Assistant Marketing Manager and was re-designated to Retail Manager in April 2005. Since our joint venture with Prima Times Co., Ltd in April 2008, she assumed the position of Sales & Marketing Director. In April 2009, she was made a Director of The Hour Glass (Thailand) Co., Ltd. Ms Saisuk holds a Bachelor of Arts Degree (Honours) from Chulalongkorn University, Thailand.
PARTNERSHIPSMR JOHN GLAJZ MANAGING DIRECTOR GLAJZ-THG PTE LTDMr Glajz joined the company in January 1980 and has more than 30 years of practical experience in the retail and wholesale of fine jewellery. His partnership with The Hour Glass Limited commenced in 1990 through Mondial Jewellers and after the successful sale of the Mondial brand and business in 2004, subsequently evolved into Glajz-THG Pte Ltd. Mr Glajz graduated with a Bachelor of Arts degree from The Australian National University.
MR NARUN THAMAVARANUKUP MANAGING DIRECTOR THG PRIMA TIMES CO., LTD Mr Thamavaranukup’s family has been involved in retailing luxury timepieces in Thailand for the last 10 years through Prima Times Company Limited, which he has been involved since 2006. The Thamavaranukups also own and manage Blue River Corporation, a manufacturer, wholesaler and retailer of high jewellery. Mr Thamavaranukup is responsible for the overall development of the Thailand market and overseeing day-to-day operations of our joint venture company trading under the name “PMT The Hour Glass”. Prior to joining his family retail business, Mr Thamavaranukup was an associate at a leading investment bank in Hong Kong. He holds a Masters Degree in Chemistry from Oxford University.

10 the hour glass limited annual report 2011
finAnciAl HiGHliGHTs
1 Excluding impairment loss on investment security and fair value adjustment on investment properties.2 Excluding impairment loss on investment security.3 Free cash flow refers to net cash flow from operating activities less purchase of property, plant and equipment in the cash flow statement.4 For the purpose of comparison, earnings per share for prior corresponding periods are adjusted retrospectively pursuant to the sub-division of every one
existing ordinary share into two ordinary shares on 18 February 2008.5 For the purpose of comparison, net asset value per ordinary share for prior corresponding periods are adjusted retrospectively pursuant to the sub-division
of every one existing ordinary share into two ordinary shares on 18 February 2008.
FY2011 FY2010 FY2009 FY2008 FY2007
FINANCIAL RESULTS $’000 $’000 $’000 $’000 $’000
Revenue 517,617 483,662 439,916 487,638 407,160
Operating profit 1 52,913 38,846 36,619 38,629 24,160
Profit after tax 43,181 33,478 13,436 31,481 19,381
EBITDA 1 57,488 42,303 40,013 41,596 27,455
FINANCIAL POSITIONS $’000 $’000 $’000 $’000 $’000
Net asset value 249,580 216,543 182,902 169,292 210,387
Cash and cash equivalents 50,708 50,452 42,117 28,773 27,018
Free cash flow 3 8,549 14,962 16,437 25,790 12,549
FINANCIAL RATIOS
Gross margin (%) 22.4 20.1 21.5 20.0 17.2
Operating margin (%) 1 10.2 8.0 8.3 7.9 5.9
Net margin (%) 2 8.3 6.9 6.3 6.5 4.6
Stock turn ratio 2.1 2.4 2.4 2.6 2.4
Debt / equity ratio (%) 5.7 6.6 8.5 8.8 12.5
Earnings per share (cents) 2, 4 18.1 14.1 11.6 13.5 8.2
Net asset value per ordinary share (cents) 5 106.5 92.6 78.9 73.1 93.8
finAnciAl HiGHliGHTs

600,000
500,000
400,000
300,000
200,000
100,000
11
REVENUE ($’000)
pRofit aftER tax ($’000)
finAnciAl HiGHliGHTs
NEt aSSEt ValUE ($’000)
407,160 487,638 439,916 483,662 517,617
19,381 31,481 13,436 33,478 43,181
35,000
30,000
20,000
10,000
15,000
5,000
25,000
40,000
45,000
210,387 169,292 182,902 216,543 249,580
200,000
150,000
100,000
50,000
250,000
27,525
impairmentloss
300,000
FY2007 FY2008 FY2009 FY2010 FY2011
FY2007 FY2008 FY2009 FY2010 FY2011
FY2007 FY2008 FY2009 FY2010 FY2011

VISIONAdvancing the culture of watch collecting throughout the world
ENTERPRISE MISSIONTo be the watch world's leading cultural retail enterprise, making it the primary port of call for all enthusiasts and collectors alike
BUSINESS MISSIONTo be an enduring, profitable business organisation that assumes a moderate risk profile, generating sustainable long term cashflows and returns by continually engaging in the practice of retail marketing, merchandising and operational excellence

13
I am pleased to report that the Group achieved another record performance for the financial year ended 31st March 2011. For the first time in our corporate history, sales surpassed the half-a-billion dollar mark growing 7% to $517.6 million, whilst net profit after tax improved 29% to $43.2 million from the year before.
During the financial year, we continued to expand The Hour Glass brand into our highest growth markets, investing $43.2 million in store refurbishments and inventory. Despite this, the Group continued to generate a respectable level of free cash flow of $8.5 million for the year whilst cash and its equivalents maintained at $50.7 million and the Group’s debt-to-equity was further reduced to 5.7%.
The resultant opening of new stores eventuated in inventory growth for FY2011 outpacing our sales by nearly 2.9 times. This led to a nominally depressed stock turn ratio of 2.1 times, underperforming our 5 year mean of 2.4 times. Though not alarming, this is clearly an area that management will be looking to reign in in the current financial year. On a consolidated net asset basis, we increased our corporate net worth by $33.0 million to $249.6 million or $1.07 per share.
In light of this highly positive financial and operating performance of the Group, the Board of Directors recommend a first and final dividend of 5.0 cents per ordinary share amounting to $11.7 million.
BUSINESS REVIEW
In 2010, the Swiss watch industry experienced a dramatic upturn in sentiment registering a 22% increase in year-on-year exports to CHF 16.2 billion. This measured close to the industry peak of 2008 when Swiss watch exports reached CHF 17.0 billion. Exports to Asia accounted for 52% for this sector and it is likely that Asians represented up to 60% of all watch purchases worldwide. It is on the back of this buoyant demand from Asian consumers, and in particular the mainland Chinese, that bailed the Swiss watch industry out of their recent woes.
The first time the Chinese encountered mechanical timekeepers was in 1582 when Portuguese missionaries paid tribute to the Imperial Court with a set of chiming clocks. This sparked a 400 year long fascination with European horology resulting in successive dynasties and their emperors from Wanli to Puyi, government officials to wealthy merchants accumulating what would have been considered in that period to be the world’s most important collection of timepieces. This obsession ended only at the turn of the 20th century as war threatened the world and China along with it. It therefore comes as little surprise that a century later, China and its million millionaires have once again claimed the title as the world’s largest buyers of luxury watches.
The rapidity and magnitude in which new wealth is exploding in the middle kingdom means that the Chinese as a nationality have the highest propensity to spend on luxury goods. 80% of affluent Chinese are below the age of 45 and more often than not are male entrepreneurs who assert their importance in the global watch market by using their economic power to express their societal, cultural and intellectual aspirations. According to China’s Hurun report, these high net worths “...own an average of three cars and 4.4 watches”. The cultivation of guanxi is also very much alive with 30% of all luxury purchases thought to be bought as gifts for family, friends and business associates. We estimate that for 2010, the Chinese luxury watch buyer accounted for as much as CHF 7 billion in global net retail purchases or approximately 23% of global demand. This demand will certainly continue to strengthen over time and the prime beneficiaries of this are the Hong Kong watch and jewellery retailers where over a million mainland visitors descend on the city every month.
Retail prices for watches in China are set 15% to 35% higher than in Hong Kong due to the duties and taxes levied on such objects. Even then, China continues to register high double digit compounded annual growth rates and by the end of 2011, is poised to overtake the United States as the world’s second biggest market for Swiss watches. Just under a decade ago, China
DEAR FELLOW SHAREHOLDERS,
cHAirmAn’s sTATemenT

14 the hour glass limited annual report 2011
cHAirmAn’s sTATemenT
did not even make the top 15. It is plausible that with the conclusion of their free trade agreements with Switzerland, the Chinese could jettison themselves to becoming the number one market for Swiss watches within the next five years.
This meteoric rise of the Chinese market has made it the watch world’s new battle ground. It would be naive to believe that we can compete with our mainland Chinese peers on their soil and on their terms. To provide a sense of scale, the two largest specialty watch retailers in China opened an aggregate of 130 stores in the last twelve months. It has taken The Hour Glass three decades to open 24 standalone boutiques!
Though our exposure to mainland Chinese clients presently account for no more than 10% of our total Group revenue, we are very conscious about the strategic implications of these developments and how it will shape the specialty luxury watch retail industry in this region. For instance, this rapidity in new store openings is placing considerable strain on an already tight supply of product to non-Chinese retail channels in Asia, potentially hampering growth. This is further exacerbated by the trend of standalone monobrand boutiques mushrooming in cities throughout China and Hong Kong where the minimum inventory requirements are much higher than those of a multi-brand point-of-sale. It must be noted that in no other country do brands have the confidence in building such an extensive monobrand boutique network.
All this however, did not stop us from continuing to sharpen our focus on our core activity of multi-brand watch retailing, divesting both our Montblanc distribution and franchised stores in Australia and the A. Lange & Sohne boutique in Tokyo. We anticipate that all that will remain in our existing monobrand boutique line-up will be those of Rolex, Chopard and Hublot.
OUTLOOK
At the height of the global financial crisis in 2009, I had articulated in my Chairman’s statement that “Whatever the outcome will be and whatever the evolving paradigms and operating environments that The Hour Glass will
exist in, one thing is clear. The Hour Glass will survive this episode and will emerge a far stronger company and organisation.” Two years have since passed and I am most delighted that our organisation’s resolve to overcome, the unwavering commitment of our core management team and the adeptness of our business strategies have not disappointed.
We have achieved this because we are absolutely focused on our Group’s shared mission, driven by an overwhelming desire to excel in what we do, to be the best in class. We recognise that what got us to the top is not what keeps us there and we strive to maintain our qualitative, global market leadership in the area of specialty and luxury watch retailing. The essence of this market leadership requires us to continue propelling ourselves forward even when the path ahead lies bare, reinventing ourselves and our markets, transforming our cultures and processes and altering the rules of engagement the moment our competition catches up. We are constantly learning from our failures as well as our successes. Our creed: “Never be complacent, never rest on our laurels. We can always do better.”
We have developed a highly collaborative, owner oriented culture within the organisation because we believe this is the best strategy to create long term business and economic value. We lever off our limited resources by building the collective intelligence of our organisation through transparent dialogue and the sharing of knowledge and experiences with our teams. We mitigate risks by always managing our downside, planning for the worst and in execution, battling to create the best outcomes. And finally, we continue to develop innovative retail marketing approaches to enlarge our markets whilst staying resolute to our core merchandising ideal - the acquisition, promotion and sale of authentic works of horology, timekeepers that will leave an indelible mark in watchmaking history and which reflect our conviction and passion for contemporary horological art.
Notwithstanding our attempts to smooth out the multiple road bumps that are part and parcel of all businesses, we are faced with several environmental, societal and cultural challenges.

15
We anticipate that The Hour Glass Japan will be facing difficult trading conditions as the Japanese curb luxury spending after the crippling tsunamis, earthquakes and nuclear reactor disasters that occurred. To this effect, we have put in place initiatives with our brand partners to roll out a series of events for the remainder of the year aimed at stimulating desire and sales.
We have noticed an inescapable trend amongst the generation ‘Y’ members of our team throughout all business units in the region. If younger workers have displayed anything as employees, it is that they prize mobility more than they do fidelity to their employers. We are currently reviewing our recruitment policies where we place a greater emphasis on cultural fit with the organisation and our values over and above our need for paper qualifications. Only time can be the judge of our success in this area.
Our balance sheet remains pristine and since the conclusion of this major investment phase of our business, we will be concerning ourselves with the task of generating a return with the free cash flows that will be generated in the coming years.
ACKNOWLEDGEMENTS
I would like to begin by firstly paying our respects to the passing of three giants of the Swiss watch industry this past year. Dr Nicolas Hayek, Chairman of The Swatch Group Ltd., Mr Rolf Schnyder, CEO of Ulysse Nardin S.A. and Dr Luigi Macaluso, Chairman of the Sowind Group S.A. These farsighted men were all visionary entrepreneurs who dedicated their lives to the resurrection of the Swiss watch industry in the post quartz era. Their boldness, unique business savvy combined with their creativity and passion for horology enabled them to shape the modern industrial fabric of contemporary watchmaking as we know it today. We will always remember their contributions and celebrate their legacies.
A resounding “thank you” to my fellow directors for their encouragement and counsel this past year. My deepest gratitude goes to Owen Price, who served on the Board
for the past seventeen years. At the ripe “young” age of eighty five, Owen has decided not to seek re-election at this year’s Annual General Meeting. I am also delighted to have had the pleasure of working with Jason Choo, who after having contributed to improving the standards of corporate governance of The Hour Glass is also retiring from the Board.
In their place, I welcome Kuah Boon Wee and Pascal Demierre. Boon Wee is the Group CEO of MTQ Corporation Limited, a company in the offshore oil and gas sector. Prior to his joining of MTQ Corporation, Boon Wee had served as CEO for South East Asia and Singapore Terminals as well as Chief Financial Officer of PSA International Pte Ltd. Pascal, a trained lawyer who has cycled through different areas of the legal department within the Kuok Group of companies, is the Chief Corporate Officer of Halcyon Group, an investment holding company. I am certain both gentlemen will add younger, and fresher perspectives to our business.
And finally, I wish to thank our clients, business partners and our highly dedicated management and sales teams for continuing to support The Hour Glass in its efforts to remain as the watch world’s leading cultural retail enterprise.
HENRY TAY YUN CHWANExecutive Chairman31 May 2011
cHAirmAn’s sTATemenT

16 the hour glass limited annual report 2011
corporate governance
The Hour Glass Limited is committed to ensuring a high standard of corporate governance within the Company, its subsidiaries and significant associates to protect the interests of its shareholders and maximise long-term shareholder value. This report describes the corporate governance practices and activities of the Company and its subsidiaries (“Group”) for the financial year ended 31 March 2011.
The Company’s corporate governance practices and activities in relation to each of the principles of the Code of Corporate Governance 2005 (“Code”) are set out in the following segments, and deviations from the Code are explained. Unless otherwise stated, the corporate governance processes were in place during the financial year.
BOARD MATTERSThE BOARD’S cOnDucT Of AffAiRS
Principle 1: Every company should be headed by an effective Board to lead and control the company. The Board is collectively responsible for the success of the company. The Board works with Management to achieve this and the Management remains accountable to the Board.
The Board is entrusted with the overall management of the business affairs of Company, and sets the overall strategy and policies on the Group’s business direction. It reviews significant investment and divestment proposals, funding decisions, financial performance and key operational initiatives, and oversees the implementation of appropriate systems to manage the Group’s business risks. Other functions include considering and approving nominations and re-nominations to the Board, reviewing management performance and reviewing and endorsing the recommended framework of remuneration for the Board and key executives. The Board also assumes responsibility for corporate governance.
The Board has put in place financial authorisation limits for operating and capital budgets, procurement of goods and services, and cheque signatory arrangements.
Approval sub-limits are also provided at management level to facilitate operational efficiency. Matters that are specifically reserved for the Board’s decision include interested person transactions, material acquisitions and disposals of assets, corporate or financial restructuring, share issuances and dividend payments to shareholders, and other transactions of a material nature requiring announcement under the listing rules of the Singapore Exchange Securities Trading Limited (“SGX-ST”). The Board also approves the periodic and full-year financial results for release to the SGX-ST.
The Board meets at least four times a year. In addition to scheduled Board meetings, ad hoc meetings are convened as and when circumstances require. The Board met four times during the financial year. To facilitate the Board’s decision-making process, the Company’s Articles of Association provides for directors to participate in Board meetings by conference telephone and similar communications equipment, and for Board resolutions to be passed in writing, including by electronic means.
Directors and senior executives are briefed on the Group’s operations and furnished with information on the Group’s corporate governance practices at the time of appointment, and are routinely updated on developments and changes in the operating environment, including revisions to accounting standards, and laws and regulations affecting the Company and/or the Group. Newly appointed Directors will be provided with a formal letter setting out the director’s duties and obligations under applicable laws and regulations.
The Board is accountable to shareholders while management is accountable to the Board. Each Director is expected to act in good faith and in the best interests of the Company at all times in the exercise of his duties and powers. In the discharge of its functions, the Board is supported by specialty Board committees that provide independent oversight of management, and which also serve to ensure that there are appropriate checks and balances. These key committees, comprising the Audit Committee and the Remuneration Committee, are made up entirely of independent non-executive directors.

17
nAME Of DiREcTOR AgE DATE fiRST AppOinTED AS DiREcTOR DATE lAST RE-ElEcTED AS DiREcTOR
Dr Henry Tay Yun Chwan 67 11 Aug 1979 18 Jul 2008
Dato’ Dr Jannie Chan Siew Lee 66 11 Aug 1979 16 Jul 2010
Dr Kenny Chan Swee Kheng 58 01 Apr 2004 17 Jul 2009
Mr Michael Tay Wee Jin 36 15 Aug 2005 18 Jul 2008
Mr Owen Phillimore Howell-Price 85 11 Apr 1994 16 Jul 2010
Mr Robert Tan Kah Boh 66 18 Nov 1999 16 Jul 2010
Mr Jason Choo Choon Wai 40 01 Aug 2006 17 Jul 2009
Mr Philip Eng Heng Nee 65 01 Oct 2009 16 Jul 2010
corporate governance
BOARD cOMpOSiTiOn AnD guiDAncE
Principle 2: There should be a strong and independent element on the Board, which is able to exercise objective judgment on corporate affairs independently, in particular, from Management. No individual or small group of individuals should be allowed to dominate the Board’s decision making.
During the financial year, the Board had eight members, consisting of four independent non-executive directors, and four executive directors.
The Board has adopted the definition in the Code of what constitutes an independent director in its review of the independence of each director. The independent non-executive members of the Board comprise seasoned professionals with management, financial, accounting,
investment, private equity and commercial backgrounds. This enables the executive directors and management to benefit from their external and objective perspectives of issues that are brought before the Board. It also provides a broad spectrum of business acumen and skill sets to help shape the strategic process, as well as monitoring the performance of management and operating as an appropriate check and balance.
The Board is of the view that its current composition comprises persons who, as a group, provides the necessary core competencies and that the current Board size is appropriate, taking into consideration the nature and scope of the Group’s operations.
The profiles of the Directors are set out under the section “Board of Directors” in the Annual Report. Additional information on the Board members is set out below:

18 the hour glass limited annual report 2011
corporate governance
chAiRMAn AnD chiEf ExEcuTivE OfficER
Principle 3: There should be a clear division of responsibilities at the top of the company - the working of the Board and the executive responsibility of the company’s business - which will ensure a balance of power and authority, such that no one individual represents a considerable concentration of power.
Dr Henry Tay and Dato’ Dr Jannie Chan are the founders of The Hour Glass. Dr Henry Tay and Dato’ Dr Jannie Chan are regarded as controlling shareholders of the Company. Dr Henry Tay is the Executive Chairman, and Dato’ Dr Jannie Chan is the Executive Vice Chairman. Dr Kenny Chan is the Group Managing Director of the Company, and Mr Michael Tay is Executive Director. Mr Michael Tay is the son of Dr Henry Tay and Dato’ Dr Jannie Chan, and Dr Kenny Chan is the brother of Dato’ Dr Jannie Chan. The executive directors take an active role in management and overseeing of the Group’s operations, providing a division of executive responsibility and authority in the Company.
The Company believes that it has effective independent non-executive directors to provide balance within the workings of the Board and oversight for minority shareholders’ interests. At the operational level, the senior management team, which includes the Executive Chairman, Executive Vice Chairman, the Group Managing Director and the Executive Director, provides decisiveness and clarity in the implementation of corporate policies and objectives, and serves to align the interests of the majority stakeholder with those of minority shareholders in the Company’s goals for enhancing shareholder value. It is hence felt that it is not necessary, in the circumstances, for an independent non-executive chairman, or to separate the role of chairman and chief executive officer as recommended by the Code.
As part of his administrative duties, the Executive Chairman ensures that Board meetings are held when necessary and sets the Board meeting agenda in consultation with the Group Managing Director and Chief Financial Officer. The Executive Chairman encourages constructive relations among members of the Board
and between the Board and management and facilitates contributions of the non-executive Directors. He also reviews board papers on significant issues before they are presented to the Board and ensures that Board members are provided with complete, adequate and timely information, and that formalities and procedures are observed. The Board, together with management, are responsible for ensuring compliance with applicable laws and regulations.
BOARD MEMBERShip
Principle 4: There should be a formal and transparent process for the appointment of new directors to the Board.
Given its eight-member Board size, of which four of the Board members are independent non-executive directors, the formation of a committee of the board to perform the functions of a Nominating Committee, as recommended by the Code, would be superfluous. Hence, the Board has decided against the formation of a Nominating Committee. Instead, the Board performs the functions that such a committee would otherwise perform, namely, it administers nominations and re-nominations to the Board, reviews the structure, size and composition of the Board, and reviews the independence of Board members. The selection of candidates for new appointments to the Board as part of the Board’s renewal process are evaluated taking into account various factors including the current and mid-term needs and goals of the Company, as well as the relevant expertise of the candidates and their potential contributions to the Board. The Company’s Articles of Association provide that all directors, including a managing director for the time being of the Company, are to submit themselves for periodic retirement and re-election by shareholders at annual general meetings of the Company.
BOARD pERfORMAncE
Principle 5: There should be a formal assessment of the effectiveness of the Board as a whole and the contribution by each director to the effectiveness of the Board.

19
corporate governance
Having regard to its composition and mix, the Board has endeavoured through each director’s unique contributions and diversity of experience, to ensure that balanced and well-considered decisions are made in the best interests of the Company.
The criteria for appointment of a new Board member will be underscored by the need to shape the Board in line with the medium-term needs of the Company and its strategic goals and business direction for the Group.
The factors taken into consideration for the re-nomination of the directors for the ensuing year included the directors’ attendance and participation at Board meetings and Board committee meetings in the financial year under review, the Board and management having benefited from an open and healthy exchange of views and ideas. More importantly however, the renewal of a director’s Board membership recognises the value of that individual to the Board and the Company, and his or her continued contribution to the on-going needs of the Company and its business. A director’s calibre, experience, stature and skills as well as his or her ability to contribute to the proper governance and stewardship of the Company and its operations are important qualities, albeit not capable of precise valuation or measurement, nor need such contributions necessarily be confined to the boardroom. Contributions by a director can take many forms, including providing objective perspectives of issues, facilitating business opportunities and strategic relationships, and accessibility to management outside of a formal environment of Board and/or Board committee meetings. The matrix of Board members’ participation and attendance record at meetings of the Board and the specialty Board committees during the financial year is provided at the end of this report. This also reflects a Board member’s additional responsibilities and special focus on the respective Board committees of the Company.
The Board is of the view that the financial indicators set out in the Code as performance criteria for the evaluation of directors’ performance are more a measure of
management’s performance and hence less appropriate for non-executive directors and the Board’s performance as a whole. Such financial indicators also may not necessarily fully measure the long-term success and value creation of the Company. The Board believes that its performance and that of individual Board members would perhaps be better reflected in, and evidenced by, proper guidance, diligent oversight and able leadership of the Company, and the support that it lends to management in steering the Company and the Group in the appropriate direction, whether under favourable or challenging market conditions.
AccESS TO infORMATiOn
Principle 6: In order to fulfil their responsibilities, Board members should be provided with complete, adequate and timely information prior to board meetings and on an on-going basis.
Non-executive directors have access to the executive directors, management and the company secretary, and vice versa. In general, board papers are sent to all directors at least five days in advance of the Board meeting. Senior managers who have prepared the papers, or who can provide additional insight in the matters to be discussed, are normally invited to present the paper or attend during the Board meeting. The company secretary’s duties include assisting the Chairman in ensuring that board procedures are followed and communicating changes in listing rules or other regulations affecting corporate governance and compliance were appropriate. The company secretary also attends Board meetings to take minutes. The Company’s Articles of Association provide for the appointment and removal of company secretary by the Board.
Where necessary, the Company will, upon the request of directors (whether as a group or individually), provide them with independent professional advice, at the Company’s expense, to enable them to discharge their duties. The Chief Financial Officer assists the directors in obtaining such advice.

20 the hour glass limited annual report 2011
corporate governance
REMunERATiOn MATTERS
pROcEDuRES fOR DEvElOping REMunERATiOn pOliciES
Principle 7: There should be a formal and transparent procedure for developing policy on executive remuneration and for fixing the remuneration packages of individual directors. No director should be involved in deciding his own remuneration.
lEvEl AnD Mix Of REMunERATiOn
Principle 8: The level of remuneration should be appropriate to attract, retain and motivate the directors needed to run the company successfully but companies should avoid paying more than is necessary for this purpose. A significant proportion of executive directors’ remuneration should be structured so as to link rewards to corporate and individual performance.
DiSclOSuRE On REMunERATiOn
Principle 9: Each company should provide clear disclosure of its remuneration policy, level and mix of remuneration, and the procedure for setting remuneration in the company’s annual report. It should provide disclosure in relation to its remunerative policies to enable investors to understand the link between remuneration paid to directors and key executives, and performance.
During the year, the Company’s Remuneration Committee (“RC”) comprised Mr Owen Price, Mr Robert Tan, and Mr Philip Eng. All of the RC members are independent non-executive directors. The RC is chaired by Mr Owen Price. The RC met once during the financial year.
The RC’s terms of reference are primarily to review, determine and recommend to the Board, the framework of remuneration, terms of engagement, compensation and benefits for senior executives, including the executive directors of the Company. Its functions include review of senior executive development and succession, compensation plans and recruitment strategies, and evaluation of executives’ performance.
The RC’s terms of reference do not include the annual review and recommendation of the fees for non-executive directors of the Company (to be put to shareholders in annual general meeting for approval), which is a Board reserved matter. Such fees are set in accordance with a remuneration framework comprising basic fees, attendance fees and additional fees for serving on Board committees. Executive directors do not receive directors’ fees.
The Company adopts an overall remuneration policy for staff comprising a fixed component in the form of a base salary. The variable component is in the form of a bonus that is linked to the Company’s and the individual’s performance. The Company’s executive directors are under service contracts. Their contract renewals and any revisions are subject to the review and approval of the RC. The Company does not presently operate an employee share option scheme.
For the financial year under review, the level and mix of the annual remuneration of the four executive directors and the level of remuneration of the Group’s top 10 key executives (who are not also directors), are disclosed at the end of this report. During the year, an employee who is the sister of Dato’ Dr Jannie Chan and Dr Kenny Chan, received an annual remuneration above $150,000 but below $250,000.
AccOunTABiliTY AnD AuDiT
AccOunTABiliTY
Principle 10: The Board should present a balanced and understandable assessment of the company’s performance, position and prospects.
AuDiT cOMMiTTEE
Principle 11: The Board should establish an Audit Committee with written terms of reference which clearly set out its authority and duties.

21
corporate governance
inTERnAl cOnTROlS
Principle 12: The Board should ensure that Management maintains a sound system of internal controls to safeguard the shareholders’ investments and the company’s assets.
The Group’s internal controls and systems are designed to provide reasonable assurance as to the integrity and reliability of the financial information and to safeguard and maintain accountability of its assets. Relevant procedures are in place to identify major business risks and evaluate potential financial effects. There are also procedures for the authorisation of capital expenditures and investments. Comprehensive budgeting systems are in place to develop annual budgets covering key aspects of the business. The annual budgets are submitted to the Board for review and actual performance is compared with budgets periodically to monitor the Group’s performance. All directors are provided with quarterly management accounts.
The Company recognises that risk analysis and management is, prima facie, a function of management. The Company’s approach to risk management focuses on ensuring that appropriate controls are in place to effectively manage those risks. Measures are adopted to manage such risks, and risk management policies are monitored by management, and periodically reviewed and approved by the Board. The internal audit plan is developed in conjunction with the Company’s risk management objectives and policies, to confirm the operation of internal controls and to assess the effectiveness and efficiency of the control environment. In addition, the Board requires that any major proposal submitted to the Board for decision be accompanied by a comprehensive risk evaluation and, where required, management’s proposed mitigation strategies. The Company’s risk management policies and practices are described in note 36 to the accounts, at page 78 of the Annual Report.
The Audit Committee (“AC”) comprises three members, all of whom are independent non-executive directors. The AC is chaired by Mr Robert Tan, and the other members are Mr Owen Price and Mr Jason Choo. The Board is of the view that the AC members have the relevant expertise
to discharge the functions of an AC. The AC’s scope of authority are formalised in its terms of reference, which include the statutory functions of an audit committee as prescribed under the Companies Act of Singapore and applicable listing rules of the SGX-ST.
The activities of the AC include reviewing with the external auditors their (i) annual audit plan, findings, and recommendations to management as well as management’s response; (ii) evaluation of the system of internal accounting controls; and (iii) audit report. The AC also reviews the assistance given by management to the external auditors, the scope and results of the internal audit procedures, the statement of financial position and income statement of the Company and Group, significant financial reporting issues and judgments as well as the quarterly and full-year results prior to their submission to the Board, and (where applicable) interested person transactions. If a firm other than the external auditors is appointed as auditors of any unlisted Singapore-incorporated subsidiary or significant associate, the AC together with the Board would have to be satisfied that it would not compromise the standard and effectiveness of the Company’s audit by the external auditors. The AC also recommends the appointment or re-appointment of the external auditors, and takes into consideration the scope and results of the audit and its cost effectiveness (including remuneration and terms of engagement) and the independence of the external auditors.
The AC has undertaken a review of all non-audit services provided by the external auditors during the financial year, and is of the view that they would not affect the independence of the external auditors.
During the financial year, the AC met four times. The AC has full access to and co-operation of the Company’s management and the internal auditors and has full discretion to invite any executive director or officer to attend its meetings. The auditors, both internal and external, have unrestricted access to the AC. Reasonable resources have been made available to the AC to enable it to discharge its duties. The AC will meet the external auditors, and with the internal auditors, without the presence of management, at least annually.

22 the hour glass limited annual report 2011
corporate governance
The Company’s external auditors carry out, in the course of their annual statutory audit, a review of the effectiveness of the Company’s material internal controls, including financial, operational and compliance controls, and risk management to the extent of the scope of audit as laid out in their audit plan. Material non-compliance and internal control weaknesses noted during the audit, and the auditors’ recommendations to address such non-compliance and weakness are reported to the AC. Management follows-up and implements the external auditors’ recommendations.
The Company has in place a “whistle blowing” policy for staff and others. The AC oversees this policy, including procedures for follow up action and independent investigations.
The Board is of the view that the overall internal controls and processes currently in place are adequate.
inTERnAl AuDiT
Principle 13: The company should establish an internal audit function that is independent of the activities it audits.
The Company has had an internal audit function since 1993. The internal audit staff is headed by a senior manager, who reports directly to the AC on audit matters, and to the Group Managing Director on administrative matters. The AC reviews the internal audit reports and activities. The AC also reviews and approves the annual internal audit plan. The AC is of the view that the internal audit department is adequately resourced to perform its functions and have, to the best of its ability, maintained its independence from the activities that it audits.
The internal audit department applies the Standards for Professional Practice of Internal Auditing set by the Institute of Internal Auditors in carrying out its functions.
cOMMunicATiOn WiTh ShAREhOlDERS
Principle 14: Companies should engage in regular, effective and fair communication with shareholders.
Principle 15: Companies should encourage greater shareholder participation at AGMs, and allow shareholders the opportunity to communicate their views on various matters affecting the Company.
The Company communicates information to shareholders and the investing community through announcements that are released to the SGX-ST via SGXNET. Such announcements include the quarterly and full-year results, material transactions, and other developments relating to the Group requiring disclosure under the corporate disclosure policy of the SGX-ST.
All shareholders of the Company are sent a copy of the Annual Report and notice of the Annual General Meeting (“AGM”). The notice of AGM which sets out all items of business to be transacted at the AGM, is also advertised in the newspapers. The Company also maintains a website www.thehourglass.com where the public can access information on the Group.
The Company’s main forum for dialogue with shareholders takes place at its AGM, whereat members of the Board, senior management and the external auditors are in attendance. At the AGM, shareholders are given the opportunity to air their views and ask questions regarding the Company. Resolutions put to the general meetings are separate unless they are interdependent and linked, and the reasons and material implications are explained. The Company’s Articles of Association allow a shareholder to appoint one or two proxies to attend and vote at general meetings in his/her stead.
The Company prepares minutes of general meetings and makes these minutes available to shareholders upon their request.

23
corporate governance
name position Salary* Bonus# fees# Other benefits Total % % % % %
Above $1,500,000Dr Kenny Chan Swee Kheng Group Managing Director 20 77 - 3 100
Mr Michael Tay Wee Jin Executive Director 20 76 - 4 100
$1,250,000 to below $1,500,000 Dr Henry Tay Yun Chwan Executive Chairman 24 68 - 8 100
Dato’ Dr Jannie Chan Siew Lee Executive Vice Chairman 24 68 - 8 100
Below $250,000Mr Owen Phillimore-Howell Price Independent Director - - 100 - 100
Mr Robert Tan Kah Boh Independent Director - - 100 - 100
Mr Jason Choo Choon Wai Independent Director - - 100 - 100
Mr Philip Eng Heng Nee Independent Director - - 100 - 100
* Salary includes employer’s CPF contribution.# Accrued for FY2011.
SuMMARY cOMpEnSATiOn TABlES – finAnciAl YEAR EnDED 31 MARch 2011
(i) BREAkDOWn Of DiREcTORS’ REMunERATiOn in pERcEnTAgE TERMS AnD in BAnDS Of $250,000
fY2011 pROpOSED fEE $
nOn-ExEcuTivE DiREcTORS Basic fee 20,000
chAiRMAn Audit Committee 40,000Remuneration Committee 15,000
MEMBERAudit Committee 15,000Remuneration Committee 5,000
ATTEnDAncE fEE fOR EAch BOARD MEETing 2,000
DiSclOSuRE Of REMunERATiOn
Directors’ fees are paid to non-executive directors, subject to approval by shareholders at annual general meeting. Executive directors do not receive any directors’ fees.
The fees proposed to be paid to Non-executive Directors for FY2011 have been determined based on the same formula applied in the previous year, as follows:

24 the hour glass limited annual report 2011
corporate governance
(iii) RAngES Of gROSS REMunERATiOn REcEivED in BAnDS Of $250,000
no. of key executives in remuneration bands fY2011
Above $500,000 2
$250,000 to below $500,000 4
Below $250,000 4
(ii) kEY ExEcuTivES Of ThE gROup
name of company name position
The Hour Glass Limited Mr Ng Siak Yong Chief Financial Officer
The Hour Glass Limited Ms Amanda Chuan Li Choo Group Human Resource Manager
The Hour Glass Limited Ms Wong Mei Ling Managing Director (Singapore)
The Hour Glass Limited Mr Lim Hock Thiam General Manager
The Hour Glass (Australia) Pty Ltd Ms Lidia Emmi General Manager
The Hour Glass (HK) Limited Mr Chung Wai Yang Managing Director (Hong Kong)
The Hour Glass Japan Ltd Mr Atsushi Momoi Director & General Manager
The Hour Glass Sdn Bhd Mr Yon Shee Guan General Manager
The Hour Glass (Thailand) Co., Ltd Ms Kanitta Saisuk Director
Glajz-THG Pte Ltd Mr John Glajz Managing Director

25
DiREcTORS’ ATTEnDAncE AT BOARD AnD cOMMiTTEE MEETingS – finAnciAl YEAR EnDED 31 MARch 2011
Board composition & committees Board of Directors Audit committee
Dr Henry Tay Yun Chwan 4 4 NA NA NA NA
Dato’ Dr Jannie Chan Siew Lee 4 4 NA NA NA NA
Dr Kenny Chan Swee Kheng 4 4 NA NA NA NA
Mr Michael Tay Wee Jin 4 4 NA NA NA NA
Mr Owen Phillimore-Howell Price 4 4 4 4 1 1
Mr Robert Tan Kah Boh 4 4 4 4 1 1
Mr Jason Choo Choon Wai 4 2 4 2 NA NA
Mr Philip Eng Heng Nee 4 4 NA NA 1 1
No. of meetings
held
No. of meetings attended
No. of meetings
held
No. of meetings attended
No. of meetings
held
No. of meetings attended
Remuneration committee
corporate governance
NA means not applicable.

26 the hour glass limited annual report 2011
ADDiTiOnAl infORMATiOn
EThicAl STAnDARDS AnD BuSinESS cOnDucTThe Company has developed a code of ethics and business conduct to be observed by all employees of the Group. The code of conduct also deals with subjects such as confidential information and conflict of interest. The code, which is regularly reviewed and updated as necessary to ensure it reflects the highest standards of behaviour and professionalism, requires that all personnel act with utmost integrity, objectivity and in compliance with both the letter and spirit of the law as well as with company policies and procedures.
DEAling in SEcuRiTiES The Company has adopted an internal policy with respect to dealings in securities modelled on the SGX-ST’s best practices recommendations. Directors and staff are to refrain from dealing in the securities of the Company during the periods commencing two weeks before the release of the Company’s results for each of the first three quarters of its financial year and one month before and up to the date of announcement of the Company’s full year results. Staff are cautioned against dealing while in possession of material price sensitive non-public information. They are also encouraged not to deal on considerations of a short-term nature.
inTERESTED pERSOn TRAnSAcTiOnSTransactions with the Company’s interested persons (as that term is defined in the Listing Manual of the SGX-ST) are subject to review and approval by the Board comprising those directors who do not have an interest in the transaction. Where required by the relevant listing rules of the SGX-ST, the AC reviews the transaction to determine that it is on normal commercial terms and hence, not prejudicial to the interests of the Company and shareholders, before making its recommendation to the Board for endorsement. During the financial year under review, no transaction was conducted with any interested person which amounted to $100,000 or more, and the Company did not have a shareholders’ mandate pursuant to Rule 920 of the Listing Manual.
corporate governance

Financial StatementsDirectors’ Report 28
Statement By Directors 31
Independent Auditors’ Report 32
Consolidated Income Statement 33
Consolidated Statement Of Comprehensive Income 34
Statements Of Financial Position 35
Statements Of Changes In Equity 36
Consolidated Statement Of Cash Flow 38
Notes To The Financial Statements 39

28 the hour glaSS limited annual report 2011
DIRECTORS’ REpORT
The Directors are pleased to present their report to the members together with the audited consolidated financial statements of The Hour Glass Limited (the “Company”) and its subsidiaries (collectively the “Group”) for the financial year ended 31 March 2011 and the statement of financial position and statement of changes in equity of the Company as at 31 March 2011.
Directors
The Directors of the Company in office at the date of this report are:Dr Henry Tay Yun Chwan Dato’ Dr Jannie Chan Siew Lee Dr Kenny Chan Swee Kheng Mr Michael Tay Wee Jin Mr Owen Phillimore Howell-PriceMr Robert Tan Kah BohMr Jason Choo Choon Wai Mr Philip Eng Heng NeeMr Kuah Boon Wee (appointed on 1 April 2011)Mr Demierre Pascal Guy Chung Wei (appointed on 1 April 2011)
Arrangements to enable directors to acquire shares and debentures
Neither at the end of the financial year nor at any time during the financial year was the Company a party to any arrangement whose objects are, or one of whose object is, to enable the Directors of the Company to acquire benefits by means of the acquisition of shares in, or debentures of the Company or any other body corporate.
Directors’ interests in shares and debentures
The following Directors, who held office at the end of the financial year, had, according to the register of Directors’ shareholdings required to be kept under Section 164 of the Singapore Companies Act, Cap. 50, an interest in shares of the Company and its related corporations (other than wholly-owned subsidiaries) as stated below:
Direct interest Deemed interest
Name of directorAt
1.4.2010At
31.3.2011At
21.4.2011At
1.4.2010At
31.3.2011At
21.4.2011
Henry Tay Yun Chwan 19,414,170 13,315,246 13,315,246 123,535,707 123,535,707 123,535,707
Jannie Chan Siew Lee 3,252,902 9,351,826 9,351,826 123,535,707 108,288,397 108,288,397
Kenny Chan Swee Kheng 908,499 908,499 908,499 149,626 149,626 149,626
Michael Tay Wee Jin 576,963 601,366 601,366 – – –
Owen Phillimore Howell-Price 231,462 231,462 231,462 – – –
By virtue of Section 7 of the Singapore Companies Act, Cap. 50, Henry Tay Yun Chwan and Jannie Chan Siew Lee are deemed to have interests in the shares of the subsidiaries held by the Company.
Except as disclosed in this report, no other Director who held office at the end of the financial year had an interest in shares, or debentures of the Company, or of related corporations, either at the beginning of the financial year, or date of appointment if later, or at the end of the financial year.

29
DIRECTORS’ REpORT
The Directors are pleased to present their report to the members together with the audited consolidated financial statements of The Hour Glass Limited (the “Company”) and its subsidiaries (collectively the “Group”) for the financial year ended 31 March 2011 and the statement of financial position and statement of changes in equity of the Company as at 31 March 2011.
Directors
The Directors of the Company in office at the date of this report are:Dr Henry Tay Yun Chwan Dato’ Dr Jannie Chan Siew Lee Dr Kenny Chan Swee Kheng Mr Michael Tay Wee Jin Mr Owen Phillimore Howell-PriceMr Robert Tan Kah BohMr Jason Choo Choon Wai Mr Philip Eng Heng NeeMr Kuah Boon Wee (appointed on 1 April 2011)Mr Demierre Pascal Guy Chung Wei (appointed on 1 April 2011)
Arrangements to enable directors to acquire shares and debentures
Neither at the end of the financial year nor at any time during the financial year was the Company a party to any arrangement whose objects are, or one of whose object is, to enable the Directors of the Company to acquire benefits by means of the acquisition of shares in, or debentures of the Company or any other body corporate.
Directors’ interests in shares and debentures
The following Directors, who held office at the end of the financial year, had, according to the register of Directors’ shareholdings required to be kept under Section 164 of the Singapore Companies Act, Cap. 50, an interest in shares of the Company and its related corporations (other than wholly-owned subsidiaries) as stated below:
Direct interest Deemed interest
Name of directorAt
1.4.2010At
31.3.2011At
21.4.2011At
1.4.2010At
31.3.2011At
21.4.2011
Henry Tay Yun Chwan 19,414,170 13,315,246 13,315,246 123,535,707 123,535,707 123,535,707
Jannie Chan Siew Lee 3,252,902 9,351,826 9,351,826 123,535,707 108,288,397 108,288,397
Kenny Chan Swee Kheng 908,499 908,499 908,499 149,626 149,626 149,626
Michael Tay Wee Jin 576,963 601,366 601,366 – – –
Owen Phillimore Howell-Price 231,462 231,462 231,462 – – –
By virtue of Section 7 of the Singapore Companies Act, Cap. 50, Henry Tay Yun Chwan and Jannie Chan Siew Lee are deemed to have interests in the shares of the subsidiaries held by the Company.
Except as disclosed in this report, no other Director who held office at the end of the financial year had an interest in shares, or debentures of the Company, or of related corporations, either at the beginning of the financial year, or date of appointment if later, or at the end of the financial year.
Directors’ contractual benefits
Except as disclosed in the financial statements, since the end of the previous financial year, no Director of the Company has received or become entitled to receive a benefit by reason of a contract made by the Company or a related corporation with the Director, or with a firm of which the Director is a member, or with a company in which the Director has a substantial financial interest.
Share options
(i) No options to take up unissued shares in the Company or its subsidiaries have been granted during the financial year.
(ii) No shares have been issued during the financial year by virtue of the exercise of options to take up unissued shares of the Company or its subsidiaries.
(iii) As at the end of the financial year, there were no unissued shares of the Company or its subsidiaries under option.
Audit Committee
The Audit Committee comprises four independent non-executive directors. The members of the Audit Committee at the date of this report are:
Mr Philip Eng Heng Nee (Chairman)Mr Owen Phillimore Howell-PriceMr Jason Choo Choon WaiMr Kuah Boon Wee
The Audit Committee held four meetings during the financial year. The Audit Committee has full access to and co-operation from management. The external and internal auditors have unrestricted access to the Audit Committee. The Committee carried out its functions in accordance with Section 201B(5) of the Singapore Companies Act, Cap. 50, and reviewed the following, where relevant, with the executive directors and the internal and external auditors:
(a) the evaluation of the Group’s system of internal accounting controls;
(b) the Group’s financial and operating results;
(c) the financial statements of the Company and the consolidated financial statements of the Group before their submission to the Board of Directors;
(d) the audit plan of the external auditors, including the nature and scope of the audit before the audit commenced;
(e) the audit report submitted by external auditors;
(f) the scope and results of internal audit procedures;
(g) the co-operation given by management to the external and internal auditors;
(h) the independence and objectivity of the external auditors; and
(i) the nature and extent of non-audit services provided by external auditors.
The Committee has recommended to the Board of Directors the reappointment of Ernst & Young LLP, Certified Public Accountants, as external auditors of the Company at the forthcoming Annual General Meeting.
Further details regarding the Audit Committee are disclosed in the Corporate Governance.

30 the hour glaSS limited annual report 2011
Auditors
Ernst & Young LLP have expressed their willingness to accept reappointment as auditors.
On behalf of the Board of Directors,
Henry Tay Yun Chwan Executive Chairman
Kenny Chan Swee Kheng Group Managing Director
Singapore 31 May 2011

31
STATEmENT by DIRECTORS
We, Henry Tay Yun Chwan and Kenny Chan Swee Kheng, being two of the Directors of The Hour Glass Limited, do hereby state that, in the opinion of the Directors:
(i) the accompanying statements of financial position, consolidated income statement, consolidated statement of comprehensive income, statements of changes in equity, and consolidated statement of cash flow together with notes thereto are drawn up so as to give a true and fair view of the state of affairs of the Group and of the Company as at 31 March 2011 and the results of the business, changes in equity and cash flow of the Group and the changes in equity of the Company for the year ended on that date, and
(ii) at the date of this statement, there are reasonable grounds to believe that the Company will be able to pay its debts as and when they fall due.
On behalf of the Board of Directors,
Henry Tay Yun Chwan Executive Chairman
Kenny Chan Swee Kheng Group Managing Director
Singapore 31 May 2011

32 the hour glaSS limited annual report 2011
INDEpENDENT AuDITORS’ REpORT fOR ThE yEAR ENDED 31 mARCh 2011 TO ThE mEmbERS Of ThE hOuR GlASS lImITED
Report on the consolidated financial statements
We have audited the accompanying consolidated financial statements of The Hour Glass Limited (the “Company”) and its subsidiaries (collectively, the “Group”) set out on pages 33 to 82, which comprise the statements of financial position of the Group and the Company as at 31 March 2011, the statements of changes in equity of the Group and the Company, and the consolidated income statement, consolidated statement of comprehensive income, and consolidated statement of cash flow of the Group for the year then ended, and a summary of significant accounting policies and other explanatory information.
management’s responsibility for the consolidated financial statements
Management is responsible for the preparation of consolidated financial statements that give a true and fair view in accordance with the provisions of the Singapore Companies Act (the “Act”) and Singapore Financial Reporting Standards, and for devising and maintaining a system of internal accounting controls sufficient to provide a reasonable assurance that assets are safeguarded against loss from unauthorised use or disposition; and transactions are properly authorised and that they are recorded as necessary to permit the preparation of true and fair profit and loss accounts and balance sheets and to maintain accountability of assets.
Auditors’ responsibility
Our responsibility is to express an opinion on these consolidated financial statements based on our audit. We conducted our audit in accordance with Singapore Standards on Auditing. Those standards require that we comply with ethical requirements and plan and perform the audit to obtain reasonable assurance about whether the consolidated financial statements are free from material misstatement.
An audit involves performing procedures to obtain audit evidence about the amounts and disclosures in the consolidated financial statements. The procedures selected depend on the auditor’s judgment, including the assessment of the risks of material misstatement of the consolidated financial statements, whether due to fraud or error. In making those risk assessments, the auditor considers internal control relevant to the entity’s preparation of the consolidated financial statements that give a true and fair view in order to design audit procedures that are appropriate in the circumstances, but not for the purpose of expressing an opinion on the effectiveness of the entity’s internal control. An audit also includes evaluating the appropriateness of accounting policies used and the reasonableness of accounting estimates made by management, as well as evaluating the overall presentation of the consolidated financial statements.
We believe that the audit evidence we have obtained is sufficient and appropriate to provide a basis for our audit opinion.
Opinion
In our opinion, the consolidated financial statements of the Group and the statement of financial position and statement of changes in equity of the Company are properly drawn up in accordance with the provisions of the Act and Singapore Financial Reporting Standards so as to give a true and fair view of the state of affairs of the Group and of the Company as at 31 March 2011 and the results, changes in equity and cash flow of the Group and the changes in equity of the Company for the year ended on that date.
Report on other legal and regulatory requirements
In our opinion, the accounting and other records required by the Act to be kept by the Company and by those subsidiaries incorporated in Singapore of which we are the auditors have been properly kept in accordance with the provisions of the Act.
ERNST & YOUNG LLP Public Accountants and Certified Public Accountants Singapore 31 May 2011

33
CONSOlIDATED INCOmE STATEmENT fOR ThE yEAR ENDED 31 mARCh 2011 Note 2011 2010 $’000 $’000
Revenue 4 517,617 483,662
Other income 5 4,217 4,636
Total revenue and other income 521,834 488,298
Cost of goods sold 401,462 386,575
Salaries and employees benefits 32,415 30,229
Depreciation of property, plant and equipment 12 4,381 3,260
Selling and promotion expenses 10,100 8,867
Rental expenses 12,513 11,608
Finance costs 6 552 425
Foreign exchange gain (262) (107)
Other operating expenses 7 7,105 6,268
Total costs and expenses (468,266) (447,125)
Share of results of an associate 715 512
Profit before taxation 8 54,283 41,685
Taxation 9 (11,102) (8,207)
Profit for the year 43,181 33,478
Profit attributable to:
Owners of the parent 42,375 32,817
Non-controlling interests 806 661
43,181 33,478
Earnings per share (cents)
Basic and diluted 11 18.10 14.08
The accompanying accounting policies and explanatory notes form an integral part of the financial statements.

34 the hour glaSS limited annual report 2011
CONSOlIDATED STATEmENT Of COmpREhENSIvE INCOmE fOR ThE yEAR ENDED 31 mARCh 2011 2011 2010 $’000 $’000
Profit for the year 43,181 33,478
Other comprehensive income:
Net change in fair value of investment security (1,031) 1,237
Net surplus on revaluation of leasehold premises 2,532 –
Foreign currency translation (2,982) 4,094
Other comprehensive (loss)/income for the year, net of tax (1,481) 5,331
Total comprehensive income for the year 41,700 38,809
Total comprehensive income attributable to:
Owners of the parent 40,913 38,131
Non-controlling interests 787 678
41,700 38,809
The accompanying accounting policies and explanatory notes form an integral part of the financial statements.

35
STATEmENTS Of fINANCIAl pOSITION AS AT 31 mARCh 2011 Group Company Note 2011 2010 2011 2010 $’000 $’000 $’000 $’000Assets Non-current assets Property, plant and equipment 12 25,076 18,819 14,655 9,606Investment properties 13 18,739 13,715 8,850 8,350Investment in subsidiaries 14 – – 20,459 19,959Investment in an associate 15 2,788 2,183 – – Loan to an associate 16 2,084 2,172 – – Investment security 17 1,236 2,267 1,236 2,267Other receivables 18 5,330 956 1,671 956Deferred tax assets 19 513 297 – – 55,766 40,409 46,871 41,138Current assets Stocks 20 190,742 159,008 117,340 82,319Trade debtors 21 11,285 9,340 5,842 4,386Other debtors 22 4,665 12,806 4,037 3,256Prepaid operating expenses 477 730 275 259Amount due from an associate 23 866 2,021 – – Amounts due from subsidiaries 24 – – 3,946 9,440Cash and cash equivalents 31 50,708 50,452 13,267 24,451 258,743 234,357 144,707 124,111Total assets 314,509 274,766 191,578 165,249
Equity and liabilities Current liabilities Loans and borrowings 25 14,292 14,186 – – Trade creditors 26 10,277 10,087 4,575 3,649Other creditors 27 22,791 20,096 16,512 13,655Amounts due to subsidiaries 24 – – 16 62Provision for taxation 8,111 5,872 5,802 3,995 55,471 50,241 26,905 21,361
Net current assets 203,272 184,116 117,802 102,750
Non-current liabilities Provisions 26 145 223 – – Deferred income 26 152 – – – Deferred tax liabilities 28 1,280 481 702 481
1,577 704 702 481Total liabilities 57,048 50,945 27,607 21,842
Net assets 257,461 223,821 163,971 143,407 Equity attributable to owners of the parent Share capital 29 66,826 66,514 66,826 66,514Reserves 30 182,754 150,029 97,145 76,893 249,580 216,543 163,971 143,407Non-controlling interests 7,881 7,278 – – Total equity 257,461 223,821 163,971 143,407
Total equity and liabilities 314,509 274,766 191,578 165,249
The accompanying accounting policies and explanatory notes form an integral part of the financial statements.

36 the hour glaSS limited annual report 2011
STATEmENTS Of ChANGES IN EquITy fOR ThE yEAR ENDED 31 mARCh 2011
Total foreign attributable currency fair value Asset to owners Non-
Share translation adjustment revaluation Revenue of the controlling Total capital reserve reserve reserve reserve parent interests equity $’000 $’000 $’000 $’000 $’000 $’000 $’000 $’000
Group Balance as at 1 April 2009 65,206 2,080 (412) – 116,028 182,902 6,800 189,702 Profit for the year – – – – 32,817 32,817 661 33,478Other comprehensive
income – 4,077 1,237 – – 5,314 17 5,331 Total comprehensive
income for the year – 4,077 1,237 – 32,817 38,131 678 38,809Issuance of new shares
pursuant to scrip dividend scheme 1,308 – – – – 1,308 – 1,308
Dividends on ordinary shares (Note 10) – – – – (5,798) (5,798) – (5,798)
Payment of dividends by a subsidiary – – – – – – (200) (200)
Balance as at 31 March 2010 66,514 6,157 825 – 143,047 216,543 7,278 223,821
Balance as at 1 April 2010 66,514 6,157 825 – 143,047 216,543 7,278 223,821 Profit for the year – – – – 42,375 42,375 806 43,181Other comprehensive
income – (2,963) (1,031) 2,532 – (1,462) (19) (1,481) Total comprehensive
income for the year – (2,963) (1,031) 2,532 42,375 40,913 787 41,700Issuance of new shares
pursuant to scrip dividend scheme 312 – – – – 312 – 312
Dividends on ordinary shares (Note 10) – – – – (8,188) (8,188) – (8,188)
Payment of dividends by a subsidiary – – – – – – (184) (184)
Balance as at 31 March 2011 66,826 3,194 (206) 2,532 177,234 249,580 7,881 257,461
Attributable to owners of the parent
The accompanying accounting policies and explanatory notes form an integral part of the financial statements.

37
fair value Share adjustment Revenue Total
capital reserve reserve equity $’000 $’000 $’000 $’000
Company Balance as at 1 April 2009 65,206 (412) 66,989 131,783 Profit for the year – – 14,877 14,877Other comprehensive income – 1,237 – 1,237 Total comprehensive income for the year – 1,237 14,877 16,114Issuance of new shares pursuant to scrip dividend scheme 1,308 – – 1,308Dividends on ordinary shares (Note 10) – – (5,798) (5,798) Balance as at 31 March 2010 66,514 825 76,068 143,407 Balance as at 1 April 2010 66,514 825 76,068 143,407 Profit for the year – – 29,471 29,471Other comprehensive income – (1,031) – (1,031) Total comprehensive income for the year – (1,031) 29,471 28,440Issuance of new shares pursuant to scrip dividend scheme 312 – – 312Dividends on ordinary shares (Note 10) – – (8,188) (8,188) Balance as at 31 March 2011 66,826 (206) 97,351 163,971
STATEmENTS Of ChANGES IN EquITy fOR ThE yEAR ENDED 31 mARCh 2011 (cont’d)
The accompanying accounting policies and explanatory notes form an integral part of the financial statements.

38 the hour glaSS limited annual report 2011
2011 2010 Note $’000 $’000
Operating activities Profit before taxation 54,283 41,685Adjustments for: Finance costs 552 425 Interest income (373) (304) Depreciation of property, plant and equipment 4,381 3,260 Net (gain)/loss on disposal of property, plant and equipment (383) 46 Fair value gain on investment properties (1,370) (2,838) Foreign currency translation adjustment (1,286) 1,124
Share of results of an associate (715) (512) Operating cash flow before changes in working capital 55,089 42,886Increase in stocks (31,734) (13,051)Decrease/(increase) in debtors 1,822 (7,821)Decrease/(increase) in prepaid operating expenses 253 (234)Decrease in amount due from an associate 1,155 1,776Increase in creditors 2,959 5,402 Cash flow from operations 29,544 28,958 Income taxes paid (8,718) (8,213)Interest paid (552) (425)Interest received 373 304
Net cash flow from operating activities 20,647 20,624
Investing activities Proceeds from disposal of property, plant and equipment 1,109 18Purchase of property, plant and equipment (12,098) (5,662)Investment in an associate – (1,370)
Net cash flow used in investing activities (10,989) (7,014)
financing activities Proceeds from loans and borrowings 805 2,820Repayment of loans and borrowings (699) (4,148)Dividends paid on ordinary shares (8,188) (5,798)Proceeds from issue of shares pursuant to scrip dividend scheme 312 1,308Dividends paid to non-controlling interests of a subsidiary (184) (200)
Net cash flow used in financing activities (7,954) (6,018)
Net increase in cash and cash equivalents 1,704 7,592Effects of exchange rate changes (1,448) 743Cash and cash equivalents at 1 April 50,452 42,117
Cash and cash equivalents at 31 march 31 50,708 50,452
CONSOlIDATED STATEmENT Of CASh flOw fOR ThE yEAR ENDED 31 mARCh 2011
The accompanying accounting policies and explanatory notes form an integral part of the financial statements.

39
NOTES TO ThE fINANCIAl STATEmENTS - 31 mARCh 2011
1 Corporate information
The Hour Glass Limited (the “Company”) is a limited liability company incorporated and domiciled in Singapore and is listed on the Singapore Exchange Securities Trading Limited (“SGX-ST”).
The registered office and principal place of business of the Company is located at 302 Orchard Road, #11-01 Tong Building, Singapore 238862.
The principal activities of the Company and its subsidiaries (collectively, the “Group”) are those of investment holding companies, retailing and distribution of watches and jewellery, and investment in properties.
2 Summary of significant accounting policies
2.1 basis of preparation
The consolidated financial statements of the Group and the statement of financial position and statement of changes in equity of the Company are prepared in accordance with Singapore Financial Reporting Standards (“FRS”).
The financial statements are presented in Singapore Dollars (“SGD” or “$”) and all values in the tables are rounded to the nearest thousand ($’000) as indicated, unless otherwise stated. They are prepared on the historical cost basis except as disclosed in the accounting policies below.
2.2 Changes in accounting policies
The accounting policies adopted are consistent with those of the previous financial year except in the current financial year, the Group has adopted all the new and revised standards and Interpretations of FRS (INT FRS) that are effective for annual periods beginning on or after 1 April 2010. The adoption of these standards and interpretations did not have any effect on the financial performance or position of the Group and the Company.
2.3 Standards issued but not yet effective
The Company has not adopted the following standards and interpretations that have been issued but not yet effective:
Description Effective for annual periods beginning on or after
INT FRS 119 Extinguishing Financial Liabilities with Equity Instruments 1 July 2010 Amendment to FRS 101 – Limited Exemptions from Comparative FRS 107
Disclosures for First-Time Adopters 1 July 2010 Revised FRS 24 Related Party Disclosures 1 January 2011 Amendments to INT FRS 114 Prepayments of a Minimum Funding Requirement 1 January 2011 INT FRS 115 Agreements for the Construction of Real Estate 1 January 2011 Amendments to FRS 107 Disclosures – Transfers of Financial Assets 1 July 2011 Amendments to FRS 101 – Severe Hyperinflation and Removal of Fixed Dates for
First-time Adopters 1 July 2011 Amendments to FRS 12 Deferred Tax – Recovery of Underlying Assets 1 January 2012 Improvements to FRSs 2010 1 January 2011,
unless otherwise stated
Except for the revised FRS 24, the Directors expect that the adoption of the other standards and interpretations above will have no material impact on the financial statements in the period of initial application. The nature of the impending changes in accounting policy on adoption of the revised FRS 24 is described below.

40 the hour glaSS limited annual report 2011
2.3 Standards issued but not yet effective (cont’d)
Revised FRS 24 Related Party Disclosures
The revised FRS 24 clarifies the definition of a related party to simplify the identification of such relationships and to eliminate inconsistencies in its application. The revised FRS 24 expands the definition of a related party and would treat two entities as related to each other whenever a person (or a close member of that person’s family) or a third party has control or joint control over the entity, or has significant influence over the entity. The revised standard also introduces a partial exemption of disclosure requirements for government-related entities. The Group is currently determining the impact of the changes to the definition of a related party has on the disclosure of related party transaction. As this is a disclosure standard, it will have no impact on the financial position or financial performance of the Group when implemented in 2012.
2.4 foreign currency
The Group’s consolidated financial statements are presented in Singapore Dollars, which is also the parent company’s functional currency. Each entity in the Group determines its own functional currency and items included in the financial statements of each entity are measured using that functional currency.
(a) Transactions and balances
Transactions in foreign currencies are measured in the respective functional currencies of the Company and its subsidiaries and are recorded on initial recognition in the functional currencies at exchange rates approximating those ruling at the transaction dates. Monetary assets and liabilities denominated in foreign currencies are translated at the rate of exchange ruling at the end of the reporting period. Non-monetary items that are measured in terms of historical cost in a foreign currency are translated using the exchange rates as at the dates of the initial transactions. Non-monetary items measured at fair value in a foreign currency are translated using the exchange rates at the date when the fair value was determined.
Exchange differences arising on the settlement of monetary items or on translating monetary items at the end of the reporting period are recognised in the income statement except for exchange differences arising on monetary items that form part of the Group’s net investment in foreign operations, which are recognised initially in other comprehensive income and accumulated under foreign currency translation reserve in equity. The foreign currency translation reserve is reclassified from equity to consolidated income statement on disposal of the foreign operation.
(b) Group companies
The assets and liabilities of foreign operations are translated into SGD at the rate of exchange ruling at the end of the reporting period and their statement of comprehensive income are translated at the weighted average exchange rates for the year. The exchange differences arising on the translation are taken directly to other comprehensive income. On disposal of a foreign operation, the cumulative amount recognised in other comprehensive income relating to that particular foreign operation is recognised in the income statement.
In the case of a partial disposal without loss of control of a subsidiary that includes a foreign operation, the proportionate share of the cumulative amount of the exchange differences are re-attributed to non-controlling interest and are not recognised in the income statement. For partial disposals of associates or jointly controlled entities that are foreign operations, the proportionate share of the accumulated exchange differences is reclassified to income statement.
The Group has elected to recycle the accumulated exchange differences in the separate component of other comprehensive income that arises from the direct method of consolidation, which is the method the Group uses to complete its consolidation.

41
2.5 basis of consolidation
The consolidated financial statements comprise the financial statements of the Company and its subsidiaries as at the end of the reporting period. The financial statements of the subsidiaries used in the preparation of the consolidated financial statements are prepared for the same reporting date as the Company. Consistent accounting policies are applied to like transactions and events in similar circumstances.
All intra-group balances, income and expenses and unrealised gains and losses resulting from intra-group transactions are eliminated in full.
Subsidiaries are consolidated from the date of acquisition, being the date on which the Group obtains control, and continue to be consolidated until the date that such control ceases.
Business combinations from 1 April 2010
Business combinations are accounted for by applying the acquisition method. Identifiable assets acquired and liabilities assumed in a business combination are measured initially at their fair values at the acquisition date. Acquisition-related costs are recognised as expenses in the periods in which the costs are incurred and the services are received.
Business combinations before 1 April 2010
Business combinations are accounted for by applying the purchase method. Transaction costs directly attributable to the acquisition formed part of the acquisition costs. The non-controlling interest (formerly known as minority interest) was measured at the proportionate share of the acquiree’s identifiable net assets.
2.6 Transactions with non-controlling interests
Non-controlling interest represents the equity in subsidiaries not attributable, directly or indirectly, to owners of the Company, and are presented separately in the consolidated statement of comprehensive income and within equity in the statements of financial position, separately from equity attributable to owners of the Company.
Changes in the Company owners’ ownership interest in a subsidiary that do not result in a loss of control are accounted for as equity transactions. In such circumstances, the carrying amounts of the controlling and non-controlling interests are adjusted to reflect the changes in their relative interests in the subsidiary. Any difference between the amount by which the non-controlling interest is adjusted and the fair value of the consideration paid or received is recognised directly in equity and attributed to owners of the parent.

42 the hour glaSS limited annual report 2011
2.7 property, plant and equipment
All items of property, plant and equipment are initially recorded at cost. The cost of an item of property, plant and equipment is recognised as an asset if, and only if, it is probable that future economic benefits associated with the item will flow to the Group and the cost of the item can be measured reliably.
Subsequent to recognition, property, plant and equipment are measured at cost less accumulated depreciation and accumulated impairment losses.
Premises held on 999-year lease are regarded as equivalent to freehold and are included with freehold premises under property, plant and equipment.
Depreciation is computed on a straight-line basis over the estimated useful lives of the assets as follows:
Freehold and leasehold premises – 50 years
Furniture and equipment – 2 to 5 years
Motor vehicles – 5 years
The carrying values of property, plant and equipment are reviewed for impairment when events or changes in circumstances indicate that the carrying value may not be recoverable.
The residual value, useful life and depreciation method are reviewed at each financial year-end to ensure that the amount, method and period of depreciation are consistent with previous estimates and the expected pattern of consumption of the future economic benefits embodied in the items of property, plant and equipment.
An item of property, plant and equipment is derecognised upon disposal or when no future economic benefits are expected from its use or disposal. Any gain or loss arising on derecognition of the asset is included in the income statement in the year the asset is derecognised.
2.8 Investment properties
Investment properties are properties that are either owned by the Group or leased under a finance lease in order to earn rentals or for capital appreciation, or both, rather than for use in the production or supply of goods or services, or for administrative purposes, or in the ordinary course of business.
Investment properties are initially recorded at cost including transaction costs. The carrying amount includes the cost of replacing part of an existing investment property at the time that cost is incurred if the recognition criteria are met. Subsequent to recognition, investment properties are measured at fair value and gains or losses arising from changes in the fair value of investment properties are included in the income statement in the year in which they arise.
Investment properties are derecognised when either they have been disposed of or when the investment property is permanently withdrawn from use and no future economic benefit is expected from its disposal. Any gains or losses on the retirement or disposal of an investment property are recognised in the income statement in the year of retirement or disposal.
Transfers are made to or from investment property only when there is a change in use. For a transfer from investment property to owner occupied property, the deemed cost for subsequent accounting is the fair value at the date of change in use. For a transfer from owner occupied property to investment property that will be carried at fair value, the entity shall treat any difference at that date between the carrying amount of the property in accordance with FRS 16 and its fair value in the same way as a revaluation in accordance with FRS 16.

43
2.9 Subsidiaries
A subsidiary is an entity over which the Group has the power to govern the financial and operating policies so as to obtain benefits from its activities.
In the Company’s separate financial statements, investments in subsidiaries are accounted for at cost less any impairment losses.
2.10 Associate
An associate is an entity, not being a subsidiary or a joint venture, in which the Group has significant influence. The associate is equity accounted for from the date the Group obtains significant influence until the date the Group ceases to have significant influence over the associate.
The Group’s investment in associate is accounted for using the equity method. Under the equity method, the investment in associate is measured in the statements of financial position at cost plus post-acquisition changes in the Group’s share of net assets of the associate. Goodwill relating to an associate is included in the carrying amount of the investment. Any excess of the Group’s share of the net fair value of the associate’s identifiable asset, liabilities and contingent liabilities over the cost of the investment is deducted from the carrying amount of the investment and is recognised as income as part of the Group’s share of results of the associate in the period in which the investment is acquired.
The profit or loss reflects the share of the results of operations of the associates. Where there has been a change recognised in other comprehensive income by the associates, the Group recognises its share of such changes in other comprehensive income. Unrealised gains and losses resulting from transactions between the Group and the associate are eliminated to the extent of the interest in the associates.
The Group’s share of the profit or loss of its associates is shown on the face of profit or loss after tax and non-controlling interests in the subsidiaries of associates.
When the Group’s share of losses in an associate equals or exceeds its interest in the associate, the Group does not recognise further losses, unless it has incurred obligations or made payments on behalf of the associate.
The financial statements of the associate are prepared as of the same reporting date as the Company. Where necessary, adjustments are made to bring the accounting policies in line with those of the Group.
Upon loss of significant influence over the associate, the Group measures any retained investment at its fair value. Any difference between the carrying amount of the associate upon loss of significant influence and the fair value of the aggregate of the retained investment and proceeds from disposal is recognised in the income statement.

44 the hour glaSS limited annual report 2011
2.11 Impairment of non-financial assets
The Group assesses at each reporting date whether there is an indication that an asset may be impaired. If any such indication exists, or when annual impairment assessment for an asset is required, the Group makes an estimate of the asset’s recoverable amount.
An asset’s recoverable amount is the higher of an asset’s or cash-generating unit’s fair value less costs to sell and its value in use and is determined for an individual asset, unless the asset does not generate cash inflow that are largely independent of those from other assets. Where the carrying amount of an asset or cash-generating unit exceeds its recoverable amount, the asset is considered impaired and is written down to its recoverable amount. In assessing value in use, the estimated future cash flow expected to be generated by the asset are discounted to their present value.
Impairment losses of continuing operations are recognised in the income statement in those expense categories consistent with the function of the impaired asset, except for assets that are previously revalued where the revaluation was taken to other comprehensive income. In this case the impairment is also recognised in other comprehensive income up to the amount of any previous revaluation.
An assessment is made at each reporting date as to whether there is any indication that previously recognised impairment losses may no longer exist or may have decreased. If such indication exists, the Group estimates the asset’s or cash-generating unit’s recoverable amount. A previously recognised impairment loss is reversed only if there has been a change in the estimates used to determine the asset’s recoverable amount since the last impairment loss was recognised. If that is the case, the carrying amount of the asset is increased to its recoverable amount. That increase cannot exceed the carrying amount that would have been determined, net of depreciation, had no impairment loss been recognised previously. Such reversal is recognised in the income statement unless the asset is measured at revalued amount, in which case the reversal is treated as a revaluation increase.
2.12 financial assets
Initial recognition and measurement
Financial assets are recognised on the statements of financial position when, and only when, the Group becomes a party to the contractual provisions of the financial instrument. The Group determines the classification of its financial assets at initial recognition.
When financial assets are recognised initially, they are measured at fair value, plus, in the case of financial assets not at fair value through profit or loss, directly attributable transaction costs.
Subsequent measurement
The subsequent measurement of financial assets depends on their classification as follows:
(a) Financial assets at fair value through income statement
Derivative financial instruments whose fair value is positive are classified as financial assets at fair value through income statement. The accounting policy for derivative financial instruments is included in Note 2.25.
(b) Loans and receivables
Non-derivative financial assets with fixed or determinable payments that are not quoted in an active market are classified as loans and receivables. Subsequent to initial recognition, loans and receivables are measured at amortised cost using the effective interest method, less impairment. Gains and losses are recognised in the income statement when the loans and receivables are derecognised or impaired, and through the amortisation process.
The Group classifies the following financial assets as loans and receivables:
• Cash and bank balances and fixed deposits with banks
• Trade and other receivables, including amounts due from subsidiaries and an associate.

45
2.12 financial assets (cont’d)
(c) Available-for-sale financial assets
The Group classifies its investment security as available-for-sale financial assets.
Available-for-sale financial assets are financial assets that are not classified in any of the other categories. After initial recognition, available-for-sale financial assets are measured at fair value. Any gains or losses from changes in fair value of the financial asset are recognised in other comprehensive income, except that impairment losses, foreign exchange gains and losses on monetary instruments and interest calculated using the effective interest method are recognised in the income statement. The cumulative gain or loss previously recognised in other comprehensive income is reclassified from equity to the income statement as a reclassification adjustment when the financial asset is derecognised.
Investments in equity instruments whose fair value cannot be reliably measured are measured at cost less impairment loss; increase in the fair value after impairment are recognised directly in other comprehensive income.
Derecognition
A financial asset is derecognised where the contractual right to receive cash flow from the asset has expired. On derecognition of a financial asset, the difference between the carrying amount and the sum of the consideration received and any cumulative gain or loss that has been recognised directly in other comprehensive income is recognised in the income statement.
2.13 Impairment of financial assets
The Group assesses at each reporting date whether there is any objective evidence that a financial asset is impaired.
(a) Financial assets carried at amortised cost
For financial assets carried at amortised cost, the Group first assesses individually whether objective evidence of impairment exists individually for financial assets that are individually significant, or collectively for financial assets that are not individually significant. If the Company determines that no objective evidence of impairment exists for an individually assessed financial asset, whether significant or not, it includes the asset in a group of financial assets with similar credit risk characteristics and collectively assesses them for impairment. Assets that are individually assessed for impairment and for which an impairment loss is, or continues to be recognised are not included in a collective assessment of impairment.
If there is objective evidence that an impairment loss on financial assets carried at amortised cost has been incurred, the amount of the loss is measured as the difference between the asset’s carrying amount and the present value of estimated future cash flow discounted at the financial asset’s original effective interest rate. If a loan has a variable interest rate, the discount rate for measuring any impairment loss is the current effective interest rate. The carrying amount of the asset is reduced through the use of an allowance account. The impairment loss is recognised in the income statement.
When the asset becomes uncollectible, the carrying amount of impaired financial assets is reduced directly or if an amount was charged to the allowance account, the amounts charged to the allowance account are written off against the carrying value of the financial asset.
To determine whether there is objective evidence that an impairment loss on financial assets has incurred, the Group considers factors such as the probability of insolvency or significant financial difficulties of the debtor and default or significant delay in payments.
If in a subsequent period, the amount of the impairment loss decreases and the decrease can be related objectively to an event occurring after the impairment was recognised, the previously recognised impairment loss is reversed to the extent that the carrying value of the asset does not exceed its amortised cost at the reversal date. The amount of reversal is recognised in the income statement.

46 the hour glaSS limited annual report 2011
2.13 Impairment of financial assets (cont’d)
(b) Financial assets carried at cost
If there is objective evidence that an impairment loss on financial assets carried at cost has been incurred, the amount of the loss is measured as the difference between the asset’s carrying amount and the present value of estimated future cash flow discounted at the current market rate of return for a similar financial asset. Such impairment losses are not reversed in subsequent periods.
(c) Available-for-sale financial assets
Significant or prolonged decline in fair value below cost, significant financial difficulties of the issuer or obligor, and the disappearance of an active trading market are considerations to determine whether there is objective evidence that investment securities classified as available-for-sale financial assets are impaired.
If an available-for-sale financial asset is impaired, an amount comprising the difference between its cost (net of any principal payment and amortisation) and its current fair value, less any impairment loss previously recognised in the income statement, is transferred from other comprehensive income to the income statement. Reversals of impairment loss in respect of equity instruments are not recognised in the income statement; increase in the fair value after impairment are recognised directly in other comprehensive income.
2.14 Inventories
Inventories are stated at the lower of cost (specific identification method) and net realisable value.
Costs incurred in bringing the inventories to their present location and condition are accounted for as purchase costs.
Where necessary, allowance is provided for obsolete and slow moving items to adjust the carrying value of inventories to the lower of cost and net realisable value.
Net realisable value is the estimated selling price in the ordinary course of business, less estimated costs necessary to make the sale.
2.15 Cash and cash equivalents
Cash and cash equivalents comprise cash at bank and on hand, and fixed deposits that are readily convertible to known amounts of cash and which are subject to an insignificant risk of changes in value. These also include bank overdrafts that form an integral part of the Group’s cash management.

47
2.16 financial liabilities
Initial recognition and measurement
Financial liabilities are recognised on the statements of financial position when, and only when, the Group becomes a party to the contractual provisions of the financial instrument. The Group determines the classification of its financial liabilities at initial recognition.
All financial liabilities are recognised initially at fair value and in the case of financial liabilities other than derivatives, plus directly attributable transaction costs.
Subsequent measurement
After initial recognition, financial liabilities are subsequently measured at amortised cost using the effective interest rate method. Gains and losses are recognised in the income statement when the liabilities are derecognised, and through the amortisation process.
Derecognition
A financial liability is derecognised when the obligation under the liability is discharged or cancelled or expires. For financial liabilities other than derivatives, gains and losses are recognised in the income statement when the liabilities are derecognised and through the amortisation process. Any gains or losses arising from changes in fair value of derivatives are recognised in the income statement. Net gains or losses on derivatives include exchange differences.
2.17 borrowing costs
Borrowing costs are capitalised as part of the cost of a qualifying asset if they are directly attributable to the acquisition, construction or production of that asset. Capitalisation of borrowing costs commences when the activities to prepare the asset for its intended use or sale are in progress and the expenditures and borrowing costs are incurred. Borrowing costs are capitalised until the assets are substantially completed for their intended use or sale. All other borrowing costs are expensed in the period they occur. Borrowing costs consist of interest and other costs incurred in connection with the borrowing of funds.
2.18 provisions
Provisions are recognised when the Group has a present obligation as a result of a past event, it is probable that an outflow of resources embodying economic benefits will be required to settle the obligation and a reliable estimate can be made of the amount of the obligation.
Provisions are reviewed at the end of each reporting period and adjusted to reflect the current best estimate. If it is no longer probable that an outflow of economic resources will be required to settle the obligation, the provision is reversed. If the effort of the time value of money is material, provisions are discounted using a current pre tax rate that reflects, where appropriate, the risks specific to the liability. When discounting is used, the increase in the provision due to the passage of time is recognised as a finance cost.

48 the hour glaSS limited annual report 2011
2.19 Employee benefits
(a) Defined contribution plans
The Group participates in the national pension schemes as defined by the laws of the countries in which it has operations. In particular, the Singapore companies in the Group make contributions to the Central Provident Fund scheme in Singapore, a defined contribution pension scheme. Contributions to national pension schemes are recognised as an expense in the period in which the related service is performed.
(b) Employee leave entitlement
Employee entitlements to annual leave are recognised as a liability when they accrue to the employees. The estimated liability for leave is recognised for services rendered by employees up to end of the reporting period.
(c) Long service leave
The liability for long service leave is recognised in the provision for employee benefits and measured as the present value of expected future payments to be made in respect of services provided by employees up to the reporting date using the projected unit credit method. Consideration is given to expected future wage and salary levels, experience of employee departures, and periods of service. Expected future payments are discounted using market yields at the reporting date on national government bonds with terms to maturity and currencies that match, as closely as possible, the estimated future cash outflow.
2.20 Deferred income
Income received from landlord over fit-out of a demised premise where the income is amortised over the tenancy period. The Group is required to repay the landlord the remaining unexpired tenancy period in the event of early termination of the tenancy agreement.
2.21 leases
The determination of whether an arrangement is, or contains a lease is based on the substance of the arrangement at inception date: whether fulfilment of the arrangement is dependent on the use of a specific asset or assets or the arrangement conveys a right to use the asset.
As lessee
Finance leases, which transfer to the Group substantially all the risks and rewards incidental to ownership of the leased item, are capitalised at the inception of the lease at the fair value of the leased asset or, if lower, at the present value of the minimum lease payments. Any initial direct costs are also added to the amount capitalised. Lease payments are apportioned between the finance charges and reduction of the lease liability so as to achieve a constant rate of interest on the remaining balance of the liability. Finance charges are charged to the income statement. Contingent rents, if any, are charged as expenses in the periods in which they are incurred.
Operating lease payments are recognised as an expense in the income statement on a straight-line basis over the lease term. The aggregate benefit of incentives provided by the lessor is recognised as a reduction of rental expense over the lease term on a straight-line basis.
As lessor
Leases where the Group retains substantially all the risks and rewards of ownership of the asset are classified as operating leases. Initial direct costs incurred in negotiating an operating lease are added to the carrying amount of the leased asset and recognised over the lease term on the same bases as rental income. The accounting policy for rental income is set out in Note 2.22(b). Contingent rents are recognised as revenue in the period in which they are earned.

49
2.22 Revenue
Revenue is recognised to the extent that it is probable that the economic benefits will flow to the Group and the revenue can be reliably measured. Revenue is measured at the fair value of consideration received or receivable. The Group assesses its revenue arrangements to determine if it is acting as principal or agent. The Group has concluded that it is acting as a principal in all of its revenue arrangements. The following specific recognition criteria must also be met before revenue is recognised:
(a) Sale of goods
Revenue from the sale of goods is recognised upon transfer of significant risk and rewards of ownership of the goods to the customer which, generally coincides with their delivery and acceptance of the goods sold. Revenue represents sale of goods after deducting allowances for goods returned and trade discounts.
(b) Rental income
Rental income arising from operating leases on investment properties is accounted for on a straight-line basis over the lease terms. The aggregate costs of incentives provided to lessees are recognised as a reduction of rental income over the lease term on a straight-line basis.
(c) Interest income
Interest income is recognised using the effective interest method.
2.23 Taxes
(a) Current income tax
Current income tax assets and liabilities for the current and prior periods are measured at the amount expected to be recovered from or paid to the taxation authorities. The tax rates and tax laws used to compute the amount are those that are enacted or substantively enacted by the end of the reporting period, in the countries where the Group operates and generates taxable income.
Current income taxes are recognised in the income statement except that tax relating to items recognised outside the income statement, either in other comprehensive income or directly in equity. Management periodically evaluates positions taken in the tax returns with respect to situations in which applicable tax regulations are subject to interpretation and establishes provisions where appropriate.
(b) Deferred tax
Deferred tax is provided using the liability method on temporary differences at the end of the reporting period between the tax bases of assets and liabilities and their carrying amounts for financial reporting purposes.
Deferred tax liabilities are recognised for all temporary differences, except:
• Where the deferred tax liability arises from the initial recognition of an asset or liability in a transaction that is not a business combination and, at the time of the transaction, affects neither the accounting profit nor taxable profit or loss; and
• In respect of taxable temporary differences associated with investments in subsidiaries and associate where the timing of the reversal of the temporary differences can be controlled by the Group and it is probable that the temporary differences will not reverse in the foreseeable future.

50 the hour glaSS limited annual report 2011
2.23 Taxes (cont’d)
(b) Deferred tax (cont’d)
Deferred tax assets are recognised for all deductible temporary differences, carry forward of unused tax credits and unused tax losses, to the extent that it is probable that taxable profit will be available against which the deductible temporary differences, and the carry forward of unused tax credits and unused tax losses can be utilised except:
• Where the deferred tax asset relating to the deductible temporary difference arises from the initial recognition of an asset or liability in a transaction that is not a business combination and, at the time of the transaction, affects neither the accounting profit nor taxable profit or loss; and
• In respect of deductible temporary differences associated with investments in subsidiaries and associate, deferred tax assets are recognised only to the extent that it is probable that the temporary differences will reverse in the foreseeable future and taxable profit will be available against which the temporary differences can be utilised.
The carrying amount of deferred tax assets is reviewed at the end of each reporting period and reduced to the extent that it is no longer probable that sufficient taxable profit will be available to allow all or part of the deferred tax asset to be utilised. Unrecognised deferred tax assets are reassessed at the end of each reporting period and are recognised to the extent that it has become probable that future taxable profit will allow the deferred tax asset to be recovered.
Deferred tax assets and liabilities are measured at the tax rates that are expected to apply in the year when the asset is realised or the liability is settled, based on tax rates and tax laws that have been enacted or substantively enacted at the end of the reporting period.
Deferred tax relating to items recognised outside the income statement is recognised outside income statement. Deferred tax items are recognised in correlation to the underlying transaction either in other comprehensive income or directly in equity.
Deferred tax assets and deferred tax liabilities are offset, if a legally enforceable right exists to set off current tax assets against current income tax liabilities and the deferred income taxes relate to the same taxable entity and the same taxation authority.
(c) Sales tax
Revenue, expenses and assets are recognised net of the amount of sales tax except:
• Where the sales tax incurred on a purchase of assets or services is not recoverable from the taxation authority, in which case the sales tax is recognised as part of the cost of acquisition of the asset or as part of the expense item as applicable; and
• Receivables and payables that are stated with the amount of sales tax included.
The net amount of sales tax recoverable from, or payable to, the taxation authority is included as part of receivables or payables in the statements of financial position.
2.24 Segment reporting
For management purposes, the Group is organised into operating segments based on their products and services which are independently managed by the respective segment managers responsible for the performance of the respective segments under their charge. The segment managers report directly to the management of the Company who regularly reviews the segment results in order to allocate resources to the segments and to assess the segment performance. Additional disclosures on each of these segments are shown in Note 35, including the factors used to identify the reportable segments and the measurement basis of segment information.

51
2.25 Derivative financial instruments
The Group uses forward currency contracts to hedge its risks associated with foreign currency fluctuations. Such derivative financial instruments are initially recognised at fair value on the contract date and are subsequently remeasured at fair value. Derivative financial instruments are carried as assets when the fair value is positive and as liabilities when the fair value is negative.
Any gains or losses arising from changes in fair value on derivative financial instruments that do not qualify as hedge accounting are taken to the income statement for the year.
The fair value of forward currency contracts is calculated by reference to current forward exchange rates for contracts with similar maturity profiles.
2.26 Contingencies
A contingent liability is:
(a) a possible obligation that arises from past events and whose existence will be confirmed only by the occurrence or non-occurrence of one or more uncertain future events not wholly within the control of the Group; or
(b) a present obligation that arises from past events but is not recognised because:
(i) It is not probable that an outflow of resources embodying economic benefits will be required to settle the obligation; or
(ii) The amount of the obligation cannot be measured with sufficient reliability.
Contingent liabilities are not recognised on the statements of financial position of the Group.
2.27 Related parties
A party is considered to be related to the Group if:
(a) The party, directly or indirectly through one or more intermediaries,
(i) controls, is controlled by, or is under common control with, the Group;
(ii) has an interest in the Group that gives it significant influence over the Group; or
(iii) has joint control over the Group;
(b) The party is an associate;
(c) The party is a jointly-controlled entity;
(d) The party is a member of the key management personnel of the Group or its parent;
(e) The party is a close member of the family of any individual referred to in (a) or (d); or
(f) The party is an entity that is controlled, jointly controlled or significantly influenced by or for which significant voting power in such entity resides with, directly or indirectly, any individual referred to in (d) or (e); or
(g) The party is a post-employment benefit plan for the benefit of the employees of the Group, or of any entity that is a related party of the Group.

52 the hour glaSS limited annual report 2011
3 Significant accounting judgements and estimates
The preparation of the Group’s financial statements requires management to make judgements, estimates and assumptions that affect the reported amounts of revenue, expenses, assets and liabilities, and the disclosure of contingent liabilities at the reporting date. However, uncertainty about these assumptions and estimates could result in outcomes that could require a material adjustment to the carrying amount of the asset or liability affected in the future periods.
3.1 Judgements made in applying accounting policies
In the process of applying the Group’s accounting policies, management has made the following judgements, apart from those involving estimations, which has the most significant effect on the amounts recognised in the financial statements:
(a) Impairment of available-for-sale investments
The Group records impairment charges on available-for-sale equity investments when there has been a significant or prolonged decline in the fair value below their cost. The determination of what is “significant” or “prolonged” requires judgment. In making this judgment, the Group evaluates, among other factors, historical share price movements and the duration and extent to which the fair value of an investment is less than its cost. For the financial year ended 31 March 2011 and 31 March 2010, there was no impairment loss recognised for available- for-sale financial assets.
(b) Income taxes
The Group has exposure to income taxes in several jurisdictions. Significant judgement is involved in determining the Group-wide provision for income taxes. There are certain transactions and computations for which the ultimate tax determination is uncertain during the ordinary course of business. The Group recognises liabilities for expected tax issues based on estimates of whether additional taxes will be due. Where the final tax outcome of these matters is different from the amounts that were initially recognised, such differences will impact the income tax and deferred tax provisions in the period in which such determination is made. The Group’s and the Company’s income tax and deferred tax provisions are as follows:
Group Company 2011 2010 2011 2010
$’000 $’000 $’000 $’000
Deferred tax assets 513 297 – – Provision for taxation (8,111) (5,872) (5,802) (3,995) Deferred tax liabilities (1,280) (481) (702) (481)
(c) Classification between leasehold land element from leasehold land and building
The Group determines the carrying value of the land element of the leasehold land and buildings held in relation to the value of the entire lease is insignificant and cannot be reliably allocated. Accordingly, the leasehold land and buildings held was treated as a single unit.

53
3.2 Key sources of estimation uncertainty
The key assumptions concerning the future and other key sources of estimation uncertainty at the end of the reporting period, that have a significant risk of causing a material adjustment to the carrying amounts of assets and liabilities within the next financial year are discussed below.
(a) Useful lives of property, plant and equipment
The cost of property, plant and equipment is depreciated on a straight-line basis over their estimated useful lives. Management estimates the useful lives of these property, plant and equipment to be within 2 to 5 years, except for freehold and leasehold premises which are depreciated over 50 years. The carrying amount of the Group’s property, plant and equipment at 31 March 2011 was $25,076,000 (2010: $18,819,000). Changes in the expected level of usage could impact the economic useful lives and the residual values of these assets, therefore future depreciation charges could be revised.
(b) Impairment of loans and receivables
The Group assesses at the end of each reporting period whether there is any objective evidence that a financial asset is impaired. To determine whether there is objective evidence of impairment, the Group considers factors such as the probability of insolvency or significant financial difficulties of the debtor and default or significant delay in payments.
Where there is objective evidence of impairment, the amount and timing of future cash flows are estimated based on historical loss experience for assets with similar credit risk characteristics. The carrying amount of the Group’s loans and receivables at the end of the reporting period is disclosed in Note 21 and Note 31 to the financial statements.
(c) Allowances for inventories
Management reviews the inventory ageing listing on a periodic basis. This review involves comparison of the carrying value of the aged inventory items with the respective net realisable value. The purpose is to ascertain whether any allowance is required to be made in the financial statements for slow-moving items. Management is satisfied that adequate allowance for inventory has been made in the financial statements. In addition, the Group has assessed provision for stock pilferage. Management is satisfied that adequate provision for stock pilferage has been made in the financial statements based on the management’s industry experience and the Group’s fidelity insurance policy. The carrying amount of the Group’s stocks at the end of the reporting period is disclosed in Note 20 to the financial statements.
4 Revenue
Revenue represents sale of goods after deducting allowances for goods returned and trade discounts.

54 the hour glaSS limited annual report 2011
5 Other income
Group 2011 2010 $’000 $’000 Rental income 952 637 Interest income from: - Amount due from an associate 131 101 - Cash at banks and short-term deposits 242 203 Management fee 457 388 Net gain on disposal of property, plant and equipment 383 – Fair value gain on investment properties 1,370 2,838 Others 682 469 4,217 4,636
6 finance costs
Group 2011 2010 $’000 $’000 Interest on bank term loans 547 420 Interest on bank overdrafts 5 5 552 425
7 Other operating expenses
Group 2011 2010 $’000 $’000 Facilities cost 2,995 2,780 Professional fees 1,028 885 General administrative expenses 3,082 2,603 7,105 6,268

55
8 profit before taxation
The following items have been included in arriving at profit before taxation:
Group 2011 2010 $’000 $’000 Salaries and employees benefits (including executive directors): - salaries, bonuses and other costs 30,169 28,139 - provident fund contributions 2,196 2,040 - provision for retirement gratuity 50 50 Directors’ fees 248 231 Non audit fees paid to auditors of the Company 151 37 Provision for doubtful debts 28 107 Net (gain)/loss on disposal of property, plant and equipment (383) 46
9 Taxation
Group 2011 2010 $’000 $’000 Provision for taxation in respect of results for the year: Current taxation 10,796 8,089 Deferred taxation 199 269 Under/(over) provision in respect of previous years: Current taxation 200 (336) Deferred taxation (93) 185
11,102 8,207

56 the hour glaSS limited annual report 2011
9 Taxation (cont’d)
The reconciliation of the statutory tax rate to the Group’s effective tax rate applicable to profit before taxation is as follows:
Group 2011 2010 $’000 $’000 Profit before taxation 54,283 41,685
Tax calculated using Singapore corporate tax rate of 17% 9,228 7,086 Adjustments: Non-deductible expenses 146 296 Effect of different tax rates in other countries 1,563 1,321 Deferred tax assets not recognised 435 17 Benefits from previously unrecognised tax losses (9) (15) Non-taxable income (7) (88) Tax exempt income and incentives (52) (52) Under/(over) provision in respect of previous years 107 (151) Share of results of an associate (334) (199) Others 25 (8)
Taxation for the year 11,102 8,207
As at 31 March 2011, certain subsidiaries have unabsorbed tax losses of approximately $1,984,000 (2010: $1,162,000) available for offset against future taxable profits of the subsidiaries in which the losses arose, for which no deferred tax asset is recognised due to uncertainty of their recoverability. The use of these tax losses is subject to the agreement of the tax authorities and compliance with certain provisions of the tax legislation of the respective countries in which the subsidiaries operate.
The above reconciliation is prepared by aggregating separate reconciliations for each national jurisdiction.
Deferred tax expense related to other comprehensive income:
Net surplus on revaluation of leasehold premises 500 –

57
10 Dividends
Group 2011 2010 $’000 $’000 Declared and paid during the year Dividends on ordinary shares: - Final exempt (one-tier) dividend in respect of the year ended 31 March 2010: 3.50 cents (31 March 2009: 2.50 cents) 8,188 5,798
Proposed but not recognised as a liability as at 31 March Dividends on ordinary shares, subject to shareholders’ approval at the Annual General Meeting: - Final exempt (one-tier) dividend in respect of the year ended 31 March 2011: 5.0 cents (31 March 2010: 3.50 cents) 11,717 8,188
The Company’s scrip dividend scheme under which shareholders may elect to receive dividends in the form of new shares in lieu of cash will apply to the FY2011 Dividend.
11 Earnings per share
Group 2011 2010 $’000 $’000 Profit for the year attributable to owners of the parents 42,375 32,817
‘000 ‘000 Weighted average number of ordinary shares for calculation of basic and diluted earnings per share 234,156 233,007

58 the hour glaSS limited annual report 2011
12 property, plant and equipment freehold leasehold furniture and motor premises premises equipment vehicles Total $’000 $’000 $’000 $’000 $’000 Group
Cost:
At 1 April 2009 17,843 2,641 15,610 1,613 37,707 Additions – – 5,662 – 5,662 Disposals/write-offs – – (2,059) – (2,059) Transfer to investment properties (4,569) – – – (4,569) Foreign currency translation
adjustment 1,234 (212) 1,361 2 2,385 At 31 March 2010 and 1 April 2010 14,508 2,429 20,574 1,615 39,126 Additions – – 11,451 647 12,098 Disposals/write-offs – – (7,368) (603) (7,971) Transfer to investment properties – (2,298) – – (2,298) Foreign currency translation
adjustment 68 (131) 8 (2) (57) At 31 March 2011 14,576 – 24,665 1,657 40,898 Accumulated depreciation: At 1 April 2009 5,223 1,763 12,220 797 20,003 Depreciation charge for the year 367 24 2,547 322 3,260 Disposals/write-offs – – (1,995) – (1,995) Transfer to investment properties (1,881) – – – (1,881) Foreign currency translation
adjustment 234 (143) 827 2 920 At 31 March 2010 and 1 April 2010 3,943 1,644 13,599 1,121 20,307 Depreciation charge for the year 286 9 3,751 335 4,381 Disposals/write-offs – – (6,753) (492) (7,245) Transfer to investment properties – (1,543) – – (1,543) Foreign currency translation
adjustment 19 (110) 14 (1) (78)
At 31 March 2011 4,248 – 10,611 963 15,822
Net carrying value: At 31 March 2011 10,328 – 14,054 694 25,076
At 31 March 2010 10,565 785 6,975 494 18,819

59
12. property, plant and equipment (cont’d)
Group Cost 2011 2010 $’000 $’000 Freehold premises Singapore 638 square metres office unit at 302 Orchard Road, #11-01 Tong Building 7,664 7,664
Australia 283 square metres shop unit at Lot 4, 70 Castlereagh Street, Sydney 3,006 2,972
389 square metres office unit at Lot 21, 70 Castlereagh Street, Sydney 3,021 2,988
318 square metres shop unit at 252 Collins Street, Melbourne 704 698
malaysia 116 square metres office unit at Suite 12-2, 12th Floor, Wisma UOA II
21 Jalan Pinang, Kuala Lumpur 181 186
14,576 14,508
In September 2010, the leasehold premises were transferred to investment property. The Group has revalued the property up to the date of change in use. The Group has recorded the difference of $3,032,000 at that date between the carrying amount of the property and its fair value in other comprehensive income.
The leasehold premises were revalued to its fair value, which has been determined based on the latest valuations near to the transfer date. Valuations are performed by an accredited independent valuer with recent experience in the location and category of the properties being valued. The effects of the transfer are as follows:
2011 $’000 Revalued amount as at the date of transfer 3,787 Net book value up to the date of change in use 755
Revaluation surplus 3,032
Deferred tax liabilities 500
Asset revaluation reserve 2,532

60 the hour glaSS limited annual report 2011
12. property, plant and equipment (cont’d)
freehold furniture and motor premises equipment vehicles Total
$’000 $’000 $’000 $’000
Company Cost:
At 1 April 2009 12,233 6,189 1,334 19,756
Additions – 4,430 – 4,430
Disposals/write-offs – (1,467) – (1,467)
Transfer to investment properties (4,569) – – (4,569)
At 31 March 2010 and 1 April 2010 7,664 9,152 1,334 18,150
Additions – 7,229 647 7,876
Disposals/write-offs – (775) (603) (1,378)
At 31 March 2011 7,664 15,606 1,378 24,648
Accumulated depreciation:
At 1 April 2009 4,198 5,007 654 9,859
Depreciation charge for the year 237 1,522 267 2,026
Disposals/write-offs – (1,460) – (1,460)
Transfer to investment properties (1,881) – – (1,881)
At 31 March 2010 and 1 April 2010 2,554 5,069 921 8,544
Depreciation charge for the year 154 2,284 278 2,716
Disposals/write-offs – (775) (492) (1,267)
At 31 March 2011 2,708 6,578 707 9,993
Net carrying value:
At 31 March 2011 4,956 9,028 671 14,655
At 31 March 2010 5,110 4,083 413 9,606

61
13 Investment properties
Group Company 2011 2010 2011 2010 $’000 $’000 $’000 $’000
As at 1 April 13,715 7,332 8,350 3,600 Gain from fair value adjustments
recognised in income statement 1,370 2,838 500 2,062 Transfer from property, plant and equipment
at revalued amount* 3,787 2,688 – 2,688 Foreign currency translation adjustment (133) 857 – –
As at 31 March 18,739 13,715 8,850 8,350
Income statement Rental income from investment properties 925 614 567 314 Direct operating expenses arising from investment
properties that generated rental income 192 224 41 32
Valuation of investment properties
Investment properties are stated at fair value, which has been determined based on latest valuations near to the end of reporting period. Valuations are performed by accredited independent valuers with recent experience in the location and category of the properties being valued.
The investment properties held by the Group as at 31 March 2011 are as follows:
Description and location Existing use Tenure unexpired lease term
42 square metres unit at Centrepoint situated at 176 Orchard Road, Singapore Shop Leasehold 67 years
114 square metres unit at Peninsula Plaza situated at 111 North Bridge Road, Singapore Shop Freehold N/A
1,027 square metres unit at 252 Collins Street, Melbourne, Australia Shop and offices Freehold N/A
202 square metres unit at 1416 & 1416A, Starhouse, No. 3 Salisbury Road, Kowloon, Hong Kong* Office Leasehold 852 years
* In September 2010, a subsidiary transferred an office unit that was held as owner occupied property to investment
property.

62 the hour glaSS limited annual report 2011
14 Investment in subsidiaries
Company 2011 2010 $’000 $’000
Balance as at 1 April 19,959 20,459 Allowance for impairment loss – (500) Reversal of allowance for impairment loss 500 –
Balance as at 31 March 20,459 19,959
Subsidiaries held by the Company and the cost to the Company at 31 March are: Cost to Company
2011 2010 Name of subsidiaries $’000 $’000 Dynasty Watch Pte Ltd 500 500 Glajz-THG Pte Ltd 990 990 The Hour Glass Sdn Bhd 430 430 The Hour Glass (HK) Limited 10,261 10,261 The Hour Glass (Australia) Pty Ltd 4,646 4,646 The Hour Glass Japan Ltd 3,630 3,630 Time Master Enterprises Limited * * The Hour Glass Holding (Thailand) Co., Ltd 2 2
20,459 20,459
* Denotes amount less than $1,000
Details of the subsidiaries as at 31 March are:
Name of company Country of incorporation percentage of equity and place of business held by the Group
2011 2010 % %
Held by the Company Retailing and distribution of watches,
jewellery and related products
➀ Dynasty Watch Pte Ltd Singapore 100 100
➀ Glajz-THG Pte Ltd Singapore 60 60
➁ The Hour Glass Sdn Bhd Malaysia 95 95
➁ The Hour Glass (HK) Limited Hong Kong 100 100
➁ The Hour Glass (Australia) Pty Ltd Australia 100 100
➂ The Hour Glass Japan Ltd Japan 100 100

63
14 Investment in subsidiaries (cont’d)
Name of company Country of incorporation percentage of equity and place of business held by the Group
2011 2010 % %
Investment in properties
➁ Time Master Enterprises Limited Hong Kong 100 100
Investment holding
➁➃The Hour Glass Holding (Thailand) Co., Ltd Thailand 49 49
Held by subsidiaries
Retailing and distribution of watches and related products
➁ THG (HK) Limited Hong Kong 100 100
➁➃The Hour Glass (Thailand) Co., Ltd Thailand 49 49
➀ Audited by Ernst & Young LLP, Singapore.
➁ Audited by member firms of Ernst & Young Global in the respective countries.
➂ Not required to be audited under the laws of its country of incorporation.
➃ The Group holds a 98.97% controlling interest in the subsidiary through its voting rights.
15 Investment in an associate Group 2011 2010
$’000 $’000 Unquoted shares, at cost 1,479 1,479 Share of post-acquisition reserves 1,350 635 Foreign currency translation adjustment (41) 69
2,788 2,183
Details of the associate as at 31 March are:
Name of company Country of incorporation principal activities proportion (%) of ownership interest
2011 2010 % %
Held by subsidiary ➀ THG Prima Times Co., Ltd Thailand Retailing and distribution
of watches and 50 50 related products
➀ Audited by Total Audit Solutions, Thailand.

64 the hour glaSS limited annual report 2011
15 Investment in an associate (cont’d)
The summarised financial information of the associate, not adjusted for the proportion of ownership interest held by the Group, is as follows:
Group 2011 2010 $’000 $’000 Assets and liabilities: Total assets 17,380 17,404 Total liabilities 11,805 13,040
Results: Revenue 32,600 27,617 Profit for the year 1,430 1,025
16 loan to an associate
Loan to an associate is unsecured, and is not expected to be repaid within the next twelve months. Interest is chargeable at Thailand’s minimum lending rate (“MLR”), ranging from 5.85% to 6.62% (2010: 5.85%) per annum during the year.
17 Investment security Group and Company 2011 2010 $’000 $’000
Available-for-sale financial assets: Quoted equity shares As at 1 April 2,267 1,030 Fair value (loss)/gain transferred to other comprehensive income (1,031) 1,237
As at 31 March 1,236 2,267
18 Other receivables
Note Group Company 2011 2010 2011 2010
$’000 $’000 $’000 $’000 Current: - Goodwill compensation 22 344 313 344 313 - Deposits 22 604 6,665 287 409
948 6,978 631 722
Non-current: - Deposits 21 5,330 956 1,671 956
The goodwill compensation receivable arises from a principal for giving up distribution rights in certain territories/ countries in the Asia Pacific region. The goodwill compensation is receivable in eight equal instalments of 250,000 Swiss Franc per annum until year 2011.
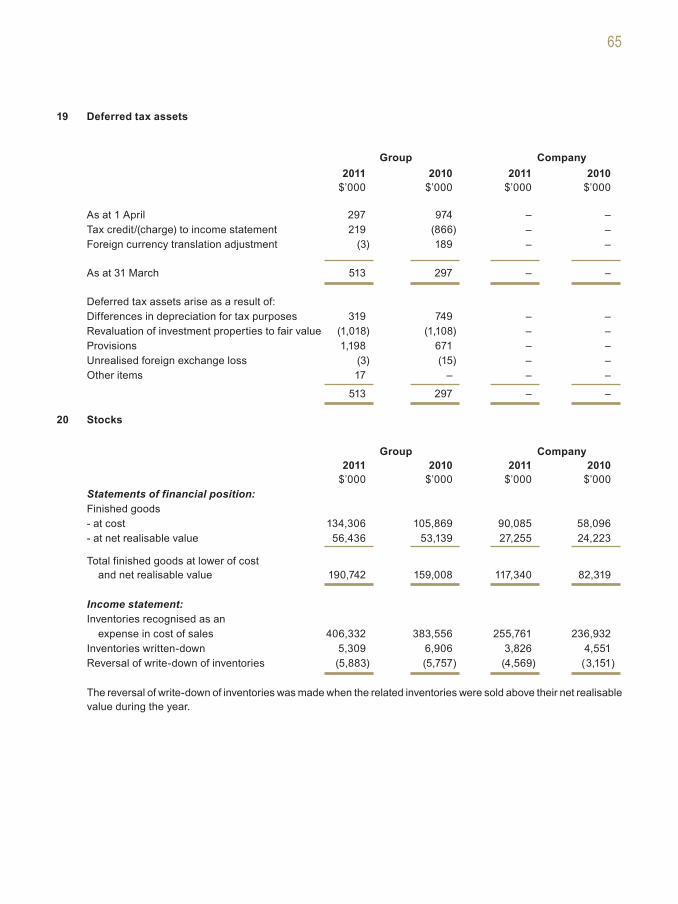
65
19 Deferred tax assets
Group Company 2011 2010 2011 2010
$’000 $’000 $’000 $’000
As at 1 April 297 974 – – Tax credit/(charge) to income statement 219 (866) – – Foreign currency translation adjustment (3) 189 – –
As at 31 March 513 297 – –
Deferred tax assets arise as a result of: Differences in depreciation for tax purposes 319 749 – – Revaluation of investment properties to fair value (1,018) (1,108) – – Provisions 1,198 671 – – Unrealised foreign exchange loss (3) (15) – – Other items 17 – – –
513 297 – –
20 Stocks
Group Company 2011 2010 2011 2010
$’000 $’000 $’000 $’000 Statements of financial position: Finished goods - at cost 134,306 105,869 90,085 58,096 - at net realisable value 56,436 53,139 27,255 24,223
Total finished goods at lower of cost and net realisable value 190,742 159,008 117,340 82,319
Income statement: Inventories recognised as an expense in cost of sales 406,332 383,556 255,761 236,932 Inventories written-down 5,309 6,906 3,826 4,551 Reversal of write-down of inventories (5,883) (5,757) (4,569) (3,151)
The reversal of write-down of inventories was made when the related inventories were sold above their net realisable value during the year.

66 the hour glaSS limited annual report 2011
21 Trade and other debtors
Note Group Company 2011 2010 2011 2010 $’000 $’000 $’000 $’000
Trade and other debtors
Current
Trade debtors 11,285 9,340 5,842 4,386
Other debtors 22 4,665 12,806 4,037 3,256
Amount due from an associate 23 866 2,021 – –
Amounts due from subsidiaries 24 – – 3,946 9,440
16,816 24,167 13,825 17,082
Non-current
Other receivables 18 5,330 956 1,671 956
Loan to an associate 16 2,084 2,172 – –
7,414 3,128 1,671 956
Total trade and other receivables (current and non-current) 24,230 27,295 15,496 18,038
Trade debtors are non-interest bearing and are generally up to 90 day’s terms. They are recognised at their original invoiced amounts which represent their fair values on initial recognition.
Receivables that are past due but not impaired The Group has trade debtors amounting to approximately $2,184,000 (2010: $4,338,000) that are past due at the
end of the reporting period but not impaired. These receivables are unsecured and the analysis of their aging at the end of the reporting period is as follows:
Group 2011 2010 $’000 $’000 Trade debtors past due: Less than 30 days 674 1,782 30 to 60 days 321 227 61 to 90 days 168 122 91 to 120 days 15 3 More than 120 days 1,006 2,204
2,184 4,338
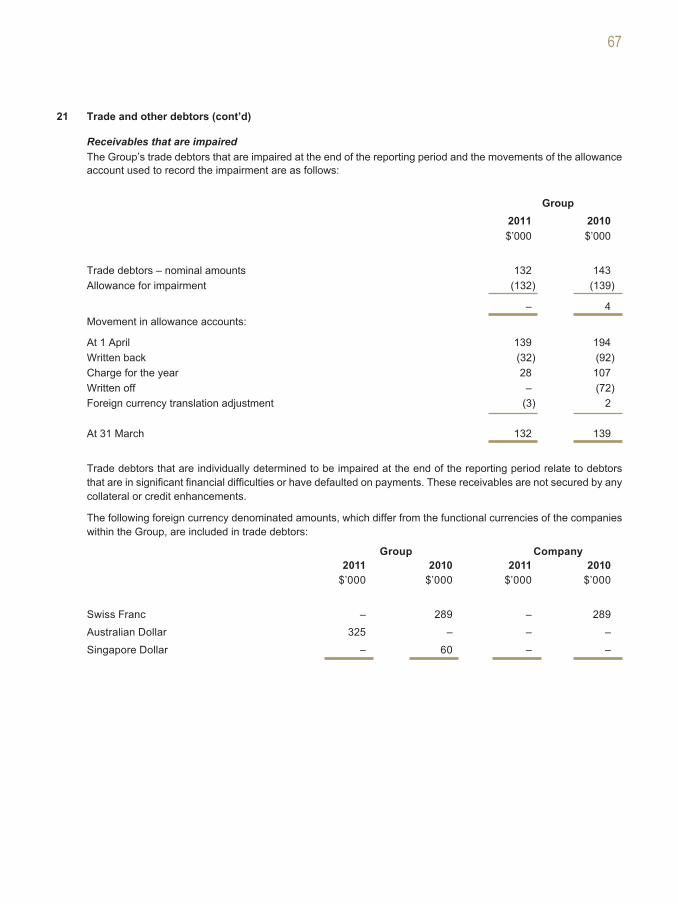
67
21 Trade and other debtors (cont’d)
Receivables that are impaired The Group’s trade debtors that are impaired at the end of the reporting period and the movements of the allowance
account used to record the impairment are as follows:
Group 2011 2010 $’000 $’000
Trade debtors – nominal amounts 132 143 Allowance for impairment (132) (139)
– 4 Movement in allowance accounts:
At 1 April 139 194 Written back (32) (92) Charge for the year 28 107 Written off – (72) Foreign currency translation adjustment (3) 2
At 31 March 132 139
Trade debtors that are individually determined to be impaired at the end of the reporting period relate to debtors that are in significant financial difficulties or have defaulted on payments. These receivables are not secured by any collateral or credit enhancements.
The following foreign currency denominated amounts, which differ from the functional currencies of the companies within the Group, are included in trade debtors:
Group Company 2011 2010 2011 2010 $’000 $’000 $’000 $’000
Swiss Franc – 289 – 289
Australian Dollar 325 – – –
Singapore Dollar – 60 – –

68 the hour glaSS limited annual report 2011
22 Other debtors
Note Group Company 2011 2010 2011 2010 $’000 $’000 $’000 $’000
Current portion of deposits 18 604 6,665 287 409
Recoverables and sundry debtors 3,707 5,816 3,395 2,523
Staff loans 10 12 11 11
Current portion of goodwill compensation 18 344 313 344 313
4,665 12,806 4,037 3,256
Other debtors are stated after deducting allowance for impairment 478 531 – –
Movement in allowance accounts:
At 1 April 531 578 – –
Foreign currency translation adjustment (53) (47) – –
At 31 March 478 531 – –
23 Amount due from an associate
Group 2011 2010 $’000 $’000 Amount due from an associate - trade 866 2,021
This amount represents trade receivables from the associate which are unsecured, non-interest bearing and are repayable on demand.

69
24 Amounts due from/(to) subsidiaries
Company 2011 2010 $’000 $’000 Amounts due from subsidiaries - trade 1,907 3,032 - non-trade 2,039 6,408 3,946 9,440 Amounts due to subsidiaries - trade (16) (62)
Trade receivables from/payable to subsidiaries are unsecured, non-interest bearing and are repayable within the
normal trade terms extended.
Non-trade balances with subsidiaries are unsecured and repayable on demand. There are outstanding balances of $800,000 (2010: $5,117,000) bears interest of 2.00% (2010: 1.37% to 4.0%) per annum.
25 loans and borrowings
Group Company 2011 2010 2011 2010 $’000 $’000 $’000 $’000
Unsecured borrowings 14,292 14,186 – –
Interest bearing loans and borrowings
The Group’s unsecured loans and borrowings comprise:
(i) Loan of $7,883,000 (RM19,000,000) [2010: $8,302,000 (RM19,500,000)] is repayable in April 2011. Interest is charged at rates ranging from 3.35% to 3.95% (2010: 3.05% to 3.65%) per annum.
(ii) Loan of $333,000 (Baht 8,000,000) [2010: $613,000 (Baht 14,100,000)] is repayable on demand. Interest is charged at rates ranging from 3.80% to 4.80% (2010: 3.80%) per annum.
(iii) Loan of $6,076,000 (JPY400,000,000) [2010: $5,271,000 (JPY350,000,000)] is repayable in April 2011. Interest is charged at rates ranging from 1.15% to 1.76% (2010: 1.76% to 2.28%) per annum.
The unsecured loans and borrowings of certain subsidiaries are covered by corporate guarantees by the Company.

70 the hour glaSS limited annual report 2011
26 Trade and other creditors
Note Group Company 2011 2010 2011 2010 $’000 $’000 $’000 $’000
Trade and other creditors (current)
Trade creditors 10,277 10,087 4,575 3,649
Other creditors 27 22,791 20,096 16,512 13,655
Amounts due to subsidiaries 24 – – 16 62
33,068 30,183 21,103 17,366
Other creditors (non-current) Provisions 145 223 – –
Deferred income 152 – – –
33,365 30,406 21,103 17,366
Add: Loans and borrowings 25 14,292 14,186 – –
Total financial liabilities carried at amortised cost 47,657 44,592 21,103 17,366
Trade creditors/other creditors
Trade creditors are non-interest bearing and are normally settled within the normal trade terms extended.
The following foreign currency denominated amounts, which differ from the functional currencies of the companies within the Group, are included in trade creditors:
Group Company 2011 2010 2011 2010 $’000 $’000 $’000 $’000
Singapore Dollar 430 185 – –
Swiss Franc 1,298 1,223 123 1,223
Others 162 51 162 46
27 Other creditors
Group Company 2011 2010 2011 2010 $’000 $’000 $’000 $’000
Deposits from customers 4,289 3,423 1,873 1,403
Accruals 16,853 15,837 13,600 11,683
Others 1,649 836 1,039 569
22,791 20,096 16,512 13,655

71
28 Deferred tax liabilities
Group Company 2011 2010 2011 2010 $’000 $’000 $’000 $’000 As at 1 April 481 744 481 33
Tax charge/(credit) to income statement 325 (412) 221 448
Tax charge to asset revaluation reserve 500 – – –
Foreign currency translation adjustment (26) 149 – –
As at 31 March 1,280 481 702 481
Deferred tax liabilities arise as a result of:
Differences in depreciation for tax purposes 543 225 543 225
Revaluations of investment properties to fair value 1,008 820 905 820
Revaluation of leasehold premises to fair value 500 – – –
Provisions (745) (564) (746) (564)
Other items (26) – – –
1,280 481 702 481
29 Share capital
Group and Company 2011 2010 No. of No. of shares shares ’000 $’000 ’000 $’000
Issued and fully paid ordinary shares:
Balance at beginning of year 233,955 66,514 231,919 65,206 Issue of ordinary shares # 377 312 2,036 1,308 Balance at end of year 234,332 66,826 233,955 66,514
The holders of ordinary shares are entitled to receive dividends as and when declared by the Company. All ordinary
shares carry one vote per share without restrictions.
# In July 2006, the Company implemented a scrip dividend scheme (the “Scheme”) which enabled shareholders to elect to receive new ordinary shares credited as fully paid in lieu of cash on dividends declared. During the year under review, 376,988 (2010: 2,035,795) new ordinary shares were issued in lieu of cash dividends pursuant to the Scheme.

72 the hour glaSS limited annual report 2011
30 Reserves
Group Company 2011 2010 2011 2010 $’000 $’000 $’000 $’000
Revenue reserve 177,234 143,047 97,351 76,068 Foreign currency translation reserve 3,194 6,157 – – Fair value adjustment reserve (206) 825 (206) 825 Asset revaluation reserve 2,532 – – – Total reserves 182,754 150,029 97,145 76,893
Foreign currency translation reserve
The foreign currency translation reserve is used to record exchange differences arising from the translation of the financial statements of foreign operations whose functional currencies are different from that of the Group’s presentation currency.
Fair value adjustment reserve
Fair value adjustment reserve represents the cumulative fair value changes, net of tax, of available-for-sale financial assets until they are disposed of or impaired.
Asset revaluation reserve
The asset revaluation reserve represents increases in the fair value of leasehold premises, net of tax, and decreases to the extent that such decrease relates to an increase on the same asset previously recognised in other comprehensive income.
31 Cash and cash equivalents
Cash and cash equivalents included in the consolidated cash flow statement comprise the following statements of financial position amounts:
Group Company 2011 2010 2011 2010 $’000 $’000 $’000 $’000
Cash and bank balances 32,526 39,950 12,541 22,832 Fixed deposits with banks 18,182 10,502 726 1,619
50,708 50,452 13,267 24,451
Cash and bank balances and fixed deposits with banks earn interest at floating rates based on daily bank deposit rates. Fixed deposits with banks are made for varying periods of between one day and six months depending on the immediate cash requirements of the Group.
The following foreign currency denominated amounts, which differ from the functional currencies of the companies within the Group, are included in cash and cash equivalents:
Group Company 2011 2010 2011 2010 $’000 $’000 $’000 $’000 United States Dollar 350 1,171 316 1,133 Swiss Franc 411 426 409 424 Hong Kong Dollar – 9 – 9 Singapore Dollar 261 447 – – Australian Dollar – 52 – 52

73
32 Related party transactions
(a) Sale and purchase of goods and services
In addition to those related party information disclosed elsewhere in the financial statements, the following significant transactions between the Group and related parties who are not members of the Group took place during the year at terms agreed between the parties:
management Sale of fees Interest purchase Rental
goods received income of goods expense $’000 $’000 $’000 $’000 $’000
2011
Associate 1,235 457 131 375 –
Directors of the Company 196 – – – –
Directors of the subsidiaries 149 – – – –
Director-related companies – – – 7 147
2010
Associate 1,121 388 101 512 –
Directors of the Company 121 – – – –
Directors of the subsidiaries 190 – – – –
Director-related companies – – – 59 306
(b) Compensation of key management personnel
Group 2011 2010 $’000 $’000 Short-term employee benefits 10,205 9,102 Provident fund contributions 129 132
Total compensation paid to key management personnel 10,334 9,234 Short-term employee benefits paid to the key management personnel comprised: - Directors of the Company 6,804 5,798 - Other key management personnel 3,530 3,436
10,334 9,234

74 the hour glaSS limited annual report 2011
33 Commitments
(a) Capital commitments
Capital expenditure contracted for as at the end of the reporting period but not recognised in the financial statements are as follows:
Group 2011 2010 $’000 $’000
Capital expenditure approved and contracted for: furniture and fittings 304 –
(b) Operating lease commitments – As lessor
The Group and Company have entered into commercial property leases on its investment properties portfolio as disclosed in Note 13. These non-cancellable leases have varying terms, escalation clauses and renewal rights.
Future minimum lease payments receivable under non-cancellable operating leases as at 31 March but not recognised as receivables, are as follows:
Group Company 2011 2010 2011 2010 $’000 $’000 $’000 $’000
Not later than one year 875 829 607 592
Later than one year but not later than five years 775 1,428 566 1,173
1,650 2,257 1,173 1,765
(c) Operating lease commitments – As lessee
The Group and the Company have entered into commercial leases on certain properties under lease agreements that are non-cancellable within the lease period. These leases have varying terms, escalation clauses and renewal rights.
Future minimum lease payments payable under non-cancellable operating leases as at 31 March but not recognised as liabilities, are as follows:
Group Company 2011 2010 2011 2010 $’000 $’000 $’000 $’000
Not later than one year 13,615 12,330 9,578 6,641
Later than one year but not later than five years 23,514 19,737 14,425 8,758
Later than five years 958 2,257 – 102
38,087 34,324 24,003 15,501

75
34 Contingent liabilities
Guarantees
The Company has provided corporate guarantees to banks for loans amounted to $14,292,000 (2010: $14,186,000) and $1,700,000 (2010: $1,287,000) taken by subsidiaries and an associate respectively. The loans are current and repayable within the year.
35 Segment information
Reporting format
The primary segment reporting format is determined to be geographical segments as the operating businesses are organised and managed separately according to the location of the Group assets, with each segment representing a strategic business unit to serve that market.
Geographical segments
The Group’s geographical segments are based on the location of the Group’s assets. Sales to external customers disclosed in geographical segments are based on the country of operation.
Business segment
The Group comprises only one business segment which is the retailing and distribution of watches and jewellery. All relevant information regarding the business segment has been disclosed elsewhere in the financial statements.
Allocation basis and transfer pricing
Segment results, assets and liabilities include items directly attributable to a segment as well as those that can be allocated on a reasonable basis. Unallocated items comprise mainly corporate assets, liabilities and expenses.
Transfer prices between geographical segments are set on an arm’s length basis in a manner similar to transactions with third parties. Segment revenue, expenses and results include transfers between geographical segments. These transfers are eliminated on consolidation.

76 the hour glaSS limited annual report 2011
35 Segment information (cont’d)
Geographical segments
The following table presents revenue, capital expenditure and certain assets and liabilities information regarding the Group’s geographical segments as at and for the years ended 31 March 2011 and 2010.
South East Asia and North Australia East Asia Total Eliminations Note Group
$’000 $’000 $’000 $’000 $’000 2011
Segment revenue:
Sales to external customers 439,164 78,453 517,617 – 517,617
Inter-segment sales 59 246 305 (305) A –
Other income 11,609 614 12,223 (8,006) B 4,217
Total revenue and other income 450,832 79,313 530,145 (8,311) 521,834
Segment results:
Segment results 50,218 11,017 61,235 (8,485) C 52,750
Finance costs (552)
Fair value gain on investment properties 1,370
Share of results of an associate 715
Profit before taxation 54,283
Taxation (11,102)
Profit for the year 43,181
Other segment information:
Segment assets 267,184 46,812 313,996 – 313,996
Unallocated corporate assets 513
314,509
Segment liabilities 39,094 8,563 47,657 – 47,657
Unallocated corporate liabilities 9,391
57,048
Capital expenditure for the year 11,245 853 12,098 – 12,098
Depreciation 3,927 454 4,381 – 4,381

77
35 Segment information (cont’d)
South East Asia and North Australia East Asia Total Eliminations Note Group
$’000 $’000 $’000 $’000 $’000 2010
Segment revenue:
Sales to external customers 405,143 78,519 483,662 – 483,662
Inter-segment sales 115 201 316 (316) A –
Other income 4,801 135 4,936 (300) B 4,636
Total revenue and other income 410,059 78,855 488,914 (616) 488,298
Segment results:
Segment results 27,611 11,460 39,071 (311 ) C 38,760
Finance costs (425)
Fair value gain on investment properties 2,838
Share of results of an associate 512
Profit before taxation 41,685
Taxation (8,207)
Profit for the year 33,478
Other segment information:
Segment assets 228,508 45,961 274,469 – 274,469
Unallocated corporate assets 297
274,766
Segment liabilities 36,913 7,679 44,592 – 44,592
Unallocated corporate liabilities 6,353
50,945
Capital expenditure for the year 5,023 639 5,662 – 5,662
Depreciation 3,143 117 3,260 – 3,260

78 the hour glaSS limited annual report 2011
35 Segment information (cont’d)
Notes Nature of adjustments and eliminations to arrive at amounts reported in the consolidated financial statements
A Inter-segment revenues are eliminated on consolidation.
B Inter-company dividends are eliminated on consolidation.
C The following items are added to/(deducted from) segment results to arrive at “Profit before taxation” presented in the consolidated income statement.
2011 2010 $’000 $’000 Profit from inter-segment sales (3) 33 Inter-company expenses 24 (44) Inter-company dividends (8,006) (300)
Write-back on impairment loss on investment in subsidiaries (500) –
Total (8,485) (311)
36 financial risk management objectives and policies
The Group and the Company is exposed to financial risks arising from its operations and the use of financial instruments. The key risks include interest rate risk, foreign currency risk, other price risk, liquidity risk and credit risk. The Group reviews and agrees policies and procedures for the management of these risks.
There has been no change to the Group’s exposure to these financial risks or the manner in which it manages and measures the risks.
Interest rate risk
Interest rate risk is the risk that the fair value of a financial instrument will fluctuate due to changes in market interest rates.
The Group’s exposure to interest rate risk arises primarily from its loans and borrowings and its investment portfolio in fixed deposits. The Group’s borrowings are predominantly denominated in floating rates and are expected to be repriced at intervals of less than one year from the financial year end. At present, the Group’s policy is to manage interest cost using floating rate debts and to obtain the most favourable interest rates available.
Cash surpluses arising from operations, which are not redeployed as working capital, are placed with reputable banks.
As at the end of the reporting period, if the interest of the floating rate loans and borrowings had been 100 (2010: 100) basis points higher/lower with all other variables held constant, the Group’s profit net of tax would have been $95,000 (2010: $96,000) lower/higher, arising mainly as a result of higher/lower interest expense on floating rate loans and borrowings.
Foreign currency risk
The Group has transactional currency exposure arising from purchases that are denominated in a currency other than the respective functional currencies of Group entities, primarily Swiss Franc (CHF) and Australian Dollar (AUD).
The Group and the Company also hold cash and cash equivalents denominated in foreign currencies for working capital purposes. At the end of the reporting period, such foreign currency balances amounted to $1,022,000 and $725,000 (2010: $2,105,000 and $1,618,000) for the Group and the Company respectively.

79
36 financial risk management objectives and policies (cont’d)
Foreign currency risk (cont’d)
The Group is also exposed to currency translation risk arising from its net investments in foreign operations. The currency exposures are limited to the Australian Dollar (AUD), Hong Kong Dollar (HKD), United States Dollar (USD), Japanese Yen (JPY), Malaysian Ringgit (MYR) and Thai Baht (BAHT). The Group’s net investments in foreign operations are not hedged as they are considered to be long-term in nature.
Sensitivity analysis for foreign currency risk
The following table demonstrates the sensitivity to a reasonably possible change in the CHF and AUD exchange rates (against SGD), with all other variables held constant, of the Group’s profit net of tax.
Group 2011 2010 Profit net Profit net
of tax of tax $’000 $’000 CHF - strengthened 4% (2010: 2%) (34) (3) - weakened 4% (2010: 2%) 34 3 AUD - strengthened 4% (2010: 6%) 10 2 - weakened 4% (2010: 6%) (10) (2)
Other price risk
Other price risk is the risk that the fair value or future cash flow of a financial instrument will fluctuate because of changes in the market prices (other than those arising from interest rate risk or currency risk), whether those changes are caused by factors specific to the individual financial instrument or its issuer, or factors affecting all similar financial instruments traded in the market.
The Group is exposed to marketable securities price risk. The Group’s investment in a company listed on the Singapore Exchange Securities Trading Limited, has been classified in the statements of financial position as available-for-sales financial assets.
Under FRS 39, an equity investment is considered to be impaired when there is a significant or prolonged decline in fair value below its cost. The impairment losses are required to be transferred from other comprehensive income to the income statement.
Any impairment loss recognised in respect of such equity instruments cannot be reversed through the income statement in subsequent periods. Subsequent increase in fair value must be recorded in other comprehensive income.
Sensitivity analysis for equity price risk
At the end of the reporting period, if the market price of the investment security had been 10% (2010: 10%) higher/lower with all other variables held constant, the Group’s fair value adjustment reserve in equity would have been $124,000 (2010: $227,000) higher/lower, arising as a result of an increase/decrease in the fair value of equity instruments classified as available-for-sale.
Liquidity risk
Liquidity risk is the risk that the Group or the Company will encounter difficulty in meeting financial obligations due to shortage of funds.

80 the hour glaSS limited annual report 2011
36 financial risk management objectives and policies (cont’d)
Liquidity risk (cont’d)
The Group’s exposure to liquidity risk is minimal. As at 31 March 2011, the Group has available cash and cash equivalents totalling approximately $50.7 million (2010: $50.5 million) to finance its operations.
The Group monitors and maintains a level of cash and cash equivalents deemed adequate by the management to finance the operations of the Group.
Short-term funding may be obtained from short-term loans where necessary.
The table below summarises the maturity profile of the Group’s and the Company’s financial assets and liabilities at the end of the reporting period based on contractual undiscounted repayment obligations.
2011 2010 less than 1 to 5 less than 1 to 5
1 year years Total 1 year years Total $’000 $’000 $’000 $’000 $’000 $’000
Group
Financial assets
Trade and other debtors 16,816 5,330 22,146 24,167 956 25,123
Loan to an associate – 2,498 2,498 – 2,553 2,553
Cash and cash equivalents 50,708 – 50,708 50,452 – 50,452
Total undiscounted financial assets 67,524 7,828 75,352 74,619 3,509 78,128
Financial liabilities
Trade and other payables 33,061 297 33,358 30,179 223 30,402
Loans and borrowings 14,328 – 14,328 14,217 – 14,217
Total undiscounted financial liabilities 47,389 297 47,686 44,396 223 44,619
Total net undiscounted financial assets 20,135 7,531 27,666 30,223 3,286 33,509
Company
Financial assets
Trade and other debtors 13,841 1,671 15,512 17,105 956 18,061
Cash and cash equivalents 13,267 – 13,267 24,451 – 24,451
Total undiscounted financial assets 27,108 1,671 28,779 41,556 956 42,512
Financial liabilities
Trade and other payables 21,103 – 21,103 17,366 – 17,366
Total undiscounted financial liabilities 21,103 – 21,103 17,366 – 17,366
Total net undiscounted financial assets 6,005 1,671 7,676 24,190 956 25,146

81
36 financial risk management objectives and policies (cont’d)
Credit risk
Credit risk is the risk of loss that may arise on outstanding financial instruments should a counterparty default on its obligations. It is the Group’s policy to transact with creditworthy counterparties. In addition, receivable balances are monitored on an on-going basis with the granting of material credit limits to counterparties being reviewed and approved by senior management.
With respect to credit risk arising from other financial instruments (including investment security, cash and cash equivalents), the Group and the Company minimise credit risk by dealing with high credit rating counterparties.
Since the Group trades only with recognised and creditworthy third parties, there is no requirement for collateral. At the end of the reporting period, the Group’s and the Company’s maximum exposure to credit risk is represented by the carrying amount of each class of financial assets recognised in the statements of financial position.
Financial assets that are neither past due nor impaired
Trade and other receivables that are neither past due nor impaired are creditworthy debtors with good payment record with the Group. Cash and cash equivalents, investment security and derivatives that are neither past due nor impaired are placed with or entered into with reputable financial institutions or companies with high credit ratings and no history of default.
Financial assets that are either past due or impaired
Information regarding financial assets that are either past due or impaired is disclosed in Note 17 (investment security) and Note 21 (trade and other debtors).
There is no significant concentration of credit risk within the Group and the Company.
37 fair value of financial instruments
Fair values
Fair value is defined as the amount at which the instrument could be exchanged in a current transaction between knowledgeable willing parties in an arm’s length transaction, other than in a forced or liquidation sale. Fair values are obtained through quoted market prices, discounted cash flow models and option pricing models as appropriate.
(a) Fair value of financial instruments that are carried at fair value
During the year, the Group has carried its other receivables at its fair values as required by FRS 39. Available- for-sale financial assets (Note 17) amounted to $1,236,000 (2010: $2,267,000).
Fair value hierarchy
The Group classify fair value measurement using a fair value hierarchy that reflects the significance of the inputs used in making the measurements. The fair value hierarchy has the following level:
Level 1 – Quoted prices (unadjusted) in active markets for identical assets or liabilities
Determination of fair value
Quoted equity instruments (Note 17): Fair value is determined by direct reference to their bid price quotations in an active market at the end of the reporting period.
(b) Financial instruments whose carrying amounts approximate fair values
Management has determined that the carrying amounts of cash and bank balances, fixed deposits with banks, trade and other debtors, amounts due from/(to) subsidiaries, amount due from an associate, trade and other creditors and interest bearing loans and borrowings, based on their notional amounts, reasonably approximate their fair values because these are mostly short term in nature or are repriced frequently.

82 the hour glaSS limited annual report 2011
38 Capital management
The primary objective of the Group’s capital management is to ensure that it maintains a strong credit rating and healthy capital ratios in order to support its business and maximise shareholder value.
The Group manages its capital structure and makes adjustments to it, in light of changes in economic conditions. In order to maintain or achieve an optimal capital structure, the Group may adjust the amount of dividend payment, return capital to shareholders, issue new shares or obtain new borrowings.
39 Authorisation of financial statements for issue
The financial statements for the year ended 31 March 2011 were authorised for issue in accordance with a resolution of the Directors on 31 May 2011.

83
STATISTICS Of ShAREhOlDINGS AS AT 2 JuNE 2011
Number of Shares : 234,331,711Class of Shares : OrdinaryVoting Rights : One vote per ordinary share
DISTRIbuTION Of ShAREhOlDINGS
No. of Size of Shareholdings Shareholders % No. of Shares %
1- 999 134 7.29 57,128 0.021,000 - 10,000 1,148 62.42 5,639,658 2.4110,001 - 1,000,000 539 29.31 26,281,732 11.221,000,001 and above 18 0.98 202,353,193 86.35
Total : 1,839 100.00 234,331,711 100.00
publIC flOAT
Rule 723 of the Listing Manual of the Singapore Exchange Securities Trading Limited requires a listed company to ensure that at least 10% of the total number of issued shares excluding treasury shares (excluding preference shares and convertible equity securities) in a class that is listed is at all times held by the public. The Company has complied with this requirement. As at 2 June 2011, approximately 36.27% of its ordinary shares listed on the Singapore Exchange Securities Trading Limited were held in the hands of the public.
SubSTANTIAl ShAREhOlDERS (AS SHOWN IN THE REGISTER OF SUBSTANTIAL SHAREHOLDERS)
No. of Shares Name Direct DeemedTYC Investment Pte Ltd 95,908,974 -
Key Hope Investment Limited 15,247,310 -
Swanson Pte Ltd 12,379,423 -
Dr Henry Tay Yun Chwan 13,315,246 123,535,707
Dato’ Dr Jannie Chan Siew Lee 9,351,826 108,288,397
➀
➁
➀ Dr Henry Tay Yun Chwan’s deemed interests arise from his interest in TYC Investment Pte Ltd, Key Hope Investment Limited and Swanson Pte Ltd.
➁ Dato’ Dr Jannie Chan Siew Lee’s deemed interests arise from her interest in TYC Investment Pte Ltd and Swanson Pte Ltd.

84 the hour glaSS limited annual report 2011
TwENTy lARGEST ShAREhOlDERS AS AT 2 JuNE 2011No. Name No. of Shares %
1 TYC Investment Pte Ltd 86,374,412 36.86
2 HSBC (Singapore) Nominees Pte Ltd 20,379,378 8.70
3 Key Hope Investment Limited 15,247,310 6.51
4 Henry Tay Yun Chwan 13,315,246 5.68
5 United Overseas Bank Nominees Pte Ltd 12,062,759 5.15
6 DBS Nominees Pte Ltd 8,890,670 3.79
7 Siong Lim Private Limited 8,551,000 3.65
8 Oversea-Chinese Bank Nominees Pte Ltd 6,534,562 2.79
9 Phillip Securities Pte Ltd 5,924,154 2.53
10 Swanson Pte Ltd 5,590,598 2.39
11 CIMB Nominees (S) Pte Ltd 4,300,000 1.84
12 Citibank Nominees Singapore Pte Ltd 3,310,144 1.41
13 Lim & Tan Securities Pte Ltd 3,186,794 1.36
14 OCBC Nominees Singapore Pte Ltd 2,183,756 0.93
15 Ong Yek Siang 1,999,241 0.85
16 UOB Kay Hian Pte Ltd 1,833,570 0.78
17 Tan Eng Hwa Rose 1,564,599 0.67
18 Chia Kum Ho 1,105,000 0.47
19 Sik Ley Boy 910,000 0.39
20 DBS Vickers Securities (S) Pte Ltd 845,228 0.36
Total : 204,108,421 87.11

85
- This page is intended to be blank -

SINGApORECORpORATE OffICEThE hOuR GlASS lImITED 302 Orchard Road #11-01 Tong Building Singapore 238862 Tel: (65) 6787 2288 Fax: (65) 6732 8683Email: [email protected]
GlAJZ–ThG pTE lTD391 Orchard Road #21-04 Ngee Ann City Tower BSingapore 238874Tel: (65) 6734 2033Fax: (65) 6737 5138Email: [email protected]
bOuTIquESTAKAShImAyA S.C.391 Orchard Road #01-02 Singapore 238872Tel: (65) 6734 2420 Fax: (65) 6734 6269Email: [email protected]
KNIGhTSbRIDGE270 Orchard Road #01-01Singapore 238857Tel: (65) 6884 8484Fax: (65) 6884 8558Email: [email protected]
ION ORChARD2 Orchard Turn #03-06Singapore 238801Tel: (65) 6509 9268Fax: (65) 6509 9020Email: [email protected]
TANG plAZA320 Orchard Road Ground FloorSingapore 238865Tel: (65) 6235 7198 Fax: (65) 6734 6319Email: [email protected]
ONE RAfflES plACE1 Raffles Place #01-08/09Singapore 048616Tel: (65) 6534 5855Fax: (65) 6534 5455Email: [email protected]
SINGApORERAfflES hOTEl ARCADE328 North Bridge Road #01-14/15Singapore 188719Tel: (65) 6334 3241 Fax: (65) 6337 3997Email: [email protected]
mIllENIA wAlK9 Raffles Boulevard #01-27Singapore 039596Tel: (65) 6339 4870Fax: (65) 6339 9034Email: [email protected]
ORChARD CENTRAl181 Orchard Road #01-06Singapore 238896Tel: (65) 6337 8309Fax: (65) 6337 3356Email: [email protected]
ROlEX bOuTIquESION ORChARD2 Orchard Turn #01-02Singapore 238801Tel: (65) 6509 9282Fax: (65) 6509 9080 Email: [email protected]
RAfflES hOTEl ARCADE328 North Bridge Road #01-13Singapore 188719Tel: (65) 6334 3241 Fax: (65) 6337 3997Email: [email protected]
hublOT bOuTIquEThE ShOppES AT mARINA bAy SANDS2 Bayfront Avenue #01-58Singapore 018972Tel: (65) 6688 7890Fax: (65) 6688 7893Email: [email protected]
mAlAySIACORpORATE OffICEThE hOuR GlASS SDN bhDSuite 12-2, 12th Floor Wisma UOA II 21 Jalan Pinang50450 Kuala LumpurTel: (60) 3 2161 3228Fax: (60) 3 2163 7133Email: [email protected]
bOuTIquESpAvIlION Kl ShOppING mAllLot 2.40 / 2.41, Level 2168 Jalan Bukit Bintang55100 Kuala LumpurTel: (60) 3 2148 8930 Fax: (60) 3 2148 8932Email: [email protected]
lOT 10 ShOppING CENTREUnit G1, Ground Floor50 Jalan Sultan Ismail50250 Kuala LumpurTel: (60) 3 2144 1620Fax: (60) 3 2145 7211Email: [email protected]
ThE GARDENS, mID vAllEy CITy Lot G-226/227, Ground FloorMedan Syed Putra Utara 59200 Kuala LumpurTel: (60) 3 2287 7830Fax: (60) 3 2287 7832Email: [email protected]
pARKSON GRAND SuRIA KlCC Lot HG01A, Ground Floor Suria KLCC 50088 Kuala LumpurTel: (60) 3 2164 6388 Fax: (60) 3 2164 2388Email: [email protected]
hublOT bOuTIquE STARhIll GAllERyLot UG15(B), Adorn Floor 181 Jalan Bukit Bintang55100 Kuala LumpurTel: (60) 3 2148 0830 Fax: (60) 3 2148 0832Email: [email protected]
operations directoryThE hOuR GlASS

ThAIlANDCORpORATE OffICEThE hOuR GlASS (ThAIlAND) CO., lTD 989 Siam Tower 19th Floor, Unit A Rama 1 Road, Pathumwan Bangkok 10330Tel: (66) 2 658 0599Fax: (66) 2 658 0593
ThG pRImA TImES CO., lTD989 Siam Tower 19th Floor, Unit A Rama 1 Road, Pathumwan Bangkok 10330Tel: (66) 2 658 0599Fax: (66) 2 658 0593Email: [email protected]
bOuTIquESpmT ThE hOuR GlASSGAySORN999 Gaysorn 2nd Floor, Unit 2F-03 Ploenchit Road Bangkok 10330Tel: (66) 2 656 1212Fax: (66) 2 656 1213Email: [email protected]
SIAm pARAGON991 Siam Paragon M F/L, Room 42 Rama 1 Road Bangkok 10330Tel: (66) 2 129 4777Fax: (66) 2 129 4780Email: [email protected]
ChOpARD bOuTIquESIAm pARAGON 991 Siam Paragon M F/L, Room 43 Rama 1 RoadBangkok 10330Tel: (66) 2 129 4777Fax: (66) 2 129 4780Email: [email protected]
hONG KONGCORpORATE OffICEThE hOuR GlASS (hK) lImITEDShop A, 32-34 Nathan RoadTsim Sha Tsui, KowloonTel: (852) 2369 9122Fax: (852) 2369 9166Email: [email protected]
bOuTIquEImpERIAl hOTEl Shop A, 32-34 Nathan RoadTsim Sha Tsui, KowloonTel: (852) 2369 9122 Fax: (852) 2739 2510Email: [email protected]
JApANCORpORATE OffICEThE hOuR GlASS JApAN lTD1st floor 5-4-6Ginza Chuo-ku Tokyo104-0061 JAPANTel: (81) 3 5537 7888Fax: (81) 3 5537 1181Email: [email protected]
bOuTIquEROyAl CRySTAl GINZA1st floor 5-4-6Ginza Chuo-ku Tokyo104-0061 JAPANTel: (81) 3 5537 7888Fax: (81) 3 5537 1181Email: [email protected]
AuSTRAlIACORpORATE OffICE ThE hOuR GlASS (AuSTRAlIA) pTy lTDCulinan House Level 670 Castlereagh StreetSydney New South Wales 2000Tel: (61) 2 9232 7775Fax: (61) 2 9221 4516Email: [email protected]
bOuTIquESSyDNEyCulINAN hOuSE142 King StreetSydney New South Wales 2000Tel: (61) 2 9221 2288Fax: (61) 2 9221 4551Email: [email protected]
mElbOuRNEThE hOuR GlASS buIlDING252 Collins StreetMelbourne Victoria 3000Tel: (61) 3 9650 6988Fax: (61) 3 9650 6933Email: [email protected]
GOlD COASTShOp 8 lE bOulEvARD Elkhorn Avenue Surfers ParadiseGold Coast Queensland 4217Tel: (61) 7 5592 3104Fax: (61) 7 5592 0486Email: [email protected]
operations directory

