past, present and future phosphorus use and management in europe
TRANSCRIPT
Past, present and future phosphorus use and management in Europe
Kimo van Dijk
Wageningen University / European Sustainable Phosphorus Platform
[email protected] / [email protected]
Interdisciplinary Workshop Sustainable Phosphorus Management for Future Food Security, CAS-LMU, Munich, Germany, 10 June 2016

Overview
Historical phosphorus (P) use Present P flows and balances in the EU-27 Options for sustainable P use
Future P use scenarios
Sustainable P use implementation (ESPP)
● Research: Data on Nutrients to Support Stewardship
● Policy: revision of legislation
● Companies: success stories

The biosphere and life
The biosphere involves different other spheres Life is part of the
ecosphere Processes in all
spheres are necessary for life Nutrient cycles go
accross all spheres, dependending on the type of nutrient
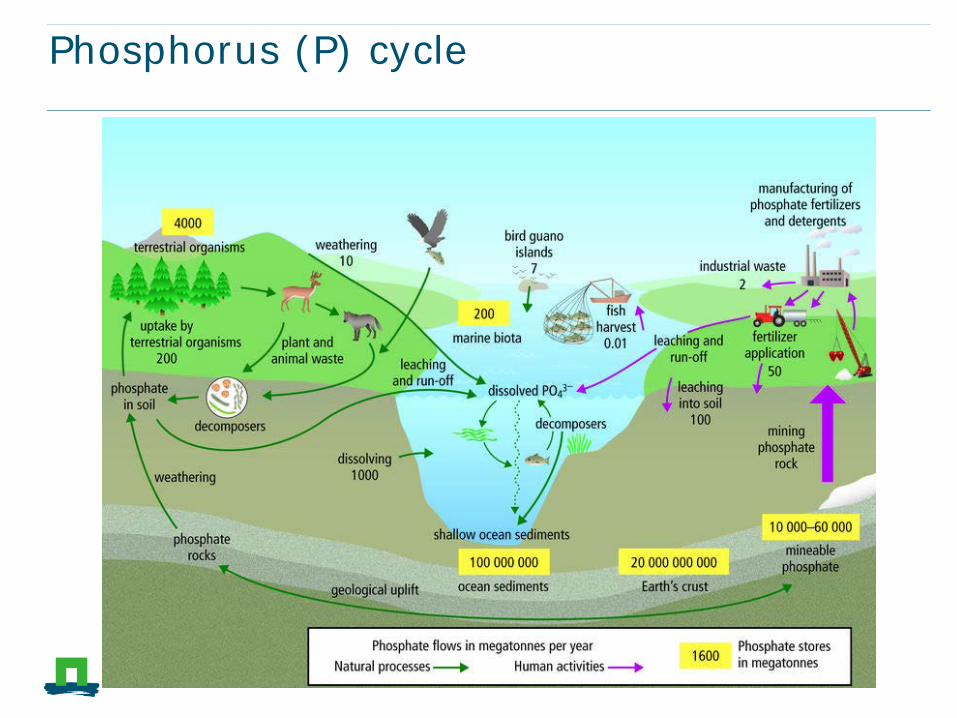
Phosphorus (P) cycle
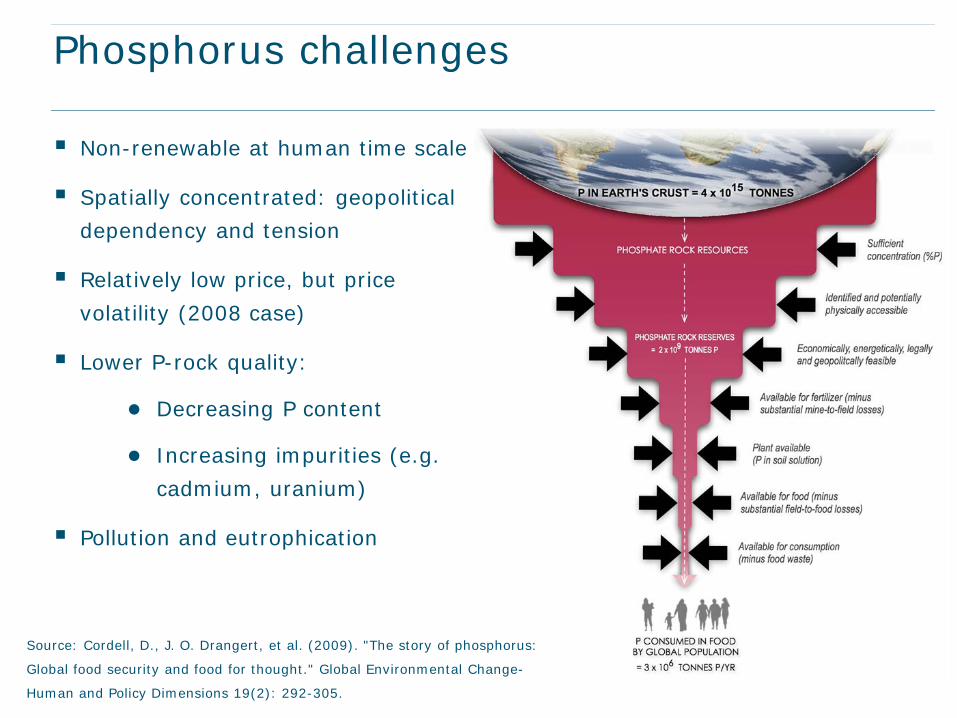
Phosphorus challenges
Source: Cordell, D., J. O. Drangert, et al. (2009). "The story of phosphorus:
Global food security and food for thought." Global Environmental Change-
Human and Policy Dimensions 19(2): 292-305.
Non-renewable at human time scale
Spatially concentrated: geopolitical dependency and tension
Relatively low price, but price volatility (2008 case)
Lower P-rock quality:
● Decreasing P content
● Increasing impurities (e.g. cadmium, uranium)
Pollution and eutrophication

Changing perspective of P challenge
Research and societal attention on P has moved to new issues in the recent years: ● ⇒ P as a nutrient (P availability in soils,
fertiliser recommendation systems…)
● ⇒ P as a pollutant (P losses, water eutrophication…)
● ⇒ P as a non renewable resource (P
recovery, sustainable use…)

Geological versus anthropogenic cycles
RESOURCE RESERVES
SINKS
Society
Crops
Animals
Industry & retail
Consumers
Non-food
Losses Inputs [90% fertilizer, and other mineral P use]
Geological cycle
Direct IMPACTS
Anthropogenic cycle

Global fertilizer P consumption 1961-2010
Source: United Nations Food and Agriculture
Organization, FAOSTAT data 2010

Changes in EU-27 P inputs 1961-2009
Van Dijk et al. 2016, Phosphorus flows and balances of the European Union Member States

EU-27 annual soil P balances 1961-2009
Western Europe (EU-15) Eastern Europe (EU-12)
Van Dijk et al., in preparation, Modelling crop yield responses to drastic
decreases in phosphorus fertilization in EU-27

Present P flows and balances in the EU-27
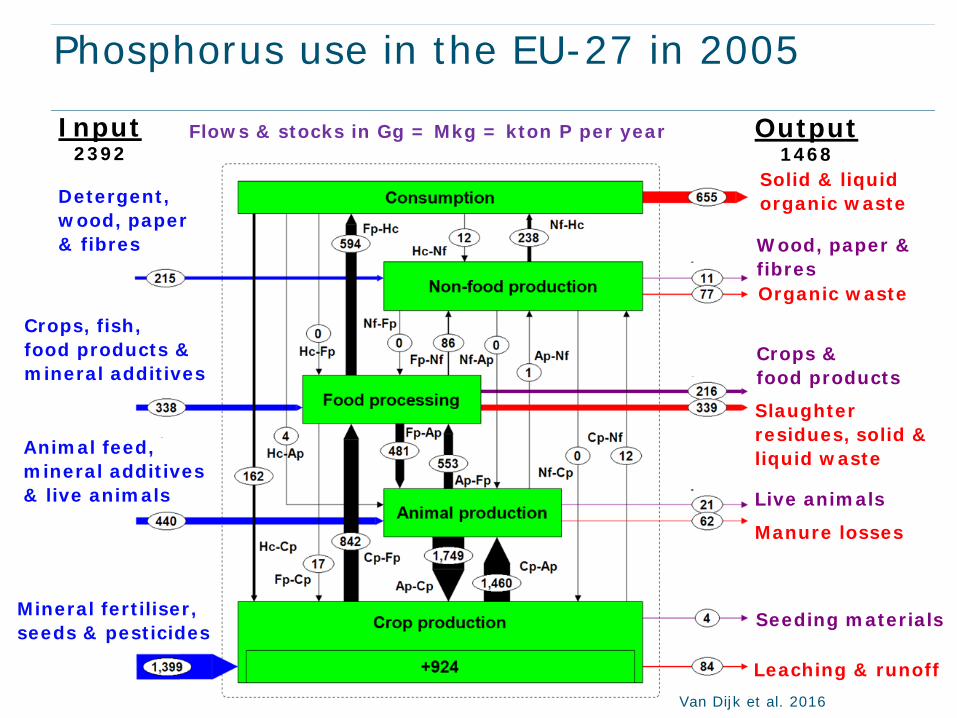
Phosphorus use in the EU-27 in 2005
Detergent, wood, paper & fibres
Crops, fish, food products & mineral additives
Animal feed, mineral additives & live animals
Mineral fertiliser, seeds & pesticides
Solid & liquid organic waste
Organic waste
Wood, paper & fibres
Slaughter residues, solid & liquid waste
Crops & food products
Manure losses
Live animals
Leaching & runoff
Seeding materials
Input 2392
Output 1468
Flows & stocks in Gg = Mkg = kton P per year
Van Dijk et al. 2016

Import, export and losses per sector
Van Dijk et al. (2016) 0
500
1000
1500
2000
2500
Gross import Gross export Net trade Losses Accumulation
Phos
phor
us q
uant
ity [G
g P/
year
]
Absolute quantity [Gg P/year]
Relative fraction of total system import, export & losses [%]
Primary P import
Import Export Losses Import Export Losses Gg P/year % of total system primary import
% of total sector import
CP 1399 4 84 58 1 7 1391 78 99
AP 440 21 62 18 9 5 250 14 57
FP 338 216 339 14 86 28 27 2 8
NF 215 11 77 9 4 6 110 6 51
HC - - 655 - - 54 - - -
Total 2392 251 1217 100 100 100 1777 100
Van Dijk et al. 2016

Main sources of P-rock in the EU [Mt/yr]
30 years remaining for Finland at current rate of extraction, which is only 10 % of EU demand
de Ridder, M., S. de Jong, et al. (2012). Risks and Opportunities in the Global
Phosphate Rock Market: Robust Strategies in Times of Uncertainty. The Hague, The
Hague Centre for Strategic Studies (HCSS).

EU-27 P use efficiency per sector in 2005
Van Dijk et al. 2016
CP AP FP NF HC
PUE-1 Output flows minus losses 70 97 80 76 21
PUE-2 Upward output flows plus export
70 24 52 76 -
𝑃𝑃𝑃𝑃𝑃𝑃𝑠𝑠𝑠𝑠𝑠𝑠𝑠𝑠𝑠𝑠𝑠𝑠 = 𝑂𝑂𝑂𝑂𝑠𝑠𝑂𝑂𝑂𝑂𝑠𝑠𝑒𝑒𝑒𝑒𝑒𝑒𝑒𝑒𝑒𝑒𝑒𝑒𝑒𝑒𝑒𝑒𝑒𝑒
𝐼𝐼𝐼𝐼𝑂𝑂𝑂𝑂𝑠𝑠𝑒𝑒𝑡𝑡𝑒𝑒𝑡𝑡𝑡𝑡∗ 100

Fertilizer P consumption in EU-27 in 2010
FAOSTAT data 2010
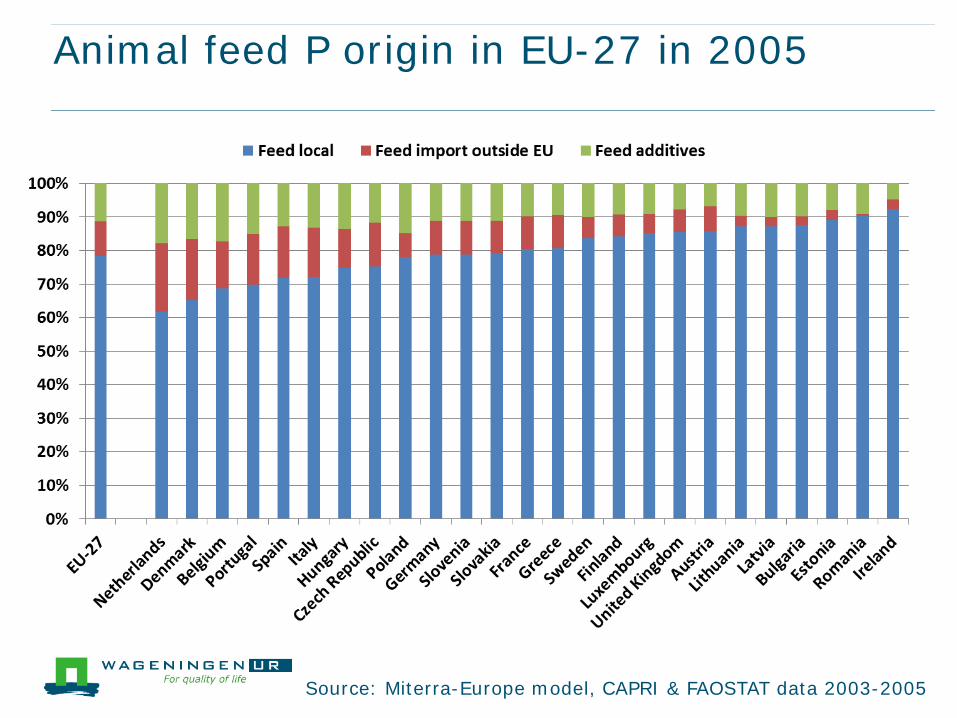
Animal feed P origin in EU-27 in 2005
Source: Miterra-Europe model, CAPRI & FAOSTAT data 2003-2005

Agricultural P balances per country for 2005 & period 1905-2005
Van Dijk et al., in preparation Van Dijk et al. 2016
128 Mtons P accumulated in agricultural soils between 1905 -2005
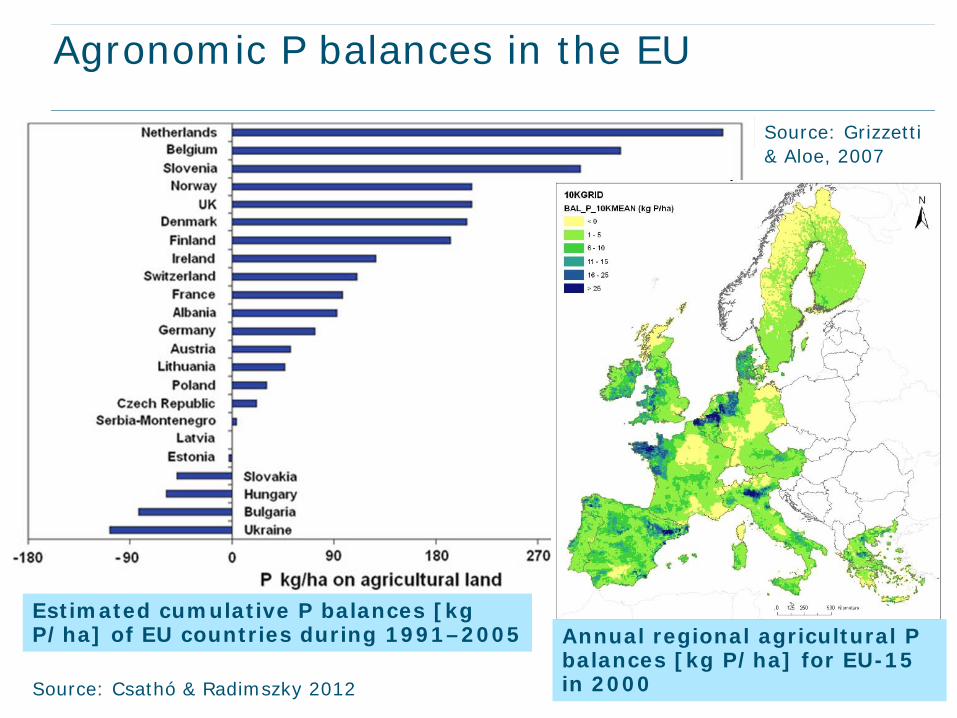
Agronomic P balances in the EU
Annual regional agricultural P balances [kg P/ha] for EU-15 in 2000
Estimated cumulative P balances [kg P/ha] of EU countries during 1991–2005
Source: Csathó & Radimszky 2012
Source: Grizzetti & Aloe, 2007
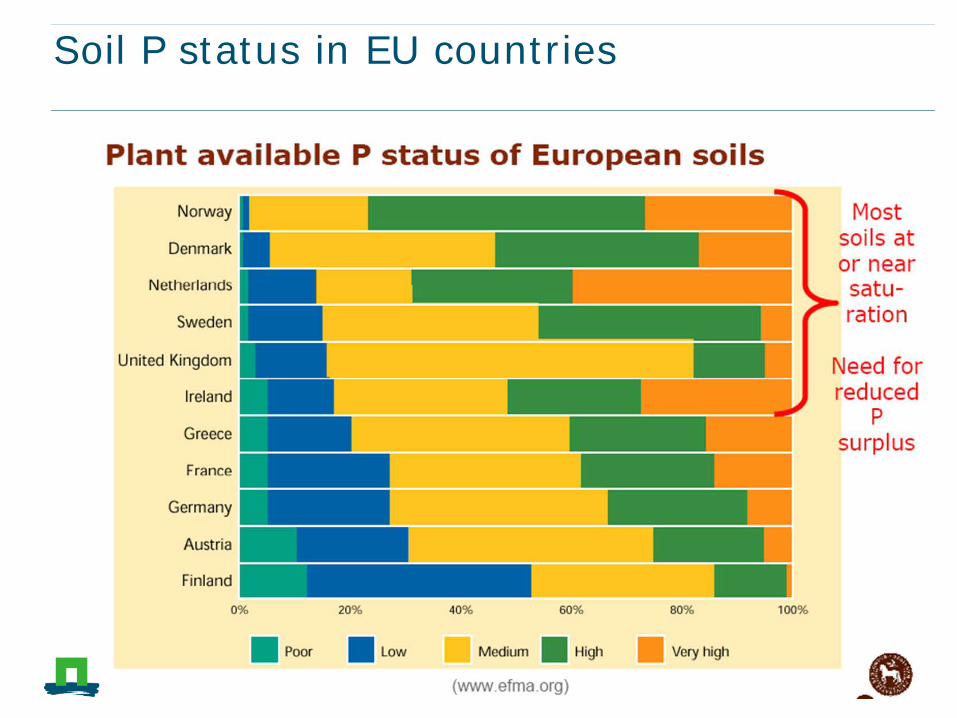
Soil P status in EU countries
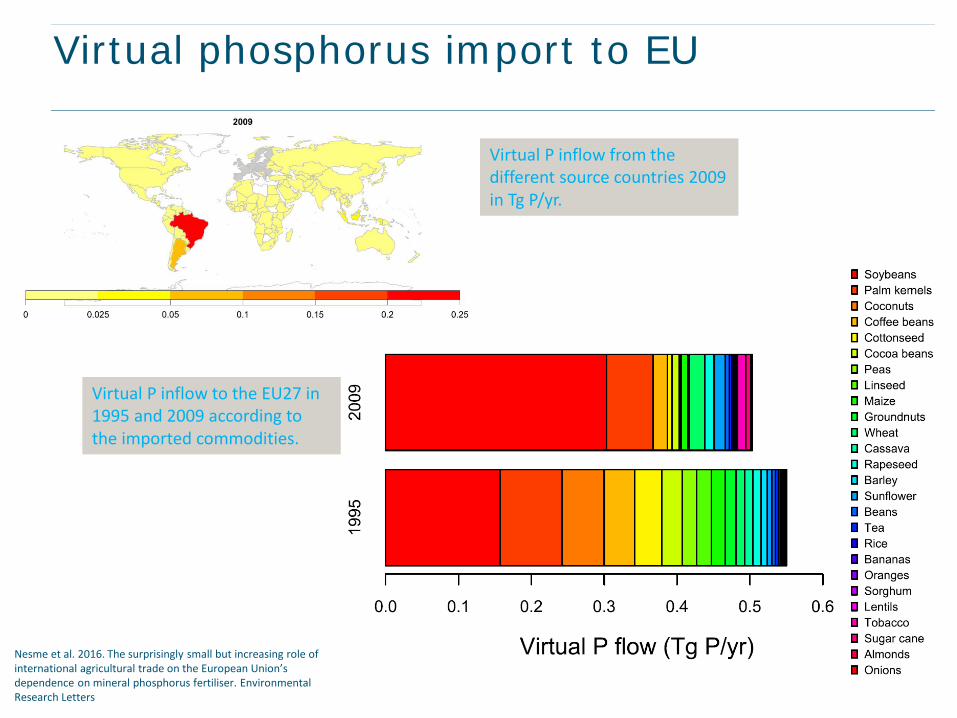
Virtual phosphorus import to EU
Virtual P inflow from the different source countries 2009 in Tg P/yr.
Virtual P inflow to the EU27 in 1995 and 2009 according to the imported commodities.
Nesme et al. 2016. The surprisingly small but increasing role of international agricultural trade on the European Union’s dependence on mineral phosphorus fertiliser. Environmental Research Letters

Per capita P supply per country in 2005
Van Dijk et al. 2016
0
0.2
0.4
0.6
0.8
1
1.2
1.4
1.6
Dom
estic
food
P su
pply
[kg/
ca/y
ear]
AnimalPlant
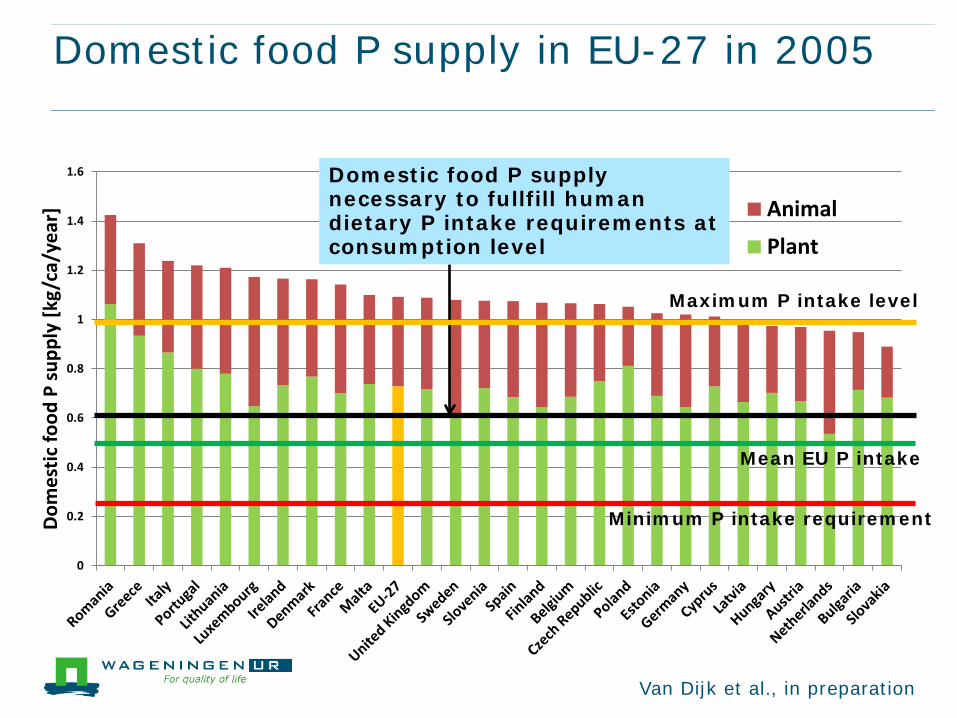
Domestic food P supply in EU-27 in 2005
Domestic food P supply necessary to fullfill human dietary P intake requirements at consumption level
Van Dijk et al., in preparation
Minimum P intake requirement
Mean EU P intake
Maximum P intake level

EU-27 consumption sector P losses in 2005
Van Dijk et al. (2016)
41%
12%
6%
26%
14%
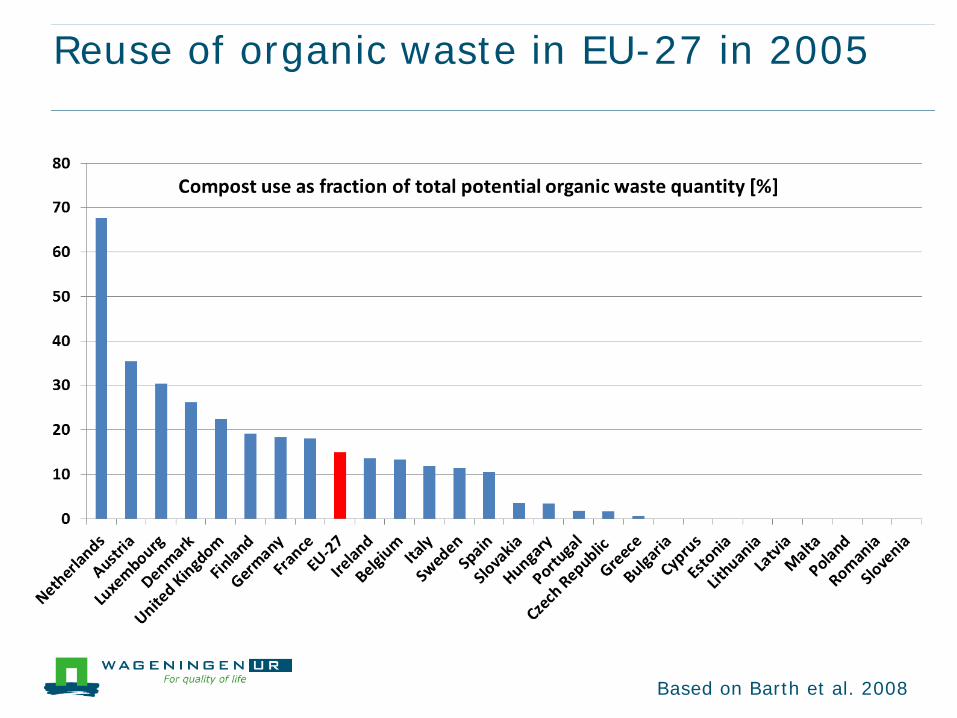
Reuse of organic waste in EU-27 in 2005
Based on Barth et al. 2008

Sludge destinations in EU-27 in 2010
Source: P-Rex, FP7 project, www.p-rex.eu; based on Eurostat 2010, Milieu Ltd 2010 & Destatis 2011

P concentrations in rivers and lakes in EU regions, period 1990 - 2005
Source: European Environment Agency, 2007

Options for sustainable P use

Current ‘linear’ use: primary P input
Source: Fertilizers Europe, 2012, adapted from Environmental Aspects of Phosphate and Potash Mining, UNEP & IFA, 2001.
Rehabilitation
Beneficiation
Exploration
Application Plant Uptake
Food-Feed-Fuel Consumption
Harvest
Waste & Losses Recycling
Mineral P
Waste & Losses Recycling
Mining Processing Distribution
Closing the cycle at the level of: Farm City Region Country Continent World
Sewerage
Food processing and Catering waste
Household waste
Erosion Run-off

Transition towards sustainable P use
•remove non-essential P inputs (e.g. detergents) •match P requirements more closely (precision agriculture)
•utilise legacy P stores Realign P inputs
•optimise input management •minimise runoff and erosion •strategic retention zones
Reduce P losses to water
•avoid wastage •improve utilization efficiency •adopt integrated production systems
Recycle P in bioresources
•recover P in societies' wastes •produce fertilizer substitutes
Recover P in wastes
•influence dietary choice •define end-user P requirements •re-connect crop and animal production systems
Redefine P in the food chain
Withers, Van Dijk, et al. (2015): Stewardship to tackle global phosphorus inefficiency: the case of Europe

P recycling potential in EU-27
[Gg P/year] Total Recycled Potential
Sewage sludge 297 115 182
Biodegradable solid waste 130 38 92
Meat & bone meal 128 6 122
Total (minimum) 427 153 274
Total (maximum) 555 160 396
Mineral fertiliser use 1448 Manure use 1763
Van Dijk et al. 2016

P2O5 contents [%] common ‘wastes’
[% P2O5] Fresh matter
Dry matter Ash
Mean Mean Mean Meat & bone meal 9.5 9.7 33.1 Pig manure 0.4 5.0 18.8 Bio (kitchen) waste 0.4 0.6 17.1 Sewage sludge 6.5 6.9 15.7 Chicken manure 1.9 2.7 15.3 Green (garden) waste 0.2 0.3 9.7 Iron slag 5.6 Bark 0.10 0.11 3.0 Wood 0.05 0.07 2.6 Coal 0.1 0.1 0.5

Dutch P fertiliser price developement
Source: Reijneveld, J. A. (2013). Unravelling changes in soil fertility of agricultural land in The Netherlands, Wageningen UR, Wageningen.

R/P ratio for P, K & micronutrients
Source: de Haes et al. 2012. Schaarste van micronutriënten in bodem, voedsel en minerale voorraden:
Urgentie en opties voor beleid. Utrecht, Netherlands, Platform Landbouw, Innovatie & Samenleving.
AND Chardon & Oenema, 2013. Verkenning mogelijke schaarste aan micronutriënten in het
voedselsysteem, Wageningen: Alterra Wageningen UR.
A simplistic way of expressing resource scarcity R/P ratio = reserve / production
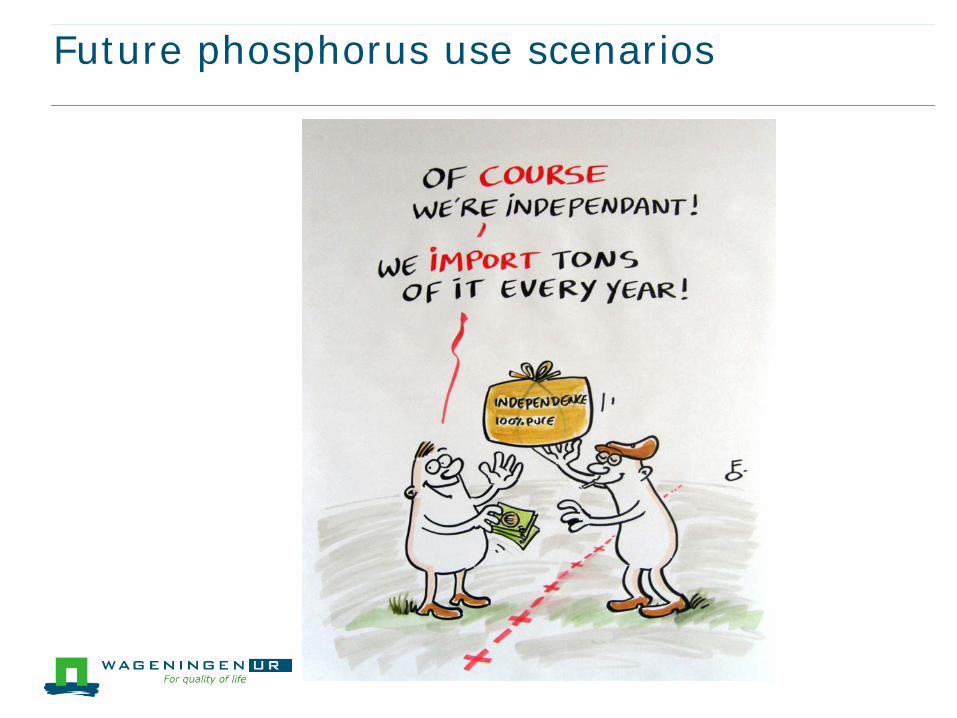
Future phosphorus use scenarios
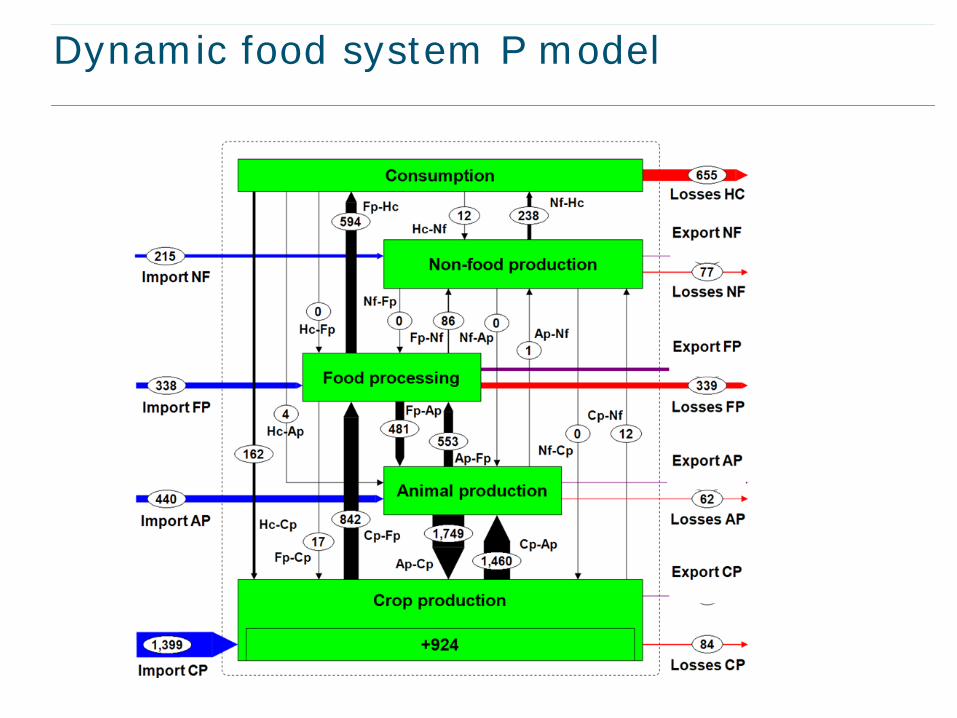
Dynamic food system P model

Dynamic crop P uptake
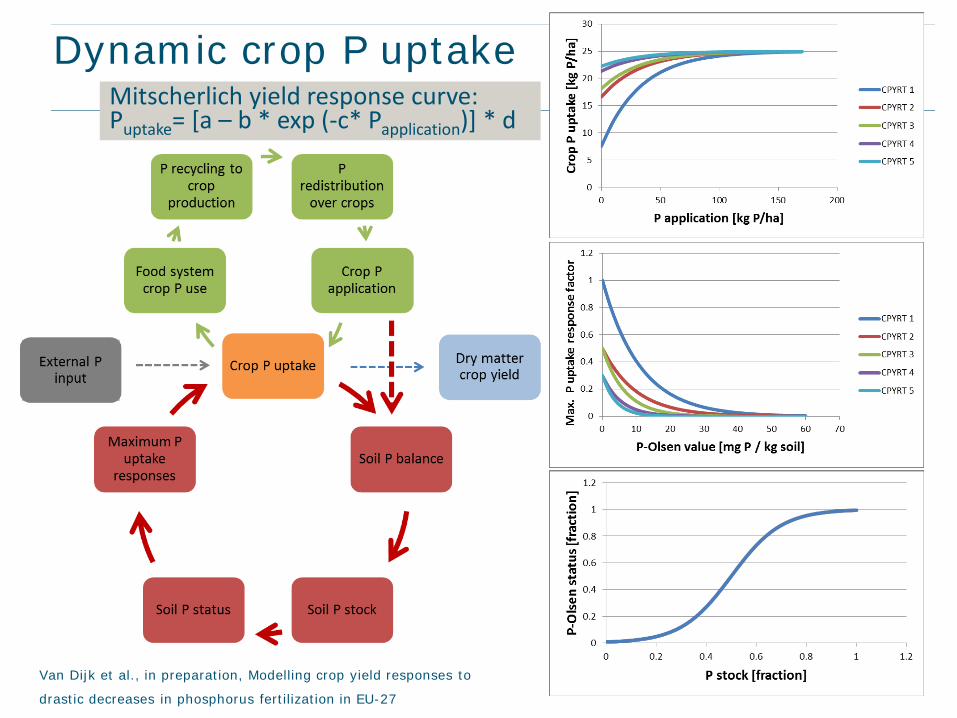
Dynamic crop P uptake Mitscherlich yield response curve: Puptake= [a – b * exp (-c* Papplication)] * d
Van Dijk et al., in preparation, Modelling crop yield responses to
drastic decreases in phosphorus fertilization in EU-27
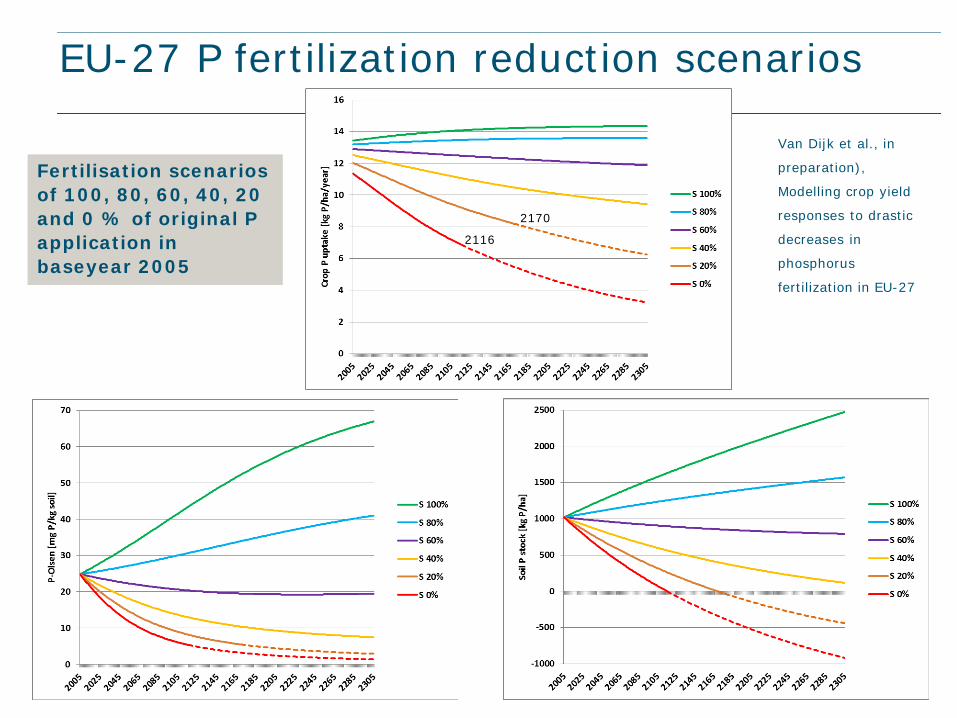
EU-27 P fertilization reduction scenarios
Van Dijk et al., in
preparation),
Modelling crop yield
responses to drastic
decreases in
phosphorus
fertilization in EU-27
2116
2170
Fertilisation scenarios of 100, 80, 60, 40, 20 and 0 % of original P application in baseyear 2005

EU-27 P fertilization reduction scenarios
Fertilisation scenarios of 100, 80, 60, 40, 20 and 0 % of original P application in baseyear 2005
Van Dijk et al. (in
preparation).
Modelling crop yield
responses to drastic
decreases in
phosphorus
fertilization in EU-27

EU-27 P fertilisation reduction scenarios
Van Dijk et al., in preperation

Agricultural P management scenarios Van
Dijk
et
al.,
in p
repe
ration

Objectives & research questions
To develop a dynamic model for the analysis of the effects of changes in drivers and nutrient management strategies on P dynamics in the food chain.
What would be the P dynamics & food production in EU-
27 in case of a stop of P import via ● Q1: mineral fertilizers? ● Q2: mineral fertilizers and animal feed?
Q3: What are effects of best management practices (BMPs) on food production and P use efficiency?
Van Dijk et al., in preparation

Food system P scenarios
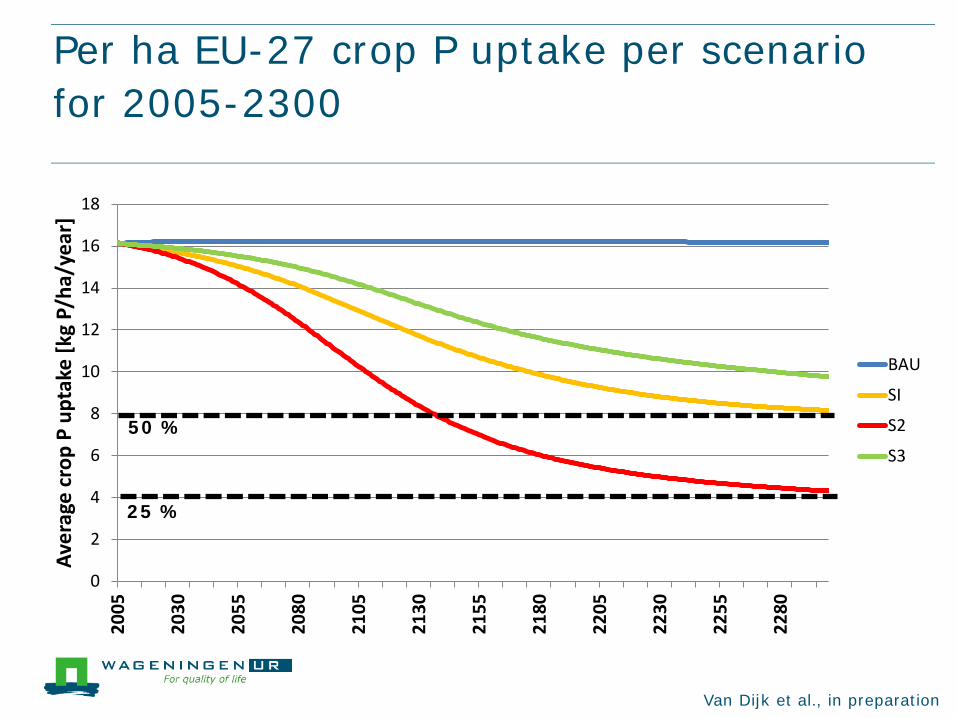
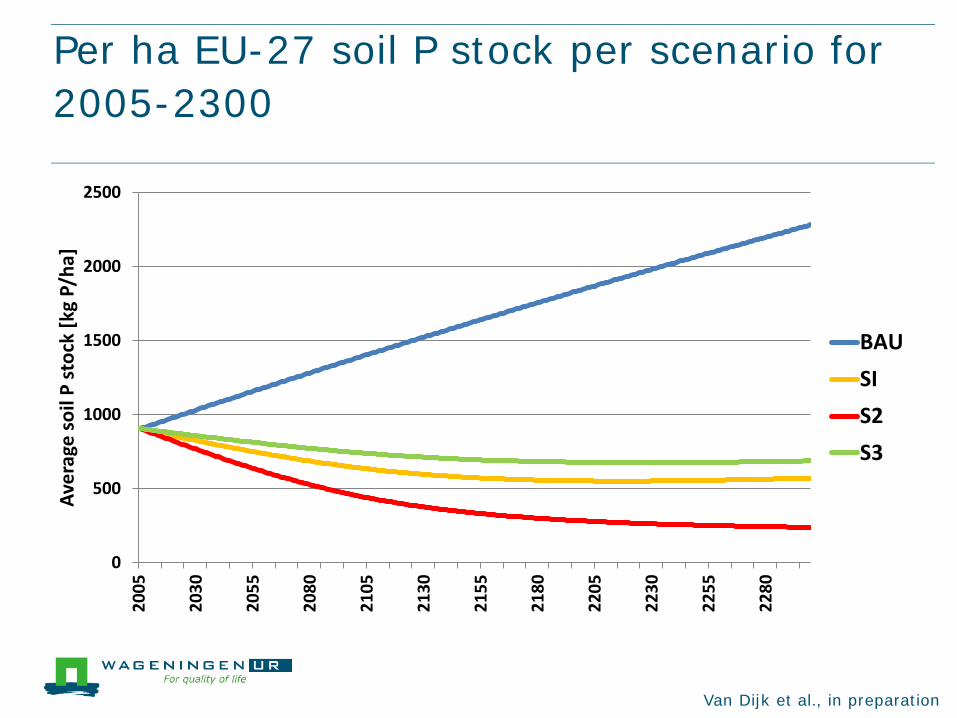
The scenarios are: ● BAU: present (~2005), Business as Usual ● S1: no P import via fertilizer ● S2: no P import via fertilizer + compound feed ● S3: as S2 + BMPs
The best management practices (BMPs) are 90 % less: ● biowaste + waste water P losses (HC) ● forestry sector losses (NF) ● slaughter waste losses (FP) ● stable manure losses (AP)
No changes in other drivers and factors, such as population, agricultural area, crop types etc.
= 65% less system P losses = 65% more recycling
= 60% system P input reduction
= - 80%
Van Dijk et al., in preparation
0
2
4
6
8
10
12
14
16
18
2005
2030
2055
2080
2105
2130
2155
2180
2205
2230
2255
2280
Aver
age
crop
P u
ptak
e [k
g P/
ha/y
ear]
BAU
SI
S2
S3
Per ha EU-27 crop P uptake per scenario for 2005-2300
50 %
25 %
Van Dijk et al., in preparation
0
500
1000
1500
2000
2500
2005
2030
2055
2080
2105
2130
2155
2180
2205
2230
2255
2280
Aver
age
soil
P st
ock
[kg
P/ha
]
BAUSIS2S3
Per ha EU-27 soil P stock per scenario for 2005-2300
Van Dijk et al., in preparation

0
0.2
0.4
0.6
0.8
1
1.2
1.4
1.6
1.8
Fran
ce
Lith
uani
a
Luxe
mbo
urg
Irela
nd
Ger
man
y
Swed
en
Uni
ted
King
dom
Belg
ium
Czec
h Re
publ
ic
Italy
Bulg
aria
Mal
ta
Denm
ark
Gre
ece
Esto
nia
Spai
n
Rom
ania
Net
herla
nds
Port
ugal
Finl
and
Slov
akia
Pola
nd
Aust
ria
Latv
ia
Hung
ary
Cypr
us
Slov
enia
BAU
S1
S2
S3
Per capita food P supply per Member State per scenario in 2050
Van Dijk et al., in preparation
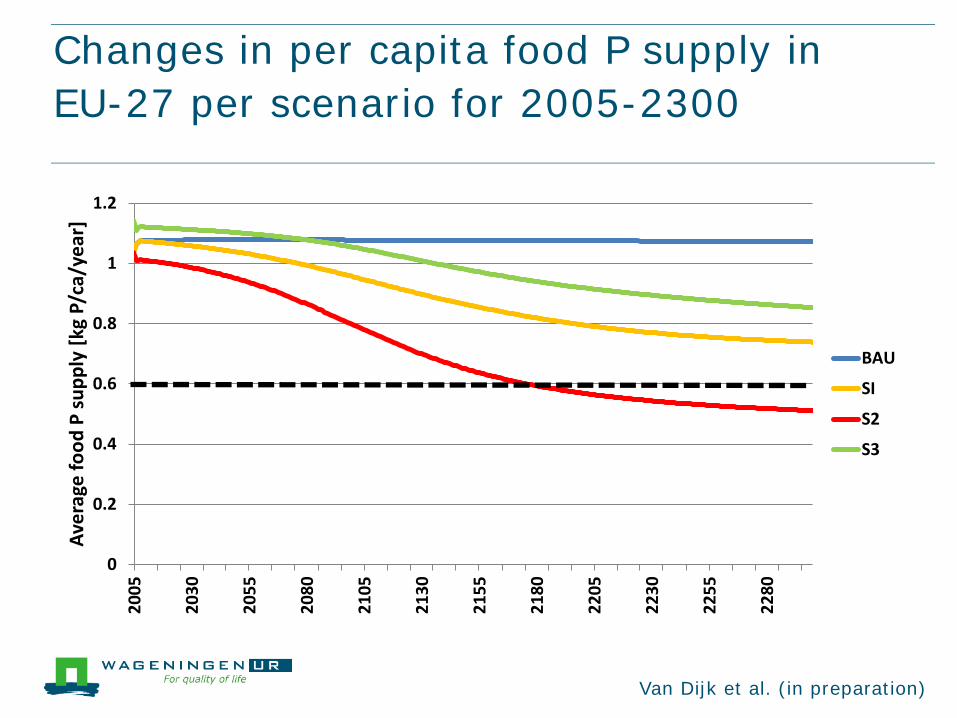
0
0.2
0.4
0.6
0.8
1
1.2
2005
2030
2055
2080
2105
2130
2155
2180
2205
2230
2255
2280
Aver
age
food
P su
pply
[kg
P/ca
/yea
r]
BAU
SI
S2
S3
Changes in per capita food P supply in EU-27 per scenario for 2005-2300
Van Dijk et al. (in preparation)

0
1000
2000
3000
4000
5000
6000
7000
2005
2030
2055
2080
2105
2130
2155
2180
2205
2230
2255
2280
Aver
age
dry
mat
ter y
ield
[kg
P/ha
/yea
r]
BAUSIS2S3
Changes in dry matter crop yield in EU-27 per scenario for 2005-2300
50 %
33 %
Van Dijk et al., in preparation

Sustainable P use implementation (ESPP)
WssTP RR WG 24th June 2015 - n°52 European Sustainable Phosphorus Platform
European Sustainable Phosphorus Platform (ESPP) [email protected]
www.phosphorusplatform.eu @phosphorusfacts

WssTP RR WG 24th June 2015 - n°53 European Sustainable Phosphorus Platform
DONUTSS Data on Nutrients to Support Stewardship - workshop Ghent 3 (science) – 4 (stakeholder) Sept - EU COMM DG GROW support identify data needs to support decision making for industry, regulators define how and who to monitor, collate, data
www.phosphorusplatform.eu/DONUTSS

Data quality & monitoring challenges
Data quality: trade > production > consumption > recycling
Unclear definitions & not enough detail in data
Eurostat data is incomplete and inconsistent
Data gaps for waste flows & (new) recycling flows
Literature data mostly not recent and only specific base years
Trade databases not available for all products/materials
Data gaps requires data filling procedures & flow balancing
Industry data not publically available, sometimes commercially, but no peer reviewed
Uncertainties for most data unknown
Nutrient concentrations not monitored spatially & temporarily
From quantity to quality, from theory to practise
WssTP RR WG 24th June 2015 - n°55 European Sustainable Phosphorus Platform
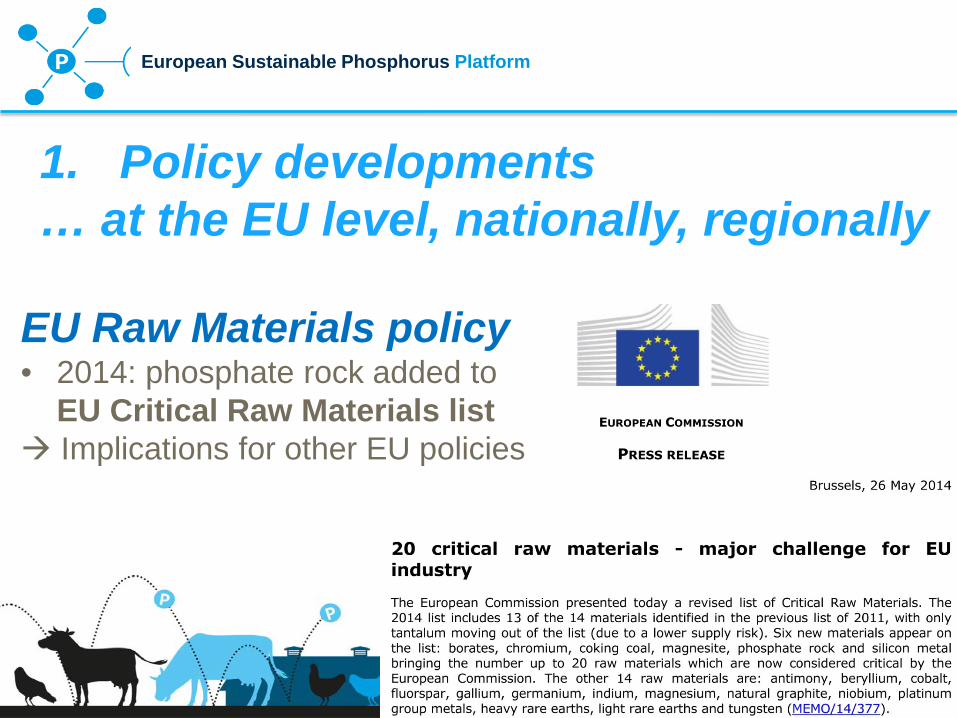
EU Raw Materials policy • 2014: phosphate rock added to
EU Critical Raw Materials list Implications for other EU policies
1. Policy developments … at the EU level, nationally, regionally

WssTP RR WG 24th June 2015 - n°56 European Sustainable Phosphorus Platform
Phosphorus in European policies • Fertiliser Regulation (access to market for recycled P)
• ESPP proposed criteria for struvite, ashes and biochar: www.phosphorusplatform.eu/regulatory
• Nitrates Directive (“processed manure”) • REACH (chemical regulation): recycled P, digestates • Agriculture: CAP / RD, nutrient farm best practices,
EIP-AGRI (dissemination, research implementation)
WssTP RR WG 24th June 2015 - n°57 European Sustainable Phosphorus Platform
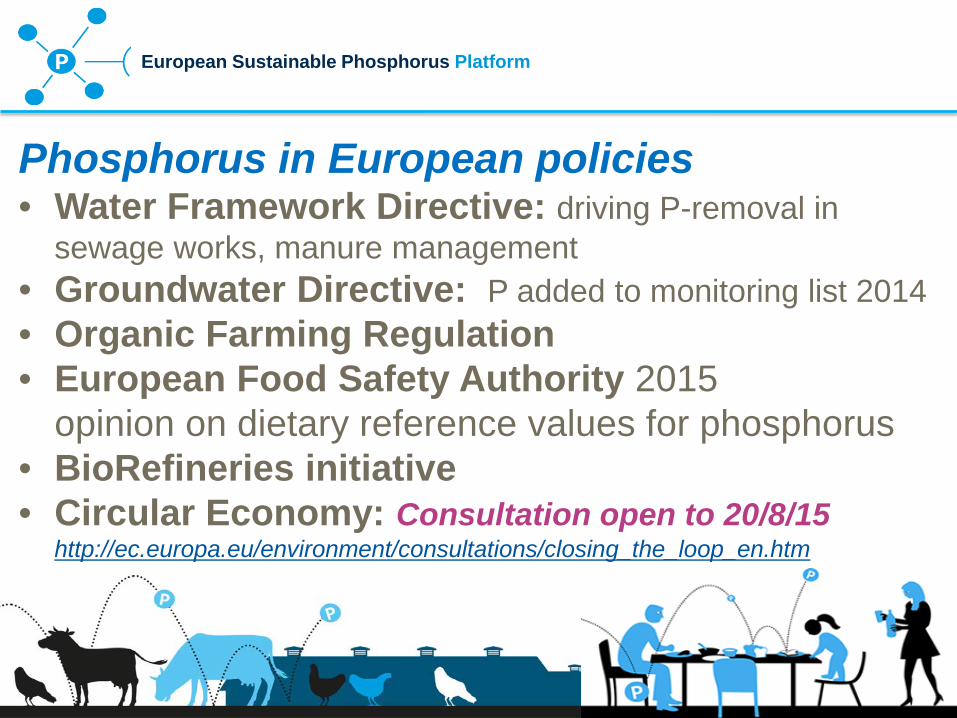
Phosphorus in European policies • Water Framework Directive: driving P-removal in
sewage works, manure management • Groundwater Directive: P added to monitoring list 2014 • Organic Farming Regulation • European Food Safety Authority 2015
opinion on dietary reference values for phosphorus • BioRefineries initiative • Circular Economy: Consultation open to 20/8/15
http://ec.europa.eu/environment/consultations/closing_the_loop_en.htm
WssTP RR WG 24th June 2015 - n°58 European Sustainable Phosphorus Platform
National policy initiatives on phosphorus • Switzerland: waste ordonnance, proposal to make
obligatory P-recovery from sewage sludge and animal waste ash (or separate storage pending recovery)
• Sweden: proposal to oblige 40% recycling of P & 10% of N (including via agricultural valorisation of sewage biosolids)
• Germany: political commitment to make P-recovery obligatory in sewage works
• Netherlands: struvite allowed to the market, in regulation

WssTP RR WG 24th June 2015 - n°59 European Sustainable Phosphorus Platform
European Commission Investment Fund • European Commission / European Investment Bank • “Phosphorus recycling Investment Fund” • EU loan funding to stimulate bank support • Call for ‘bankable’ project proposals currently open first project funded 5/2015: COOPERL Brittany 38 000 t manure/year + slaughterhouse + sewage sludge processing to organic fertiliser

WssTP RR WG 24th June 2015 - n°60 European Sustainable Phosphorus Platform
Standards • CEN: SABE ENVI, water treatment standards, … • ISO 275 “Sludge recovery, recycling, treatment, disposal” • Fertiliser analysis standards: recycled products • Industrial Emissions Directive: nutrient recovery
in BATs for incineration, water treatment … • ESPP proposed Struvite Fertiliser Standard
61 European Sustainable Phosphorus Platform
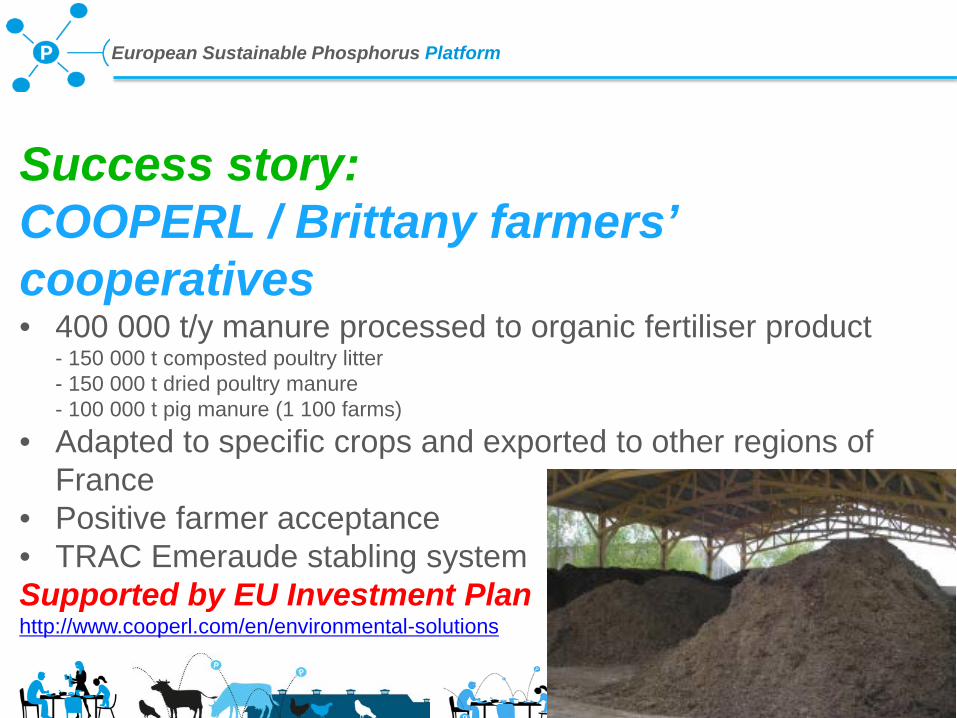
Success story: COOPERL / Brittany farmers’ cooperatives • 400 000 t/y manure processed to organic fertiliser product
- 150 000 t composted poultry litter - 150 000 t dried poultry manure - 100 000 t pig manure (1 100 farms)
• Adapted to specific crops and exported to other regions of France
• Positive farmer acceptance • TRAC Emeraude stabling system Supported by EU Investment Plan http://www.cooperl.com/en/environmental-solutions

62 European Sustainable Phosphorus Platform
Success story: Fertikal, Antwerp • 180 000 t/y (wet weight) manure
processed to organic fertilisers: • solid/liquid separation
dried, pelletised • For agriculture, horticulture • Distributed
to 25 countries worldwide www.fertikal.be
63 European Sustainable Phosphorus Platform
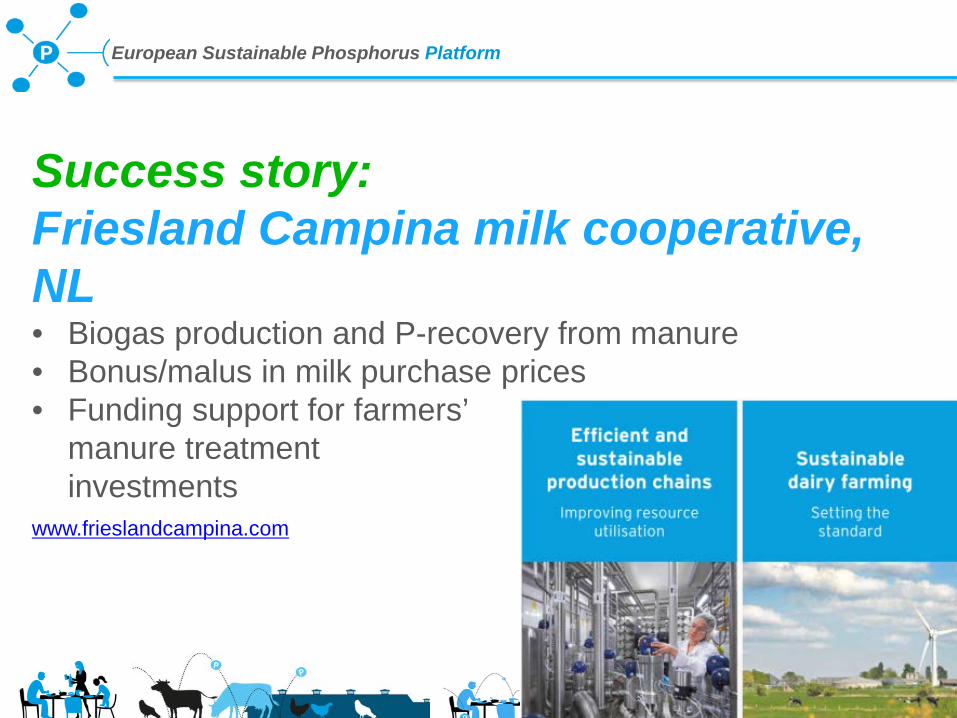
Success story: Friesland Campina milk cooperative, NL • Biogas production and P-recovery from manure • Bonus/malus in milk purchase prices • Funding support for farmers’
manure treatment investments
www.frieslandcampina.com

64 European Sustainable Phosphorus Platform
Success story: Käppala municipal sewage works, Sweden • REVAQ sewage sludge certification • 260 tP/year recycled to agriculture • Reductions in industry & household contaminants • Sludge mixing with manure for contaminant degradation http://www.svensktvatten.se/Vattentjanster/Avlopp-och-Miljo/REVAQ/Certifiering/ http://www.iea-biogas.net/case-studies.html?file=files/daten-redaktion/download/case-studies/REVAQ_CAse_study_A4_1.pdf
BUT: EU decision 11/2015 to NOT ban cadmium in artists paints …

65 European Sustainable Phosphorus Platform
Success story: cnp-Technology Water and Biosolids GmbH SME, Germany • 4 installations recovering
Phosphorus as struvite • Municipal waste water
• Berlin Wassmannsdorf • Mönchengladbach (DE) • Echten (NL) • Amsterdam http://cnp-tec.com/

66 European Sustainable Phosphorus Platform
Success story – 50 M€ Investment: Kanton Zürich • 72 ARAs have agreed to deliver 100 000 t dewatered
sludge to one central mono-incineration plant in Zürich Werdhölzli
• 93.7% of population has voted “yes” in the referendum • Commissioned 2015
• Supplies 35500 MWh/a to WWTP • 15 000 t ash for P-recycling • ZAR develops P-recycling solution
for implementation 2018 http://www.awel.zh.ch/
67 European Sustainable Phosphorus Platform
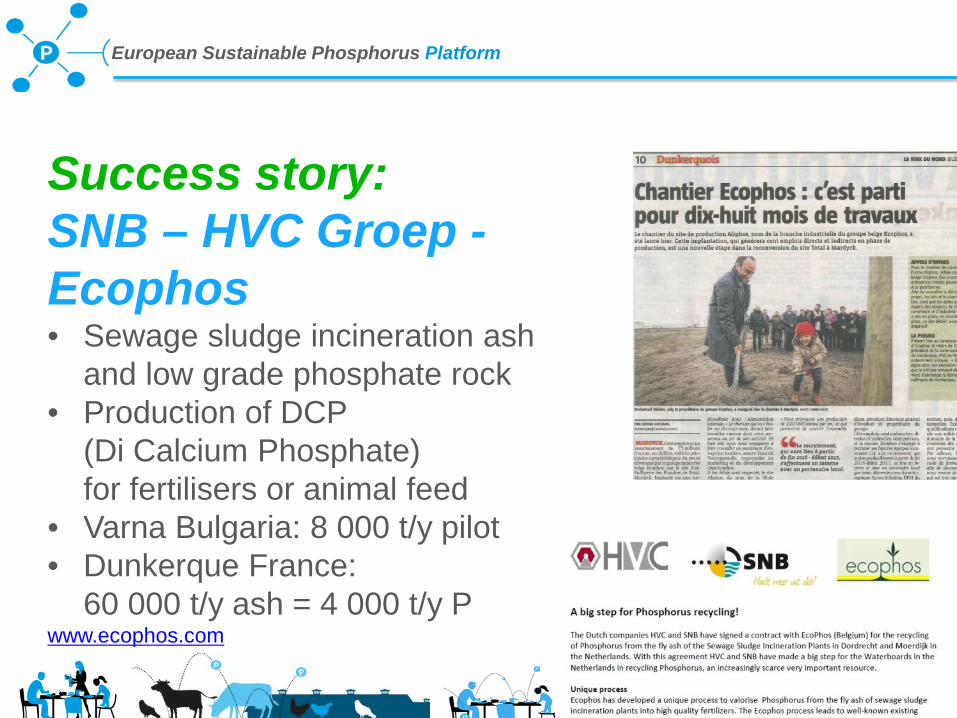
Success story: SNB – HVC Groep - Ecophos • Sewage sludge incineration ash
and low grade phosphate rock • Production of DCP
(Di Calcium Phosphate) for fertilisers or animal feed
• Varna Bulgaria: 8 000 t/y pilot • Dunkerque France:
60 000 t/y ash = 4 000 t/y P www.ecophos.com

68 European Sustainable Phosphorus Platform
Success story: ICL fertilisers Amsterdam & Ludwigshaven • Use of secondary materials
in fertiliser production: - meat and bone meal ash - struvite
• Objective: 100% by 2025 • Pilot testing successful • Industrial installations
(storage, handling) planned www.icl-group.com

69 European Sustainable Phosphorus Platform
Success story: Recophos – ICL • Electrothermal production
of white phosphorus (P4) from sewage sludge / ashes
• High-value raw material for chemicals: fire safety, electronics, …
• Recophos FP7 pilot project • Technology acquired by ICL March
2016 www.icl-group.com http://www.prnewswire.com/news-releases/icl---next-step-towardssustainable-innovation-571973381.html
70 European Sustainable Phosphorus Platform
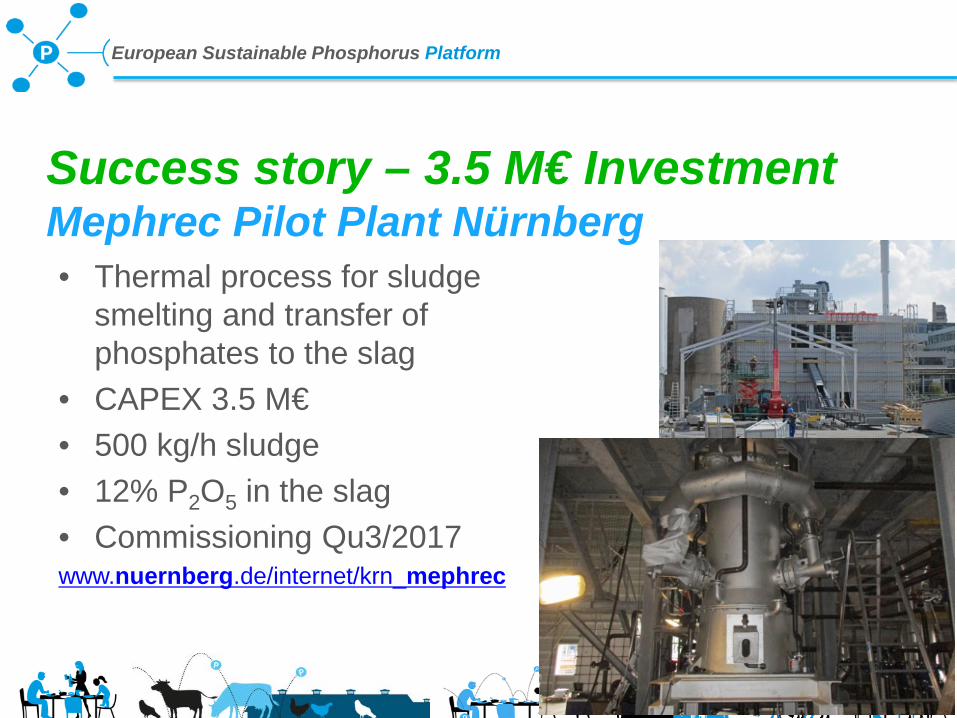
• Thermal process for sludge smelting and transfer of phosphates to the slag
• CAPEX 3.5 M€ • 500 kg/h sludge • 12% P2O5 in the slag • Commissioning Qu3/2017 www.nuernberg.de/internet/krn_mephrec
Success story – 3.5 M€ Investment Mephrec Pilot Plant Nürnberg

71 European Sustainable Phosphorus Platform
Success story: Waternet Amsterdam West sewage works • AirPrix struvite precipitation • Upstream of sludge digestors • Operational savings:
150 000 € / year • Improved sludge dewatering:
250 000 € / year • Increased methane production • Achievement of 1 mgP/l discharge

72 European Sustainable Phosphorus Platform
Success story: NuReSys • SME, Belgium • 8 installations recovering
Phosphorus as struvite • Potato processing, dairy,
pharmaceuticals, municipal waste water
73 European Sustainable Phosphorus Platform
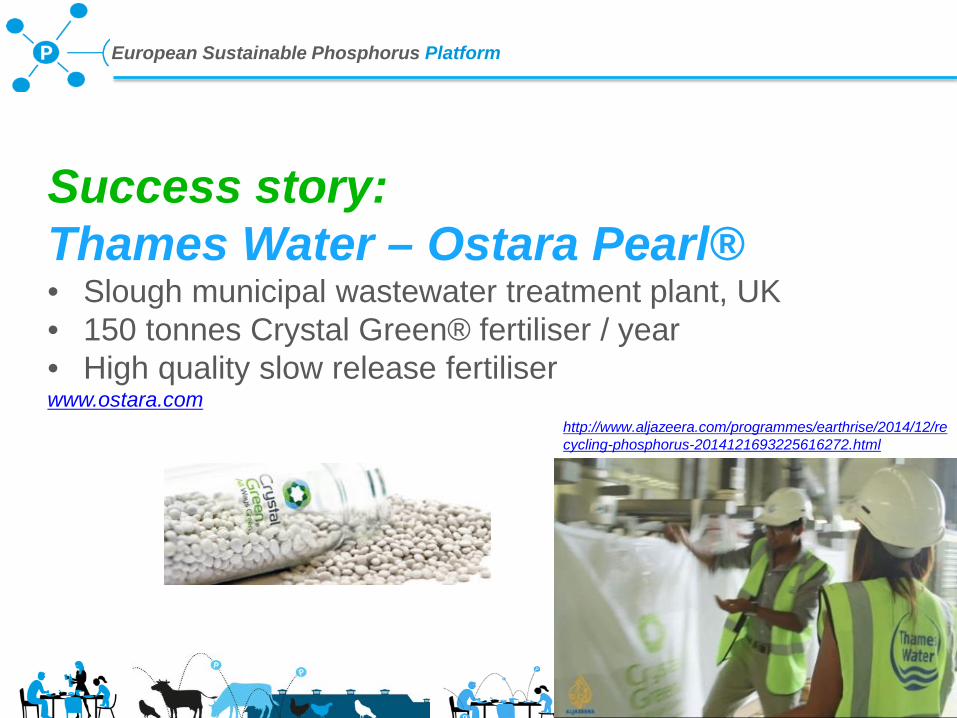
Success story: Thames Water – Ostara Pearl® • Slough municipal wastewater treatment plant, UK • 150 tonnes Crystal Green® fertiliser / year • High quality slow release fertiliser www.ostara.com
http://www.aljazeera.com/programmes/earthrise/2014/12/recycling-phosphorus-2014121693225616272.html
74 European Sustainable Phosphorus Platform
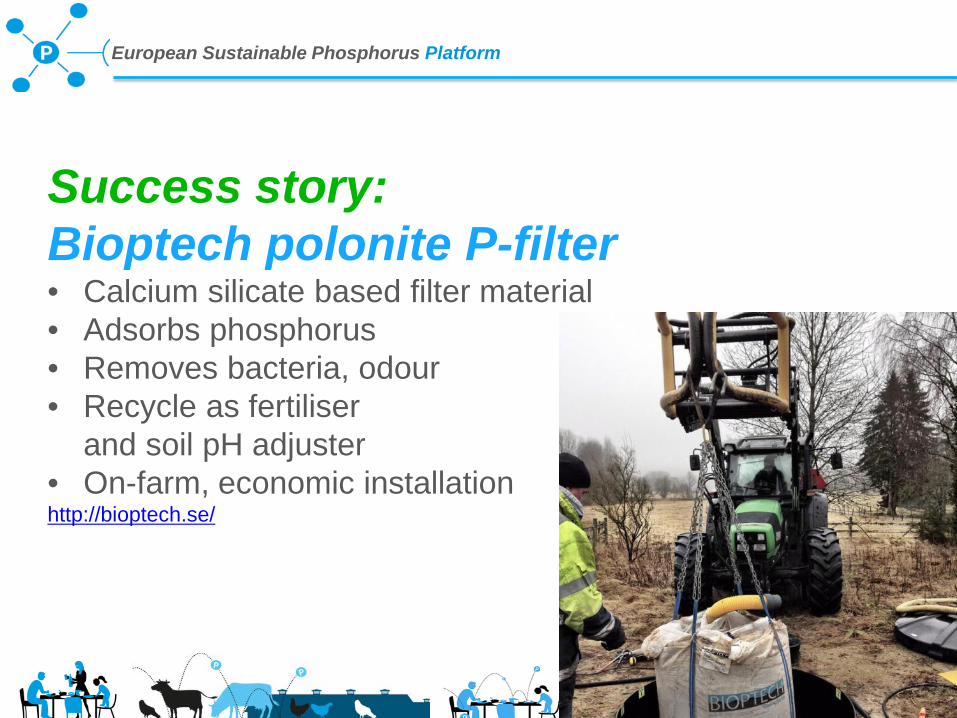
Success story: Bioptech polonite P-filter • Calcium silicate based filter material • Adsorbs phosphorus • Removes bacteria, odour • Recycle as fertiliser
and soil pH adjuster • On-farm, economic installation http://bioptech.se/
75 European Sustainable Phosphorus Platform
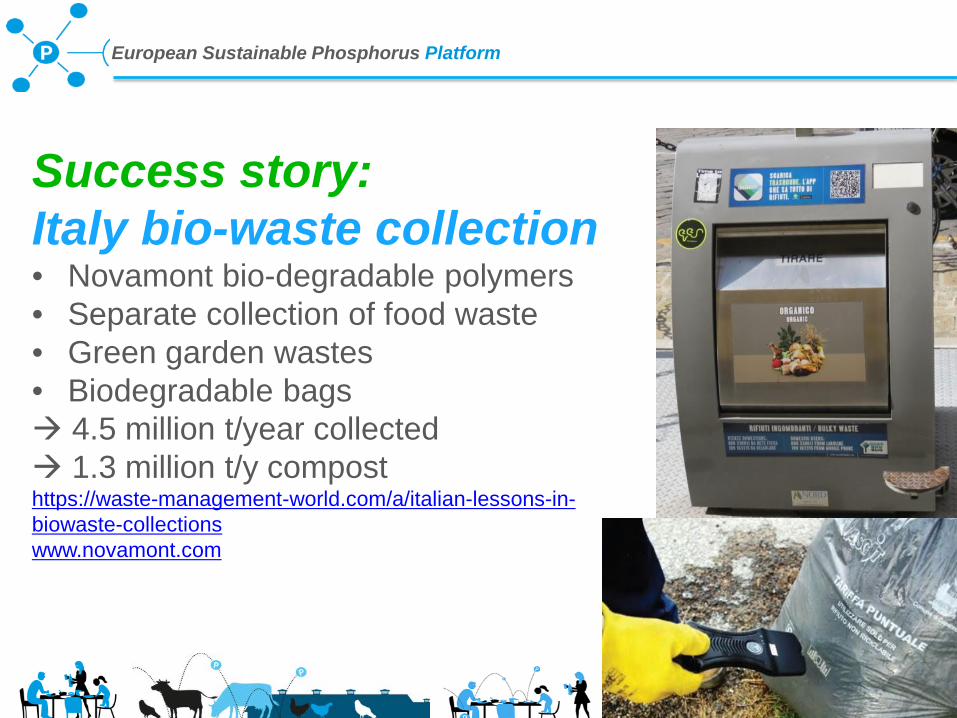
Success story: Italy bio-waste collection • Novamont bio-degradable polymers • Separate collection of food waste • Green garden wastes • Biodegradable bags 4.5 million t/year collected 1.3 million t/y compost https://waste-management-world.com/a/italian-lessons-in-biowaste-collections www.novamont.com
76 European Sustainable Phosphorus Platform
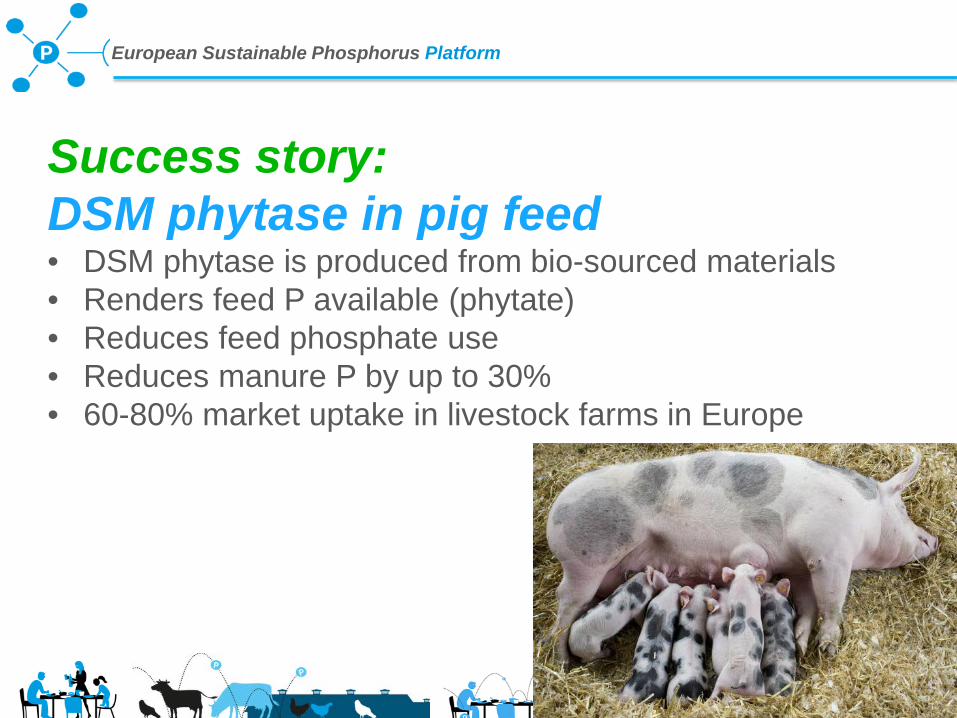
Success story: DSM phytase in pig feed • DSM phytase is produced from bio-sourced materials • Renders feed P available (phytate) • Reduces feed phosphate use • Reduces manure P by up to 30% • 60-80% market uptake in livestock farms in Europe
Thank you for your attention
Questions? Comments? Suggestions? [email protected] [email protected] Twitter: @kimovandijk Website: kimovandijk.weebly.com