patent laws and innovation selection in the global firmkbilir/bilir_sakamoto.pdfpatent laws and...
TRANSCRIPT

Patent Laws and Innovation Selectionin the Global Firm
L. Kamran Bilir∗
Yoko Sakamoto†
April 18, 2017
PRELIMINARY AND INCOMPLETE
Abstract
This paper provides evidence that offshore patent laws influence global firms’innovation decisions. Within a simple model of multinational production, we findthat a novel consequence of imitation risk is that firms innovate selectively, directinginvestments in product development toward relatively short-lived varieties thatare difficult to imitate prior to obsolescence. A key implication of firms’ selectiveproduct development is that patent reforms tend to increase not only innovation byfirms, but also the average economic lifetime of the products they develop—both toextents varying non-monotonically across industries according to rates of underlyingtechnological obsolescence. Using detailed data on U.S. patent grants and citationsduring 1976–2006 and U.S. multinational firms’ affiliate innovation investment during1982–2009, we find empirical regularities consistent with these hypotheses.
∗Department of Economics, University of Wisconsin, 1180 Observatory Drive, Madison, WI 53706,[email protected]; †Department of Economics, University of Wisconsin, 1180 Observatory Drive, Madi-son, WI 53706, [email protected]. The statistical analysis of firm-level data on U.S. multinationalcompanies was conducted at the Bureau of Economic Analysis, U.S. Department of Commerce under ar-rangements that maintain legal confidentiality requirements. The views expressed are those of the author anddo not reflect official positions of the U.S. Department of Commerce. The Bureau of Economic Analysis hasreviewed this paper prior to release to ensure that data confidentiality is not unintentionally compromised.

1 Introduction
Multinational firms account for almost all private U.S. innovation investment and thus hold
substantial volumes of intangible assets, including patented intellectual property and trade
secrets estimated to be worth several trillion U.S. dollars.1 However, as large U.S. multina-
tional corporations expand globally, these proprietary trade secrets are increasingly exposed
to potential competitors seeking to access leading-edge production technology. As a result,
U.S. firms’ global expansion is cited as an important contributing factor to rising trade se-
cret theft and its associated economic losses—losses that are particularly acute in offshore
markets that lack strong protection for intellectual property.2
However, even in such markets, global firms can mitigate the consequences of imitation
risk. Consider, for example, a technology intensive firm like Apple. Pressured by low-cost
competitors that continually emulate its products and infringe on its intellectual property,
the firm responds by pursuing intense innovation investments aimed specifically at ensur-
ing frequent product introductions. The firm states that its competitive success hinges on
this strategy of maintaining short product lifecycles, which allow the firm to essentially
outpace imitative competitors in the offshore market.3 Shared by a range of other promi-
nent, technology-intensive multinationals, this view strongly suggests that the rapid pace of
product obsolescence within such firms is, in part, a response to imitation risk.4
In this paper, we show that this view has novel implications for the effects of offshore
patent reforms on the global firm. Within a model in which Northern firms face imitation
risk in the South, we find that imperfect patent protection encourages selective innovation,
whereby firms develop only shorter-lived products that are relatively difficult to imitate prior
to obsolescence. Offshore patent reform expands the range of products firms can develop
profitably, increasing not only innovation but also the average product lifecycle length, both
to extents that differ across industries according to rates of underlying technological change.
To evaluate these implications empirically, we use data on U.S. patents during 1976–2006 and
the activity of U.S. multinational firms during 1982–2009. Consistent with the predictions of
the model, we find that firm-held technology is shorter-lived on average relative to non-firm
technology, that its durability responds to offshore patent reforms non-monotonically across
industries—as does the offshore innovation spending by U.S.-based multinational firms.
Taking Bilir (2014) as our point of departure, the model considers Northern firms that
locate production in the South, where manufacturing costs are low but patents are only
1National Science Board (2014), U.S. Chamber of Commerce (2013).2Estimated economic costs of U.S. firms’ trade secret losses are between 1 and 3 percent of U.S. GDP
annually. See Yeh (2016).3Based on the SEC 10-K annual report for Apple (2014).4See, e.g., SEC 10-K annual reports for Hewlett-Packard (2014), Western Digital (2014), Intel (2010).
1

imperfectly protected. Firms nevertheless exercise partial discretion over which available
technologies underlying the industry to develop into product innovations; development occurs
only if the lifetime expected profits of the potential product exceed the innovation cost. This
setup builds from the dual premise that in a range of markets, the product innovations of
global firms may be viewed as a proprietary assembly of existing technologies—and that
offshoring, even to countries lacking strong patent laws, is broadly an industry standard for
the highly productive multinationals responsible for the largest share of innovation spending.
Underlying each industry is a continuum of available technologies that are horizontally
differentiated and also distinguished by their economic durability: some are technologically
only just removed from currently available products, and face rapid obsolescence; others are
positioned well beyond the state of the art, and are viable for a longer period of time. Thus,
while all technologies in an industry share a common, exogenous hazard rate of obsolescence,
the economic lifetime of a given idea is idiosyncratic. We show that when patent enforcement
in the South is perfect, Northern firms optimally develop all available varieties.
However, imperfect intellectual property rights in the South cause firms to restrict
innovation effort to include only short-lived ideas with lifetimes falling below a product
innovation threshold. This selectivity arises because offshore imitation occurs with a lag:
reverse-engineering a new Northern technology in the South is time consuming. A conse-
quence is that a variety faces a higher likelihood of imitation as it matures, so that produc-
ing a sequence of short-lived varieties is more profitable in expectation than a sequence of
longer-lived varieties. We show that patent reforms increase both innovation and the aver-
age lifetime of manufactured products and, importantly, that firms’ effort to shorten product
lives in the model may thus be viewed as a strategic substitute for formal patent rights.
The model further relates the sensitivity of firms’ innovation decisions following reform
to the underlying the rate of technological change in each industry. As patent laws are
strengthened, firms pursue a margin of more durable ideas—ideas that were previously not
profitable. While the measure of affected ideas is strictly positive in every industry, it is
highest in sectors with intermediate rates of underlying technology obsolescence near firms’
product innovation threshold. For industries in which the average technology is either much
longer- or shorter-lived than this innovation threshold, firms’ product development response
is smaller, reflecting the limited measure of available ideas affected by patent reform. Hence,
the magnitude of the increase in firms’ innovation and average product lifetime following
reform is non-monotonic in industry-specific rates of underlying technology obsolescence.
Evaluating the predictions of the model requires measuring the durability of the tech-
nology embedded in specific products, as well as the underlying rate of technological change
among ideas within a given industry. For this, we build on the insights of Narin and Olivastro
(1993) and Bilir (2014), which propose that proprietary technology is partially observable in
2

patent records, and that the length of time during which a patent continues to be cited by
subsequent patents provides a relative indication of the market lifetime of the cited patent’s
technology: a long average “forward citation lag,”—the time lapse between the cited patent’s
grant date and a subsequent citation—tends to indicate that the technology exhibits lasting
relevance to future innovation. We thus develop an index for the economic lifetime of a
patented idea by measuring its average forward citation lag. While conceptually related to
the industry-level index in Bilir (2014), our disaggregated index is measured at the patent
level, and reveals the salience of within-sector variation in technology lifetimes in the data:
only approximately nine percent of the overall variation in patents’ technology durability is
explained by industry (technology class) differences across patents.
Importantly, a promising technology is often patented even if it is owned by a govern-
ment or university and is never ultimately embedded in a product. Using our patent-level
technology lifetime index and information on patent ownership, we are therefore able to
evaluate whether the data support the selective product development that is a key feature
of the model. The data suggest that, all else equal, patents granted to firms are on average
shorter-lived than otherwise identical patents granted to non-firms including universities,
governments, institutes, hospitals, and individuals. If patents by firms more likely protect
technology embedded in products, this simple correlation is indeed aligned with the theory.
Our results further indicate that the economic durability of firms’ patented technology
is shaped systematically by intellectual property rights and the underlying rate of idea ob-
solescence in the industry; for these results, we consider patents owned both by a U.S. firm
and a foreign inventor—technology that is relatively likely to be associated with a global
firm. Using proxies for the strength of patent laws by country-year from Ginarte and Park
(1997) and Park (2008) and an industry index of the technology obsolescence rate simi-
lar to Bilir (2014) but based on non-firm patents, we obtain estimates consistent with the
non-monotonicity predicted by the model. Sensitivity to patent laws abroad depends on in-
dustries’ rate of technological change, reaching its peak effect in an intermediate industry in
which the durability of underlying technology is near the median. Intuitively, this arises be-
cause industries with underlying obsolescence rates near the product development threshold
have the highest density of ideas that are marginal with respect to the patent reform.
Because not all innovation is patented, however, patent-based outcomes leave unob-
served a potentially important component of firms’ innovation response to intellectual prop-
erty reforms. Indeed, secrecy and other mechanisms have been established as important
methods of protecting intellectual property, particularly where patents are imperfect (e.g.
Cohen et al 2000), and the decision to increase the durability of targeted innovations could
potentially manifest itself as a response independent of patenting. To permit a broader inter-
pretation of the results above, we therefore consider the innovation investment response by
3

U.S. firms’ manufacturing affiliates using data from the Bureau of Economic Analysis, and
confirm a qualitatively identical relationship between patent laws and U.S. firms’ innovation
abroad. Using variation across firms in U.S. state-level R&D costs from Wilson (2009), we
confirm that this affiliate innovation investment response to local intellectual property laws
is strongest among multinationals with high U.S. innovation costs.5 Our results are also
consistent with the idea that offshore affiliate imports from the associated U.S. headquarters
is an significant channel through which knowledge is shared within the firm.6
Our paper is related to a growing literature that empirically examines the effects of in-
tellectual property rights on multinational activity. Javorcik (2004) finds that strengthened
patent rights encourage firms in high-technology sectors to establish subsidiaries within East-
ern Europe and the former Soviet Union. Relatedly, Branstetter, Fisman, and Foley (2006)
find that patent reforms are associated with increased royalty payments and R&D spending
by U.S. multinational affiliates, with the largest effects in high-patent firms, and Bilir (2014)
finds that strong patent institutions tend to attract multinational affiliates and also expand
their sales, assets, and employment levels, particularly in sectors with long product lifecycles.
Our paper builds closely on this literature and especially Bilir (2014), yielding additional
conclusions. First, we consider the theoretical possibility that firms’ technology lifetimes
are heterogeneous, even within an industry, and document that such within-industry varia-
tion is salient in the data. Second, we endogenize the innovation decision and find that the
data are consistent with selective innovation, implying patent reforms abroad shift not only
where, but also what is innovated by global firms. Third, we restrict attention in the model
to relatively productive firms that dominate innovation spending, but for which there is no
theoretical offshoring response to a change in Southern intellectual property rights—and for
these firms, we find that the innovation response to patent reforms is important.
Our work contributes to a long-standing debate regarding the link between competi-
tion and the rate of innovation (Schumpeter 1942, Arrow 1962). This literature has es-
tablished that whether a marginal reduction in competition—for example through a policy
that strengthens intellectual property rights—increases or decreases innovation depends on
economic conditions prevailing prior to the policy change. Indeed, there is an intuitive logic
going in both directions (Aghion et al 2005). On the one hand, stronger intellectual prop-
erty rights lessen the ‘escape-competition’ motive for product entry (e.g. Qian 2008); on the
other, stronger rights expand the effective size of the market for any given product, which
can encourage innovation. We show in a simple model that one can partially reconcile these
two views: patent reforms increase innovation but also ‘slow’ the realized rate of product
obsolescence; in this, our work also relates to Shapiro (2012).
5See, for example, Bilir and Morales (2016).6See Keller and Yeaple (2013).
4

Finally, our paper contributes to a line of research examining the foreign direct invest-
ment response to institutional frictions, including financial development, investor protection
laws, and contractual imperfections (Antras, Desai, and Foley 2009; Manova, Wei, and Zhang
2010; Bernard et al. 2010; Antras 2003) as responses to corporate tax conditions (Hines
1997). Others have suggested that the effects of these imperfections and firms’ ability to
transfer earnings across national borders are particularly relevant among innovative firms,
particularly those that manufacture cutting-edge technology (Antras and Helpman 2004,
Nunn and Trefler 2008, Davidson and McFetridge 1985). We find evidence that countries’
institutions interact to shape the innovation activity of multinational firms. In particular,
our results suggest that a patent reform in the South is more effective in attracting inno-
vation by Northern multinationals when firms lack access to generous innovation subsidies
in the North.7 Our results are also in line with the idea that, for global firms, institutional
quality in one country can affect firm outcomes in others. Specifically, we find support for
the idea that institutional tolerance of imitation in one country affects the products firms
manufacture and sell, even to markets with strong patent laws.
2 Model
Building on the simple, partial-equilibrium setup in Bilir (2014), this model considers how
Northern firms respond to offshore imitation risk. The framework formalizes the idea that
firms facing imitation risk develop products selectively, directing innovation effort toward
short-lived varieties. Patent reforms reduce the profit consequences of imitation, expanding
the range of profitable products toward longer-lived varieties and raising both innovation
and the average length of the product lifecycle; these effects differ, however, according to
sectors’ underlying rates of technology obsolescence. To align the theoretical results with
our data and empirical analysis below, the model restricts attention to firms that offshore
manufacturing at all points during the product lifecycle.8
2.1 Production
Time is continuous, and at every moment, firms in sectors j = 1, ..., J produce horizontally
differentiated varieties for consumption in both the North and the South. Each country
hosts a monopolistically competitive market of size 1. To produce, a sector-j firm i must
cover the cost of developing an available technology into a new variety that is associated with
proprietary, product-specific intellectual property (patented and tacit); conditional on doing
7See also Bilir and Morales (2016).8Bilir (2014), Section II.G. The data include information on multinationals’ offshore affiliate innovation
investment only for relatively large Northern firms (see section 3)
5

so, the firm enjoys a monopoly in variety i until it is either imitated or becomes obsolete.
Obsolescence arrives for variety i after a length of time Tij, meaning that once product i
reaches a market maturity of Tij years, it becomes obsolete and is of no further economic
value. In a departure from Bilir (2014), Tij differs across varieties within industry j.9
Producing variety i in sector j requires using product-i technology to combine manu-
facturing with headquarters services and ongoing innovation investment. Innovating firms
locate permanent headquarters in the North and a permanent manufacturing affiliate in the
South. We assume that economic conditions favor manufacturing in the South rather than
in the North, and that when offshoring, monopolists earn flow profits πS in each market. To
emphasize the innovation response to intellectual property reforms, and to align our analysis
with the data, we restrict attention as noted above to relatively productive Northern firms
that offshore manufacturing at all product maturities.10
A firm’s monopoly power may be disrupted by imitation as in Bilir (2014), resulting in
profit losses. Specifically, firms competing with an imitator capture only a fraction of the per-
period profits πS. This fraction depends in part on the quality of local patent enforcement,
which we summarize with a pair of country-specific indexes ξN and ξS. Similar to Grossman
and Lai (2004), ξi is the probability that a country-i patent is enforced at any point in time,
but could also be interpreted as the fraction of territory in which patents are enforced. We
assume that patents are perfectly enforced in the North, but not in the South, ξN = 1 and
ξS < 1. Only where a patent fails to be enforced may imitators’ products compete directly
with innovating firms’. Hence, imitation products may only be sold in the South.
2.2 Imitation
Potential imitators exist in the South and may begin reverse-engineering a product at any
time. As in Grossman and Helpman (1991), Glass and Saggi (2002), Bilir (2014), and
elsewhere, assume the time to imitation success m is uncertain and arrives at a constant
Poisson rate λ. Imitation effort thus may or may not yield an imitation product within the
targeted variety’s lifetime.
When an imitator successfully enters a market with imperfect patent protection, it
engages in Bertrand competition with the innovating firm wherever patents are not enforced
until the variety becomes obsolete (Grossman and Helpman 1991). Imitators produce final
goods with the same production technology as innovating firms, but as indicated above, are
relatively inefficient. As a result, a Northern firm suffers reduced profits when competing with
9Our approach is motivated by the evident importance of within sector variation in Tij . Regressing Tijon sector fixed effect indicates industry differences explain less than ten percent of the variation in Tij inthe cross section of patents sharing a common grant year.
10See note #7.
6

an imitator. The innovating firm sets a price just below the Southern imitator’s marginal
cost, deterring sales by the Southern firm, but also reducing its own profit to απS < πS
wherever patents are not enforced.11
2.3 Product Development
Under these assumptions, the expected flow profit for a product i with maturity t ≤ Tij is
π(t) ≡ Em[π(t; t ≤ Tij, ξS)] = 2πS Pm > t+ (1 + ξS)πS Pm ≤ t (1)
= (1− ξS)πS exp(−λt) + (1 + ξS)πS
where ξS ≡ ξS + α (1− ξS) < 1. Accordingly, the expected lifetime profit for variety i is
Em[Π(Tij, ξS)] =
∫ Tij
0
π(t)dt
= (1 + ξS)πSTij + (1− ξS)πS[1− exp(−λTij)]/λ. (2)
Equation (1) reveals the effect of imperfect patent enforcement in the South on profits.
Selling to both markets, the firm earns 2πS as a monopolist until successful entry by an
imitator, which occurs after an ex ante uncertain duration of time m. Once imitation has
occurred, profit is πS only where patents are enforced, and is elsewhere reduced to απS as
described above. Notice that because the likelihood of imitation rises as a product matures,
the fraction of the product lifetime spent competing with an imitator is, on average, increas-
ing in Tij. Thus, it can be shown that the average per-period profit Em[Π(Tij, ξS)]/Tij for i
is strictly decreasing in Tij: it is 2πS for an infinitesimally-lived variety (Tij → 0) but falls
toward (1 + ξS)πS as the product life lengthens (Tij →∞) as illustrated in Figure 1.
Lemma 1: Whenever patents are imperfectly protected in the South (ξS < 1), the expected
average profit per period earned by variety i monotonically decreases in Tij, the length of the
product-i lifecycle: ∂[EmΠ(Tij, ξS)/Tij]/∂Tij < 0.
As a result, Northern firms facing imitation risk and costly product development exercise
discretion over Tij when making innovation decisions, and in particular, when choosing
which technologies to develop into products. Suppose that there is a continuum of available
technologies underlying industry j, and that for each, obsolescence arrives at an exogenous
11The parameter α is increasing in the productivity of the Northern firm relative to its imitator. Inparticular, if country-i firm productivity is summarized by a positive parameter ϕi that affects profits as inMelitz (2003), it can be shown that α ≡ α(ϕ, σ) = σσ(σ− 1)−(σ−1)ϕσ−1(1− ϕ) < 1, where ϕ ≡ ϕS/ϕN < 1.
7

Poisson rate that is specific to industry j.12 The lifetime Tij of any sector-j technology i thus
follows an exponential distribution that we denote φj(T ). Let Tj be the average lifetime of
an industry-j technology implied by this distribution.
Any Northern firm may pay an industry-specific sunk cost to draw an idea i from the
distribution φj. The firm thereby learns Tij, and acquires the right—an exclusive right
wherever patents are protected—to sell a sector-j variety based on idea i. To exercise this
right, the firm must develop i into a viable product. This requires an applied research
and development cost c(Tij) = cTij, where the flow cost c is common across industries and
incurred on a per-period basis; to keep things simple in what follows, we assume that the firm
producing technology i introduces a non-overlapping sequence of distinct varieties sharing a
common lifecycle length Tij. Alternatively, upon learning Tij, the firm may exit at no cost.
Provided that the innovation cost satisfies (1 + ξS)πS < c < 2πS, only ideas with
sufficiently short lifetimes are attractive targets for product development. A firm, having
observed Tij, pays the per-period research and development cost c and produces i only if the
lifetime expected profits Em[Π(Tij, ξS)] in (2) exceed c(Tij). This occurs when Tij is below
the threshold value T (ξS), where T (ξS) is the unique product lifecycle length Tij satisfying
Em[Π(Tij, ξS)]/Tij = c (Figure 1), or implicitly,
1− exp[−λT (ξS)]
T (ξS)=λ[c− (1 + ξS)πS]
(1− ξS)πS. (3)
Firms thus develop ideas into products selectively according to this sector-invariant cutoff
T (ξS). Notice that this cutoff increases in ξS, implying innovating firms optimally develop
longer-lived varieties when patents are better protected in the South: ∂T (ξS)/∂ξS > 0. Un-
der perfect patent protection (ξS → 1), firms develop all ideas into products.
ASSUMPTION 1: The product development cost c is smaller than initial, pre-imitation
profits and larger than post-imitation profits: (1 + ξS)πS < c < 2πS.
Lemma 2: Northern firms facing imitation risk in the South develop ideas into products
selectively. In any industry j, only varieties with sufficiently short lifecycles Tij < T (ξS) are
developed by innovating firms. The sector-invariant innovation cutoff T (ξS) is increasing in
the quality of Southern patent protection ξS, implying firms pursue the development of longer-
12We assume that this distribution of ideas results from a process of basic scientific research in the Norththat is exogenous to the firms whose product development decisions we consider. In the United States, wherethe firms we evaluate below are based, the government accounts for approximately one-third of all researchand development expenditures, and is also the primary source of basic research funding (National ScienceBoard 2014). This research is performed by university and public-sector research programs for which thefirm-level incentives we consider here are unlikely to be an important factor.
8

lived varieties as offshore intellectual property rights are strengthened: ∂T (ξS)/∂ξS > 0.
In Lemma 2 above, firms’ innovation decisions reflect the anticipated cost of future competi-
tion with an imitator. Longer-lived ideas are more likely to be imitated before obsolescence,
and are thus relatively exposed to this risk; this discourages their development, shifting the
industry distribution of manufactured varieties toward the shorter-lived. Intuitively, this se-
lective innovation is a strategy by which firms reduce imitation exposure; in developing only
short-lived varieties, firms essentially outpace potential imitators. An important implication
is that such efforts to shorten product lives—whether by selective product development or
simply faster innovation—can partially offset the costs of imitation risk, thereby serving as
a strategic substitute for formal patent protection.13
2.4 The Innovation Response to Patent Reform
A Southern patent reform that increases ξS also increases T (ξS), implying that a larger share
of available ideas are developed by firms into products within each industry j. As a result,
total applied research and development spending in sector j,
Rj(ξS) =
∫ T (ξS)
0
c φj(t)dt
responds for all j, as does the average durability of manufactured varieties in sector j,
Tj(ξS) =
∫ T (ξS)
0
tφj(t)dt.
Using the expressions above, it is simple to show that firms’ total innovation spending in-
creases in Southern patent rights ξS for any industry j, ∂Rj(ξS)/∂ξS > 0, and that the
average product lifetime in any sector j also increases, ∂Tj(ξS)/∂ξS > 0. Both changes are
intuitive: a Southern patent reform reduces the negative profit consequences of imitation,
encouraging firms to pursue the relatively exposed, longer-lived varieties.
Result 1: An increase in the quality of Southern patent protection ξS also increases both a)
industry-level R&D spending, ∂Rj(ξS)/∂ξS > 0, and b) the average durability of manufac-
tured varieties, ∂Tj(ξS)/∂ξS > 0, for each sector j.
However, while a patent reform in the South increases overall innovation spending by North-
ern firms in all sectors, the magnitude of this increase follows a non-monotonic function
13Cohen et al (2000) describes a series of such substitutes, including lead time and secrecy.
9

across industries in the average durability Tj of underlying ideas, where recall that ideas are
on average longer-lived than manufactured varieties in sector j, Tj > Tj(ξS), whenever patent
protection is imperfect. In particular, the innovation response ∂Rj(ξS)/∂ξS to a change in
ξS depends on the sector-j rate of technology obsolesce Tj as follows,
∂2Rj(ξS)
∂ξS∂Tj= c exp[−T (ξS)/Tj] T
′(ξS) (T (ξS)− Tj)/T 3
j (4)
and is increasing in Tj for Tj < T (ξS), but decreasing for Tj > T (ξS).14 The largest impact
of the patent reform occurs in the intermediate industry j for which the average durability
of ideas satisfies Tj = T (ξS). This may be stated as follows:
Result 2: The innovation response by Northern firms to a Southern patent reform follows
a non-monotonic function of underlying idea durabilities Tj. The response is a) increasing
in Tj for sectors with short-lived ideas, ∂2Rj(ξS)/∂ξS∂Tj > 0 if Tj < T (ξS), b) decreasing in
Tj for sectors with long-lived ideas, ∂2Rj(ξS)/∂ξS∂Tj < 0 if Tj > T (ξS), and c) reaches its
peak in an intermediate industry with Tj = T (ξS).
Intuitively, the non-monotonicity described in Result 2 arises because the measure of avail-
able technologies that is marginal with respect to the reform-induced increase in T (ξS) is
highest in the industry with the highest density of ideas near the innovation selection thresh-
old T (ξS). As the distance between T (ξS) and the industry’s average technology durability
Tj widens, the measure of sector-j ideas that are affected by the reform declines.15
Finally, the increase in the durability of manufactured product varieties following a
patent reform in the South also follows a non-monotonic function across industries with dif-
ferent underlying idea durabilities Tj. Like ∂Rj(ξS)/∂ξS, the increase in product durabilities
following the reform is highest in the intermediate industry with Tj = T (ξS).
Result 3: The increase in the average lifetime of manufactured varieties following a South-
ern patent reform follows a non-monotonic function of average underlying idea durabilities
Tj. The response is a) increasing in Tj for sectors with short-lived ideas, ∂2Tj(ξS)/∂ξS∂Tj > 0
if Tj < T (ξS), b) decreasing in Tj for sectors with long-lived ideas, ∂2Tj(ξS)/∂ξS∂Tj < 0 if
Tj > T (ξS), and c) reaches its peak in an intermediate industry with Tj = T (ξS).
14See the Appendix for details.15Notice that the innovation mechanism behind the non-monotonicity that arises in this context is distinct
from the offshoring mechanism in Bilir (2014). In that paper, Northern firms with durable varieties strategi-cally delay offshoring to postpone imitation. Industries with short Tj do not respond to patent reform in theSouth, while industries with longer-lived products respond by shifting production to the South. Here, thedensity of available ideas with durability t in sector j is itself a non-monotonic function of Tj ; this determinesthe measure of ex ante available technologies that are developed into new products following a patent reform.
10

2.5 The Affiliate Innovation Response
Extending the framework above to include an innovation location decision, it is simple to
show that patent reforms have a further tendency to increase innovation performed by South-
ern affiliates. In particular, suppose that product-i flow profits πS depend on whether in-
novation is performed in the North or in the South, to an extent that differs across firms.
For simplicity, assume that if the Southern affiliate innovates, the firm earns πSS ; if inno-
vation is instead sourced in the North, the firm earns πSNi, which is specific to product i
and could be higher or lower than πSS depending on i. The product-i profit advantage of
sourcing innovation in the North |πSNi−πSS | potentially reflects a) innovation subsidies in the
North that differ across firms and locations (Wilson 2009), and b) differences in the relative
productivity of affiliate innovation, which may depend on complementary investments of the
firm as well as local institutions (Bilir and Morales 2016). We assume that the firm produc-
ing i always innovates at its preferred location, implying πS = maxπSS , πSNi, and that the
distribution of πSNi implies a sector-invariant probability of sourcing innovation for i in the
South, pS ≡ PπSNi < πSS.In this setting, a qualitatively identical prediction emerges for the impact of patent
reform in the South on innovation among offshore affiliates of Northern firms. In particular,
innovation spending by affiliates in the South
RSj (ξS) =
∫ T (ξS)
0
pSc φj(t)dt
increases in ξS for each sector j, where recall pS ≡ PπSNi < πSS is the probability that a
given sector-j variety is supported by affiliate innovation. In addition, among varieties with
πSNi < πSS , this increase in Southern affiliate innovation follows a non-monotonic function of
sectors’ underlying idea durabilities Tj, which we state as follows.
Result 4: Following a patent reform in the South, the innovation response by the Southern
affiliates of Northern firms with πSNi < πSS follows a non-monotonic function of Tj. The
response is a) increasing in Tj for sectors with short-lived ideas, ∂2RSj (ξS)/∂ξS∂Tj > 0 if
Tj < T (ξS), b) decreasing in Tj for sectors with long-lived ideas, ∂2RSj (ξS)/∂ξS∂Tj < 0 if
Tj > T (ξS), and c) reaches its peak in an intermediate industry with Tj = T (ξS). By con-
trast, Southern affiliate innovation in firms with πSNi > πSS is not responsive to the reform.
Importantly, if Northern firms are multiproduct firms, Result 4 can be interpreted as having
within-firm implications at the affiliate level; in particular, the probability that an affiliate
in the South performs R&D increases non-monotonically in Tj as the firm adds new varieties
11

to its portfolio. This affiliate-level response will be most pronounced among firms producing
varieties i for which innovation costs tend to be high in the North (πSNi < πSS ).
3 Data and Measurement
3.1 Technology Obsolescence Rates
Evaluating the predictions of the model above requires measuring the economic durability of
technologies embedded in products, and of technologies or ideas that exist within an industry
but ultimately are not embedded into products. It is therefore critical to observe the evolu-
tion of technology by industry not only for firms, but also for non-firms. While technology
produced by non-firms is by definition unobserved in firm-level datasets, U.S. patent records
contain detailed information on technologies developed by both types of agents.
Technology Ownership and Origin
In particular, U.S. patent publications include precise information regarding both tech-
nological classification and ownership. Each patent is associated with a three-digit industry
class, in addition to a three-digit subclass, allowing for a precise categorization of the tech-
nology. For ownership, what is relevant for evaluating the model is to discern whether idea
i in sector j is developed into a product by a Northern firm, or whether idea i instead exists
but goes undeveloped. The U.S. Patent and Trademark Office data do not explicitly record
information about product development, but it is possible to observe whether patent i is
owned by a firm, or instead by a non-firm such as a university, government, research insti-
tute, hospital, or individual, and whether the owner is domestic or foreign, using the NBER
Patent Data Project categorization. In line with the model, we consider a patent that is
owned or co-owned by a firm as likely to reflect the intent to develop a product involving the
patented idea, and we view patents owned by non-firms as less likely to be developed without
further refinement. In addition, to base our Lemma 2 comparison on patents involving a
firm in ‘the North’, we restrict attention to patents with at least one U.S. owner.
Technology Lifecycle Lengths
With this restriction and categorization in hand, we build on the insights in Narin and
Olivastro (1993) and Bilir (2014) to construct an index for the economic durability Tij of
patented technology i in sector j. The idea behind the Tij index is that the length of time
during which a given patent continues to be cited by subsequent patents provides an indica-
tion of the market lifetime of the cited patent’s technology: a long average “forward citation
lag”—the time lapse between the cited patent’s grant date and a subsequent citation—tends
12

to indicate that the technology exhibits lasting relevance to future innovation. Our main
proxy for Tij is thus the average forward citation lag, analogous to that in Bilir (2014), but
is measured not only for each industry j (below) but also for each individual patent i.16
Importantly, this proxy can be constructed using information in standard datasets (NBER
Patent Citations Datafile, Hall, Jaffe, and Trajtenberg 2001). To account for truncation in
the citations received by relatively recent patents, we measure Tij using citations occurring
within five years of the cited patent’s grant date, and to reduce sensitivity to noisy cita-
tion dates, we exclude patents receiving fewer than three distinct citations.17,18 Summary
statistics for this Tij index appear in Table 1.
Given the emphasis in the model on within sector-j variation in technology lifetimes
Tij, and because considering this within-sector variation is a key novel aspect of our study,
it is worth examining whether the distinction between Tij and Tj is meaningful. Evaluating
the within-sector variation in the measured index Tij, we find that the data indeed reject the
idea that individual technology durabilities are tightly centered around a sector-j average
Tj: industry fixed effects account for only nine percent of the total observed variation in Tij,
suggesting within-industry variation in technology lifetimes is highly relevant in the data.
As in the model above, such variation can nevertheless arise from a process whereby lifetimes
Tij are stochastic, but are drawn from a common, industry-j distribution.
As argued in Bilir (2014), this patent-based measurement approach permits a useful
flexibility, in that the durability of technology i can span multiple versions of a product over
its lifecycle. This flexibility is ruled out by alternative measurement approaches, including
proxies based on product turnover rates or patent renewal decisions.19 It is also straightfor-
ward to control for variation in Tij across patents with different grant years, industries, and
citations (quality), where the latter is important as it can affect the precision of Tij.
Industry-Average Lifecycle Lengths
16An alternative measurement approach would be to consider the maximum citation lag for each patent;while in practice this approach is sensitive to citation outliers, we replicate our results using the 75th-percentile citation lag, which captures variation similar to the maximum while remaining less exposed tonoise in the citation data.
17Thus, while the patent data span the period 1976–2006, the sample of U.S. patents for which we observeTij extends only through 2001. In addition, patents may in certain cases be published and also cited priorto the grant date, while still in the application process. Most such citations occur no more than three yearsprior to the patent grant, around the length of time needed to process the patent application. We thus allowcitations within the range of three years prior to, and five years after, the official patent grant date.
18That the Tij index is based on citations within five years is guided by the timing of intellectual propertyreforms. From a U.S. perspective, the most important set of offshore patent reforms during the sample periodwere the result of the WTO’s 1995 TRIPS agreement. Extending the post-grant period to include citationsbeyond five years has little effect on the cross-patent distribution of Tij , but implies losing post-TRIPSobservations: considering citations within ten years implies dropping all patents granted after 1996.
19Patent renewal data have been used to measure the asset value of patents (e.g. Pakes 1986); retailturnover data of detailed product varieties are available from Broda and Weinstein (2010).
13

Results 2, 3, and 4 suggest that the innovation response by firms in sector j to the
quality of Southern patent protection is non-monotonic in Tj, the underlying industry-j
average lifetime of an idea. To evaluate these results, we thus need a proxy for the industry-
average lifetime index Tj and—recognizing that the structure of firms’ global operations may
differ—information on the country corresponding to ‘the South’ for each sector-j patent i. We
measure Tj using two approaches: the first approach is broad, defining Tj as the industry-j
average Tij similar to Bilir (2014); the second approach measures Tj using only U.S. non-firm
patents, in line with a strict application of our model assumption that the distribution of
ideas results from basic scientific research in the North that is exogenous to firms.20 This
exogeneity also alleviates the potential for a mechanical link between Tij and Tj, and is thus
critical to evaluating Result 3 empirically.
Evaluating Results 2 through 4 requires a clear industry definition. For Result 3, which
has a patent-based outcome measure, the industry is defined as the three-digit technology
class of the patent. Mapping Tij onto data for multinational activity from the BEA, however,
involves using a concordance between U.S. patent classes and SIC 3-digit industry codes.21
In most cases, many patent classes correspond to the same SIC industry. We therefore take
an unweighted average Tj index across all patent classes matched to a given SIC code as in
Bilir (2014). In all cases, to construct Tj, we place no restriction on the patent class of citing
patents, to allow for the possibility that a patented technology may have relevance to future
innovation not only within its own class, but also for other patent classes.
3.2 Innovation in U.S. Multinational Firms
Results 2 and 4 link Northern multinational firms’ innovation investment with intellectual
property rights in the offshore manufacturing location. To evaluate these results, we use
firm-level panel data on the global operations of U.S.-based multinationals from the Bureau
of Economic Analysis (BEA) Survey of U.S. Direct Investment Abroad. These data provide
information on U.S. parent companies and each foreign affiliate on an annual basis.22 Our
analysis uses data from benchmark-year surveys, which are the most extensive in both scope
20As robustness checks, we replicate the Tj index using a more disaggregated industry definition; also,in case short-Tij patents differ from those with high Tij values for measurement reasons unrelated to themechanisms of the model, we consider the 75th percentile Tij as an alternative industry proxy.
21This concordance can be downloaded from the website of the U.S. Patent and Trademark Office, http://www.uspto.gov/web/offices/ac/ido/oeip/taf/data/sic conc/2005 diskette/.
22Any U.S. person having direct or indirect ownership or control of ten percent or more of the votingsecurities of an incorporated foreign business enterprise or an equivalent interest in an unincorporated foreignbusiness enterprise at any time during the benchmark fiscal year in question is considered to have a foreignaffiliate. However, for very small affiliates that do not own another affiliate, parents are exempt fromreporting with the standard survey form. Foreign affiliates are required to report separately unless they arein both the same country and three-digit industry. Each affiliate is considered to be incorporated where itsphysical assets are located.
14

and coverage and are available for 1982, 1989, 1994, 1999, 2004, and 2009.23 Our analysis
uses disaggregated information on affiliate-level expenditures on R&D investment, and the
location (U.S. state), sales, and innovation investment of associated U.S. parent firms. Given
the particular importance of R&D investment measures, we restrict attention to the relatively
large firms and affiliates required to report R&D investment in each year.24 Table 1 provides
a summary of multinational activity across the six benchmark years.
3.3 Intellectual Property Rights
A proxy for the strength of patent protection across countries is provided by an index devel-
oped in Ginarte and Park (1997), and updated in Park (2008). Because this index is detailed
in its construction and provides extensive coverage, it is widely used.25 The strength of patent
rights is documented for five distinct categories: 1) extent of coverage, 2) membership in
international patent agreements, 3) provisions for loss of patent protection, 4) enforcement
mechanisms, and 5) duration of protection. Each category receives a score between zero
and one based on whether prevailing patent laws meet specific, objective criteria.26 The
index itself is the unweighted sum of these five sub-indexes, and so ranges between zero to
five, with high values indicating strong protection. The index is available for 122 countries
during 1980–2005 in five-year intervals; each benchmark survey year is matched with the
closest available index year. Summary statistics appear in Table 1.
While the data on U.S. multinational firms described above allow us to fully observe
the global structure of each firm—and to thereby exactly match each offshore manufacturing
location with its relevant index of intellectual property protection—our ability to discern the
relevant variation for a given patented idea i in industry j is only imperfect. To determine
the relevant offshore market for patent i, we consider that a patent co-owned by both U.S.
and foreign entities is an idea that is likely to have been developed, at least partially, subject
23The BEA’s data coverage is nearly complete: in a typical benchmark year, the survey accounts forover 99 percent of affiliate activity. In 1994, for example, participating affiliates accounted for an estimated99.8 percent of total assets, 99.7 percent of total sales, and 99.9 percent of total U.S. FDI. This reflectsthe requirement of participation for every U.S. person having a foreign affiliate. However, in certain casesinvolving missing survey responses, the BEA data may instead report imputed values; these values are codedaccordingly and I exclude from my analysis all such observations.
24While the size threshold for affiliate R&D reporting is relatively low in early benchmark years, it rises to$90 million by 2009; affiliates for which sales, assets, and net income fall below this value are not required toreport, and are therefore excluded from the analysis below. For this reason, the model in section 2 considersonly relatively productive firms for which the decision to offshore is theoretically insensitive to intellectualproperty rights.
25See, for example, Bilir (2014), Qian (2007), Branstetter, Fisman, and Foley (2006), Javorcik (2004),McCalman (2004), and Yang and Maskus (2001).
26For example, the enforcement mechanisms category was scored by adding binary indicators correspondingto the availability of a) preliminary injunctions, b) contributory infringement pleadings, and c) burden-of-proof reversals. A country with laws meeting all three criteria would receive a value of 1 for this category.
15

to the influence of innovation incentives in the foreign country; we therefore associate each
such co-owned patent with the country of the foreign inventor.27
4 Econometric Framework
The model in section 2 has implications linking the volume and composition of Northern
firms’ innovation with the quality of Southern patent institutions. In this section, we describe
the estimation approach used to evaluate the data.
4.1 Estimating Equations
Lemma 2 indicates that firms facing imitation risk are selective in deciding whether to
develop a given idea i into a product. This selection favors shorter-lived ideas, implying
Tij is, on average, shorter among patents owned by firms. Conversely, if the owning firm
is primarily operating in markets for which patents are well-protected, the strength of this
selection motive is decreased. To assess these predicted correlations, we use the full set of
U.S.-owned patents for which we observe the ownership type as well as the location of the
owner, and evaluate the following specification
Tij = αFirmi + β IPRn + ηj + ηt + ηc + εij (5)
where Tij is the measured durability of idea i, Firmi indicates whether i is owned or partially-
owned by a U.S. firm, and IPRn captures the intellectual property rights for the country n
the owner of i in 1975, just prior to the first patent observation in 1976. Equation (5)
includes industry fixed effects corresponding to the three-digit technology class j of patent
i, its grant year t, and the number of subsequent citations i receives within five years of t.
Finding that α < 0 and β > 0 would be in line with the selection described by Lemma 2.
Our specification for Result 3 builds on that above, but relies on additional sources of
variation and is evaluated on a narrower sample of U.S. patents. In particular, Result 3
states that firms’ selectivity across ideas i relaxes as patent laws are strengthened, implying
firms’ average Tij increases in patent laws to an extent that is non-monotonic in industries’
Tj, the mean of the underlying distribution of industry-j ideas. To align our estimates with
the prediction, our evaluation restricts attention to the set of patents owned by a U.S. firm
and a foreign co-inventor, and is based on following equation
Tij = β1 IPRnt × Tj + β2 IPRnt × T 2j + ηj + ηnt + ηc +Xnjt + εij (6)
27If there are multiple foreign inventors on a patent with a U.S. co-owner, which occurs in a small minorityof cases, we include separate observations for each patent-country pair rather than to take a stand on howto weight the institutional quality across the various countries involved.
16

where IPRnt corresponds to the foreign country n of a patent-i co-owner in i’s grant year t,
Tj is the time-invariant technology durability index in i’s industry j, ηnt is a country-grant
year fixed effect, and all other variables are as in (5) above. The strong non-monotonicity
prediction of Result 3 would be consistent with β1 > 0, β2 < 0, a positive marginal effect
β1 + β2Tj for all observed Tj, and a peak effect T p = −β1/2β2 falling within the range
of industry-level idea durabilities Tj observed in the data. An important advantage of (6)
relative to (5) is our ability to separately identify the influence of patent laws from unobserved
country characteristics, such as general levels of economic development, that may evolve as
a country strengthens its patent institutions. To address the further possibility that such
characteristics interact with Tj, for example through changes in demand conditions, we
extend (6) by adding interactions between GDP per capita and Tj.
Results 2, 3, and 4 are symmetric, distinguished only by the outcome variable: Results
2 and 4 are predictions for the innovation investment of a Northern firm facing imitation risk
abroad, and are therefore evaluating using data on U.S.-based multinational firms’ foreign
affiliate operations. In particular, we consider the specification
Rint = β1 IPRnt × Tj + β2 IPRnt × T 2j + ηj + ηnt + ηi +Xnjt +Xit + εint, (7)
resembling (6), but in which Rint measures the innovation investment for the country-n
affiliate of firm i in year t. Because a firm i is observed for multiple time periods, the
equation includes firm i fixed effects as well as Xit, the R&D spending and sales revenues of
the firm-i U.S. parent at t. All other variables are as defined above. Finding that β1 > 0,
β2 < 0 would again be consistent with Results 2 and 4, as would a peak implied effect
T p = −β1/2β2 falling within the range of industry-level durabilities Tj observed in the data.
In addition, Result 4 suggests that these effects should be observed only among the Southern
affiliates of Northern firms with πSNij < πSS—that is, Northern firms with a clear innovation
cost disadvantage in the North. To assess this, each firm i is categorized according to the
observed R&D user cost corresponding to the U.S. parent state and year, from Wilson (2009),
and the specification above is then reevaluated separately for firms with high or low U.S.
innovation costs.
4.2 Identification
In (6) and (7), identification of the main coefficients of interest β1 and β2 is based on within-
‘country-year’ variation across industries in the underlying rate of technology obsolescence.
An important advantage of this empirical approach is that it helps mitigate the challenge
posed by policy changes that are concurrent to patent reforms. Improvements to intellec-
tual property rights often occur alongside more general institutional or economic reforms—
17

reforms that also influence the location of multinational activity.28 Countries joining the
WTO, for example, not only align patent protection with the standards in TRIPS, but also
make substantial changes to domestic policies, including trade and investment barriers. Be-
cause such factors affect multinationals’ innovation decisions, the coefficients resulting from
a simple regression of Rint or Tij on IPRit would lack a clear interpretation, as in Bilir
(2014); it is therefore empirically challenging to evaluate Result 1 directly.
By contrast, through the model developed in section 2 above, the coefficients β1 and
β2 have a clear interpretation (Results 2, 3, and 4). This is because variation in the average
lifetime Tj of an underlying industry-j technology indexes variation in the measure of avail-
able ideas that are just above the innovation threshold T (ξS) and thereby affected by a small
increase in ξS. Multinationals’ innovation sensitivity with respect to formal patent laws is
thus captured by Tj, while firms’ sensitivity to general institutions and development levels is
theoretically independent of Tj. Using cross-industry variation in Tj, we are therefore able
to estimate the effect of patent laws on firms’ innovation decisions separately from the effects
of general institutions and development, even for cases in which all change simultaneously.
5 Main Results
5.1 Patent Ownership and Origin
We begin by evaluating the predicted correlation of Lemma 2 that, all else equal, tech-
nologies developed into products are on average shorter-lived than technologies that remain
undeveloped—particularly if the firms responsible for product development face imitation
risk in the destination market. This prediction is assessed using (5) and relying on the
observed distinction between U.S. firm-owned patents and U.S.-owned non-firm patents, as
argued above. Resulting correlations for U.S.-owned patents granted during 1976–2001 ap-
pear in Table 2, and are aligned with Lemma 2: it is apparent that Tij is on average shorter
for patents owned by U.S. firms relative to U.S.-owned patents granted to non-firms, re-
gardless of whether or not controls for the industry, grant year, and quality of patent i are
included. In particular, the coefficient α is negative and highly significant across all columns,
indicating U.S. firm-owned technologies are approximately 2.2 percent shorter lived relative
to technologies introduced by the U.S. government, U.S. universities, and so on (column 8).
The estimated correlations in Table 2 further suggest that, among U.S. patents, those
owned by a U.S. inventor or co-owned by both U.S. and foreign inventors have lifetimes that
28The literature has documented substantial correlations between patent laws and general institutions,including economic development and market openness (Acemoglu, Johnson, and Robinson 2005), legal origin(Lerner 2009), and economic growth (Evenson 1990). The data used in this analysis reveal a persistentcorrelation across countries between GDP per capita and the IPR index of between 60 and 70 percent.
18
increase systematically in the strength of intellectual property rights in the inventor country,
on average. Although only a small minority of patents are co-owned by both U.S. and foreign
inventors, the coefficient β in Table 2 is positive and precisely estimated, indicating that a
patent owned by a U.S. inventor (highest patent index, IPRUS,1975 = 3.83) is approximately
12 percent longer lived than a patent co-owned by U.S. and Venezuelan inventors (lowest
patent index, IPRV en,1975 = 0.92) (column 8).
5.2 Technology Obsolescence in U.S. Firms
Estimates of (6) appear in Table 3, and correspond to the predictions of Results 1 and
3 that patent reforms encourage firms to pursue longer-lived varieties, increasing (non-
monotonically) the realized length of product lifecycles depending on industries’ rates of
underlying technological change. The key coefficients β1 and β2 are on the interactions
between patent rights IPR and industry-average technology durability Tj in columns 3–6.
Patents included as observations in Table 3 are those jointly owned by a U.S. firm and at
least one foreign co-inventor, and the industry-level index Tj is measured based either on
all U.S. patents (Panel A) or on only U.S.-owned non-firm patents (Panel B). In Panel B,
patents included as observations are thus excluded from the Tj index.
In line with Result 3, the estimated coefficient β1 on the linear interaction IPR× T is
positive, while the estimated β2 on the quadratic interaction IPR × T 2 is negative. These
coefficients imply a concave curve indicating initially increasing sensitivity to patent laws as
Tj rises, then reaching a peak and subsequently decreasing in Tj. The magnitudes indicate
a peak effect in the industry with Tj = 2.23, just below the average, and in line with
the theory, the marginal effect β1 + β2Tj is positive for the full range of observed Tj values.
Recall that non-monotonicity arises in the model because industries with Tj near the product
development threshold T (ξS) have the highest density of ideas that are marginal with respect
to an increase in ξS. As the average lifetime of an idea diverges from the threshold T (ξS),
toward either shorter- or longer-lived ideas, a declining measure of ideas responds.
Columns 1 and 2 consider the simple correlation between the durability of patented
idea i and patent rights in the inventor origin country. The estimated coefficient on the
patent rights index is positive in both columns, in line with Result 1, but unsurprisingly,
is not precisely estimated; as in Bilir (2014), this reveals the potential limitations of an
identification strategy that relies only on within-country time-series variation in patent laws.
All specifications include industry fixed effects that capture relevant sectoral differences
in R&D intensity and competitiveness, as well as the industry-average durability of available
ideas Tj. Columns 1 and 2 further include country and year fixed effects and time-varying
country GDP per capita, to control for levels of economic development that may change
concurrently with patent laws. Columns 3–6 replace these with a set of country-year fixed
19

effects, which capture not only the patent index and GDP per capita, but any other country
characteristic that is dynamic and that impacts innovation. Because countries could differ in
demand or inputs necessary for production in sector j, columns 4 and 6 include interactions
between GDP per capita and Tj. Finally, to control for patent quality, even-numbered
columns include the number of citations received within five years of the grant date.
5.3 Innovation in U.S. Firm Affiliates Abroad
A limitation to interpreting the patent-level results above is that not all innovation is
patented, leaving unobserved a potentially important component of firms’ innovation re-
sponse to intellectual property reforms. Indeed, secrecy and other mechanisms have been
established as important methods of protecting intellectual property, particularly where
patents are imperfect (e.g. Cohen et al 2000), and the decision to increase the durabil-
ity of targeted innovations could potentially manifest itself as a response independent of
patenting. To permit a broader interpretation of the results above, we therefore consider the
innovation response in U.S. firms’ manufacturing affiliates abroad.
For this, it must be recognized that the model features an industry in which all firms
and affiliates are accounted for. In the data, however, only relatively large affiliates report
R&D investment, implying truncation at the industry level as well as at the multinational
firm level.29 At these aggregate levels, it is difficult to translate Results 2 and 4 into clear
empirical analogs; at the affiliate level, however, this is possible in certain cases. In particular,
if multinationals are multiproduct firms, then the model predicts that the firm adds new
products—relatively durable ones—to the portfolio of its country-n manufacturing affiliate
following a patent reform in n. Adding a product requires funding the stream of R&D
investment at cost c per period, which is performed by the affiliate with probability pS.
Thus, one way to interpret Result 4 is that the affiliate-level R&D propensity should increase
in local patent rights, again non-montonically as a function of Tj. Notice that this is not
because imitation is facilitated by affiliate R&D investment, which therefore responds to a
change in imitation costs—instead, it is because patent reforms prompt increased innovation
and the entry of longer-lived products.
The estimates in Tables 4 and 5 evaluate whether this interpretation of Result 4 is
consistent with the data. Although some variation in Tj is lost in the match from patents to
firms’ SIC industry codes—going from 472 unique classes, to roughly 30 SIC industries—the
results in Table 4 are nevertheless revealing. The propensity for an affiliate to perform R&D
is indeed increasing in patent rights, and non-monotonically so, according to Tj. And, even
though the index is aggregated relative to that in Tables 2 and 3, the peak effect implied
29In 2009, for example, only affiliates with above $80 million in sales, assets, or net income are requiredto report R&D investment.
20

by the estimates in Table 4 is still around the industry with the average Tj, similar to the
patent-level results above.
All columns in Table 4 include industry fixed effects and either country and year effects
(column 1), or country-year fixed effects (column 2–6). To control for potential differences
across firms in scale, productivity, and R&D intensity, all columns include firm-specific U.S.
parent R&D investment and sales. Firm fixed effects (column 6) capture any other firm
characteristics relevant to the affiliate innovation decision (e.g. the number of products).
U.S. Parent Innovation Costs
Result 4 suggests that the affiliate-level innovation response in Table 4 should be rel-
atively pronounced among firms for whom it is relatively profitable to source innovation in
the South. One way to identify such firms is to consider differences across U.S. headquarters
locations in the generosity of innovation subsidies such as state-level R&D tax credits. To
evaluate this, Table 5 takes a split-sample approach, categorizing multinationals’ U.S. head-
quarters innovation costs as either high or low using observed variation in firms’ U.S. user
cost of R&D. The measured user cost of R&D for all state-year pairs during 1963–2006 is
from Wilson (2009); the measure reflects primarily changes in state-level R&D tax credits,
but also accounts for corporate tax rates and capital rates of return. We simply categorize
a U.S. parent as a high-cost innovator (for which πSNi likely falls below πS) if its U.S. user
cost of R&D falls above the median value.
The split-sample results are in Table 5: estimates for U.S. parents with low U.S. R&D
costs are in columns 1–3, and those for high-cost parents are in columns 4–6. It is apparent
across these six columns that regardless of whether GDP per capita × T interactions and
firm fixed effects are included, there is a strong response among high-cost U.S. parents, while
among low-cost parents the affiliate response is statistically indistinguishable from zero.
This is consistent with the idea that, in multinational firms sourcing product innovation
at the U.S. headquarters for cost reasons, offshore affiliates do not increase innovation in
response to a local patent reform. It is instead firms facing high U.S. innovation costs
for which R&D sourcing decisions are sensitive to the reform. These results highlight an
important interaction between home and host country institutions that, in this case, shape
the innovation response to patent reforms.30
30Bilir and Morales (2016) relies on this source of variation to identify the impact of U.S. firms’ foreignaffiliate R&D on subsequent firm performance.
21

6 Robustness
We perform a series of additional specifications aimed at evaluating the stability of the
results. First, we replicate the results using alternative indexes of industry and patent level
technology obsolescence rates. We find nearly identical results using the 75th percentile of
patent citations instead of our main measures of Tij and Tj in Table 6. This ensures that
our industry-level index of idea obsolescence is not driven by unsuccessful innovations that
receive few citations, and also helps ensure that variation in the patent-level index reflects
the timing of relatively informative citations that occur later in the product life. Separately,
we use the patent subclass to construct a more detailed Tj index that varies across four-digit
industries in Table 7; although the industry fixed effects we include limit the sample size
under this alternative Tj definition, relative to Table 3, the results are essentially unchanged
in magnitude and remain strongly significant.
The results above indicate that affiliate innovation spending is more sensitive to local
patent laws when U.S. parent innovation costs are relatively high. That affiliates’ innovation
is sensitive only in this case strongly suggests that U.S. parent innovation can serve as a
substitute for affiliate innovation. While this is in line with Bilir and Morales (2016), which
finds that both parent and affiliate innovation investment contribute to growth in affiliate
performance, it raises the question of how knowledge resulting from R&D investment is
transferred across borders from parent to affiliate. To shed light on potential transfer mech-
anisms, Table 8 replicates Table 5 using observed intrafirm import propensity by an affiliate
from its corresponding U.S. parent. The results indicate strong sensitivity in affiliate import
propensity with respect to patent laws in the host country, but primarily among multina-
tionals with low U.S. innovation costs—firms likely to source innovation at the U.S. parent
rather than offshore. By contrast, affiliate imports from the U.S. parent are unresponsive in
multinational firms facing high headquarters innovation costs. Consistent with Keller and
Yeaple (2013), these results support the idea that tangible intrafirm trade is one channel
through which innovation output is shared within firm boundaries.
7 Discussion
This paper provides evidence that offshore patent laws influence global firms’ innovation
decisions. Within a simple global production model, we find that a novel consequence of
imitation risk is that firms innovate selectively, directing investments in product develop-
ment toward relatively short-lived varieties that are difficult to imitate prior to obsolescence.
A key implication of firms’ selective product development is that patent reforms tend to
increase not only firms’ overall innovation, but also the average economic lifetime of the
22

products they develop—both to extents varying non-monotonically across industries accord-
ing to underlying rates of technological change. Using detailed data on U.S. patent grants
and citations during 1976–2006 and U.S. multinational firms’ affiliate innovation investment
during 1982–2009, we find robust evidence consistent with these hypotheses.
Our results speak to an ongoing debate regarding the relationship between competition
and the rate of innovation. While strong patent rights can encourage innovation (Schumpeter
1942), the incentive to escape competition can also be an important motive (e.g. Qian 2008,
Aghion et al 2005); indeed, the reward to certain forms of innovation may be lower for an
incumbent monopolist than for a competitive firm (Arrow 1962), suggesting stronger patent
rights could reduce innovation. Our results suggest offshore patent reforms do increase inno-
vation, but also encourage reductions in the rate of product turnover (‘slower’ innovation),
and are thus—to a certain extent—consistent with all of these views.31
The selective innovation mechanism we emphasize is conceptually related to Melitz
(2003), but our model emphasizes a specific microfoundation for productivity. In our model,
products share identical productivities ex ante but differ ex post due to imitation that, while
random in incidence, nevertheless impacts the lifetime profitability of a variety to an ex-
tent that increases, on average, in the length of its economic life. Imitation thus induces
forward-looking firms to innovate selectively—and patent reforms lessen this selectivity. In
considering imitation and intellectual property rights as factors shaping firms’ productivity,
our model yields an important and distinct set of policy implications, as imitation effectively
transfers surplus away from foreign multinationals and toward local consumers by reduc-
ing prices. A global economy dominated by large, technology-intensive multinational firms
may thus be one in which intellectual property enforcement serves as an influential border
instrument that countries may exercise strategically alongside traditional tariff policies.
Given this, however, it is important to recognize that the enforcement of intellectual
property rights permits considerable local discretion across firms and technologies. If patent
infringement litigation is resolved based on the opinion of local judges and juries, it may also
be subject to local bias, thereby facilitating implicit protectionism (e.g. Love, Helmers, and
Eberhardt 2016). This essential concern forms the basis for major international intellectual
property treaties including the Paris Convention of 1883 and the more recent 1995 TRIPS
agreement (Bilir, Moser, and Talis 2012), but it is unclear that these agreements are suffi-
cient, as countries including the United States are seeking substantially deeper integration in
current regional trade agreement negotiations (U.S. Chamber of Commerce 2013). In light
of these observations, understanding the strategic importance of intellectual property policy
in the modern global economy is an important area for future work.
31See also Shapiro (2012).
23

REFERENCES
[1] Acemoglu, Daron, Simon Johnson, and James A. Robinson. 2005. “Institutions as aFundamental Cause of Long-Run Growth.” In Handbook of Economic Growth, vol. 1A, editedby Philippe Aghion and Steven Durlauf, 385–472. Amsterdam: Elsevier.
[2] Aghion, Philippe, Nick Bloom, Richard Blundell, Rachel Griffith and Peter Howitt.2005. “Competition And Innovation: An Inverted-U Relationship.” Quarterly Journal of Eco-nomics, vol. 120, no. 2, pp. 701–728
[3] Aghion, Philippe, and Peter Howitt. 1992. “A Model of Growth Through Creative De-struction.” Econometrica, vol. 60, no. 2, pp. 323–351.
[4] Antras, Pol. 2003. “Firms, Contracts, and Trade Structure.” Quarterly Journal of Economics,vol. 118, no. 4, pp. 1375–1418.
[5] Antras, Pol, Mihir A. Desai, and Fritz Foley. 2009. “Multinational Firms, FDI Flows,and Imperfect Capital Markets.” Quarterly Journal of Economics, vol. 124, no. 3, pp. 1171–1219.
[6] Antras, Pol, and Elhanan Helpman. 2004. “Global Sourcing.” Journal of Political Econ-omy, vol. 112, no. 3, pp. 552–580.
[7] Apple Inc. 2014. Securities and Exchange Commission 10-K Report.
[8] Arrow, Kenneth J. 1962. “Economic Welfare and the Allocation of Resources for Invention,”in The Rate and Direction of Inventive Activity: Economic and Social Factors, National Bureauof Economic Research.
[9] Bernard, Andrew B., J. Bradford Jensen, Stephen J. Redding, and Peter K. Schott.2010. “Intra-Firm Trade and Product Contractibility.” American Economic Review Papers andProceedings, vol. 100, pp. 444–448.
[10] Bilir, L. Kamran. 2014. “Patent Laws, Product Lifecycle Lengths, and Multinational Ac-tivity.” American Economic Review, vol. 104, no. 7, pp. 1979–2013.
[11] Bilir, L. Kamran, and Eduardo Morales. 2016. “Innovation in the Global Firm.” Prince-ton University mimeo.
[12] Bilir, L. Kamran, Petra Moser, and Irina Talis. 2012. “Do Patent Treaties EncourageTechnology Transfer? Evidence from the U.S. Accession to the Paris Convention in 1887.”mimeo.
[13] Branstetter, Lee G., Raymond Fisman, and C. Fritz Foley. 2006. “Do Stronger Intel-lectual Property Rights Increase International Technology Transfer? Empirical Evidence fromU.S. Firm-level Panel Data.” Quarterly Journal of Economics, vol. 121, no. 1, pp. 321–349.
[14] Broda, Christian, and David E. Weinstein. 2010. “Product Creation and Destruction:Evidence and Price Implications.” American Economic Review, vol. 100, no. 3, pp. 691–723.
[15] Cohen, Wesley M., Richard R. Nelson, and John P. Walsh. 2000. “Protecting TheirIntellectual Assets: Appropriability Conditions and Why U.S. Manufacturing Firms Patent (OrNot).” National Bureau of Economic Research Working Paper 7552.
24
[16] Davidson, W.H. and D. G. McFetridge. 1985. “Key Characteristics in the Choice ofInternational Technology Transfer Mode.” Journal of Industrial Economics 16 (2): 5–21.
[17] Evenson, Robert E. 1990. “Survey of Empirical Studies.” In Strengthening Protection ofIntellectual Property in Developing Countries, World Bank discussion paper 112, edited by Wolf-gang E. Siebeck, 33–46.
[18] Ginarte, Juan C., and Walter G. Park. 1997. “Determinants of Patent Rights: A Cross-National Study.” Research Policy, vol. 26, no. 3, pp. 283–301.
[19] Glass, Amy Jocelyn, and Kamal Saggi. 2002. “Licensing versus Direct Investment: Im-plications for Economic Growth.” Journal of International Economics, vol. 56, no. 1, pp. 131–53.
[20] Grossman, Gene M., and Edwin L. C. Lai. 2004. “International Protection of IntellectualProperty.” American Economic Review, vol. 94, no. 5, pp. 1635–1653.
[21] Grossman, Gene M., and Elhanan Helpman. 1991. “Quality Ladders and Product Cy-cles.” Quarterly Journal of Economics, vol. 106, no. 2, pp. 557–586.
[22] Hall, Bronwyn H., Adam B. Jaffe, and Manuel Trajtenberg. 2001. “The NBER PatentCitations Data File: Lessons, Insights and Methodological Tools.” National Bureau of EconomicResearch Working Paper 8498.
[23] Hewlett-Packard Company. 2014. Securities and Exchange Commission 10-K Report.
[24] Heston, Alan, Robert Summers, and Bettina Aten. 2009. Penn World Table Version6.3, Center for International Comparisons of Production, Income and Prices at the University ofPennsylvania.
[25] Hines, James R., Jr. 1997. “Tax Policy and the Activities of Multinational Corporations,”in: Auerbach, A.J. (Ed.) Fiscal Policy: Lessons from Economic Research. MIT Press, Cambridge:pp. 401–445.
[26] Intel Corporation. 2014. Securities and Exchange Commission 10-K Report.
[27] Javorcik, Beata Smarzynska. 2004. “The Composition of Foreign Direct Investment andProtection of Intellectual Property Rights: Evidence from Transition Economies.” EuropeanEconomic Review, vol. 48, pp. 39–62.
[28] Keller, Wolfgang, and Stephen R. Yeaple. 2013. “The Gravity of Knowledge.” AmericanEconomic Review, vol. 103, no. 4, pp. 1414–1444.
[29] Lerner, Josh. 2009. “The Empirical Impact of Intellectual Property Rights on Innovation:Puzzles and Clues.” American Economic Review Papers and Proceedings 99: 343–348.
[30] Love, Brian J., Christian Helmers, and Markus Eberhardt. 2016. “Patent Litigationin China: Protecting Rights Or the Local Economy?” Vanderbilt Journal of Entertainment andTechnology Law, vol. 18, pp. 713.
[31] Manova, Kalina, Shang-Jin Wei, and Zhiwei Zhang. 2010. “Firm Exports and Multi-national Activity under Credit Constraints.” National Bureau of Economic Research WorkingPaper 16905.
25

[32] McCalman, Phillip. 2004. “Foreign Direct Investment and Intellectual Property Rights:Evidence from Hollywood’s Global Distribution of Movies and Videos.” Journal of InternationalEconomics, vol. 62, pp. 107–123.
[33] Melitz, Marc J. 2003. “The Impact of Trade on Intra-Industry Reallocations and AggregateIndustry Productivity.” Econometrica, vol. 71, no. 6, pp. 1695–1725.
[34] Narin, Francis, and Dominic Olivastro. 1993. “Patent Citation Cycles.” Library Trends,vol. 41, no. 4, pp. 700–709.
[35] National Science Board. 2014. Science and Engineering Indicators 2014. Arlington, VA:National Science Foundation (NSB 14-01).
[36] Nunn, Nathan, and Daniel Trefler. 2008. “The Boundaries of the Multinational Firm:An Empirical Analysis.” In The Organization of Firms in a Global Economy, edited by ElhananHelpman, Dalia Marin, and Theirry Verdier, 55–83. Cambridge: Harvard University Press.
[37] Pakes, Ariel. 1986. “Patents as Options: Some Estimates of the Value of Holding EuropeanPatent Stocks.” Econometrica, vol. 54, no. 4, pp. 755–784.
[38] Park, Walter G. 2008. “International Patent Protection: 1960–2005.” Research Policy, vol.37, no. 4, pp. 761–766.
[39] Qian, Yi. 2007. “Do National Patent Laws Stimulate Domestic Innovation In A Global Patent-ing Environment?” Review of Economics and Statistics vol. 89, no. 3, pp. 436–453.
[40] Qian, Yi. 2008. “Impacts of Entry by Counterfeiters.” Quarterly Journal of Economics, vol.123, no. 4, pp. 1577–1609.
[41] Schumpeter, Joseph. 1942. Capitalism, Socialism and Democracy. New York: HarperBrothers. (Citations to Harper Perennial Modern Thought Edition, published 2008.)
[42] Shapiro, Carl. 2012. “Competition and Innovation: Did Arrow Hit the Bull’s Eye?” in:Lerner, J. and S. Stern (Eds.) The Rate and Direction of Inventive Activity Revisited. Universityof Chicago Press, Chicago: pp. 361–404.
[43] U.S. Chamber of Commerce. 2013. The Case for Enhanced Protection of Trade Secrets inthe Trans-Pacific Partnership.
[44] Western Digital Corporation. 2014. Securities and Exchange Commission 10-K Report.
[45] Wilson, Daniel J. 2009. “Beggar Thy Neighbor? The In-State, Out-of-State, and AggregateEffects of R&D Tax Credits.” Review of Economics and Statistics, vol. 91, no. 2, pp. 431–436.
[46] Yang, Guifang, and Keith E. Maskus. 2001. “Intellectual Property Rights, Licensing,and Innovation in an Endogenous Product-Cycle Model.” Journal of International Economics,vol. 53, pp. 169–187.
[47] Yeh, Brian T. 2016. “Protection of Trade Secrets: Overview of Current Law and Legislation.”Congressional Research Service Report, no. 7-5700, pp. 1-24.
26

Figure 1: Imitation and Innovation Selection
Notes: This figure describes the determination of the innovation selection cutoff as the product lifecycle length corresponding to the intersection between the product development flow cost c and average expected profits per period, which declines in the length of the product lifecycle because in expectation, a longer-lived variety spends a greater fraction of the lifecycle competing with an imitator and earning reduced profits.

Variable Mean St Dev Min Max
Affiliate-Year Level:Indicator for Positive R&D Investment 0.312 0.463log R&D Investment, Conditional on Positive 6.431 2.009log Sales 10.450 2.097log Number of Employees 4.913 1.614log U.S. Parent Sales 14.950 0.132log U.S. Parent R&D 10.886 3.305U.S. Parent R&D Intensity (R&D/Sales) 0.053 0.411Intellectual Property Rights Index (IPR) 3.695 1.020 0 4.680log GDP per capita 9.851 0.746 5 11.345U.S. Parent R&D User Cost 1.225 0.079 1.043 1.499Industry Average Patent Citation Lag (years) 8.571 0.486 7 11
Patent Level:Average Patent Citation Lag (years), Index ≤ 5 2.355 1.251 -3 5Number of Citations, Forward Lag ≤ 5 years 7.687 11.367 1 296Indicator for U.S. Firm Ownership 0.933 0.249 0 1Indicator for U.S. Firm Ownership with Non-U.S. Inventor 0.004 0.066 0 1
General:Number of Affiliates 14926Number of Firms 1702Number of U.S. Patents 916245
Table 1: Regression Summary Statistics
Notes: This table summarizes the data on U.S. multinational firms and U.S. patents used in the analysis. Firm statistics correspond to U.S. multinational firms and their majority-owned foreign affiliates that are large and thus required to report innovation spending during the period 1982-2009. Patent statistics correspond to U.S. patents assigned to U.S. entities and granted during 1976-2006. The Intellectual Property Rights Index (IPR) is from Ginarte and Park (1997) and Park (2008);; this and GDP per capita, from the Penn World Table, correspond to the affiliate country during year t . The U.S. Parent R&D User Cost is from Wilson (2009) and corresponds to the firm-i U.S. parent location during the year t . The Average Patent Citation lag is measured at the SIC three-digit industry level and is from Bilir (2014). This index is also measured at the patent level;; to maximize the patent sample while minimizing truncation effects, the index is based on citations occuring within either five or ten years after the patent grant date. These measures and the indicators for U.S. firm-owned patents, with either domestic or foreign inventors, are from the NBER Patent Citations Datafile (Hall, Jaffe, and Trajtenberg 2001).

Dependent Variable:
(1) (2) (3) (4) (5) (6) (7) (8)
U.S. Firm-Owned i -0.0535*** -0.0540*** -0.0726*** -0.0727*** -0.0454*** -0.0454*** -0.0519*** -0.0519***0.0056 0.0056 0.0057 0.0057 0.0053 0.0053 0.0053 0.0053
IPR i 0.4098*** 0.3027*** 0.0908*** 0.0904***0.0191 0.0178 0.0152 0.0152
Industry FE N N Y Y Y Y Y YYear FE N N N N Y Y Y YCitations FE N N N N N N Y Y
Observations 916245 916245 916245 916245 916245 916245 916245 916245R2 0.0001 0.0007 0.0533 0.0536 0.2036 0.2036 0.2080 0.2080
Notes: * p < 0.10, ** p < 0.05, *** p < 0.01. This table provides least-squares estimates for (3) and several variants thereof. The dependent variable captures the durabilty of sector-j patent i and is the average forward citation lag across citations occuring within five years of the grant date. The sample includes all patents assigned to U.S. entities. To ensure that citations are observed for a uniform period across patents, the sample includes only patents granted by December 2001. U.S. Firm-Owned indicates that the ultimate owner of the patent is a U.S. corporation;; this variable and all patent information is from the NBER Patent Citation Datafile (Hall, Jaffe, and Trajtenberg 2001). IPR is the Ginarte and Park (1997) and Park (2008) index of intellectual property rights corresponding to the inventor country in 1975. Specifications include industry fixed effects (columns 3-8), grant year fixed effects (columns 5-8), and citation volume fixed effects (columns 7 and 8). Robust standard errors clustered by inventor country appear below each point estimate.
U.S. patents granted 1976—2001, index ≤ 5
Table 2: Patent Laws, Firms, and Technology Obsolescence, U.S. Patents 1976—2006
Technology durability index, patent i in sector j

Dependent Variable:
(1) (2) (3) (4) (5) (6)
Panel A
IPR 0.1254* 0.1296**0.0640 0.0581
IPR x T 2.8517*** 3.6275*** 2.8322*** 3.5610***0.6763 1.1034 0.6921 1.1699
IPR x T2 -0.7008*** -0.9380*** -0.6945*** -0.9199***0.1740 0.2914 0.1823 0.3142
R2 0.5514 0.5583 0.5825 0.5828 0.5894 0.5897
Panel B
IPR x T 3.8471*** 3.4253** 3.8492*** 3.3477**0.9659 1.5318 0.9761 1.5604
IPR x T2 -0.8652*** -0.7934* -0.8629*** -0.7737*0.2435 0.3819 0.2507 0.3965
R2 0.5828 0.5832 0.5898 0.5902
Industry FE Y Y Y Y Y Ylog GDP per capita Y Y N N N NCountry FE, Year FE Y Y N N N NCountry-Year FE N N Y Y Y Ylog GDP per capita x T, T2 N N N Y N YCitations FE N Y N N Y Y
Observations 2921 2921 2921 2921 2921 2921
Table 3: Technology Obsolescence in U.S. Firms, Reponse to Patent Laws Abroad, 1976—2001
Industry Tj measured using all U.S. patents
Industry Tj measured using U.S.-owned non-firm patents
Technology durability index, patent i in sector j
Notes: * p < 0.10, ** p < 0.05, *** p < 0.01. This table provides least-squares estimates for (4) and several variants thereof. The dependent variable captures the durabilty of sector-j patent i and is the average forward citation lag across citations occuring within five years of the patent-i grant date. The sample includes all patents owned by U.S. firms and at least one foreign inventor;; for the minority of such patents with multiple foreign inventors, the sample includes a separate entry per patent-country pair. Because the dependent variable Ti is sensitive at low citation volumes, the sample excludes the approximately 25 percent of patents receiving three or fewer citations. IPR is the Ginarte and Park (1997) and Park (2008) index of intellectual property rights corresponding to the inventor country in the patent-i grant year;; GDP per capita is from the Penn World Table. T is the time-invariant average patent citation lag in sector j across all U.S. patents assigned to that sector;; both this and the dependent variable are measured using information from the NBER Patent Citation Datafile (Hall, Jaffe, and Trajtenberg 2001). All specifications include industry fixed effects, country and year (columns 1 and 2) or country-year fixed effects (columns 3-6), and patent citation volume fixed effects (columns 7 and 8). Robust standard errors clustered by inventor country appear below each point estimate.
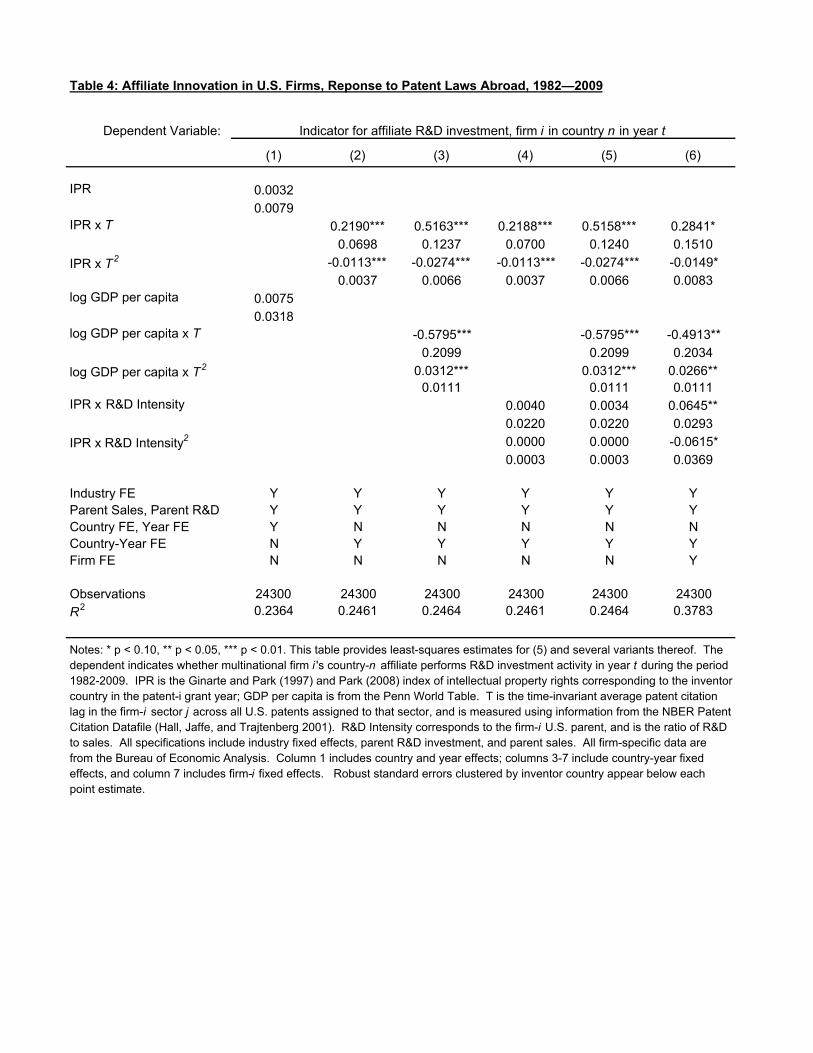
Dependent Variable:
(1) (2) (3) (4) (5) (6)
IPR 0.00320.0079
IPR x T 0.2190*** 0.5163*** 0.2188*** 0.5158*** 0.2841*0.0698 0.1237 0.0700 0.1240 0.1510
IPR x T2 -0.0113*** -0.0274*** -0.0113*** -0.0274*** -0.0149*0.0037 0.0066 0.0037 0.0066 0.0083
log GDP per capita 0.00750.0318
log GDP per capita x T -0.5795*** -0.5795*** -0.4913**0.2099 0.2099 0.2034
log GDP per capita x T2 0.0312*** 0.0312*** 0.0266**0.0111 0.0111 0.0111
IPR x R&D Intensity 0.0040 0.0034 0.0645**0.0220 0.0220 0.0293
IPR x R&D Intensity2 0.0000 0.0000 -0.0615*0.0003 0.0003 0.0369
Industry FE Y Y Y Y Y YParent Sales, Parent R&D Y Y Y Y Y YCountry FE, Year FE Y N N N N NCountry-Year FE N Y Y Y Y YFirm FE N N N N N Y
Observations 24300 24300 24300 24300 24300 24300R2 0.2364 0.2461 0.2464 0.2461 0.2464 0.3783
Table 4: Affiliate Innovation in U.S. Firms, Reponse to Patent Laws Abroad, 1982—2009
Indicator for affiliate R&D investment, firm i in country n in year t
Notes: * p < 0.10, ** p < 0.05, *** p < 0.01. This table provides least-squares estimates for (5) and several variants thereof. The dependent indicates whether multinational firm i 's country-n affiliate performs R&D investment activity in year t during the period 1982-2009. IPR is the Ginarte and Park (1997) and Park (2008) index of intellectual property rights corresponding to the inventor country in the patent-i grant year;; GDP per capita is from the Penn World Table. T is the time-invariant average patent citation lag in the firm-i sector j across all U.S. patents assigned to that sector, and is measured using information from the NBER Patent Citation Datafile (Hall, Jaffe, and Trajtenberg 2001). R&D Intensity corresponds to the firm-i U.S. parent, and is the ratio of R&D to sales. All specifications include industry fixed effects, parent R&D investment, and parent sales. All firm-specific data are from the Bureau of Economic Analysis. Column 1 includes country and year effects;; columns 3-7 include country-year fixed effects, and column 7 includes firm-i fixed effects. Robust standard errors clustered by inventor country appear below each point estimate.

Dependent Variable:
(1) (2) (3) (4) (5) (6)
IPR x T -0.0440 0.1416 0.0494 0.4468*** 0.9675*** 0.6599**0.1380 0.2936 0.2681 0.1088 0.1849 0.2694
IPR x T2 0.0027 -0.0073 -0.2717 -0.0236*** -0.0524*** -0.0354**0.0072 0.0155 0.2806 0.0059 0.0101 0.0152
log GDP per capita x T -0.2573 -0.5795 -1.1271*** -1.1068**0.4008 0.2099 0.3211 0.4450
log GDP per capita x T2 0.0139 0.0148 0.0619*** 0.0611**0.0209 0.0152 0.0175 0.0250
Industry FE Y Y N Y Y NParent Sales, Parent R&D Y Y Y Y Y YCountry-Year FE Y Y Y Y Y YFirm FE N N Y N N Y
Observations 12386 12386 12386 11464 11464 11464R2 0.1216 0.1217 0.2881 0.3678 0.3688 0.5124
Notes: * p < 0.10, ** p < 0.05, *** p < 0.01. This table provides least-squares estimates for a variant of (5) that permits differences across firms i in the cost of U.S. parent innovation relative to affiliate innovation. The dependent indicates whether multinational firm i 's country-n affiliate performs R&D investment activity in year t during the period 1982-2009. Each affiliate is categorized as having either low (columns 1-3) or high (columsn 4-6) U.S. parent R&D costs based on the user cost of R&D reported in Wilson (2009). IPR is the Ginarte and Park (1997) and Park (2008) index of intellectual property rights corresponding to the inventor country in the patent-i grant year;; GDP per capita is from the Penn World Table. T is the time-invariant average patent citation lag in the firm-i sector j across all U.S. patents assigned to that sector, and is measured using information from the NBER Patent Citation Datafile (Hall, Jaffe, and Trajtenberg 2001). All firm-specific data are from the Bureau of Economic Analysis. Specifications include industry fixed effects (columns 1-2, 4-5) or firm-i fixed effects (columns 3 and 6), as well as parent R&D investment, parent sales, and country-year fixed effects (all columns). Robust standard errors clustered by affiliate country appear below each point estimate.
Table 5: Affiliate Innovation in U.S. Firms, Heterogeneous Reponse to Patent Laws Abroad, 1982—2009
Indicator for affiliate R&D investment, firm i in country n in year t
Low U.S. R&D Cost High U.S. R&D Cost

Dependent Variable:
(1) (2) (3) (4) (5) (6)
Panel A
IPR 0.1948** 0.2001***0.0720 0.0647
IPR x T 5.3462*** 5.7131*** 5.2282*** 5.8786***1.0501 1.6596 1.0395 1.7439
IPR x T2 -0.8727*** -0.9539*** -0.8575*** -0.9908***0.206 0.3117 0.1999 0.3209
R2 0.4983 0.5135 0.5313 0.5314 0.5459 0.546
Panel B
IPR x T 5.6557*** 3.9793** 5.1254*** 3.7973**1.6344 1.7574 1.556 1.6817
IPR x T2 -0.8474** -0.5608* -0.7588** -0.5342*0.2989 0.3164 0.2843 0.3011
R2 0.5311 0.5313 0.5458 0.5459
Industry FE Y Y Y Y Y Ylog GDP per capita Y Y N N N NCountry FE, Year FE Y Y N N N NCountry-Year FE N N Y Y Y Ylog GDP per capita x T, T2 N N Y Y Y YCitations FE N Y N N Y Y
Observations 2921 2921 2921 2921 2921 2921
Table 6: Patent Laws and Technology Obsolescence in U.S. Firms, 75th-Percentile Citation Lag, 1976—2001
Technology durability index, patent i in sector j
Industry Tj measured using all U.S. patents
Industry Tj measured using U.S.-owned non-firm patents
Notes: * p < 0.10, ** p < 0.05, *** p < 0.01. This table provides least-squares estimates for (4) and several variants thereof. The dependent variable captures the durabilty of sector-j patent i and is the average forward citation lag across citations occuring within five years of the patent-i grant date. The sample includes all patents owned by U.S. firms and at least one foreign inventor;; for the minority of such patents with multiple foreign inventors, the sample includes a separate entry per patent-country pair. Because the dependent variable Ti is sensitive at low citation volumes, the sample excludes the approximately 25 percent of patents receiving three or fewer citations. IPR is the Ginarte and Park (1997) and Park (2008) index of intellectual property rights corresponding to the inventor country in the patent-i grant year;; GDP per capita is from the Penn World Table. T is the time-invariant average patent citation lag in sector j across all U.S. patents assigned to that sector;; both this and the dependent variable are measured using information from the NBER Patent Citation Datafile (Hall, Jaffe, and Trajtenberg 2001). All specifications include industry fixed effects, country and year (columns 1 and 2) or country-year fixed effects (columns 3-6), and patent citation volume fixed effects (columns 7 and 8). Robust standard errors clustered by inventor country appear below each point estimate.

Dependent Variable:
(1) (2) (3) (4) (5) (6)
Panel A
IPR 0.2323*** 0.2424***0.0709 0.0676
IPR x T 2.6635** 3.6343** 2.5540** 3.4388**1.1653 1.4294 1.1305 1.4568
IPR x T2 -0.6162* -0.9030** -0.5811* -0.8452**0.3037 0.3701 0.2963 0.381
R2 0.6379 0.6468 0.6697 0.6700 0.6792 0.6794
Panel B
IPR x T 4.0442*** 4.2121*** 3.8764*** 3.9154**1.1116 1.3449 1.0425 1.4168
IPR x T2 -0.8223*** -0.8635** -0.7787*** -0.7882**0.2798 0.3502 0.2617 0.364
R2 0.6698 0.6698 0.6785 0.6785
Industry FE Y Y Y Y Y Ylog GDP per capita Y Y N N N NCountry FE, Year FE Y Y N N N NCountry-Year FE N N Y Y Y Ylog GDP per capita x T, T2 N N Y Y Y YCitations FE N Y N N Y Y
Observations 2361 2361 2361 2361 2361 2361
Table 7: Patent Laws and Technology Obsolescence in U.S. Firms, Disaggregated Industries, 1976—2001
Technology durability index, patent i in sector j
Industry Tj measured using all U.S. patents
Industry Tj measured using U.S.-owned non-firm patents
Notes: * p < 0.10, ** p < 0.05, *** p < 0.01. This table provides least-squares estimates for (4) and several variants thereof. The dependent variable captures the durabilty of sector-j patent i and is the average forward citation lag across citations occuring within five years of the patent-i grant date. The sample includes all patents owned by U.S. firms and at least one foreign inventor;; for the minority of such patents with multiple foreign inventors, the sample includes a separate entry per patent-country pair. Because the dependent variable Ti is sensitive at low citation volumes, the sample excludes the approximately 25 percent of patents receiving three or fewer citations. IPR is the Ginarte and Park (1997) and Park (2008) index of intellectual property rights corresponding to the inventor country in the patent-i grant year;; GDP per capita is from the Penn World Table. T is the time-invariant average patent citation lag in sector j across all U.S. patents assigned to that sector;; both this and the dependent variable are measured using information from the NBER Patent Citation Datafile (Hall, Jaffe, and Trajtenberg 2001). All specifications include industry fixed effects, country and year (columns 1 and 2) or country-year fixed effects (columns 3-6), and patent citation volume fixed effects (columns 7 and 8). Robust standard errors clustered by inventor country appear below each point estimate.

Dependent Variable:
(1) (2) (3) (4)
IPR x T 0.6985** 0.7312** -0.4093* 0.03130.2926 0.2981 0.2143 0.2480
IPR x T2 -0.0374** -0.0394** 0.0240* -0.0010.0159 0.0163 0.0120 0.0140
log GDP per capita x T -0.6209** -0.8717*** 1.2135*** 0.33410.2879 0.2879 0.3733 0.4117
log GDP per capita x T2 0.0314** 0.0457*** -0.0690*** -0.01950.0156 0.0157 0.0209 0.0232
Industry FE Y N Y NParent Sales, Parent R&D Y Y Y YCountry-Year FE Y Y Y YFirm FE N Y N Y
Observations 10976 10976 14014 14014R2 0.3805 0.4893 0.2519 0.4080
Table 8: Affiliate Imports from U.S. Parent, Patent Laws, 1982—2009
Indicator for affiliate imports from U.S. parent, firm i in country n in year t
Notes: * p < 0.10, ** p < 0.05, *** p < 0.01. This table provides least-squares estimates for a variant of (5) that permits differences across firms i in the cost of U.S. parent innovation relative to affiliate innovation. The dependent indicates whether multinational firm i 's country-n affiliate imports from its U.S. parent in year t during the period 1982-2009. Each affiliate is categorized as having either low (columns 1-3) or high (columsn 4-6) U.S. parent R&D costs based on the user cost of R&D reported in Wilson (2009). IPR is the Ginarte and Park (1997) and Park (2008) index of intellectual property rights corresponding to the inventor country in the patent-i grant year;; GDP per capita is from the Penn World Table. T is the time-invariant average patent citation lag in the firm-i sector j across all U.S. patents assigned to that sector, and is measured using information from the NBER Patent Citation Datafile (Hall, Jaffe, and Trajtenberg 2001). All firm-specific data are from the Bureau of Economic Analysis. Specifications include industry fixed effects (columns 1-2, 4-5) or firm-i fixed effects (columns 3 and 6), as well as parent R&D investment, parent sales, and country-year fixed effects (all columns). Robust standard errors clustered by affiliate country appear below each point estimate.
Low U.S. R&D Cost High U.S. R&D Cost