patents, price controls and access to new drugs: how
TRANSCRIPT
Patents, Price Controls and Access to New Drugs:
How Policy Affects Global Market Entry1
Jean O. Lanjouw
Agricultural and Resource Economics Department U.C. Berkeley
April 19, 2005
Abstract
We consider how patent rights and price regulation affect whether new drugs are marketed in
a country, and how quickly. The analysis covers a large sample of 68 countries at all income levels
and includes all drug launches over the period 1982-2002. It uses newly compiled information on
legal and regulatory policy, and is the first systematic analysis of the determinants of drug launch in
poor countries. Price control tends to discourage rapid product entry, while the results for patents are
mixed. There is evidence that local capacity to innovate matters and that international pricing
externalities may play a role.
1 This paper was prepared for the Commission on Intellectual Property Rights, Innovation, and Public Health of the World Health Organization. Daniel Egel and Margaret MacLeod, the Brookings Institution, and Rachel Menezes, the Center for Global Development, provided superb research assistance. Early work was done while I was a resident Senior Fellow at those institutions and I appreciate their encouragement. I thank Bronwyn Hall, Peter Lanjouw, Mark Schankerman, John Strauss and Brian Wright for their useful suggestions, as well as seminar participants at U.C. Berkeley, Stanford, Yale, the University of Arizona and the World Bank. The World Bank and the Brookings Institution provided funding for the purchase of data used in this project.

2
I. Introduction
The pharmaceutical industry faces a rapidly evolving legal and regulatory environment.
Governments, drug companies and advocacy groups continue to engage in a decade-long battle over
the type of patent rights that will be available to industry, particularly in poor countries. Particular
criticism has focused on the intellectual property standards required of members of the World Trade
Organization—standards known as Trade-Related aspects of Intellectual Property, or TRIPS, rules.
International drug pricing is also coming under the spotlight. Americans have accused the Europeans
and Canadians of using their price control systems to free-ride on U.S. consumers, and the United
States is starting to push for regulatory changes in bilateral trade negotiations.2 These pressures may
well generate future reforms on a broad scale.
The choices made by each country about its patent system and price regulation will have many
ramifications – influencing the size of future investment in medical research, the availability of the
resulting therapies, how the financial burdens are distributed across countries, and finally the health of
consumers. We focus here on how policy choices affect whether new drugs are marketed in a
country, and how quickly. Because there are fixed costs associated with launching new products, it
would seem intuitive that both weaker price regulation and stronger intellectual property would
facilitate entry by virtue of increasing firm profit.3 However, what makes this an interesting economic
problem is that intellectual property can have a second important effect. While patents indeed make
local markets more attractive, they also convey control over launch decisions to multinational firms
with global interests.4 Multinationals may delay or even avoid launching drugs in lower-priced
countries because they are concerned about the implications for pricing in other markets. If they
hesitate, and patent rights block otherwise willing local entrants, then strong patent rights may actually
reduce product entry.
2 See, for example, the speech by Mark McClellen, then Commissioner of the U.S. FDA, before the First International Colloquium on Generic Medicine. September 25, 2003, Cancun, Mexico. Available at http://www.fda.gov/oc/speeches/2003/genericdrug0925.html (accessed 12/28/03). Most recently, the U.S. insisted that reforms to Australia’s domestic price and reimbursement system be a part of the AUS Free Trade Agreement (see www.aph.gov.au/Senate/committee/freetrade_ctte for details and discussion. Accessed 1/24/05). Suggesting a future agenda, see “Ten Questions,” Pfizer Annual Review 2004: “We believe Americans carry an unfair share of the global cost of biomedical research. We think that’s a serious issue that should be near the top of the global trade agenda.” 3 Local fixed costs include obtaining marketing approval from the country regulatory authority and educating doctors and patient groups about the drug’s benefits. These costs can be sizeable, particularly for the first entrant. 4 While in principle smaller local firms could develop new drugs, in fact multinationals hold almost all product patents. Some 86% of the applications for product patents in India in 1995 were submitted by inventors with a non-Indian address (CDRI, 1996) and in most developing countries the share is far higher. As firms based in developing countries also begin to invest in the development and patenting of new products they will have the same global marketing incentives and constraints faced by the current multinationals.

3
Although the pricing of patented pharmaceuticals has attracted a great deal of attention
recently, the question of whether new drugs are marketed at all, remarkably, has not.5 This is
significant given that less than one-half of the new pharmaceutical molecules marketed worldwide are
sold in any given country – whether rich or poor. Even those drugs that are eventually marketed in
one country frequently appear on pharmacy shelves only six or seven years after becoming available to
consumers elsewhere.6 Both price regulation and intellectual property rights influence these
outcomes. The CEO of Pfizer, Hank McKinnell, frankly acknowledged this point some years ago when
he threatened that the company would withhold new treatments from France unless the government
allowed higher drug prices (Financial Times, December 10, 2001).
When considering the effect of patent rights it is important to distinguish two main types:
those that protect of methods of manufacture (“process patents”) and those that protect pharmaceutical
products (“product patents”).7 Process patents are relatively weak. While one firm’s patents on
methods for producing a molecule might give it a monopoly for a time, a second firm can legally
devise (and patent) a new method and come into the market. Indeed, countries have purposefully
chosen a “process-only” patent regime for pharmaceutical innovations in order to foster a domestic
industry based on inventing around originators’ manufacturing processes.8 Although relatively weak,
process patents may nevertheless encourage product entry by slowing down the arrival of competitors,
allowing firms to cover fixed entry costs.
The ambiguity arises with product patents because these concentrate control in the hands of a
single innovating firm. In the debate preceding the TRIPS Agreement it was argued that countries
refusing to grant product patents were failing to get many newer drugs precisely because of the threat
of follow-on imitative competition. If innovator firms could be assured of a local monopoly, it was
suggested, they would find it attractive to launch more products. In the presence of externalities,
however, this argument is no longer obvious.
Several mechanisms can generate international pricing externalities. Some developed country
price regulators explicitly use cross-country comparisons to establish ceiling prices. U.K. drug prices,
for example, are used as an international reference by regulators in Austria, Canada, Greece, Ireland,
5 Although when Gilead Sciences recently offered to expand to 95 the number of countries eligible to receive its key anti-retroviral drug “at cost”, the offer was called “disingenuous” by the NGO Doctors without Borders because the firm has been supplying only 22 of the original 68 eligible countries. San Francisco Chronicle, March 18, 2005. 6 A “drug” refers to a chemical entity in any of its presentations – e.g. tablets, capsules, liquid. 7 Some countries also give additional protection to new formulations and new uses of existing products. 8 India’s rejection of its adopted colonial British patent code in 1972 in favor of a system allowing only short (5-7 year) process patents for drugs provides an example. With only process patents available, the multinational subsidiary Glaxo India faced several local competitors from the first day that it marketed its blockbuster drug ranitadine (Zantac); while Cipla was manufacturing a version of the Pfizer drug Viagra shortly after the drug’s global launch (Wall Street Journal, July 10, 1998).
4
Italy, Luxembourg, Netherlands and Portugal (Bloom and van Reneen, 1998; see also Jacobzone
2000). Physical arbitrage across country borders can also erode prices in higher-priced markets.
Arbitrage is legal among E.U. member countries, which pushes prices in the direction of uniformity
although it has not resulted in a single price across markets (Kanavos, et. al., 2004; Ganslandt and
Maskus, 2004). Arbitrage between most countries is illegal. Nevertheless there are concerns about
black market movements, with occasional high-profile stories involving developing countries and a
soaring trade between the U.S. and Canada.9
The behavior of political interest groups can also push prices toward uniformity. Consumers
forcefully object to paying prices that are higher than those they see being charged to consumers
elsewhere, giving firms and their regulators reason to fear a political backlash if obviously different
prices are in place. A growing literature examines how firms may distort behavior to avoid the
imposition of regulation or soften its effect. Glazer and McMillan (1990), for example, model pricing
by a monopolist where the firm may choose to forestall regulation by setting a price closer to that
desired by the regulator. Erfle and McMillan (1990) find that oil firms limited their price increases
during the 1979 oil crisis. Price restraint was more pronounced on more visible fuels like home
heating oil and more likely among large and visible firms. Ellison and Wolfram (2004) show that
pharmaceutical firms acted collectively to limit price increases during a period of intensive political
discussion of health care reform in the U.S. Firms identified as particularly vulnerable to regulation
were more likely to engage in price restraint and lobbying. Examining the stock prices of credit card
firms, Stango (2003) finds that announced rate cuts were less damaging to returns when the
announcements followed a regulatory threat. Again this result was more pronounced for politically
visible firms.10
Identifying the precise mechanisms generating pricing externalities across markets is not the
goal of this paper. Rather, the concern here is whether product patents can reduce access to new drugs
by making firms that care about externalities – whatever the source – more important players.
Whether access is, in fact, limited is also a key question for interpreting the welfare implication of
firms’ inability to fully price discriminate across countries.11
9 For example, “HIV Drugs For Africa Diverted to Europe,” The Washington Post, October, 2002; “Europeans Investigate Resale of AIDS Drugs,” New York Times, October 29, 2002. 10 Behavior beyond pricing may also be affected. For example Maxwell, Lyon, and Hackett (2000) examine firm efforts to deter consumer mobilization, and thereby government-imposed regulation, by voluntarily limiting their pollution output. 11 Maleug and Schwartz (1994) show that uniform pricing by a monopolist yields lower global welfare than third-degree price discrimination when demand dispersion is such that many markets are left unserved under uniform pricing. See also Scherer and Watal (2002). This result is accentuated if one allows for global equity concerns and differences in the marginal utility of income across consumers (See Jack and Lanjouw, 2005, where they apply many-person Ramsey pricing to the problem of global pharmaceutical pricing.)

5
Two examples of firm behavior in this environment are instructive. In the late 1980s, Bayer
chose not to introduce its new antibiotic ciprofloxacin in India. To do so it would have needed to price
the product very low to be competitive in that market, at a time when the firm was negotiating prices
in its more important markets. Instead, ciprofloxacin was introduced in India three years after its
world launch by the Indian firm Ranbaxy. However, eight years after the drug’s global launch and
long after the entrance of a multitude of local producers, Bayer finally entered the Indian market
(interview with Bayer executive, India, 1997). More recently, GlaxoSmithKline and Pfizer have cut
back supplies of their products to Canada to prevent drugs from leaving for the United States – where
they damage the higher prices that the firms enjoy in that country.12 In both of these situations the
multinationals found it profitable to engage in a local market at a low price. Their reluctance to do so
clearly stemmed from the potential implications for their profits in other markets. What is particularly
notable in the story of ciprofloxacin is the further suggestion that pricing externalities may become
less acute later in the product lifecycle.13
Given the considerations raised here, one would expect to see three types of entry into poorer
country markets. Firms interested in producing only for the local or regional market should be willing
to enter at any time, assuming that expected returns in the local market at least cover the fixed costs of
entry. Multinationals might enter poorer markets quickly in situations where they can set a price that
is close to their target price in the major markets. Sales would then be limited to the local elite.
Finally, one might see multinationals waiting for some time after the global launch of a new product,
and then entering developing country markets with a low price that allowed them to capture market
share. Which of these strategies are feasible and likely will be influenced by price regulation and the
intellectual property regime.
To date there has been little analysis of the determinants of international drug launches.
Danzon, Wang and Wang (2005) examine launch data from 25 major markets for the years 1994-1998,
and a selected sample of 85 new chemical entities (NCE). They are specifically concerned with the
effects of price regulation. Rather than summarizing differences in price control systems directly, they
use the price for a standard unit in a drug’s therapy class in an earlier year as indicator of the intensity
of regulation. A similar variable is constructed for expected market size. Both higher prices and larger
markets are found to have a significantly positive effect on the likelihood and speed of launch.
Kyle (2004a and 2004b) analyzes 21 OECD countries and much larger set of drug launches,
including 1577 molecules developed during the period 1980-2002. She focuses primarily on how firm
12 Wall Street Journal, January 22, 2003; “Pfizer Cuts Supplies to Canadian Drugstores,” The Washington Post, April 5, 2005. 13 One candidate explanation is the fact that controlled prices set in high-income countries in the early entry years are typically not renegotiated over time (Jacobzone, 2000).

6
characteristics affect launch timing and finds, for example, that domestic firms have a 5 times higher
probability of launching at home (with domestic status most important in Japan and Italy). A dummy
for price regulation has a significantly negative effect and she finds that firms are less likely to follow
launch in a low-price country with launch in a high-price country.
None of these papers consider intellectual property (IP) as a determinant of marketing
decisions. McCalman (2004) provides an econometric analysis of how intellectual property might
influence launch decisions – of American Hollywood movies. His data are from 1997-99 covering 37
countries, and he estimates hazard models for the effect of IP strength on the speed of film launches
across countries. He finds a non-monotonic relationship with moderate IP associated with the most
rapid diffusion. There is, in his context however, no scope for pricing spillovers across countries.
This paper analyzes launch patterns across a very large sample of 68 countries over the period
1982-2002. The paper provides descriptive statistics; and probit and hazard analyses of the likelihood
and speed of launch. Explanatory variables include those related to the attractiveness of markets and
local technical capacity. Those of primary interest are newly constructed policy variables for the
availability and strength of patent protection and the stringency of price control. This is the first
analysis of pharmaceutical launch patterns that includes developing countries. Their experience is of
independent interest and provides more variation in the policy variables than is found among OECD
members.
II. The Drug Launch Data
The launch data are drawn primarily from the December 2002 “LifeCycle: Drug Launches”
database constructed by the private vendor IMS Health. The database identifies the month and year
that a product first has retail sales in a given country, and indicates which entries represent first world
launches of new chemical entities (NCE).14 For each product launched, it gives the tradename, the
Anatomical Therapeutic Classification (ATC) code, active ingredient, composition, and firm making
the launch. Coverage includes entry during the 21 years 1982-2002 in the retail sector and, for some
countries, the hospital sector also. The Indian market was not covered by IMS during this period so
we incorporate similar information obtained from the Indian market research company, ORG-MARG.
The Indian data cover a partial, but broad, set of therapeutic classes – including launches of all
antibiotics, ulcer and cancer drugs – and includes all products in those classes launched in the Indian
market during the period 1986-98. The combined dataset covers 68 countries or country groups, 60%
14 In some cases the same chemical was indicated as being ‘new’ more than once, or was identified as ‘new’ at a country launch later than the first launch in the world. In these cases the first appearance is taken as the global launch date.

7
of which have at least twenty years of information.15 Further details regarding data construction are
available in Lanjouw (2005).
III. Description of Global Launch Patterns
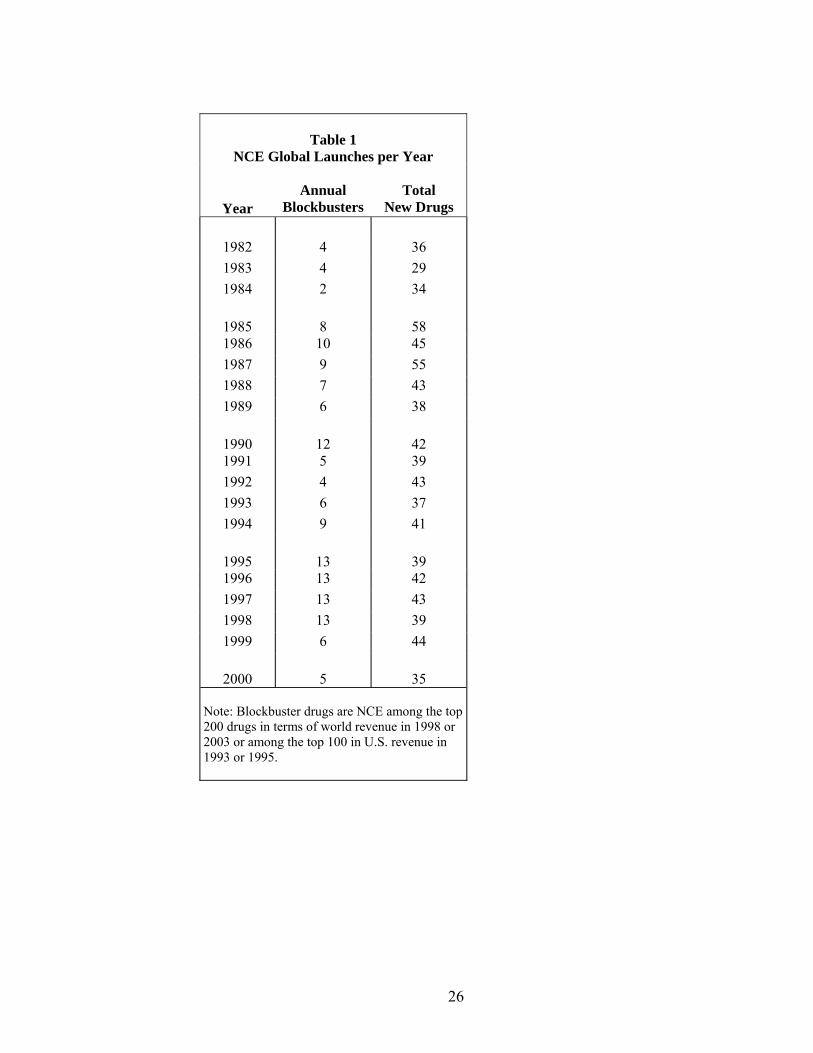
Table 1 gives the number of NCE’s with a first appearance (global launch date) in each year.
The first column indicates the number of new “blockbusters”. These are drugs that were found among
the top 200 in terms of world revenue in 1998 or 2003, or among the top 100 U.S. revenue earners in
1995 and 1993 (Med Ad News, various issues). The second column includes all drugs. There was an
increase in the number of new chemical entities launched in the mid-1980’s, with some fall off in the
numbers in the early 2000’s (perhaps due in part to data processing delays). On the whole, however,
the number of NCE’s appearing each year was fairly similar over the period.
There were 836 new pharmaceuticals first marketed during the period 1982 – 2002. Table 2
indicates the location of these first launches. The table includes countries having at least one first
launch, ordered by income class.16 Two points stand out. First, firms almost invariably launch
products first in rich country markets. Second, a very large share of all drugs is launched first in Japan
(and only there – see below).
Figure 1 gives an idea of the number of countries that an NCE typically reaches. It is based
only on the 300 NCEs with global launch dates early in the period (1982-1988) to avoid truncation.
We see that just a very few drugs from that time period were launched worldwide. The mean number
of countries is 20, the median is 9, and almost 20% of new drugs are marketed in just a single country.
Of the 54 single-market drugs represented in this figure, 23 were sold only in Japan, 13 only in Italy,
with the rest scattered across countries. Japan is clearly distinctive – it is the location of 24% of all
drug launches, but 43% of those marketed in a single country. From 1995 there was a marked
increase in the number of countries reached within a short span after global launch, so it is likely that
today the distribution shown in Figure 1 has shifted rightward.
Table 3 indicates how long it takes for a drug to become available to a country’s consumers.
Calculations in this table are restricted to the 122 NCEs first launched 1986-92 and assigned to therapy
classes for which the Indian data are available. There is some truncation for drugs entering after a
long delay because the data end at 2002, but each NCE has at least 120 months of information. It is
evident that lags tend to lengthen as one goes down the income rankings. The group summary at the
bottom of the table shows that differences are most pronounced between the high-income countries
15 French West Africa (Benin, Cameroon, Congo, Cote d’Ivoire, Gabon, Guinea, Senegal) and Central America (Costa Rica, El Salvador, Guatamala, Honduras, Panama) are aggregated by IMS because they are very small markets.

8
and the rest.17 However, there is also clearly a great deal of variation across individual countries:
median launch lags range from months (Japan, Switzerland) to over eight years (Latvia, Lebanon).
There is also considerable variation across products within countries: For example, the difference
between the 10th and 90th percentile of the lag distribution is over 10 years in Morocco and Peru and
over 7 years in some of the OECD countries.
To avoid differing degrees of truncation across years, Table 4 restricts attention to launches
that occur within 10 years of the first global launch of each NCE. The ten-year span includes most
market entry, as shown in the previous table. Table 4 includes the 91 “blockbuster” and 462 total
drugs in all therapy classes first launched during 1982-92 (so India is dropped). The first column, on
the left side of the table gives the percentage of all drugs that was eventually launched in the row
country at any point within a ten-year lag. The second column gives the percentage of blockbusters
eventually launched in each country.
Considering the first column, the percentage of drugs launched within a ten year lag ranges
from lows of 19% and 22% (Egypt, Malaysia) to highs of 49% and 53% (Italy, Japan). Thus, no
consumers anywhere have access to more than about one-half of the new pharmaceuticals that enter
the world market. The mean (unweighted) percentage is 34.8% for the high-income countries, and
29.9% and 28.4% for the middle- and low-income countries, respectively. As expected, “blockbuster”
drugs that experience high sales revenues in the developed world are also launched more frequently in
the poorer countries than drugs overall, although in no country is the rate for even this more select
group close to 100%. The fact that drugs are not launched more widely can be due to the availability
of substitutes, differences in disease patterns across countries, and rejection by some local regulatory
authorities.
The remaining columns of Table 4 give the cumulative distribution of drug launches at
different lags from one year to nine years. Thus the column headed “3” indicates the percentage of all
NCE launched within ten years in a given row country that arrived in that market within three years.
Countries are listed by income group and, looking down this column, we again see that drugs are more
likely to be launched within three years in the richer countries than in the poorer countries. This is
highlighted in Figure 2, which shows unweighted averages for each income group. However, the
pattern is not strong. Israel, at 27%, for example, has a smaller share on the market this quickly than
either the Philippines or Thailand (44% and 41% respectively). Again we see the large range of
16 The income classes follow those in the World Bank 2002 World Development Indicators Report. The ranges for GNI per capita measured in 1999 U.S. dollars are: Low ≤ $755 < Lower ≤ $2995 < Middle ≤ $9265 < High. 17 The difference for high income countries is not driven by the fact that Japan has a large number of unique drugs. Dropping Japan lowers the average number of drugs to 40 and increases the median lag to 28 months.
9
experience overall. Germany has 75% of its drugs on the market within three years of the global
launch, Saudi Arabia just 16%.
Most global market entry is done by the “first” firm, defined as the firm that makes the first
global launch of an NCE in a high-income country, or any country for the few NCE launched
exclusively in the poorer countries. This firm almost surely holds most of the patents associated with
an NCE and is typically a multinational. A smaller share is done by “other” firms – which may in
many cases be entry done under license as part of a marketing arrangement and thus effectively
controlled by the first firm (the data do not allow one to distinguish). “Other” firms may also be
multinationals.
Shares for the low- and middle-income countries are shown in Table 5, broken down by type
of patent regime. Moving from left to right, a stronger patent regime is associated with more of the
drug launch in a country being done by the first firm. Overall, two-thirds of all drug launches and
three-quarters of blockbuster launches are done by the first firm. These firms are responsible for about
80% of the new drug launches in the poorer countries that occur within the first 3 years. That these
firms enter markets more rapidly is also clear in Figure 3, which shows the timing of drug entry in
high or lower-income countries conditional on launch being done by the “first” or “other” firm.
IV. The Explanatory Variables
Annual series were constructed to describe each of the main policy areas:
Intellectual Property Protection: These include indicator variables for the availability of
patents on innovative methods of manufacture for pharmaceuticals (process patents), and on new
pharmaceutical compounds (product patents). Historically, countries have offered either no protection
in the area of pharmaceuticals, process patents only, or both process and product patents. The data
include the statuary term of each form of protection, and information about whether a country allows
for an extension to the patent term to compensate for time spent in the marketing approvals process.
How a country interprets and enforces its patent laws clearly affects how meaningful any
patent “rights” are to their owners. Unfortunately this is a difficult characteristic to capture in data.
We use one variable, “strong,” falling between 0 and 1, which takes on a higher value as a country
limits how patent rights can be curtailed. Specifically, it is the average of non-missing values for three
other 0/1 indicators: the first equals one if a country will not impose compulsory licensing until three
years after patent grant; the second equals one if the country has no formal obligation to “work” a
patent (supply the market); and the third equals one if the country does not revoke patents for failing to
work if there is such a requirement. This variable was devised by Walter Park, who provided the data
required for its construction for most countries for each five years beginning in 1980 (see Ginarte and

10
Park, 1997, for details). For missing countries, his data were supplemented assuming current values
throughout the period based on the legal texts. A similar variable composed of enforcement-related
indicators was not found to have any explanatory power and therefore was not included in the
estimations.
Price Control: Countries approach the control of pharmaceutical prices in a bewildering
variety of ways. We consider systems of explicit price regulation and summarize the variation across
countries with two dummy variables – one for the existence of “some” price control regulation and the
second for “extensive” price control. A price regime is label “extensive” if all drugs are regulated,
rather than just a subset of the market, or if a country’s price regulation is identified by commentators
as being particularly rigorous. The set of reports consulted in making this determination, and legal
texts sourced for relevant IP law, are given in Lanjouw (2005).
The legal and regulatory policies of a country result from some process, and this makes
endogeneity an obvious concern when trying to understand the effects of any policy regime. In our
case, one might expect firms to lobby hardest to obtain strong patent protection in countries viewed as
attractive markets for entry, potentially creating a positive bias in estimated relationships.18 However,
a consideration of history suggests that substantive within-country changes in the patent law can
reasonably be treated as exogenous for our purpose – certainly in their timing. Such changes tend to
be forced by the rules of entry into new political groups (e.g., Portugal and Spain joining the EU in
1992); by newly negotiated standards created at an international level (e.g., many poor countries and
TRIPS, Mexico and NAFTA); or a vulnerability to trade pressure and the political dynamic of bilateral
negotiations (Korea, Brazil, and Jordan in the 1980s and 1990s). (See Sell, 2003.) The link to the
dynamic of trade negotiations is reflected in comments by the body that advises the U.S. Congress and
administration on IPR and trade, the Industry Functional Advisory Committee on IPR for Trade
Matters (IFAC-3), in its reports to the US Trade Representative:
CAFTA (the Central American Free Trade Agreement) “mirrors, as closely as possible, the
Singapore and Chile FTAs in order to establish clear precedents in most key areas of
intellectual property protection for future FTA negotiations.”
And
“IFAC-3 is particularly gratified that….with high-level agreements with both small
developing countries in the CAFTA and a strong and mature developed country like Australia,
it will prove much easier to convince future FTA countries that strong intellectual property
18 And lobby they do. For a candid discussion see historical issues of the PhRMA annual report.

11
protection is in the interests of all countries regardless of their economic circumstances.”
(Italics mine).19
Price regulation is more likely to be endogenous. While patent laws change only rarely, and
then in fairly specific and major ways, governments may more flexibly adjust price controls. In
particular, a government might be willing to limit the scope or intensity of an existing system even
where it would not dismantle it altogether. Weaker regulation might be associated with pressure from
an industry with an eye on entry for other reasons. There are, however, strong countervailing forces
that limit industry influence, such as budgetary pressures and vigorous lobbying by patient groups and
the retired elderly.
Control Variables: To mitigate potential endogeneity concerns and remove noise, we
construct controls for other characteristics that one might expect to influence pharmaceutical
marketing. Some of these control variables are of independent interest. Given our hypothesis that
multinationals might be reluctant to launch in poor countries when they face price competition, and
that local firms could be an alternative source of new drug entry, the presence of a competitive local
industry should be relevant. The finding in Section 3 that innovator firms are responsible for most
global marketing suggests that the price effect of local competition could be particularly important.
Country R&D expenditure (in all areas) as a share of GDP is included as a regressor to capture local
technical capacity and thus the potential for imitative competition. High tariffs in a country may also
make entry less attractive to multinationals that would anticipate importing supplies from centralized
production facilities. High-income countries have zero rates on pharmaceuticals, but in the poorer
countries there is considerable variation, with rates as high as 35%.20
Differences in market opportunities are captured by the demographic indicators population
size and the percentages of the population aged 0-14, 15-64, 65+ years. Economic variables include
the level of GDP per capita. The Gini coefficient of inequality, and asset ownership, provide some
measure of differences in income distributions. We also control for the share of health expenditure in
GDP, and the share of health expenditure that is private, and the share of doctors in the population.
Characteristics of the regulatory process can also influence market entry. Health authorities
differ in their standards and some may reject a new drug even when it is on the market elsewhere.
Delays in the marketing approvals process can take the speed of drug launch at least partially out of
19 Industry Functional Advisory Committee on IPR for Trade Matters (IFAC-3) in reports to the USTR: http://www.ustr.gov/assets/Trade_Agreements/Bilateral/CAFTA-DR/CAFTA_Reports/asset_upload_file571_5945.pdf and http://www.ustr.gov/assets/Trade_Agreements/Bilateral/Morocco_FTA/Reports/asset_upload_file164_3139.pdf (both accessed 12/06/04). 20 The data used here were drawn from the UNCTAD database and kindly supplied by Adrian Otten. See European Union (2003) in the policy references for a description of these regulations.

12
the hands of firms.21 The observed timing of market entry reflects some combination of the decisions
of firms and the complexity and efficiency of a country’s regulatory process. Thus, the estimations
include other elements of government policy that might directly affect or proxy for other conditions
that influence entry timing, beyond our key variables of interest. These include whether a country has
adopted an essential drug list, standard treatment guidelines or a national formulary. For E.U.
members we include an indicator for the 1995 establishment of the European Medicines Evaluation
Agency. This agency offers a centralized, and thus potentially more rapid, approvals procedure within
the European Union.
Many of the explanatory variables are available annually and others are in one or several
cross-sections. Variables are defined in Appendix Table A1 with summary statistics in Table A2.
V. Econometric Analyses of Launch Determinants
This section describes the probit and hazard model estimations used to analyze the probability
and speed of drug launch. Results are discussed in the following section.
Because the data are sufficiently rich to allow disaggregation, all estimations are done
separately for the high-income countries and for a combined low-and middle-income grouping. We
consider four different subsets of the NCE in the data. The base estimations include all drugs.
However, some drugs launched in one location fail to reach other county markets because they do not
meet those countries’ local health standards for safety or efficacy. We want to distinguish between
firm’s decisions not to launch, and a failure to fulfill marketing requirements. Thus, for the high-
income countries we also estimate the models on a “high quality” subset of NCEs, defined as those
that obtain marketing approval and are launched in either the U.S. or the U.K within 2 years. This
follows Danzon, et. al. (2005), who argue that these two countries have the most stringent regulation
and that therefore approval for their markets implies a minimum quality standard.22
For the low- and middle-income group we focus on the set of “blockbuster” drugs – those of
greatest commercial importance as measured by sales revenue. The group includes drugs of great
medical importance and also some major “lifestyle” drugs. We examine the launch of blockbuster
21 Firms are able to influence how quickly a given drug moves through the approvals process. They can work with more institutions and offer greater compensation to participants in order to rapidly reach required sample sizes for clinical trials. They can direct more resources to interacting with the authorities during the approvals process. Dranove and Meltzer (1994) provide evidence from the United States that firm work harder to speed the approval of drugs that are later successful in the market. 22 Unlike Danzon, et. al., we drop the U.S. and the U.K. as launch countries when analyzing this subset since their launch probabilities are biased upwards by construction. Another way to approach the quality issue is to restrict attention to drugs known to satisfy a given country’s standards because they are observed entering its market within ten years, and analyze the probability that those drugs are launched within two years (analogous to Table 4). Unreported estimates on this subset support the results discussed below.
13
drugs in the low and middle-income group only, because one could expect drugs in this group to be
launched extensively in the rich countries (although see the second column of Table 4.)
Finally, when examining launch in the lower-income group we consider separately NCE in
therapy classes that have sales relatively more concentrated in developing countries: class A
(alimentary tract and metabolism) and class J (systemic anti-infectives). The sales of drugs in class A
and J were 23.6% and 23.0% of all sales in India in 2000, while only 10.4% and 18.1% of the NCE in
our data fell in these therapy classes (sales figures from Chaudhuri, et. al., 2004). Firms might have
stronger incentive to enter poorer markets with products in these classes.23
Tables 6-8 and Tables 10-11 contain the estimation results for probit models of the probability
that a new drug is launched in a given country within either two years or ten years of the drug’s first
appearance in the global market. Observations are at the level of a country/NCE and the dependent
variable takes on the value one if the NCE was marketed within the indicated period of time. A 24-
month lag is below the median lag for high-income countries, and below the 10th percentile for low-
and middle-income countries (see Table 3). Thus, product entry within this timeframe represents
relatively rapid launch, particularly in the poorer countries. The procedural steps associated with
market entry should not typically require a delay longer than two years, particularly for the originator
firm.24 Thus, if a launch fails to happen within two years one can fairly assume that this failure
involved at least some element of firm choice to delay, or that a decision was made to enter but the
product was rejected by the health authority. The descriptive statistics presented above suggest that a
lag of ten years is a reasonable indicator of whether a drug is “ever launched”.
Table 9 contains estimation results for a log-logistic hazard model of the time path of country
launches.25 The log-logistic model implies that the probability of failing to have a new drug on the
market t months after the global launch is 1
/1)}exp{
(1)(−
⎥⎦
⎤⎢⎣
⎡+= γ
βxttS .
This functional form allows for increasing and then decreasing hazards rates through the parameter γ
and was preferred by the data over other frequently used specifications such as Cox proportional
hazard or Weibull models. To accommodate unobserved heterogeneity across drugs, the estimations
also allow for a multiplicative factor on individual hazards having a Gamma distribution with mean
23 Virtually all drugs are also marketed in the high-income countries. Of the over four hundred NCE launched through 1992, only eight were launched exclusively in the low- and middle-income countries and only one of these in more than a single country. 24 A timeline of patent application and approvals is discussed in ____(2005). 25 Global launches are defined as being a launch in the first month to avoid those observations being dropped.

14
one and variance θ. This standard form yields a convenient analytical expression for the likelihood
function.
In all specifications, countries enter the estimation for a given NCE only if the NCE’s global
launch precedes the entry of the country into the database. To avoid truncation, the hazard estimations
include NCE first launched 1982-2001, the probit estimations for a two-year lag include those first
launched 1982-2000, while those for the ten-year lag include only NCE with first launch 1982-1992.
All estimations include full sets of dummy variables for both the date of NCE first global launch and
the fourteen ATC therapeutic classes. Country fixed effects are also included in some of the probit
estimations – as indicated in the column headings – and in the hazard estimations. Their inclusion
implies the loss of all information available from cross-country variation in the key policy variables;
but focusing on within-country changes over time has the advantage of controlling for any unobserved
market characteristics that might be correlated with those variables. Appendix Table A3 indicates the
countries that saw changes in their policy variables during relevant time periods. Time, therapy class,
and (where included) country fixed effects are each jointly significant in all cases. Where country
fixed effects are not included in the model, the estimations allow for a country random effect.
Explanatory variables are dated by the year of the first global launch. For example, if an NCE
is first marketed in 1990 then it is a country’s population size in the year 1990 that is considered as a
determinant of drug launch in the period two or ten years after 1990. This is not obviously the right
assumption – one might expect that the relevant characteristics would be those for a later period,
particularly for the probability of launch within ten years. However, experimentation showed that
both policy and market variables dated after the global launch (either two or four years) have weaker
explanatory power in models of new product launch. It may be that worldwide launch decisions for a
new drug are taken at the time of first marketing and do not readily respond to subsequent changes in
the policy environment.
VI. The Estimation Results
We now examine the determinants of drug launch. Coefficient estimates on the patent regime
and price control variables are discussed in detail, followed by a brief discussion of other estimates.
Low- and Middle-income Countries
Results of probit estimations for the low- and middle-income countries are presented in Tables
6 through 8, with corresponding hazard model estimates in Table 9.
The type of patent protection offered by a country in this income grouping is characterized by
a set of five dummy variables (see the first rows of Table 6). Information on the length of protection
is collapsed into indicator variables for whether the statutory patent term is short vs. long. This
15
distinction has explanatory power whereas the specific term length in years does not. While somewhat
surprising, launch decisions are made by managers who must synthesize different types of information
and it is quite plausible that the simpler breakdown is the way in which they think about country patent
policies when making their choices.
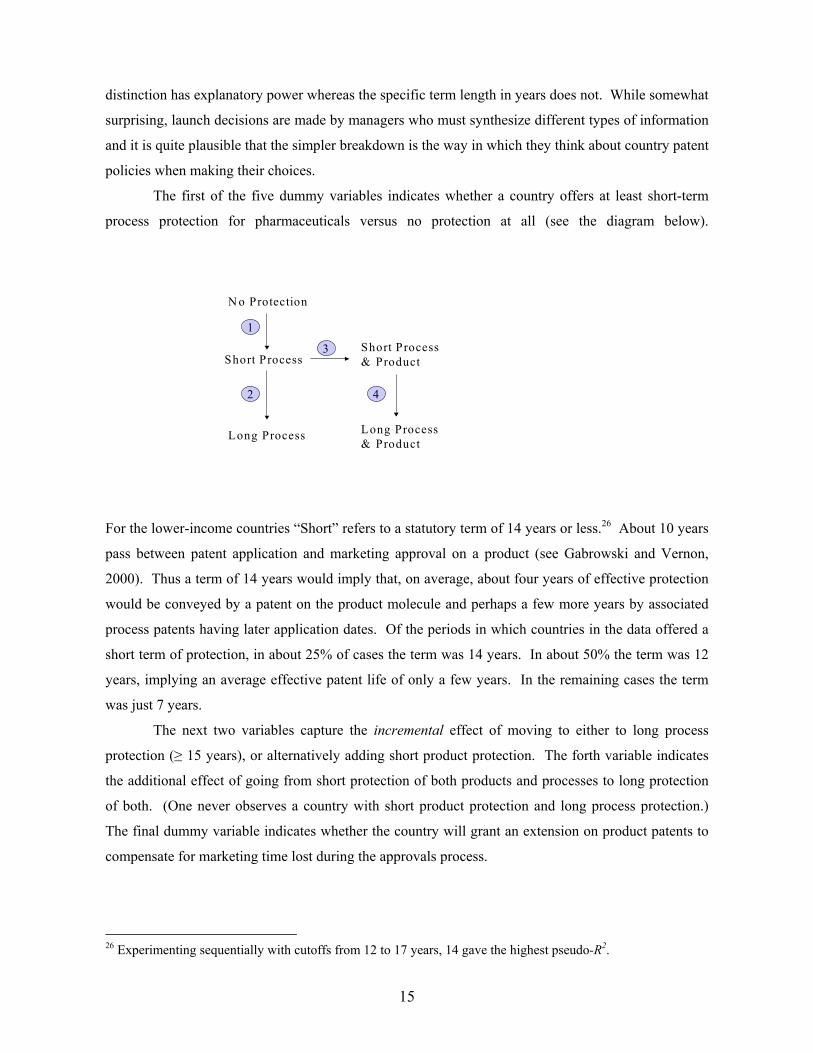
The first of the five dummy variables indicates whether a country offers at least short-term
process protection for pharmaceuticals versus no protection at all (see the diagram below).
Short ProcessShort Process& Product
Long Process Long Process& Product
N o Protection
2 4
3
1
For the lower-income countries “Short” refers to a statutory term of 14 years or less.26 About 10 years
pass between patent application and marketing approval on a product (see Gabrowski and Vernon,
2000). Thus a term of 14 years would imply that, on average, about four years of effective protection
would be conveyed by a patent on the product molecule and perhaps a few more years by associated
process patents having later application dates. Of the periods in which countries in the data offered a
short term of protection, in about 25% of cases the term was 14 years. In about 50% the term was 12
years, implying an average effective patent life of only a few years. In the remaining cases the term
was just 7 years.
The next two variables capture the incremental effect of moving to either to long process
protection (≥ 15 years), or alternatively adding short product protection. The forth variable indicates
the additional effect of going from short protection of both products and processes to long protection
of both. (One never observes a country with short product protection and long process protection.)
The final dummy variable indicates whether the country will grant an extension on product patents to
compensate for marketing time lost during the approvals process.
26 Experimenting sequentially with cutoffs from 12 to 17 years, 14 gave the highest pseudo-R2.
16
Table 6 presents results for the full set of drugs. The first model, shown in column one,
includes country fixed effects, while the second model does not. 27 Because the latter specification
includes the Gini coefficient as a control, a number of countries are lost due to missing information.
The estimates are quite robust to the assumption of fixed or random country effects, which
lends empirical support to the argument that the set of policy variables can be treated as exogeneous.
As noted above, the decision whether to maintain an extensive price control system in the face of
international corporate or governmental pressure is the policy choice most likely to be problematic.
To test whether endogeneity in this variable might be influencing the results, we also estimate a two-
stage conditional maximum likelihood version of the model in column two that includes the residual
from a first-stage regression for extensive price control (Rivers and Vuong, 1988). Significant
instruments in the first-stage regression include the economic orientation of the ruling executive party,
its tenure in power, and the overall budget balance.28 First-stage estimates are provided in Appendix
Table A4. The exogeneity of the extensive price control variable in the probit for launch is not
rejected (null hypothesis that the residual coefficient is zero: χ2(1) = 0.42, p-value = 0.52). The
coefficients in the launch model change little so they are not reported.
Given the historical link between changes in patent law and trade agreements, one might also
be concerned that what looks like a positive role for stronger patents could be due to other changes in
the trade regime facilitating market interaction. To test this, annual exports was included as a control
variable in unreported estimations. Its inclusion had little effect on the estimated coefficients on the
policy variables.
The observed probability that a drug is launched in a low- or middle-income country within
two years is about 9%. The estimates in Table 6 suggest that going from a regime with only short
process patents to one with long process patents significantly encourages rapid entry. A long process
patent regime still allows for possible generic entry and this appears to be important. The marginal
effect is to raise the probability of launch within two years by 2-3 percentage points (or about 30%).
There is little evidence, however, that offering any form of protection to new pharmaceutical products
enhances the likelihood of quick entry into these markets. The individual incremental effects of adding
short and then long product protection are insignificant in both specifications, and the joint marginal
effect is weakly significant only in the random effects model (0.021 + 0.008, p-value 0.08).
27 Because there is limited variation in the policy variables – particularly when country fixed effects are included – a jackknife procedure was used to look for potential overfitting of the data. Countries were dropped in turn, the model re-estimated and the resulting coefficient estimates checked for stability. 28 Budget stress could increase the stringency of price regulation as countries that cover pharmaceuticals though general expenditure strive to control costs (for many specific incidents in the E.U., see Jacobzone, 2000). Because it could conceivably have a direct effect on the government’s willingness to approve relatively expensive new drugs we also run the two-stage estimations dropping this variable. The results are the same.
17
Extensive price control clearly lowers the probability that new pharmaceuticals reach
consumers quickly in lower-income countries, as expected. The predicted effect is similar in
magnitude to that of the change to a longer term on process patents – in this case lowering the
probability of rapid entry by some 30%. That a country has an essential drugs list is also associated
with a lower likelihood that new drugs are launched quickly and may indicate more focused efforts by
the government to ensure that drug purchases are cost effective. Moderate price control, on the other
hand, does not appear to have a significant influence on entry in these specifications.
The first two columns of Table 7 present the main results for estimates when additional
variables are included in the random effects specification. The first adds a country’s R&D share and
its level of tariff protection (which together lead to a sizable drop in the number of observations due to
missing data). We again find that having a long process patent regime significantly encourages rapid
drug launch. A new finding is that countries with a high technical capacity as measured by R&D
expenditure are far less likely to see new pharmaceuticals in the market quickly. Starting from no
R&D and then increasing R&D to the mean level of one-half of one percent of GDP drops the
probability of rapid launch by an estimated 13.6 percentage points. This negative effect of local
capacity, however, is significantly offset if a country offers the strongest level of patent protection.
Although the effect of a higher R&D share remains negative even when interacted with strong patent
protection, its marginal effect is diminished by a third (joint marginal effect = -0.19, p-value = 0.01,
versus -0.28).
As in the simpler specification, extensive price control has a significant negative effect on the
probability of rapid launch. Moderate regulation of prices is also found to have a negative effect now
that the specification allows for its interaction with GDP per capita. The impact of having any price
regulation is sizable for the poorest countries, and is only fully absent at a GDP over $11,000, or
higher than cutoff for this country group. That price regulation has a larger effect in the poorest
countries may reflect firm choices. It might also result from low-income countries having less
efficient regulatory procedures that slow price negotiations. There is some suggestion of the
importance of variation in regulatory efficiency within the lower-income countries in the fact that the
coefficient estimate on having a national formulary is significantly positive (which is not the case for
the higher-income countries, see below). One would expect its direct effect to be negative, but within
the lower-income country group this variable may be acting as a proxy for bureaucratic competence.
The specification shown in the second column of Table 7 includes interactions between short
and long product patent variables and the indicator “Strong” that indicates limits on how patent rights
can be curtailed. There is some weak evidence from these interactions that short product patents may
encourage rapid entry when they are held in a legal environment more generally supportive of patentee
18
rights. It may be, for example, that in such an environment the patent holder feels able to simply
import product rather than go through the time consuming process of finding local producers and/or
distributors to license.
The third and forth columns of Table 7 correspond to the same random effect model as in
column 2 of Table 6, but for the NCE subsets indicated in the column headings. As found for all
drugs, the NCE most relevant to poor countries (“LDC concentrated”) are more likely to be launched
quickly when a country offers only long process patent protection. In addition, for this subset of NCE
there is also evidence that offering long protection on pharmaceutical products can encourage rapid
entry. The incremental effect of long product protection is positive and weakly significant and the
estimated coefficient on having a patent term extension provision is both significant and sizable.
Results for the other policy variables are similar to those for all drugs.
The last set of estimates given in Table 7 is for the high revenue “blockbuster” drugs. For a
low- and middle-income country the probability that one of these drugs is launched within two years is
considerable higher than is the probability for all NCE (24% vs. 9%). That said, there is no evidence
that offering any form of patent protection – whether long or short – speeds the arrival of the worlds’
blockbuster drugs to their markets. This finding does not seem to be an artifact of the smaller sample
size, since other estimations showing significant effects of the patent variables have even smaller
sample sizes. Further, the other policy variables remain significant and are estimated to have a
similar-sized effect on the launch of blockbusters (relative to the observed probability) as they do for
other sets of NCE.
Table 8 compares results for the probability of launch within two years (“rapid”) and ten years
(“ever”) using only NCE launched globally by 1992 in both cases so as to enable comparisons across a
common sample of drugs. Considering first the within 2 year results, as in the full period data there is
evidence that a long process patent regime – possibly supporting generic entry – is conducive to rapid
drug launch. However, unlike in the full period data, in this earlier subset of NCE a long patent
regime also including products – possibly encouraging entry by innovator firms – gives significant
support to rapid entry. Both patent regimes offering a long period of protection are estimated to have
similar-sized marginal effects: 0.086 without product patents and 0.070 when products are included
(as compared to a short process-only regime). Interestingly, the R&D share and its interaction are not
significant in the earlier time period. The fact that we observe less benefit from product patents in the
full period data and a more negative effect associated with local R&D activity (compare Tables 6, 7
and 8) may be due to innovator firms feeling increasingly less able to make use of patent rights in
developing countries to protect against local competition.
19
Policy choices have remarkably different effects on whether drugs are “ever” launched.
Contrary to the finding for rapid launch, there is only weak evidence that moving from a short to a
long process patent regime increases the likelihood of a drug being marketed ever. Instead, there is a
significant benefit in the longer term associated with giving short-term protection to innovative
products, increasing the estimated probability that a drug is ever launched in a lower-income country
by 7.5 percentage points or 25%.
Most interestingly, there is a significant, sizable, and now positive benefit associated with
having local technical capacity. Moving from no local research activity to the mean R&D share in this
sample of 0.38 increases the probability that a new NCE is ever launched in a country by an estimated
9.7 percentage points or 32%. Further, in contrast to our finding for rapid launch that strong patent
protection partially and positively offsets the harmful effect of local capacity, when it comes to the
question of whether new drugs are ever marketed, we find that strong patent protection negatively
offsets the otherwise beneficial effect of having local capacity. Further, the offset is no longer partial.
The joint marginal effect of R&D capacity when combined with extensive IP protection is a
statistically insignificant 0.07 (p-value 0.256). Consistent with this contrast in the direction of effects
across time lags, we also find here that offering a patent term extension has a weakly significant
negative effect on whether new drugs are ever launched, whereas for rapid launch this policy was
found to be either insignificant or positive.
One surprise in Table 8 is that price regulation, which has a large and consistently negative
effect on the likelihood that a drug is launched quickly, is estimated to have a weakly positive effect
on whether drugs are ever launched. This is difficult to explain either as a direct effect, or as the
result of policy endogeneity, both of which would give a negative effect. Nor is it consistent with the
idea that regulators lower price demands if firms hold out long enough to entice them into the market,
since such behavior would, at best, make regulation neutral. At the very least, it does not appear that
price regulation is severely limiting the ultimate entry of new products.
Taken together, the findings in column two of Table 8 suggest that innovator firms are an
important source of drug entry (hence product patents matter for eventual launch) and that these firms
are willing to enter poorer markets at low prices with only a few years of effective patent protection –
after some delay. They also suggest that local firms can be a significant source of market entry, and
that their ability to actively enter could be slowed by stronger patent rights. Given this, unless speed
of access is paramount, a lower-income country would not seem to benefit in terms of greater product
availability from offering a long term of product patent protection or from limiting its price control
regulation.
20
Finally, Table 9 presents hazard model estimates. There are in an accelerated failure time
form which means that a negative coefficient is associated with shorter launch lags and thus
corresponds to a positive coefficient in the probit estimations. The hazard model summarizes the
effect of policy on launch behavior at all monthly lags after global launch and thus incorporates -
within a specific structure – both the “within two year” and “within ten year” launch probabilities.
Thus it is not surprising to see in the first column of Table 9 that both increasing the term on process
patents and making short protection available on new products speed drug launch.29 We find that
while extensive price regulation slows launch, moderate price regulation, on average, has no effect in
this group of low- and middle-income countries.
High-income Countries
There is less variation in the patent regimes observed in the high-income countries. For
example, all of the countries in this group offered at least protection on pharmaceutical processes over
most of the period. Thus, for this group of countries the set of indicator variables is limited to three: a
dummy for whether a country protects pharmaceutical products, another for the incremental effect of
having a long statutory term on either form of protection, and finally a dummy variable indicating
whether a patent term extension is available. For this group of countries, “Short” refers to a statutory
term of less than 20 years, the distinction preferred by the data.
The estimations in Table 10 for the high-income countries and the full set of NCE follow the
same format as Table 6. For this set of countries the estimates on the policy variables are less robust
to the choice of fixed or random country effects (compare models one and two).30 It may be that the
policy variables are picking up some the effect of other country level characteristics in the random
effects specification. However, it is also the case that among the high-income countries there is more
limited within-country variation in the policy variables (see Table A3). As a result the countries
contributing to the estimation of policy effects across the two specifications are quite different and this
makes some divergence in the point estimates less surprising. We also test formally, as above, the
hypothesis that the extensive price control variable is exogeneous and again cannot reject the null
(χ2(1) = 0.84, p-value = 0.36). First-stage estimates are in Appendix Table A4.
The results in Table 10 consistently indicate that adding the protection of new products to an
otherwise “Short” patent regime gives the greatest incremental boost to rapid market entry. For the
specification with country fixed effects, shown in column one, we also find a significant additional
benefit from moving to a longer patent term. However, in no specification is there any evidence that
29 From Table 8 it is clear that a model allowing for changes in the relative effect of policy variables at different lags would be desirable. A Cox proportionate hazard specification accommodates this easily but the underlying proportionality assumption is resoundingly rejected by the data.
21
having a drug patent extension affects the market entry of new pharmaceuticals within high-income
countries.
All price regulation – whether moderate or extensive – tends to reduce the probability that a
drug is launched in a high-income country within two years. However, as for the poorer countries, the
effect of moderate price regulation depends on the income level of a country. The estimates here
indicate that moderate price control no longer lowers the probability of rapid entry once a country
reaches a GDP per capita of about $12,088, slightly below the median level for the group.
The first column of Table 11 contains estimation results for the “high quality” subset of NCE
using the country fixed-effects specification. The overall probability of a high quality drug being
launched within 2 years is over fifty percent higher than for an average NCE (33% vs. 20%). As for
all drugs, short-term product patent protection encourages the launch of blockbusters. In contrast to
all drugs, however, there is no incremental benefit from having the longest term of protection. Having
any price control lowers the likelihood of entry and extensive price control is particularly problematic.
The latter lowers the probability of rapid launch by 10.7 percentage points, or 33%.
The last results in Table 11 are within 2 and within 10 year estimates for the early (1982-92)
period NCE. Because of the limited within-country variation in the policy variables during this shorter
period, we use the random effects specification corresponding to column three in Table 10.
A high-income country increases the probability that new drugs are available to its consumers
quickly by offering at least short-term protection to pharmaceutical products, as before, but for this
early period there is an even larger incremental effect from moving to a longer term of protection
(column 2). Moderate price control is weakly significant and extensive price control significantly
diminishes the likelihood of rapid entry.
When considering whether drugs are “ever” launched in the high-income countries both
patents and price regulation continue to have a role. In this longer time span, however, it is only long-
term patent protection that is found to make a positive contribution. Because later market entry
shortens the effective patent life, the statutory term may need to be long if it is to create a period of
exclusivity sufficient to allow a firm to cover the higher costs of entry into high-income countries. It
is somewhat surprising, then, to continue to find that offering a patent term extension has no
discernible effect on eventual market entry nor on its timing. Finally, and again as we found for the
poorer countries, extensive price control is far less damaging to the likelihood that a drug is ever
launched than it is to the likelihood that it is launched quickly.
30 However, the standard errors are sizable so the estimates are statistically indistinguishable at conventional levels.
22
Maintaining an essential drugs list was found to have a significant dampening effect on market
entry in the poorer countries in most specifications. We see the same negative effect within the high-
income countries when considering all drugs, and of a similar relative magnitude. Having a national
formulary is also associated with less rapid entry. Finally there is some evidence that the
establishment of the European Medicines Evaluation Agency in 1995 as a centralized mechanism for
obtaining marketing approvals within Europe has succeeded in speeding access to new drugs for
consumers there. In specifications where the estimated effect of the EMEA is significant it is also
large – increasing the probability of launch within 2 years by 25-30%.
Income Distribution and Demographic Characteristics
As one would expect, having a larger population and higher level of GDP per capita increases
the likelihood that a country will have more drugs on the market and that they will become available
quickly. In the estimations that include the Gini coefficient as a measure of income inequality, we
find that the distribution of income is always also a significant determinant of market entry. The Gini
coefficient, and its interaction with the log of GDP per capita, are statistically significant and show a
pronounced pattern across the two income groups. As noted in the introduction, when an innovator
firm considers launching products in one of the poorer countries, it may follow a strategy of setting
low prices with small profit margins in an attempt to achieve extensive market penetration.
Alternatively it may opt for higher prices with the expectation of reaching just the top of the market.
We find that a lower-income country is more likely to get new drugs if it is unequal – ensuring that it
has a wealthy “elite”. On the other hand, a high-income country is better off with a more equal
distribution as this generates the largest “middle class”. Equality becomes less important as average
income increases. These findings are consistent with the idea that there is a threshold level of income
that makes an individual a potential consumer of new drugs. For countries with an average income
below that threshold, inequality increases market size. For those above, inequality decreases market
size – unless average income is so high that even when it is unequally distributed most consumers are
above the threshold.
The age composition of a country’s population also appears as a very significant determinant
of the speed and extent of drug launch. In the low- and middle-income countries, drugs are more
likely to reach the market in countries with many children and those with a high proportion of elderly.
In the high- income countries, having a larger proportion of children seems to be most important.
VII. Policy Simulations
This section gives a sense of the empirical implications of the econometric results discussed
above. Table 12 gives the predicted probability that a drug arrives in a given country market within
23
two years of its global launch. The predictions are for 1995 and the anti-infectives therapy class.
They are based on the estimation of country fixed-effects models, using the high quality NCE for the
high-income countries (Table 10, column 1) and the blockbuster sample for the low- and middle-
income countries (unreported). The columns on the left hand side indicate a range of different policy
choices, while those on the right show how the predicted probabilities vary with these choices. The
last row gives selected estimated standard errors – to give a sense of the precision of the predictions.
Because the predictions are highly correlated across rows within a given column, and across columns
within income groups, these should not be used to formally assess the statistical significance of
differences. Bold typeface indicates changes that are significant.
The first three rows change the patent regime, while the last three rows change price
regulation. It is apparent from this table that a country’s choices regarding intellectual property and
price regulation can have a substantial impact on the likelihood that new pharmaceuticals are available
to consumers quickly. In both lower- and high-income countries there appears to be scope to alter the
probabilities by some 20-30% or more by virtue of these policy decisions.
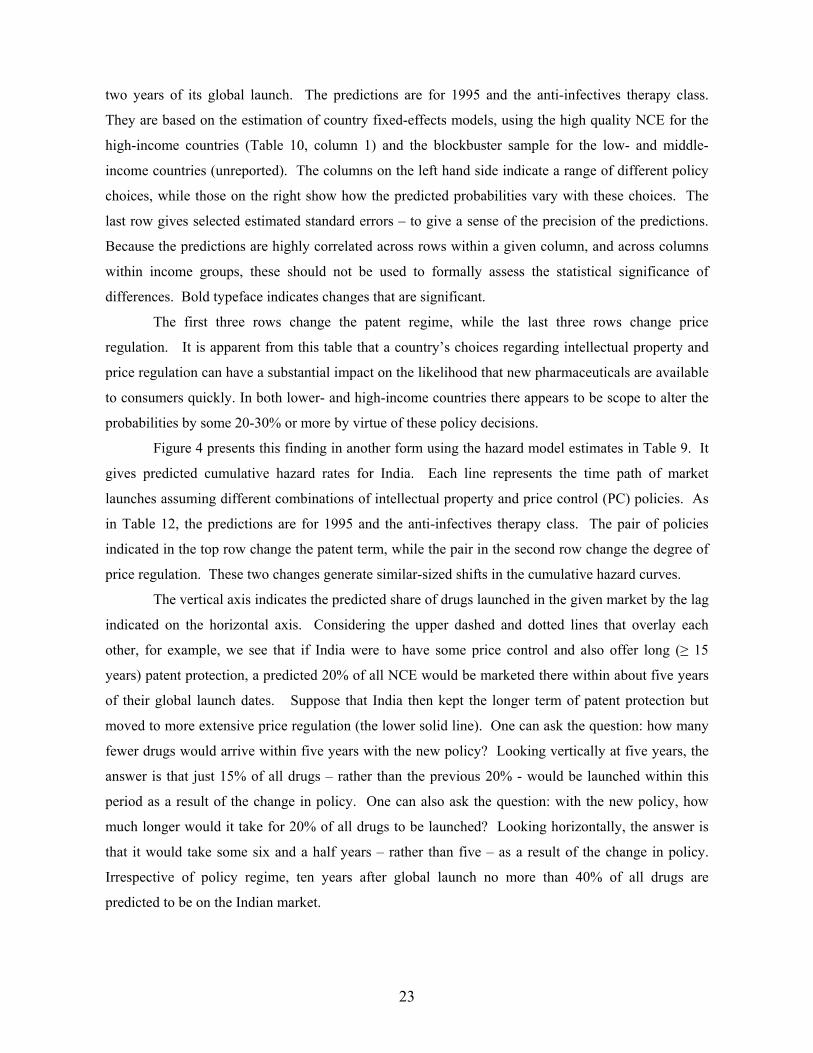
Figure 4 presents this finding in another form using the hazard model estimates in Table 9. It
gives predicted cumulative hazard rates for India. Each line represents the time path of market
launches assuming different combinations of intellectual property and price control (PC) policies. As
in Table 12, the predictions are for 1995 and the anti-infectives therapy class. The pair of policies
indicated in the top row change the patent term, while the pair in the second row change the degree of
price regulation. These two changes generate similar-sized shifts in the cumulative hazard curves.
The vertical axis indicates the predicted share of drugs launched in the given market by the lag
indicated on the horizontal axis. Considering the upper dashed and dotted lines that overlay each
other, for example, we see that if India were to have some price control and also offer long (≥ 15
years) patent protection, a predicted 20% of all NCE would be marketed there within about five years
of their global launch dates. Suppose that India then kept the longer term of patent protection but
moved to more extensive price regulation (the lower solid line). One can ask the question: how many
fewer drugs would arrive within five years with the new policy? Looking vertically at five years, the
answer is that just 15% of all drugs – rather than the previous 20% - would be launched within this
period as a result of the change in policy. One can also ask the question: with the new policy, how
much longer would it take for 20% of all drugs to be launched? Looking horizontally, the answer is
that it would take some six and a half years – rather than five – as a result of the change in policy.
Irrespective of policy regime, ten years after global launch no more than 40% of all drugs are
predicted to be on the Indian market.

24
VII. Concluding Comments
Much attention has been paid to how price controls and the patent system determine
pharmaceutical prices. We find that countries’ choices about how to regulate pharmaceutical prices
and protect innovation also have a significant influence on whether drugs become available to their
consumers and how quickly. Short-term patent protection that includes products, or long protection
only of manufacturing processes, are both patent regimes that tend to encourage more or faster
launches in the developing world. Increasing the strength of a patent system to include long-term
protection on pharmaceutical products appears to spur market entry – among the high-income
countries. For the low- and middle-income countries that are currently being encouraged to move to
stronger protection through trade policy, the evidence that extending protection enhances access to
new pharmaceuticals is mixed. There is some evidence that high levels of protection might encourage
more frequent entry of innovative products in the short term, particularly in countries where
multinationals might otherwise hesitate because local technical capacity might create competitive
pressures. On the other hand, in the longer term that same domestic capacity could be an alternative
source of entry, and we find that a country offering extensive patent protection may lose the benefits
of that activity and have fewer new products in the market overall as a result.
The fact that patent laws in the low- and middle-income countries are shown to matter at all is
also of significance. Intellectual property holders frequently assert that the poor quality of
enforcement in developing countries undermines the value of their patent rights. With the patent
variables significant in various estimations, and entering with different and plausible patterns across
subsets of the NCE, it is evident that patent laws in these countries are at least broadly meaningful.
Like intellectual property, the standard argument regarding price regulation – that it will
dissuade market entry – appears to have more relevance among the high-income countries. For these
countries, extensive price control is always found to lower the probability of market entry, and
moderate regulation appears to do likewise, even in the long run. Not so for the poorer countries.
There we find that while price regulation makes it less likely that new drugs will be available quickly,
it does not appear to prevent new products from being launched eventually.
As they stand these results might temper some of the arguments made in the course of future
international negotiations. Interpreting what they imply for public health and social welfare will
require further analysis. If, for example, ten percent of new drugs are no longer marketed in a country
due to a policy change, this may be damaging or not depending on what was in that ten percent.
Pharmaceuticals often have acceptable substitutes, and some “lifestyle” drugs may not be of great
medicinal importance. Future research will explore the therapeutic significance of the pharmaceuticals

25
that are launched slowly, or not at all, and the extent to which this failure is associated with there
being substitutes available in the market.
A very poor country may also be quite willing to accept some delay in the arrival of
innovative new pharmaceuticals as a result of regulation if it means that the drugs are priced within
reach of more of the population when they finally reach the market. With cross-country data on
product prices, this tradeoff could be assessed. Finally, giving innovators the strongest patent
protection might be viewed as worthwhile irrespective of its effect on entry, on the grounds that it
might boost R&D and the discovery of new NCE.
26
Table 1
NCE Global Launches per Year
Year
Annual
Blockbusters
Total
New Drugs
1982 4 36 1983 4 29 1984 2 34
1985
8
58
1986 10 45 1987 9 55 1988 7 43 1989 6 38
1990
12
42
1991 5 39 1992 4 43 1993 6 37 1994 9 41
1995
13
39
1996 13 42 1997 13 43 1998 13 39 1999 6 44
2000
5
35
Note: Blockbuster drugs are NCE among the top 200 drugs in terms of world revenue in 1998 or 2003 or among the top 100 in U.S. revenue in 1993 or 1995.

27
Table 2 Location of First Launch: Distribution Across Countries
Country
No. First Launches
Years of Data
Pct. Of First Launches
High Income Countries AUSTRALIA 3 21 0.28 AUSTRIA 12 21 1.28 BELGIUM 6 21 0.54 CANADA 10 21 1.02 DENMARK 18 21 1.82 FINLAND 12 21 1.19 FRANCE 44 21 4.38 GERMANY 74 21 7.36 GREECE 1 21 0.10 HONG KONG 1 21 0.09 IRELAND 15 21 1.53 ISRAEL 1 21 0.10 ITALY 61 21 6.08 JAPAN 231 21 23.99 NETHERLANDS 26 21 2.89 NEW ZEALAND 7 19 0.80 NORWAY 6 10 1.33 PORTUGAL 3 21 0.30 PUERTO RICO 16 9 3.68 SINGAPORE 6 19 0.70 SPAIN 23 21 2.38 SWEDEN 26 21 2.66 SWITZERLAND 36 21 3.67 UK 72 21 7.30 USA 163 21 16.95 Upper Income Countries ARGENTINA 7 21 0.72 BOLIVIA 1 11 0.24 BRAZIL 3 21 0.26 CHILE 1 21 0.10 CZECH REPUBLIC 1 10 0.20 MALAYSIA 5 21 0.53 MEXICO 16 21 1.66 POLAND 1 11 0.20 SOUTH AFRICA 6 21 0.65 SOUTH KOREA 1 15 0.11 TURKEY 1 21 0.09 VENEZUELA 6 21 0.58 Lower Income Countries COLOMBIA 1 21 0.07 DOMINICAN REPUBLIC 1 17 0.10 PERU 1 21 0.12 PHILIPPINES 4 21 0.45 RUSSIA 2 8 0.56 THAILAND 2 21 0.19 Low Income Countries BANGLADESH 1 10 0.19 FRENCH WEST AFRICA 2 11 0.40 PAKISTAN 1 21 0.08 Note: Total number of drugs launched = 836; launched 1995-2001 = 337. Shares are adjusted for the differing years of coverage. See Lanjouw (2005) for details.
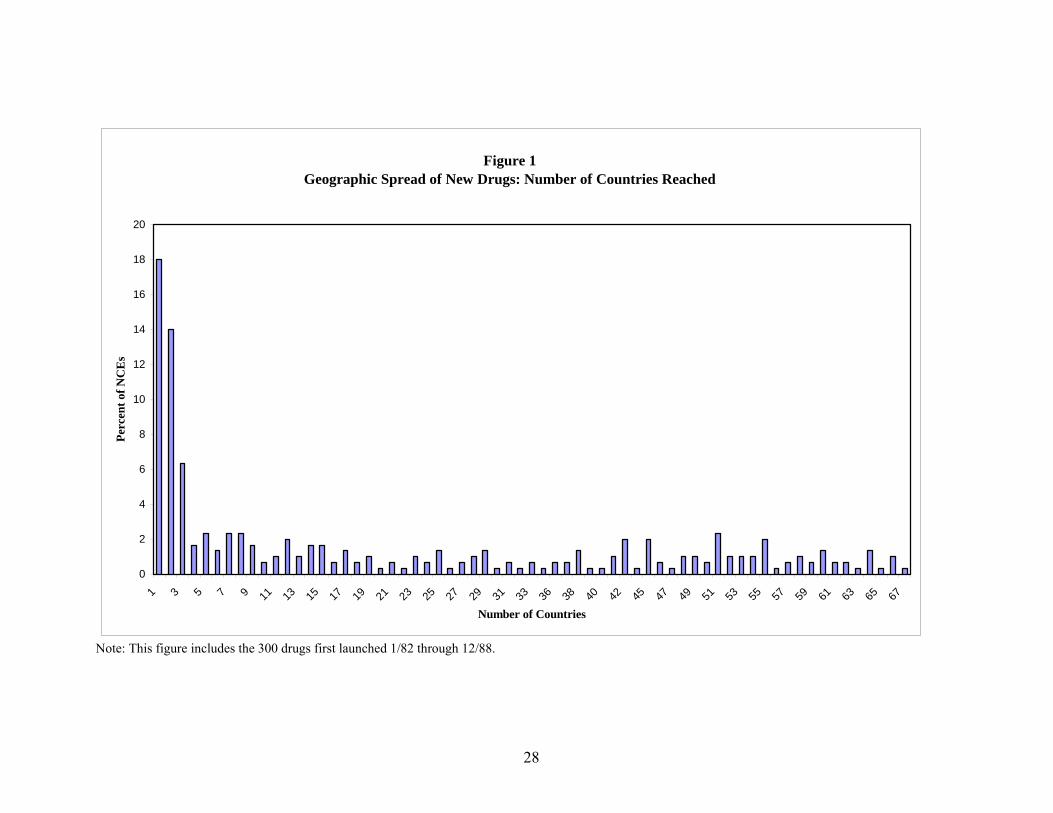
28
Figure 1Geographic Spread of New Drugs: Number of Countries Reached
0
2
4
6
8
10
12
14
16
18
20
1 3 5 7 9 11 13 15 17 19 21 23 25 27 29 31 33 36 38 40 42 45 47 49 51 53 55 57 59 61 63 65 67
Number of Countries
Perc
ent o
f NC
Es
Note: This figure includes the 300 drugs first launched 1/82 through 12/88.
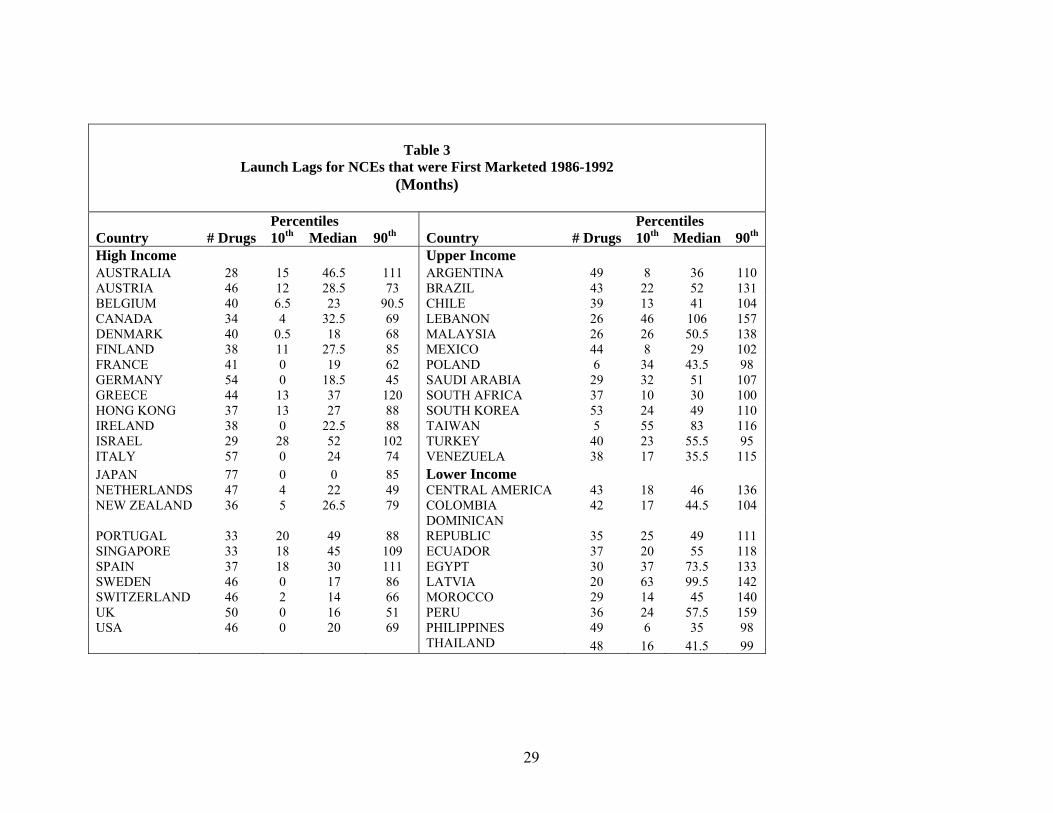
29
Table 3
Launch Lags for NCEs that were First Marketed 1986-1992 (Months)
Percentiles Percentiles Country # Drugs 10th Median 90th Country # Drugs 10th Median 90th
High Income Upper Income AUSTRALIA 28 15 46.5 111 ARGENTINA 49 8 36 110 AUSTRIA 46 12 28.5 73 BRAZIL 43 22 52 131 BELGIUM 40 6.5 23 90.5 CHILE 39 13 41 104 CANADA 34 4 32.5 69 LEBANON 26 46 106 157 DENMARK 40 0.5 18 68 MALAYSIA 26 26 50.5 138 FINLAND 38 11 27.5 85 MEXICO 44 8 29 102 FRANCE 41 0 19 62 POLAND 6 34 43.5 98 GERMANY 54 0 18.5 45 SAUDI ARABIA 29 32 51 107 GREECE 44 13 37 120 SOUTH AFRICA 37 10 30 100 HONG KONG 37 13 27 88 SOUTH KOREA 53 24 49 110 IRELAND 38 0 22.5 88 TAIWAN 5 55 83 116 ISRAEL 29 28 52 102 TURKEY 40 23 55.5 95 ITALY 57 0 24 74 VENEZUELA 38 17 35.5 115 JAPAN 77 0 0 85 Lower Income NETHERLANDS 47 4 22 49 CENTRAL AMERICA 43 18 46 136 NEW ZEALAND 36 5 26.5 79 COLOMBIA 42 17 44.5 104
PORTUGAL 33 20 49 88 DOMINICAN REPUBLIC 35 25 49 111
SINGAPORE 33 18 45 109 ECUADOR 37 20 55 118 SPAIN 37 18 30 111 EGYPT 30 37 73.5 133 SWEDEN 46 0 17 86 LATVIA 20 63 99.5 142 SWITZERLAND 46 2 14 66 MOROCCO 29 14 45 140 UK 50 0 16 51 PERU 36 24 57.5 159 USA 46 0 20 69 PHILIPPINES 49 6 35 98 THAILAND 48 16 41.5 99

30
Table 3: Continued Percentiles Country # Drugs 10th Median 90th Low Income FRENCH WEST AFRICA 10 19 47 131 INDIA 14 46 58 84 INDONESIA 42 22 43 97 PAKISTAN 38 23 57 118 (Unweighted) Means High Income 42.5 7.4 26.8 81.2 Upper Middle Income 33.5 24.5 50.9 114.1 Lower Middle Income 36.9 24.0 54.7 123.9 Low Income 26.0 27.5 51.3 107.5 Notes: The sample includes the 122 NCE from the therapy classes A2B, C, J for which Indian data are available and, for a given country, only those NCE first marketed after the country entered the database.

31
Table 4: The Arrival of New Drugs
Percent Released:
Percentage Marketed - Years After Global Launch:
Block- All Buster 1 2 3 4 5 6 7 8 925% 67% AUSTRALIA 5% 18% 39% 57% 68% 74% 83% 88% 98% 38 81 AUSTRIA 13 30 51 66 74 83 87 94 98 31 67 BELGIUM 19 40 61 72 79 85 91 94 97 30 81 CANADA 19 34 56 65 78 89 91 96 97 36 81 DENMARK 26 48 65 75 84 89 93 95 97 33 78 FINLAND 11 33 54 67 74 80 87 93 96 37 71 FRANCE 35 49 62 70 79 85 91 94 100 44 86 GERMANY 32 60 75 83 87 91 94 98 94 34 84 GREECE 6 23 41 56 69 78 85 91 97 29 73 HONG KONG 13 37 62 70 76 79 86 93 97 32 75 IRELAND 28 50 60 69 77 83 88 94 98 26 75 ISRAEL 3 17 27 52 69 74 83 93 98 49 82 ITALY 33 46 60 71 78 86 92 95 97 53 68 JAPAN 64 68 73 78 83 88 91 93 98 37 79 NETHERLANDS 31 53 68 79 84 90 92 94 94 28 NEW ZEALAND 20 41 53 65 72 81 86 91 97 29 69 PORTUGAL 11 23 40 47 65 76 84 91 98 26 56 SINGAPORE 14 35 53 66 76 82 89 95 96 36 80 SPAIN 12 28 48 61 70 78 85 92 98 34 78 SWEDEN 30 48 57 70 76 83 88 94 96 36 80 SWITZERLAND 35 56 70 79 83 87 90 92 98 40 84 UK 44 60 72 79 86 91 95 97 98 38 90 USA 34 48 62 71 78 89 93 94 93
42
84
ARGENTINA 13 27 44 60 70 76 80 84 92 32 76 BRAZIL 7 20 34 50 62 70 76 85 95 30 77 CHILE 7 25 43 53 65 74 83 91 99 22 55 MALAYSIA 13 33 56 76 83 88 91 94 98 35 79 MEXICO 14 33 47 60 73 81 87 93 95 23 70 SAUDI ARABIA 1 5 16 33 50 65 75 89 98 29 74 SOUTH AFRICA 15 35 53 63 69 77 84 91 96 31 81 TURKEY 1 10 24 35 52 64 76 88 94 26 77 VENEZUELA 4 21 38 50 64 75 84 90 95
31
82
CENTRAL AMERICA 3 19 35 46 63 72 81 88 97
31 82 COLOMBIA 6 15 30 47 59 67 79 85 91 27 74 ECUADOR 3 10 25 35 53 67 78 82 90 19 62 EGYPT 0 2 7 19 29 48 63 74 94 25 67 PERU 3 11 26 37 51 62 73 80 93 36 81 PHILIPPINES 8 25 44 58 67 74 83 86 93 34 80 THAILAND 5 23 41 55 63 71 80 88 96
26
75
INDONESIA 0 9 30 45 57 68 80 88 92 26 66 PAKISTAN 2 10 18 34 49 61 69 78 95%
Notes: “Percent Released” is the share of global NCE launched in the row country within 10 years. “Upper Bound” assumes all observations with missing ingredient information are NCEs and grosses up the total launches accordingly.
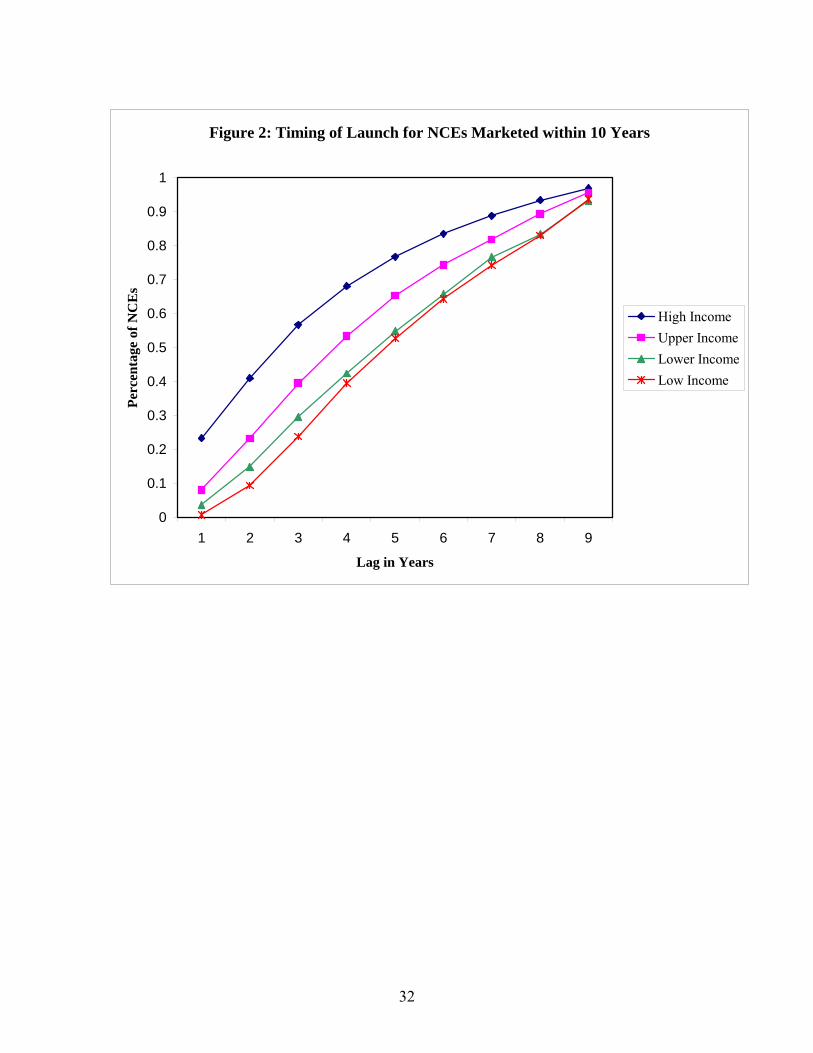
32
Figure 2: Timing of Launch for NCEs Marketed within 10 Years
0
0.1
0.2
0.3
0.4
0.5
0.6
0.7
0.8
0.9
1
1 2 3 4 5 6 7 8 9
Lag in Years
Perc
enta
ge o
f NC
Es
High IncomeUpper IncomeLower IncomeLow Income
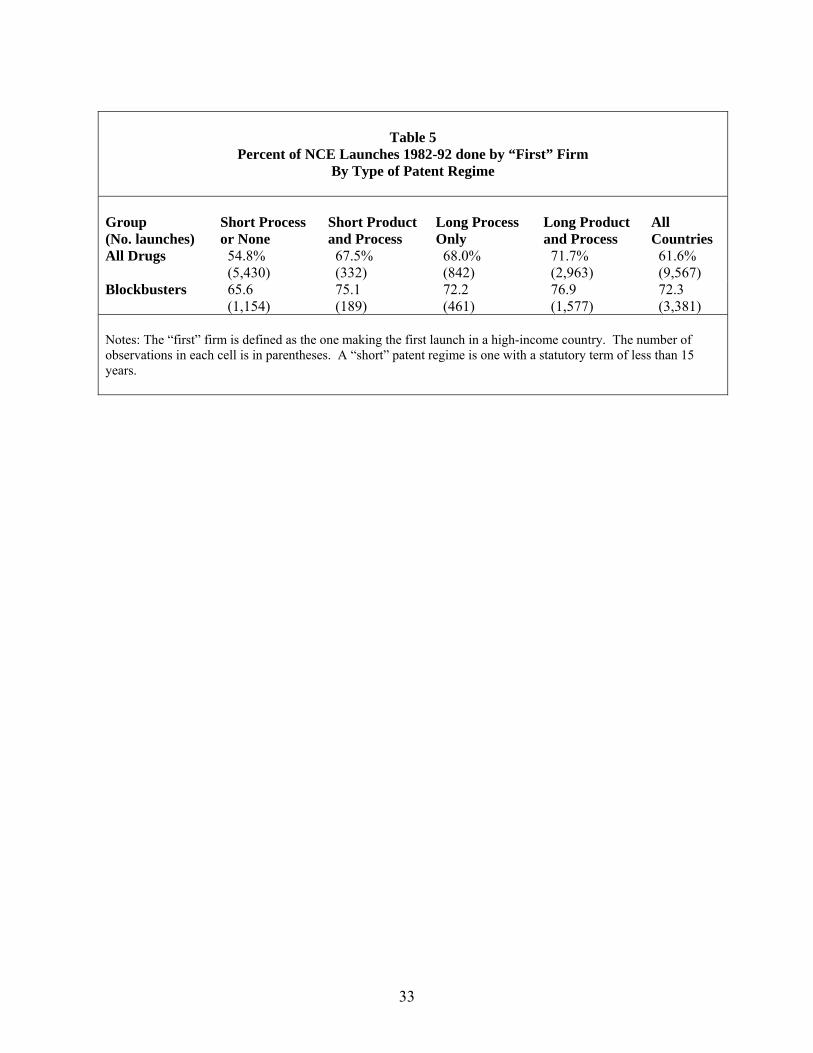
33
Table 5
Percent of NCE Launches 1982-92 done by “First” Firm By Type of Patent Regime
Group (No. launches)
Short Process or None
Short Product and Process
Long Process Only
Long Product and Process
All Countries
All Drugs 54.8% (5,430)
67.5% (332)
68.0% (842)
71.7% (2,963)
61.6% (9,567)
Blockbusters
65.6 (1,154)
75.1 (189)
72.2 (461)
76.9 (1,577)
72.3 (3,381)
Notes: The “first” firm is defined as the one making the first launch in a high-income country. The number of observations in each cell is in parentheses. A “short” patent regime is one with a statutory term of less than 15 years.

34
Figure 3: Timing of LaunchAmong NCEs Marketed by "First" or Other Firm
0
0.1
0.2
0.3
0.4
0.5
0.6
0.7
0.8
0.9
1
1 2 3 4 5 6 7 8 9
Lag in Years
Perc
enta
ge o
f NC
Es
High Income/FirstHigh Income/OtherLow Income/FirstLow Income/Other

35
Table 6: Low- and Middle-Income Countries Probability of Launch within Two Years
With Country Fixed Effects
Without Country FE Policy Variables
Marginal Effect
Estimated S.E.
Marginal Effect
Estimated S.E.
Short process patent (< 15 years)
-0.010
0.011
-0.011
0.010
Add long process (only) patents
0.034
0.015
0.033
0.016
Add short product patents (< 15 years)
0.010
0.015
0.021
0.014
Add long process & product patents
0.006
0.012
0.008
0.009
Some price control
-0.005
0.012
0.014
0.011
Extensive price control -0.028 0.010 -0.029 0.013 Essential Drug List
-0.017
0.007
-0.017*
0.009*
Other Variables
Health expenditure share Of GDP 1995/97
0.272
0.246
Private share of all Health expenditure
0.041*
0.022*
LnPopulation -0.257 0.120 0.024 0.005 LnGDPcapita -0.063 0.020 0.109 0.028 Gini Coefficient 0.016 0.006 Gini*LnGDPcapita -0.002 0.0007 Pct 65 yrs + 0.877 1.746 0.567 0.265 Pct 15-64 yrs 0.219 0.246 -0.279 0.119 Population Growth -0.401 0.430 GDP Growth 0.022 0.056 Radios per capita 1990 -0.004 0.003 Growth Radios 90-95 -0.004 0.005 Doctors/1000 in 1990 0.011 0.005 Growth Doctors 90-95 -0.0007 0.002 No. Obs./ Observed P 19901/0.089
Pseudo R2 0.155 17917/0.091
0.132 Notes: All specifications control for year of first launch and therapy class. Huber-White robust estimated standard errors allow for heteroscedasticity; and intra-country correlation in the disturbances in specifications without country fixed effects. Bold typeface and * indicate coefficients significant at α = 0.05 and 0.10, respectively. Marginal effects estimated at variables means (all data) and for a discrete change in the case of dummy variables. As a result of missing inequality information, Lebanon, Puerto Rico, Saudi Arabia and Taiwan are dropped in estimations without country FE.
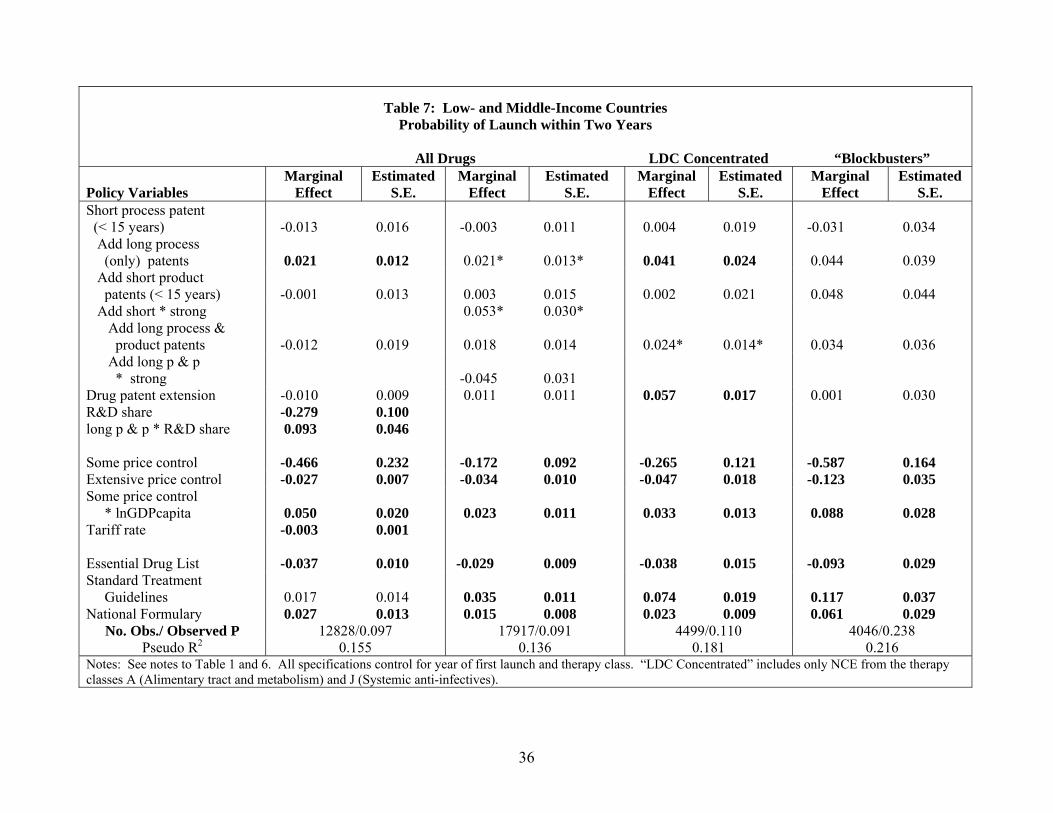
36
Table 7: Low- and Middle-Income Countries
Probability of Launch within Two Years
All Drugs LDC Concentrated “Blockbusters” Policy Variables
Marginal Effect
Estimated S.E.
Marginal Effect
Estimated S.E.
Marginal Effect
Estimated S.E.
Marginal Effect
Estimated S.E.
Short process patent (< 15 years)
-0.013
0.016
-0.003
0.011
0.004
0.019
-0.031
0.034
Add long process (only) patents
0.021
0.012
0.021*
0.013*
0.041
0.024
0.044
0.039
Add short product patents (< 15 years)
-0.001
0.013
0.003
0.015
0.002
0.021
0.048
0.044
Add short * strong 0.053* 0.030* Add long process & product patents
-0.012
0.019
0.018
0.014
0.024*
0.014*
0.034
0.036
Add long p & p * strong
-0.045
0.031
Drug patent extension -0.010 0.009 0.011 0.011 0.057 0.017 0.001 0.030 R&D share -0.279 0.100 long p & p * R&D share 0.093 0.046 Some price control
-0.466
0.232
-0.172
0.092
-0.265
0.121
-0.587
0.164
Extensive price control -0.027 0.007 -0.034 0.010 -0.047 0.018 -0.123 0.035 Some price control * lnGDPcapita
0.050
0.020
0.023
0.011
0.033
0.013
0.088
0.028
Tariff rate -0.003 0.001 Essential Drug List
-0.037
0.010
-0.029
0.009
-0.038
0.015
-0.093
0.029
Standard Treatment Guidelines
0.017
0.014
0.035
0.011
0.074
0.019
0.117
0.037
National Formulary 0.027 0.013 0.015 0.008 0.023 0.009 0.061 0.029 No. Obs./ Observed P 12828/0.097 17917/0.091 4499/0.110 4046/0.238
Pseudo R2 0.155 0.136 0.181 0.216 Notes: See notes to Table 1 and 6. All specifications control for year of first launch and therapy class. “LDC Concentrated” includes only NCE from the therapy classes A (Alimentary tract and metabolism) and J (Systemic anti-infectives).

37
Table 8 Low- and Middle-Income Countries
Probability of Launch within Two and Ten Years
Within 2 Within 10 Policy Variables
Marginal Effect
Estimated S.E.
Marginal Effect
Estimated S.E.
Short process patent (< 15 years)
-0.003
0.020
-0.012
0.035
Add long process (only) patents
0.086
0.020
0.035*
0.019*
Add short product patents (< 15 years)
0.018*
0.010*
0.075
0.022
Add long process & product patents
0.052
0.033
0.035
0.041
Drug patent extension -0.009 0.014 -0.051* 0.026* R&D share 0.055 0.073 0.255 0.100 long p & p * R&D share -0.095 0.075 -0.185* 0.105* Some price control
-0.002
0.129
0.402*
0.220*
Extensive price control -0.018* 0.011* 0.040* 0.024* Some price control * lnGDPcapita
-0.0002
0.016
-0.038
0.026
Essential Drug List
-0.024
0.023
-0.075*
0.042*
Standard Treatment Guidelines
0.025
0.022
0.089
0.041
National Formulary 0.045 0.013 0.032 0.029 No. Obs./Observed P 7099/0.057 6963/0.303
Pseudo R2 0.089 0.051 Notes: See notes to Tables 6 and 7. These estimations include only NCE first launched in 1992 or earlier.

38
Table 9: Hazard Estimations Low- and Middle-Income Countries
All Data “Blockbusters”
Policy Variables
Coefficient
Estimated S.E.
Coefficient
Estimated S.E.
Short process patent (< 15 years)
0.066
0.103
0.144
0.112
Add long process (only) patents
-0.226
0.103
-0.208*
0.111*
Add short product patents (< 15 years)
-0.243
0.121
-0.125
0.127
Add long process & product patents
0.053
0.095
0.022
0.101
Drug patent extension -0.003 0.094 -0.052 0.107 Some price control
0.133
0.103
0.024
0.115
Extensive price control 0.343 0.097 0.345 0.108 Essential Drug List
0.111*
0.061*
0.065
0.063
Standard Treatment Guidelines 0.020 0.070 0.100 0.073 Control Variables
LnPopulation 3.466 1.023 3.182 1.130 LnConsumption 0.526 0.178 0.154 0.188 Pct 65 yrs + 22.823* 13.239* 24.838 14.982 Pct 15-64 yrs γ θ
-6.303 0.556 3.275
1.996 0.012 0.160
-5.719 0.481 0.214
2.210 0.012 0.047
No. Observations. Log likelihood
21116 -17966.4
4708 -5397.2
Notes: See notes to Tables 1 and 6. Both specifications use a log-logistic hazard function with a gamma distributed multiplicative factor to capture unobserved heterogeneity. They include country, year, and therapy class fixed effects.

39
Table 10 High-Income Countries
Probability of Launch within Two Years
With Country Fixed Effects Without Country Fixed Effects Policy Variables
Marginal Effect
Estimated S.E.
Marginal Effect
Estimated S.E.
Marginal Effect
Estimated S.E.
Short product patents (< 20 years)
0.091
0.013
0.050
0.020
0.057
0.020
Add long process and/or product patents
0.031 0.013 0.064 0.039 0.059 0.045
Drug patent extension 0.006 0.021 Some price control
-0.038
0.014
-0.053
0.024
-0.667
0.243
Extensive price control -0.058 0.020 -0.127 0.025 -0.124 0.026 Some price control * lnGDPcapita
0.071*
0.036*
Essential Drug List
-0.025
0.019
-0.068
0.017
-0.084
0.033
Standard Treatment Guidelines
0.029
0.086
National Formulary -0.039 0.026 EMEA 0.034 0.017 0.026 0.042 0.041 0.043 Other Variables
Health expenditure share Of GDP 1995/97
-2.602
1.012
-2.393
1.038
Private share of all health expenditure
0.205
0.178
0.184
0.179
LnPopulation 0.436 0.129 0.041 0.006 0.043 0.006 LnGDPcapita -0.154 0.056 -0.673 0.346 -0.766 0.359 Gini Coefficient -0.256 0.111 -0.273 0.116 Gini*LnGDPcapita 0.025 0.011 0.027 0.011 Pct 65 yrs + -3.519 0.470 -0.617 0.572 -0.534 0.628 Pct 15-64 yrs -0.544 0.382 -1.610 0.435 -2.097 0.477 Population Growth -1.781* 0.987* -1.811 0.932 GDP Growth 0.265 0.364 0.282 0.336 Doctors/1000 in 1990 -0.008 0.015 -0.012 0.016 Growth Doctors 90-95 -0.052 0.044 -0.047 0.044 No. Obs./ Observed P 18889/0.205 15383/0.225 15383/0.225
Pseudo R2 0.104 0.090 0.091 Notes: See notes to Table 6. As a result of missing inequality information, Kuwait, New Zealand, Singapore and UAE are dropped from the estimations without country FE.

40
Table 11
High-Income Countries Probability of Launch
“High Quality Drugs” All Drugs
With Country FE Within 2
Within 2
Within 10
Policy Variables
Marginal Effect
Estimated S.E.
Marginal Effect
Estimated S.E.
Marginal Effect
Estimated S.E.
Short product patents (< 20 years)
0.188
0.025
0.042
0.013
-0.011
0.014
Add long process and/or product patents
0.035
0.028
0.087
0.022
0.053
0.021
Drug patent extension -0.013 0.020 0.025 0.021 Some price control
-0.056
0.029
-0.379*
0.172*
-0.638
0.128
Extensive price control -0.107 0.040 -0.095 0.017 -0.055* 0.029* Some price control * lnGDPcapita
0.041*
0.023*
0.077
0.024
Essential Drug List
0.005
0.039
-0.057
0.023
-0.089
0.019
National Formulary -0.022 0.018 -0.010 0.028 EMEA 0.088 0.031 No. Obs./ Observed P 7951/0.335 9258/0.166 9258/0.371
Pseudo R2 0.113 0.058 0.030 Notes: See notes to Tables 6. “High Quality” is the subset of NCE that are marketed in either the U.S. or the U.K. within 2 years of first global launch. The U.S. and U.K. are not included in these estimations. Results for “All Drugs” are based only on NCE first launched in 1992 or earlier and do not include country fixed effects.
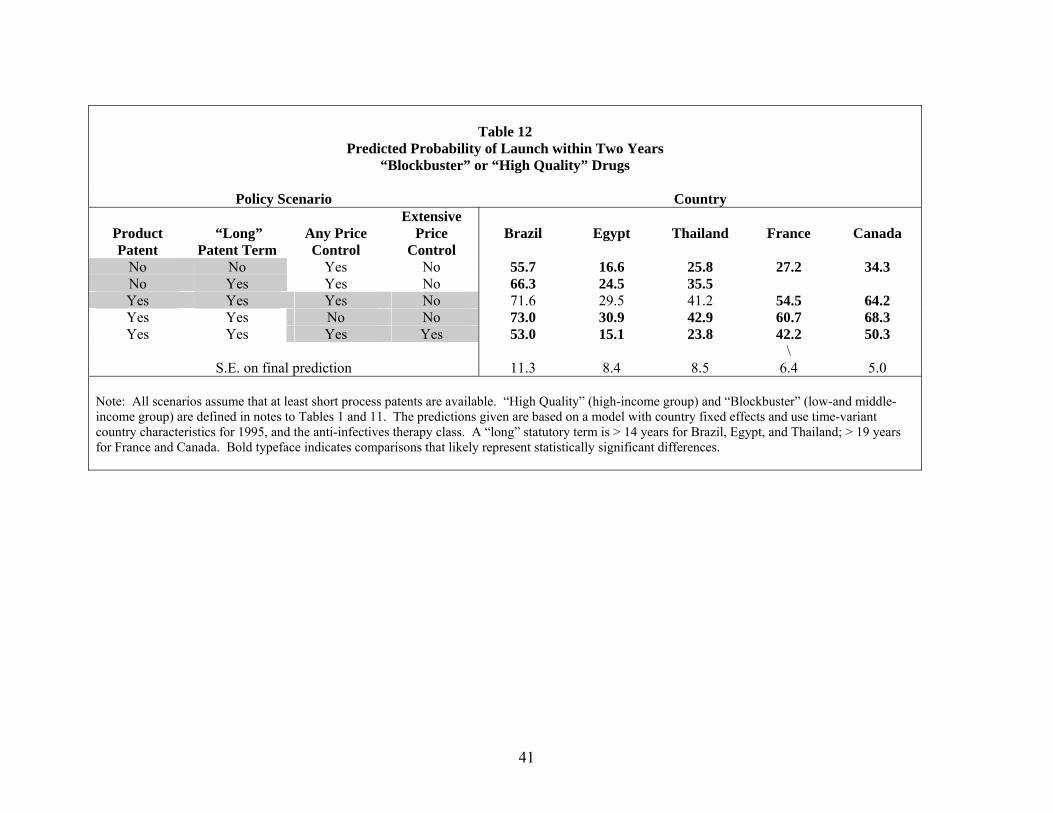
41
Table 12
Predicted Probability of Launch within Two Years “Blockbuster” or “High Quality” Drugs
Policy Scenario Country
Product Patent
“Long”
Patent Term
Any Price Control
Extensive Price
Control
Brazil
Egypt
Thailand
France
Canada
No No Yes No 55.7 16.6 25.8 27.2 34.3 No Yes Yes No 66.3 24.5 35.5 Yes Yes Yes No 71.6 29.5 41.2 54.5 64.2 Yes Yes No No 73.0 30.9 42.9 60.7 68.3 Yes Yes Yes Yes 53.0 15.1 23.8 42.2 50.3
S.E. on final prediction
11.3
8.4
8.5
\ 6.4
5.0
Note: All scenarios assume that at least short process patents are available. “High Quality” (high-income group) and “Blockbuster” (low-and middle-income group) are defined in notes to Tables 1 and 11. The predictions given are based on a model with country fixed effects and use time-variant country characteristics for 1995, and the anti-infectives therapy class. A “long” statutory term is > 14 years for Brazil, Egypt, and Thailand; > 19 years for France and Canada. Bold typeface indicates comparisons that likely represent statistically significant differences.
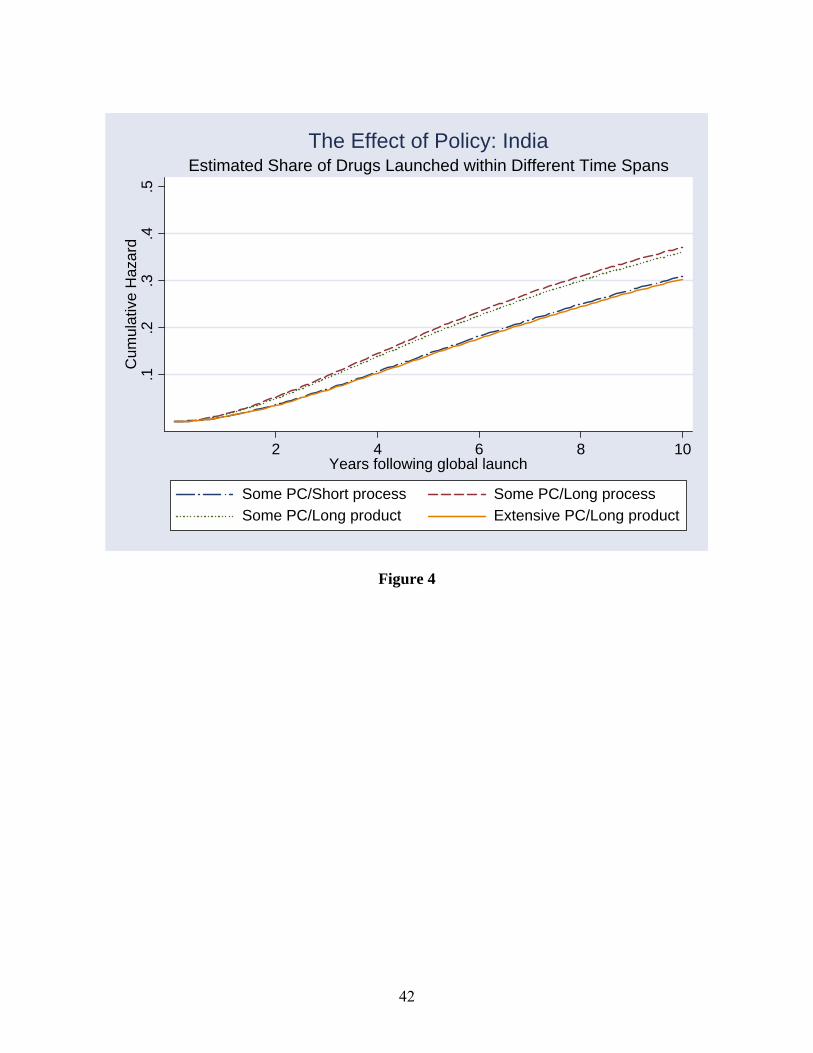
42
.1.2
.3.4
.5C
umul
ativ
e H
azar
d
2 4 6 8 10Years following global launch
Some PC/Short process Some PC/Long processSome PC/Long product Extensive PC/Long product
Estimated Share of Drugs Launched within Different Time SpansThe Effect of Policy: India
Figure 4
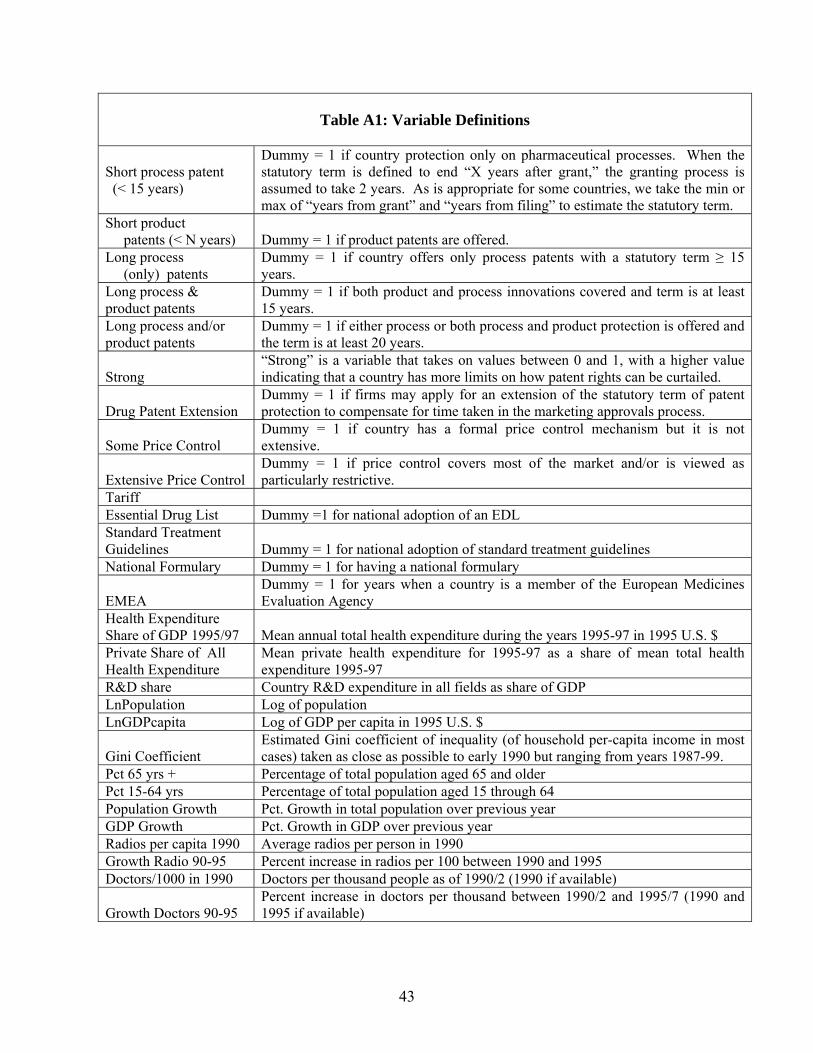
43
Table A1: Variable Definitions
Short process patent (< 15 years)
Dummy = 1 if country protection only on pharmaceutical processes. When the statutory term is defined to end “X years after grant,” the granting process is assumed to take 2 years. As is appropriate for some countries, we take the min or max of “years from grant” and “years from filing” to estimate the statutory term.
Short product patents (< N years)
Dummy = 1 if product patents are offered.
Long process (only) patents
Dummy = 1 if country offers only process patents with a statutory term ≥ 15 years.
Long process & product patents
Dummy = 1 if both product and process innovations covered and term is at least 15 years.
Long process and/or product patents
Dummy = 1 if either process or both process and product protection is offered and the term is at least 20 years.
Strong
“Strong” is a variable that takes on values between 0 and 1, with a higher value indicating that a country has more limits on how patent rights can be curtailed.
Drug Patent Extension
Dummy = 1 if firms may apply for an extension of the statutory term of patent protection to compensate for time taken in the marketing approvals process.
Some Price Control
Dummy = 1 if country has a formal price control mechanism but it is not extensive.
Extensive Price Control
Dummy = 1 if price control covers most of the market and/or is viewed as particularly restrictive.
Tariff Essential Drug List Dummy =1 for national adoption of an EDL Standard Treatment Guidelines
Dummy = 1 for national adoption of standard treatment guidelines
National Formulary Dummy = 1 for having a national formulary EMEA
Dummy = 1 for years when a country is a member of the European Medicines Evaluation Agency
Health Expenditure Share of GDP 1995/97
Mean annual total health expenditure during the years 1995-97 in 1995 U.S. $
Private Share of All Health Expenditure
Mean private health expenditure for 1995-97 as a share of mean total health expenditure 1995-97
R&D share Country R&D expenditure in all fields as share of GDP LnPopulation Log of population LnGDPcapita Log of GDP per capita in 1995 U.S. $ Gini Coefficient
Estimated Gini coefficient of inequality (of household per-capita income in most cases) taken as close as possible to early 1990 but ranging from years 1987-99.
Pct 65 yrs + Percentage of total population aged 65 and older Pct 15-64 yrs Percentage of total population aged 15 through 64 Population Growth Pct. Growth in total population over previous year GDP Growth Pct. Growth in GDP over previous year Radios per capita 1990 Average radios per person in 1990 Growth Radio 90-95 Percent increase in radios per 100 between 1990 and 1995 Doctors/1000 in 1990 Doctors per thousand people as of 1990/2 (1990 if available) Growth Doctors 90-95
Percent increase in doctors per thousand between 1990/2 and 1995/7 (1990 and 1995 if available)
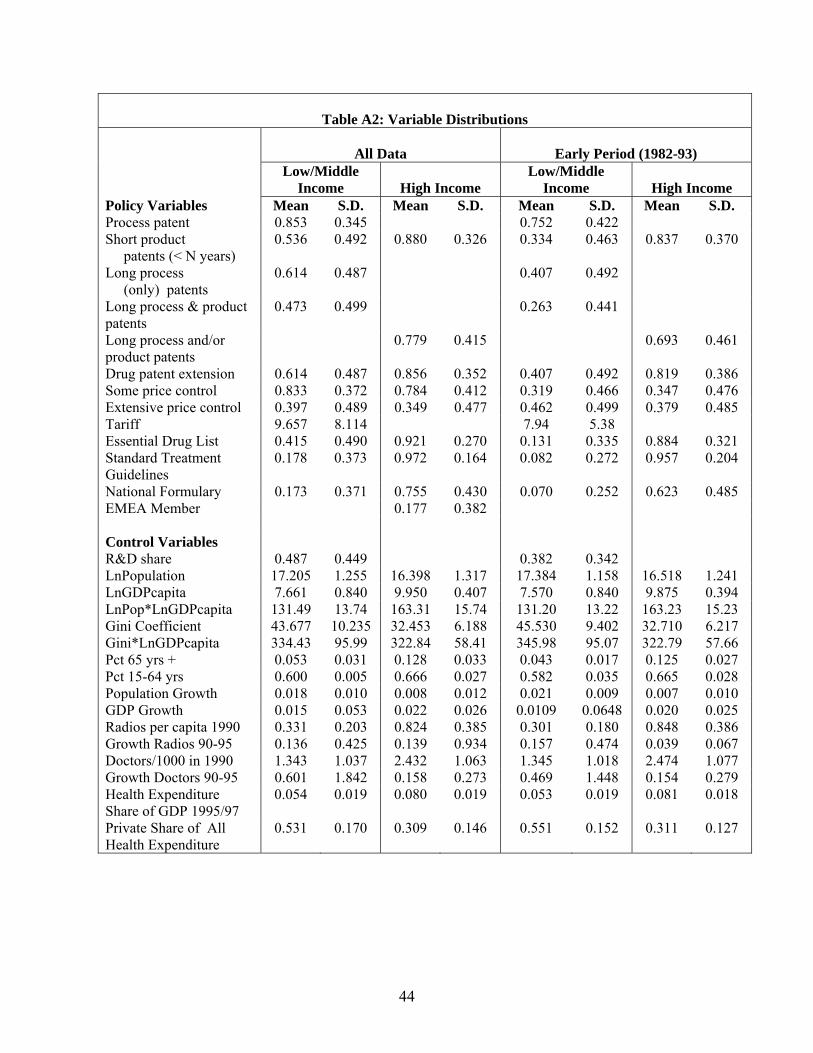
44
Table A2: Variable Distributions
All Data
Early Period (1982-93) Low/Middle
Income
High Income Low/Middle
Income
High Income Policy Variables Mean S.D. Mean S.D. Mean S.D. Mean S.D. Process patent 0.853 0.345 0.752 0.422 Short product patents (< N years)
0.536 0.492 0.880 0.326 0.334 0.463 0.837 0.370
Long process (only) patents
0.614
0.487 0.407 0.492
Long process & product patents
0.473 0.499 0.263 0.441
Long process and/or product patents
0.779 0.415 0.693 0.461
Drug patent extension 0.614 0.487 0.856 0.352 0.407 0.492 0.819 0.386 Some price control 0.833 0.372 0.784 0.412 0.319 0.466 0.347 0.476 Extensive price control 0.397 0.489 0.349 0.477 0.462 0.499 0.379 0.485 Tariff 9.657 8.114 7.94 5.38 Essential Drug List 0.415 0.490 0.921 0.270 0.131 0.335 0.884 0.321 Standard Treatment Guidelines
0.178 0.373 0.972 0.164 0.082 0.272 0.957 0.204
National Formulary 0.173 0.371 0.755 0.430 0.070 0.252 0.623 0.485 EMEA Member 0.177 0.382 Control Variables R&D share 0.487 0.449 0.382 0.342 LnPopulation 17.205 1.255 16.398 1.317 17.384 1.158 16.518 1.241 LnGDPcapita 7.661 0.840 9.950 0.407 7.570 0.840 9.875 0.394 LnPop*LnGDPcapita 131.49 13.74 163.31 15.74 131.20 13.22 163.23 15.23 Gini Coefficient 43.677 10.235 32.453 6.188 45.530 9.402 32.710 6.217 Gini*LnGDPcapita 334.43 95.99 322.84 58.41 345.98 95.07 322.79 57.66 Pct 65 yrs + 0.053 0.031 0.128 0.033 0.043 0.017 0.125 0.027 Pct 15-64 yrs 0.600 0.005 0.666 0.027 0.582 0.035 0.665 0.028 Population Growth 0.018 0.010 0.008 0.012 0.021 0.009 0.007 0.010 GDP Growth 0.015 0.053 0.022 0.026 0.0109 0.0648 0.020 0.025 Radios per capita 1990 0.331 0.203 0.824 0.385 0.301 0.180 0.848 0.386 Growth Radios 90-95 0.136 0.425 0.139 0.934 0.157 0.474 0.039 0.067 Doctors/1000 in 1990 1.343 1.037 2.432 1.063 1.345 1.018 2.474 1.077 Growth Doctors 90-95 0.601 1.842 0.158 0.273 0.469 1.448 0.154 0.279 Health Expenditure Share of GDP 1995/97
0.054 0.019 0.080 0.019 0.053 0.019 0.081 0.018
Private Share of All Health Expenditure
0.531 0.170 0.309 0.146 0.551 0.152 0.311 0.127
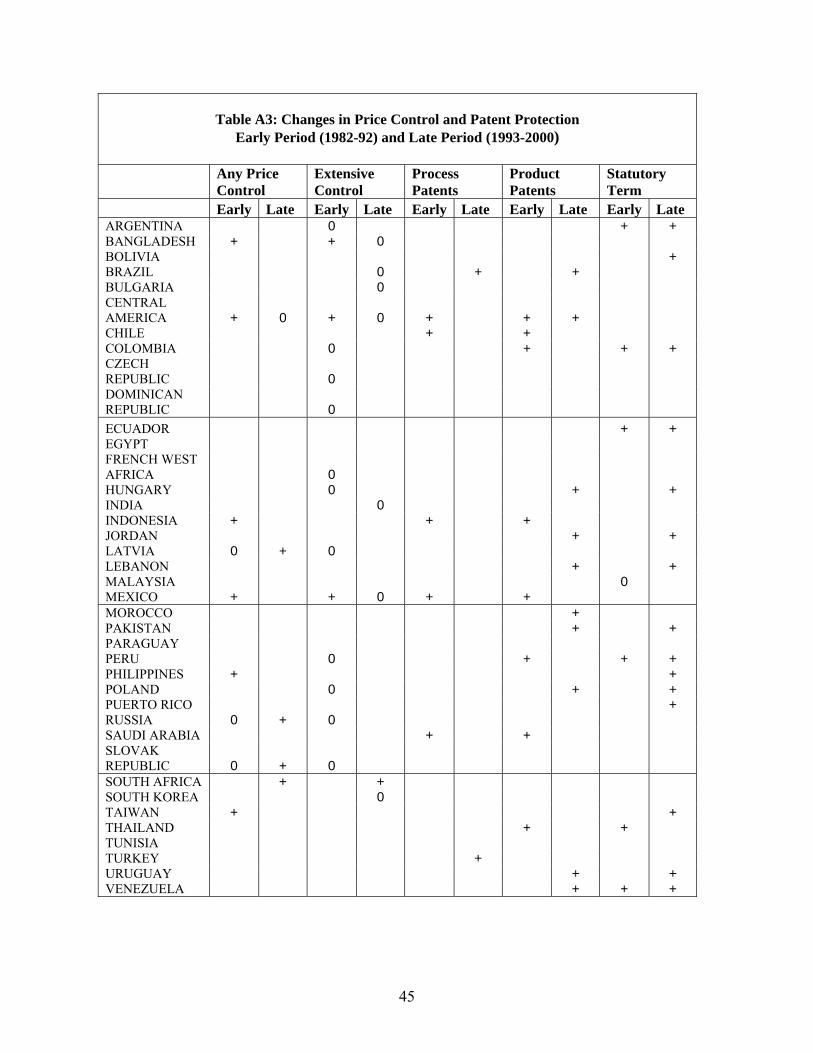
45
Table A3: Changes in Price Control and Patent Protection Early Period (1982-92) and Late Period (1993-2000)
Any Price
Control Extensive Control
Process Patents
Product Patents
Statutory Term
Early Late Early Late Early Late Early Late Early Late ARGENTINA 0 + + BANGLADESH + + 0 BOLIVIA + BRAZIL 0 + + BULGARIA 0 CENTRAL AMERICA + 0 + 0 + + + CHILE + + COLOMBIA 0 + + + CZECH REPUBLIC 0 DOMINICAN REPUBLIC 0 ECUADOR + + EGYPT FRENCH WEST AFRICA 0 HUNGARY 0 + + INDIA 0 INDONESIA + + + JORDAN + + LATVIA 0 + 0 LEBANON + + MALAYSIA 0 MEXICO + + 0 + + MOROCCO + PAKISTAN + + PARAGUAY PERU 0 + + + PHILIPPINES + + POLAND 0 + + PUERTO RICO + RUSSIA 0 + 0 SAUDI ARABIA + + SLOVAK REPUBLIC 0 + 0 SOUTH AFRICA + + SOUTH KOREA 0 TAIWAN + + THAILAND + + TUNISIA TURKEY + URUGUAY + + VENEZUELA + + +
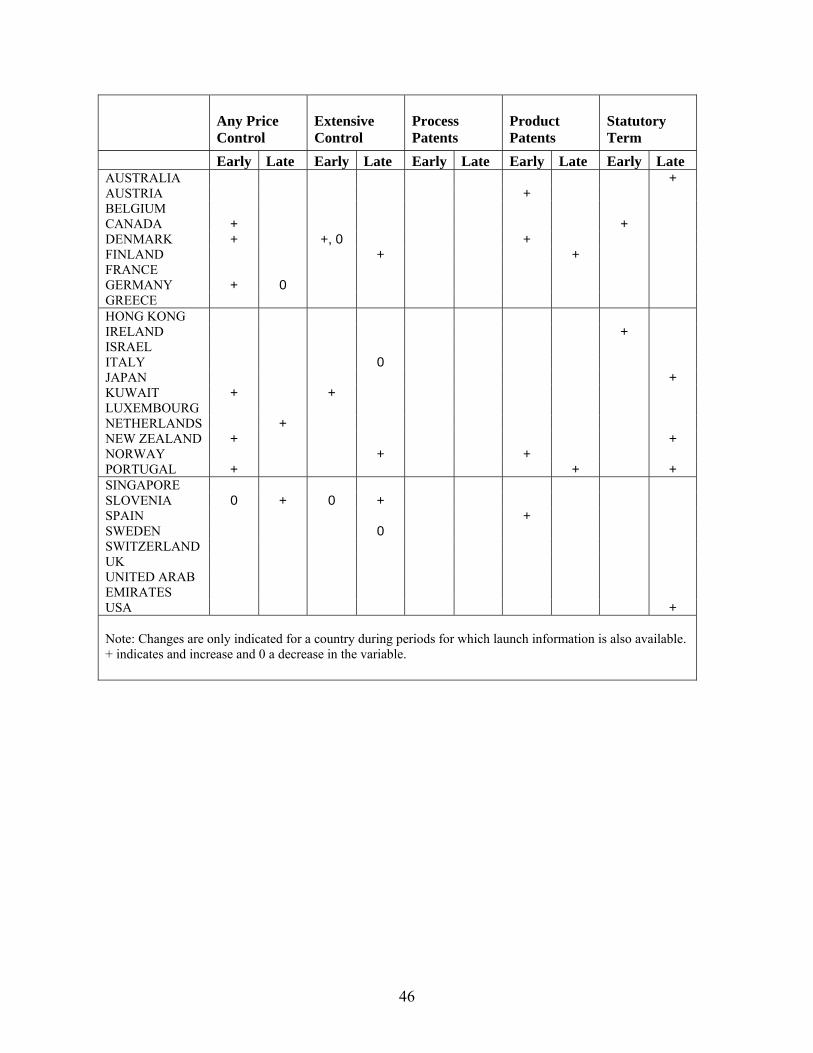
46
Any Price Control
Extensive Control
Process Patents
Product Patents
Statutory Term
Early Late Early Late Early Late Early Late Early Late AUSTRALIA + AUSTRIA + BELGIUM CANADA + + DENMARK + +, 0 + FINLAND + + FRANCE GERMANY + 0 GREECE HONG KONG IRELAND + ISRAEL ITALY 0 JAPAN + KUWAIT + + LUXEMBOURG NETHERLANDS + NEW ZEALAND + + NORWAY + + PORTUGAL + + + SINGAPORE SLOVENIA 0 + 0 + SPAIN + SWEDEN 0 SWITZERLAND UK UNITED ARAB EMIRATES USA + Note: Changes are only indicated for a country during periods for which launch information is also available. + indicates and increase and 0 a decrease in the variable.

47
Table A4: First-stage Regression Estimations The Probability of Extensive Price Control
Low- and Middle-income Countries High-income Countries
Variables Coefficient Estimated S.E. Coefficient Estimated S.E. LnPopulation -0.008 0.023 -0.059 0.021 LnGDPcapita 0.024 0.158 -3.908 0.563 Gini Coefficient -0.051* 0.031* -1.178 0.177 Gini*LnGDPcapita 0.004 0.004 0.115 0.017 Pct 65 yrs + -4.789 1.124 1.805 1.160 Pct 15-64 yrs -3.549 0.888 -5.574 1.291 Instruments Executive_right 0.447 0.063 0.181* 0.105* Executive_left 0.376 0.064 0.369 0.105 Executive_center 0.391 0.086 0.359 0.135 Executive_natl -0.412 0.071 Tenure 0.007 0.003 0.008 0.007 Military 0.201 0.050 Budget Balance -0.033 0.006 0.009 0.006
Adjusted R2 0.324 0.292 No. Obs. 435 385
Notes: The first three instruments are dummies for the economic orientation of the party of the chief executive. The fourth indicates if it is a nationalist party. Tenure is the number of years that the chief executive has been in office. Military indicates if he is a military officer. Budget balance is overall, including grants, as a percent of GDP. All instruments save tenure are lagged two years (as preferred by data). Bold typeface and * indicate coefficients significant at α = 0.05 and 0.10, respectively. Sources: Political variables, the World Bank Database of Political Institutions, downloaded from http://www.worldbank.org/research/bios/pkeefer.htm; Budget, World Development Indicators Online, 2004 (both accessed April 5, 2004).

48
General References Bloom, Nicholas and John van Reenen (1998) “Regulating Drug Prices: Where Do We Go from Here?” Fiscal Studies, Vol. 19, no. 3, pp. 321-42. Carpenter, Daniel, Brian Feinstein, Colin Moore, Marc Turenne, Ian Yohai and Evan James Zucker (2004) “Why do Bigger Firms Receive Faster Drug Approvals?” Mimeo. Department of Government, Havard University. CDRI (1996). “Patents: Indian,” Drugs and Pharmaceuticals: Industry Highlights. NISSAT. 19 (3 and 6), 35-39 and 43-48. Chaudhuri, Shubham, Penelopi Goldberg and Panle Jai (2004) “Estimating the Effects of Global Patent Protection in Pharmaceuticals: A Case Study of Quinolones in India.” Mimeo. Yale University. Danzon, Patricia, Wang, Y. Richard and Liang Wang (2005) “The Impact of Price Regulation on the Launch Delay of New Drugs,” Journal of Health Economics, Vol. 14, no. 3, pp. 269-92. Dranove, David and David Meltzer (1994) “Do important drugs reach the market sooner,” RAND Journal of Economics, Vol. 25, no. 3, pp. 402-23. Ellison, Sara Fisher and Catherine Wolfram (2004) “Coordinating on Lower Prices: Pharmaceutical Pricing under Political Pressure.” Mimeo. Haas School of Business, U.C. Berkeley. Erfle, Stephen and Henry McMillan (1990) “Media, Political Pressure, and the Firm: The Case of Petroleum Pricing in the Late 1970s,” The Quarterly Journal of Economics, pp. 115-34. Gabrowski, Henry G. and John Vernon (2000) “Effective Patent Life in Pharmaceuticals,” International Journal of Technology Management. Vol. 19, nos. ½, pp. 98-120. Ganslandt, Matthias and Keith E. Maskus (2004) “The Price Impact of Parallel Imports in Pharmaceuticals: Evidence from the European Union,” Journal of Health Economics, Vol. 23, no. 5, pp. 1035-57. Glazer, Amihai and Henry McMillan (1992) “Pricing by the Firm Under Regulatory Threat,” The Quarterly Journal of Economics, Vol. 107, no. 3, pp. 1089-99. Jack, William and Jean O. Lanjouw (2005) “Financing Pharmaceutical Innovation: How Much Should Poor Countries Contribute?” World Bank Economic Review, forthcoming. Kanavos, Panos, Joan Costa-i-Font, Sherry Merkur, Marin Gemmill (2004) “The Economic Impact of Pharmaceutical Parallel Trade in European Member States: A Stakeholder Analysis,” Special Research Paper, LSE Health and Social Care, the London School of Economics and Political Science. Kyle, Margaret (2004a) “Pharmaceutical Price Controls and Entry Strategies,” Mimeo. Fuqua School of Business, Duke University. Kyle, Margaret (2004b) “The Role of Firm Characteristics in Pharmaceutical Product Launches,” Mimeo. Fuqua School of Business, Duke University. Lanjouw, J. O. (1998) “The Introduction of Product Patents in India: “‘Heartless Exploitation of the Poor and Suffering’?” NBER Working Paper no. 6366.
49
Lanjouw, J. O. (2005) “Patents, Price Control and Access to New Drugs: How Policy Affects Global Market Entry,” NBER Working Paper, forthcoming. Malueg, David and Marius Schwartz (1994) “Parallel imports, demand dispersion, and international price discrimination,” Journal of International Economics, Vol. 37, pp. 167-95. McCalman, Philip (2004) “International Diffusion and Intellectual Property Rights: An Empirical Analysis,” Journal of International Economics. (forthcoming). Department of Economics, U.C. Santa Cruz. Rivers, Douglas and Quang H. Vuong (1988) “Limited Information Estimators and Exogeneity Tests for Simultaneous Probit Models,” Journal of Econometrics. Vol. 39, pp. 347-66. Sell, Susan (2003) Private Power, Public Law: the Globalization of Intellectual Property. Cambridge Studies in International Relations. Scherer, F.M. and Jayashree Watal (2002) Post-TRIPS Options for Access to Patented Medicines in Developing Nations,” Journal of International Economic Law, Vol. 5, pp. 913-939.