path selection and propagation prediction
TRANSCRIPT
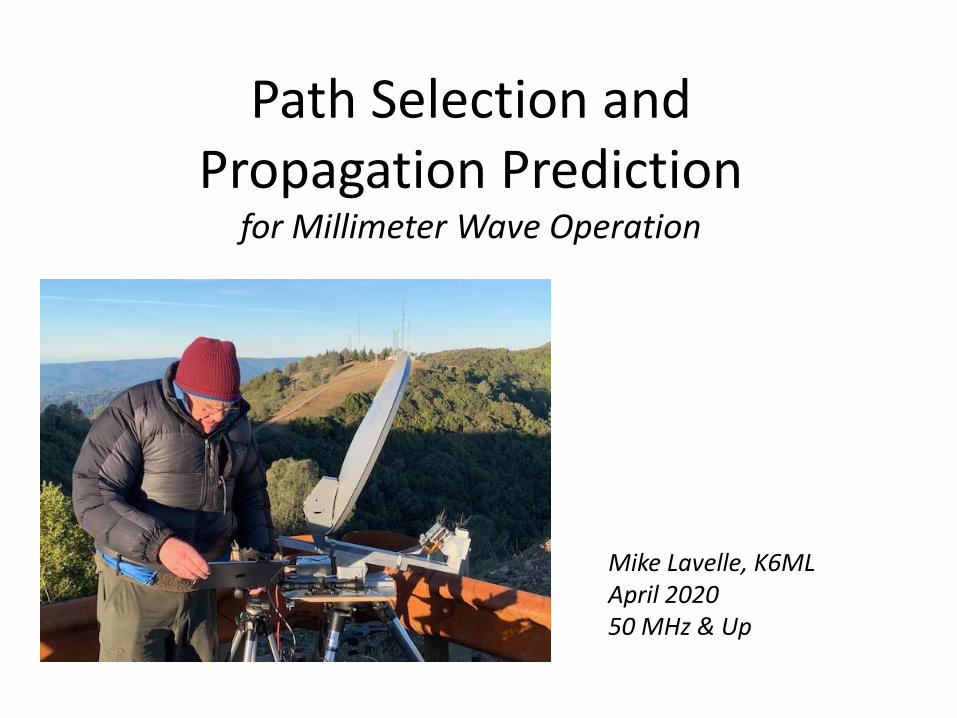
Path Selection andPropagation Prediction
for Millimeter Wave Operation
Mike Lavelle, K6MLApril 2020 50 MHz & Up

Outline
• Review: Free Space Path Loss & the Link Budget
• Overview: Propagation at cm & mm waves
• Site Selection & Orientation to Target
• Predicting mm wave “Openings”
For the easier cm wave and shorter mm wave contacts,
we don’t need to use every last one of these techniques

Free Space Path Loss
• Free space path loss is the spreading loss as a signal radiates outward in all directions from its source– no atmospheric effects
– no blockage
FSPL (in dB) = -92.5 - 20 log Range (in km) - 20 log Freq (in GHz)
• 1/R2, 10x distance increase, FSPL increases 100x (20 dB)
• 1/F2, 10x frequency increase, FSPL increases 100x (20 dB)
GHz 100km
10 -152
24 -160
47 -166
80 -171
123 -174
134 -175
241 -180

Antenna Gain • Gain antennas focus their Rx/Tx beam into a narrow fraction of the sphere
dBi gain = +18.2 + 20 log Diameter (in cm) + 20 log Freq (in GHz)
• 2x frequency = 4x more gain (+6 dB)• 2x diameter = 4x more gain (+6 dB)• 2x diameter or 2x frequency = half the beam width (harder to point)
Band D = 60 cm (2’) D = 120 cm (4’)
GHz Gain (dBi) Beam (deg) Gain (dBi) Beam (deg)
10 34 3 40 1.5
24 41 1.3 47 0.65
47 47 0.66 51 0.33
80 52 0.38 58 0.19
123 56 0.25 62 0.13
134 56 0.24 56 0.12
241 61 0.13 67 0.06

System Gain• Credits
– Tx Power (dBM)
– Tx Antenna (dBi)
– Rx Antenna (dBi)
• Debits– Thermal Noise Floor (-174 dBm in 1 Hz)
– Rx Noise Figure (dB)
– Rx Bandwidth (10 log BW) (eg, -34 dB for 2500 Hz SSB)
Gain dB = Tx dBm + Tx dBi + Rx dBi – NF dB – BW dB – 174 dBm

Typical System GainsAt higher bands, system gain drops & antenna pointing is harder
• Antenna Gain goes up @ higher bandsIf we keep size constant (but it does get harder to point)
With an antenna at each end, we get double the dBs
• Tx Power, Rx NF get worse @ higher bandsHigher band (80 GHz and up) numbers below are optimistic
2500 Hz SSB BW assumed; narrower modes (CW, digital) have better gain
GHz 60cm Dish Tx dBm Rx NF Sys Gain
10 34 40 1 247
24 41 35 2 256
47 47 30 4 260
80 52 20 6 257
123 55 -3 10 236
134 56 -4 11 236
241 61 -12 20 222

Link BudgetSignal/Noise = System Gain – Path Loss
• System Gain overcomes Path Loss to deliver Signal
• System Gain falls as we go to higher bands
• Path Loss increases as we go to higher bands (1/F2)– And I haven’t talked about extra losses yet!
– Above 20 GHz, moisture and weather hit us harder and harder
– At 122 GHz, we also get hit by oxygen
• Result: SNR (or max range) falls as we go to higher bands
By the way, we can ‘measure’ Sys Gain = observed SNR + calculated Path Loss
– Use several paths on good WX days to find System Gain
– Then predict SNR for a new path using new calc PL and measured Sys Gain
– New SNR will decrease by the same amount that PL increases
• Our strategy:
Choose the path & forecast the weather so as to reduce path loss(and use low BW modes … like CW & digital)

An Overview of Propagation (at centimeter & millimeter waves)
• Line of Sight Path (FSPL) is the baseline– Things mostly go downhill (extra losses) from there
• Obstacles Always Hurt– Foliage, Buildings, Hills, Earth’s Curvature (loss or total blockage)
– Bounces and Knife Edge Refraction can get us around blockages• But they have extra losses and generally take a longer path
• Atmospheric Refraction Helps– Air temp decreases with elevation: “4/3 earth radius” extends horizon blockage point
– Ducting enhancements/temperature inversions can go even further
• Atmospheric Losses --- dominate at mm waves– Vary with altitude and weather along the path; increase with freq > 20 GHz
– Atmospheric Gas attenuation (water vapor, oxygen)
– Clouds, Rain, Fog, etc attenuation
• Scatter – Aircraft, Rain, Snow, Clouds, Tropo
• Multipath
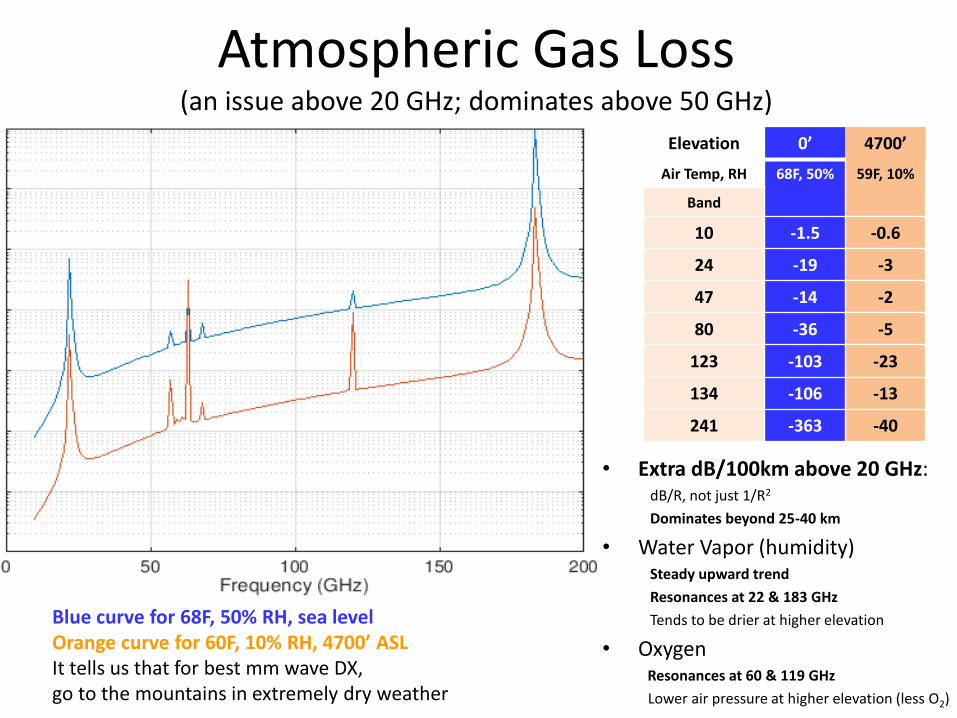
Atmospheric Gas Loss(an issue above 20 GHz; dominates above 50 GHz)
• Extra dB/100km above 20 GHz:dB/R, not just 1/R2
Dominates beyond 25-40 km
• Water Vapor (humidity)Steady upward trend
Resonances at 22 & 183 GHz
Tends to be drier at higher elevation
• OxygenResonances at 60 & 119 GHz
Lower air pressure at higher elevation (less O2)
Elevation 0’ 4700’
Air Temp, RH 68F, 50% 59F, 10%
Band
10 -1.5 -0.6
24 -19 -3
47 -14 -2
80 -36 -5
123 -103 -23
134 -106 -13
241 -363 -40
Blue curve for 68F, 50% RH, sea levelOrange curve for 60F, 10% RH, 4700’ ASLIt tells us that for best mm wave DX,go to the mountains in extremely dry weather

Clouds, Rain, etc
• Rain loss >>> moisture loss– Drizzle 2-3x H2O dB loss; moderate rain 10x H2O dB loss
• Rain scatter best @ 10 GHz– Rain WX radars operate in S and X bands; good match to size of rain drops– Above 10G, rain scatter increases, but mainly as a focused forward scatter; over 100G, acts
like a very focused lens– The useful scattering volume is likely surrounded by excess moisture, drizzle and clouds (very
lossy at higher bands)– Except for in-line forward scatter, scatter lengthens the path
• Cloud loss >> moisture loss– Cloud WX radars run in the 35-95 GHz range
• Conclusion: avoid rain, fog & clouds
Other Scatter Modes• Aircraft scatter: doppler increases, strong forward scatter focusing• Tropo scatter: high scatter loss, great DX if you have excess system gain (cm waves)
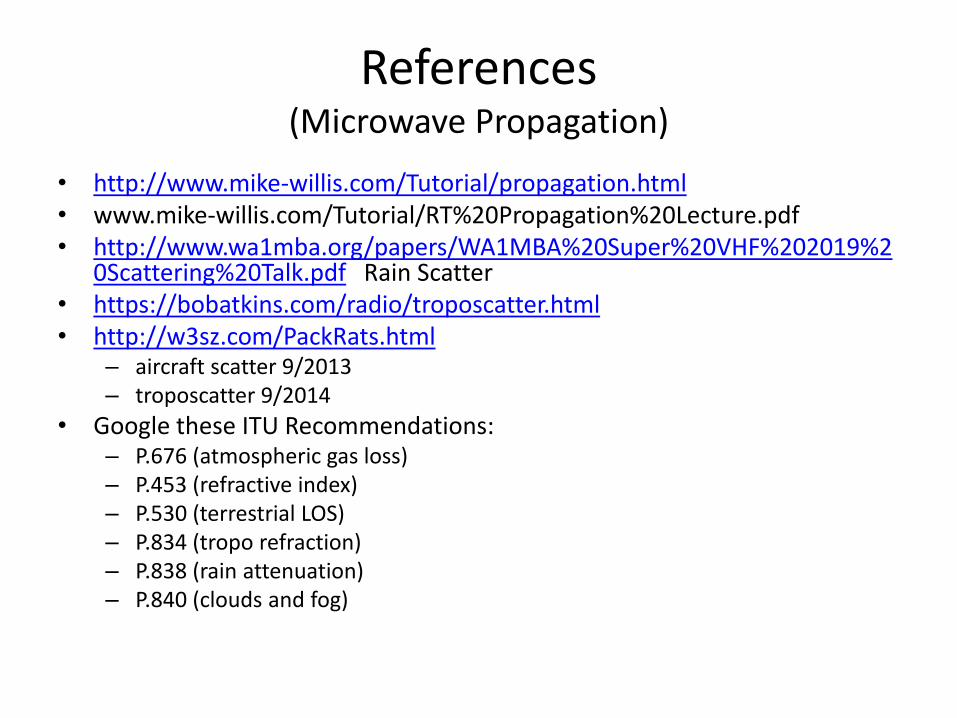
References (Microwave Propagation)
• http://www.mike-willis.com/Tutorial/propagation.html• www.mike-willis.com/Tutorial/RT%20Propagation%20Lecture.pdf • http://www.wa1mba.org/papers/WA1MBA%20Super%20VHF%202019%2
0Scattering%20Talk.pdf Rain Scatter• https://bobatkins.com/radio/troposcatter.html• http://w3sz.com/PackRats.html
– aircraft scatter 9/2013– troposcatter 9/2014
• Google these ITU Recommendations:– P.676 (atmospheric gas loss)– P.453 (refractive index)– P.530 (terrestrial LOS)– P.834 (tropo refraction)– P.838 (rain attenuation)– P.840 (clouds and fog)
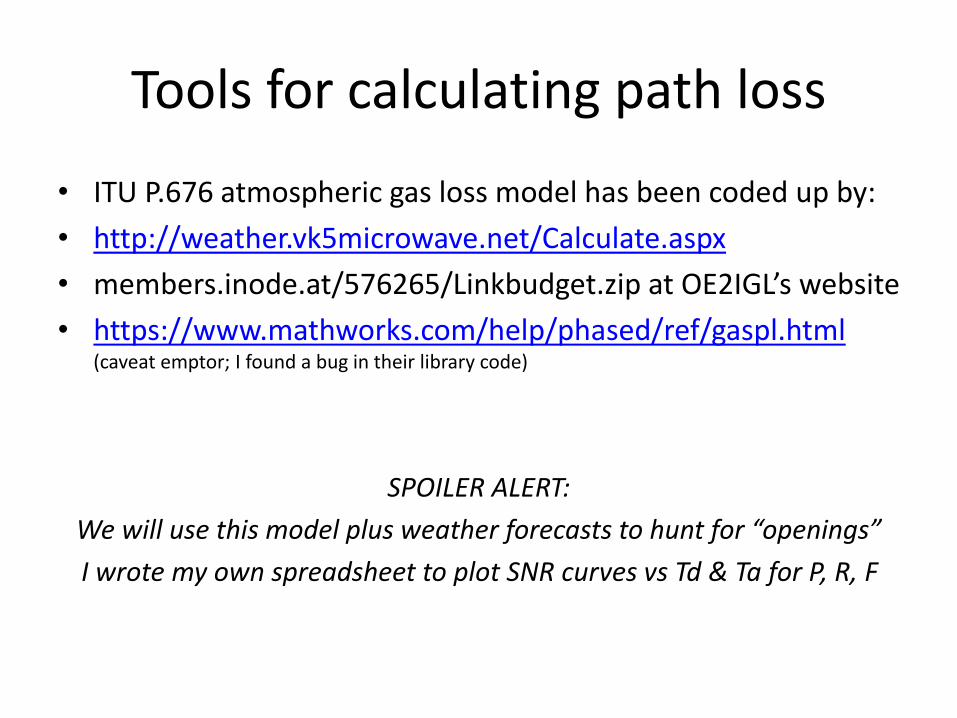
Tools for calculating path loss
• ITU P.676 atmospheric gas loss model has been coded up by:
• http://weather.vk5microwave.net/Calculate.aspx
• members.inode.at/576265/Linkbudget.zip at OE2IGL’s website
• https://www.mathworks.com/help/phased/ref/gaspl.html(caveat emptor; I found a bug in their library code)
SPOILER ALERT:
We will use this model plus weather forecasts to hunt for “openings”
I wrote my own spreadsheet to plot SNR curves vs Td & Ta for P, R, F
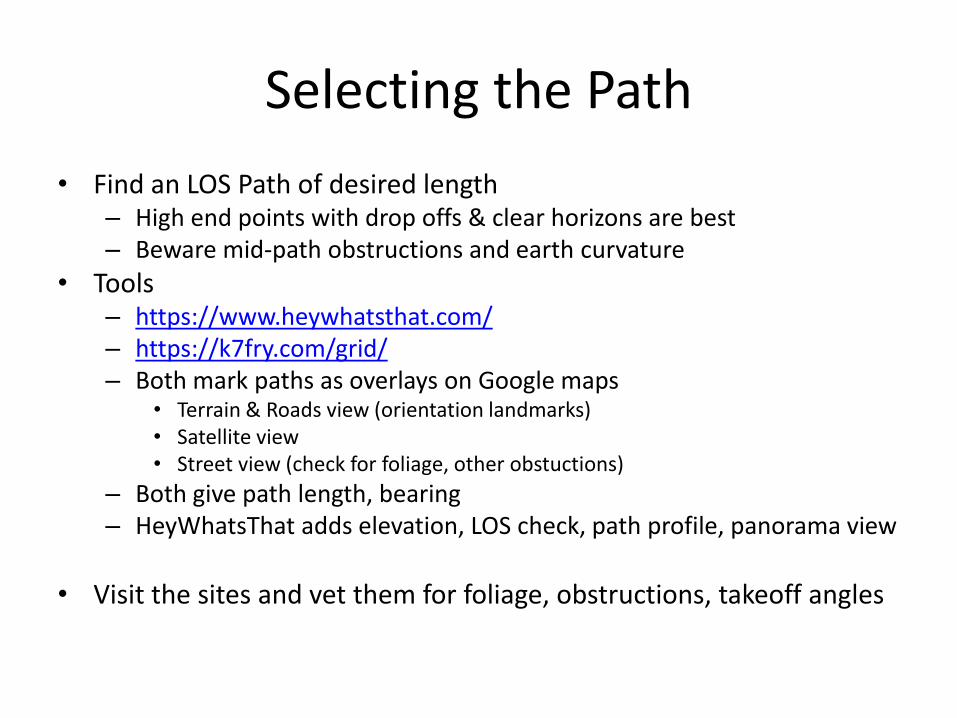
Selecting the Path
• Find an LOS Path of desired length– High end points with drop offs & clear horizons are best– Beware mid-path obstructions and earth curvature
• Tools– https://www.heywhatsthat.com/– https://k7fry.com/grid/– Both mark paths as overlays on Google maps
• Terrain & Roads view (orientation landmarks)• Satellite view• Street view (check for foliage, other obstuctions)
– Both give path length, bearing– HeyWhatsThat adds elevation, LOS check, path profile, panorama view
• Visit the sites and vet them for foliage, obstructions, takeoff angles

YES! Both ends high
NO Obstructions
NOT below horizon(HeyWhat’sThat has refraction option)
Start with a Line Of Sight (LOS) PathHeyWhat’sThat Elevation Profiles

On Site: Alignment to TargetWe are talking fraction of a degree beam widths @ mm waves
• Binocs & Smartphone/Tablet – Compass, GPS in mobile device for rough orienatation
– HeyWhat’sThat, k7fry plan views
– Hunter Theodolite mobile app
– https://www.peakfinder.org/ horizon view (AR)• Precise orientation using foreground and horizon landmarks
• Rifle Scope pre-aligned to beam
• Lower band radio pre-aligned to higher band radio– Higher SNR at lower band (40-60 dB)
– QSY and bingo!

Alignment Tools
Hey What’s That – bearing, elevation, horizonPlan view of path to target relative to roadsStructures & trees.
Peak Finder: Augmented reality
Runs on smartphone/iPad
Uses compass, GPS to orient line drawing of horizon & foreground landmarks
Tilt control >
View from Mt Vaca towards Mt Um
< Zoom control
FOV indication >
+ azimuth ticks +v v
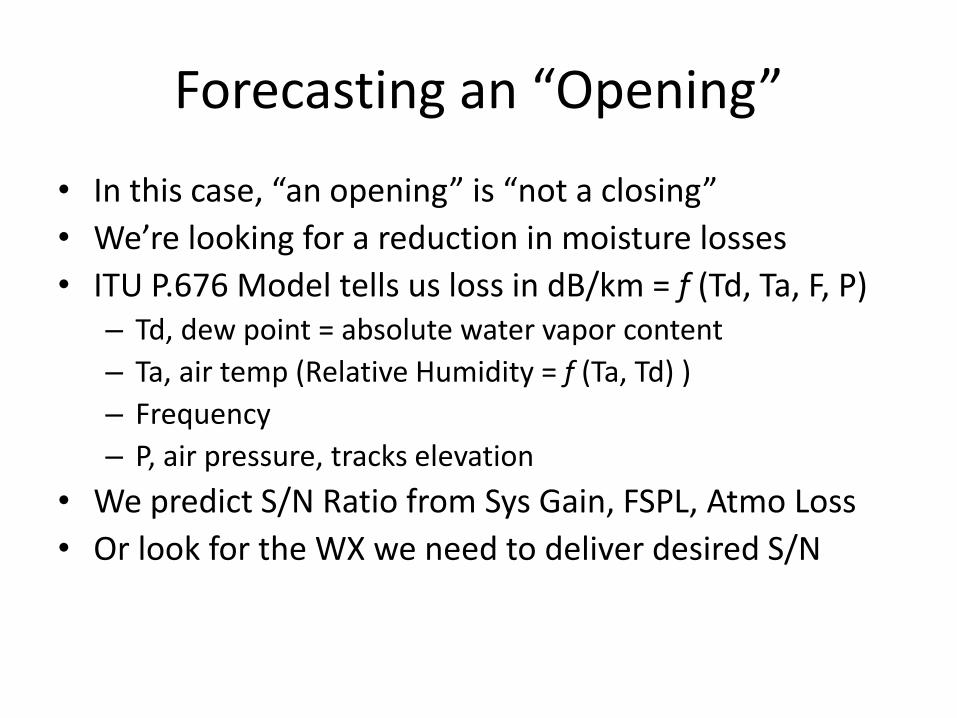
Forecasting an “Opening”
• In this case, “an opening” is “not a closing”
• We’re looking for a reduction in moisture losses
• ITU P.676 Model tells us loss in dB/km = f (Td, Ta, F, P) – Td, dew point = absolute water vapor content
– Ta, air temp (Relative Humidity = f (Ta, Td) )
– Frequency
– P, air pressure, tracks elevation
• We predict S/N Ratio from Sys Gain, FSPL, Atmo Loss
• Or look for the WX we need to deliver desired S/N

Reducing path loss or Finding “Openings”(122 GHz examples)
In descending order of importance (1 > 2 > 3 > 4)
1. Find two mountains with LOS … the higher the better …– More distant horizon– Lower water content– Lower (oxygen) pressure
2. Look for a very low dew point day ( Tdew < -20 ⁰C )– Dew point is the air temp at which water saturation (dew, fog, mist, rain) occurs– Dew point is a direct (absolute) measure of how much water vapor is in the air– Looking for a dry air duct between the two mountains– Beware: path “sags” in middle (usually wetter)
3. Look for high dew spread ( Tair – Tdew ) = low relative humidity (RH)– RH (or dew spread) measures how close we are to saturation at current air temp (not how much water)
4. Use the top end of the band to get away from the 119 GHz O2 absorption line.
Tair – Tdew RH Weather
0 ⁰C 100% Dew/frost/rain…
10 ⁰C ~45% Everyday
20 ⁰C ~22% Pretty Dry
30 ⁰C ~11% Verrrrrry Dry
40 ⁰C ~6% Bone Dry

0
6
12
18
24
30
36
42
48
54
60
-34 -31 -28 -25 -22 -19 -16 -13 -10 -7 -4 -1 2 5 8 11 14 17
Atmo Loss (dB) vs Dew Point (C), various Dew/Temp Spreads
T = D + 0
T = D + 10
T = D + 20
T = D + 30
T = D + 40
Atmospheric Loss (in 1 “S” unit steps)vs Dew Point (in 3 ⁰C steps) for variousDew/Temp spreads (in 10 ⁰C steps)
• 2 S units for < -13 ⁰C Td & 20 ⁰C spread• Over 10 S units when not dry
Compared to …………………………….an easier 15 km QSO• FSPL went up 8 dB (to 166 dB)• Atmospheric loss went up 6 to 60 dB!
SNR (dB), assuming a 213 dB system gain
• Dashed grey line is weak CW copy• Dry days are “S6-S7” copy• A wet day can shut this path down
• Our first attempt failed (eve. dew)• Next day was dry and strong signals
40 km QSO(Sierra Rd – Windy Hill)
K6ML <-> KB6BA
0
6
12
18
24
30
36
42
48
54
60
-34 -31 -28 -25 -22 -19 -16 -13 -10 -7 -4 -1 2 5 8 11 14 17
Atmo Loss (dB) vs Dew Point (C), various Dew/Temp Spreads
T = D + 0
T = D + 10
T = D + 20
T = D + 30
T = D + 40
-36
-30
-24
-18
-12
-6
0
6
12
18
24
30
36
42
48
-34 -31 -28 -25 -22 -19 -16 -13 -10 -7 -4 -1 2 5 8 11 14 17
SNR (dB in 2500 Hz) vs Dew Point (C), various Dew/Temp Spreads
T = D + 0
T = D + 10
T = D + 20
T = D + 30
T = D + 40
weak CW
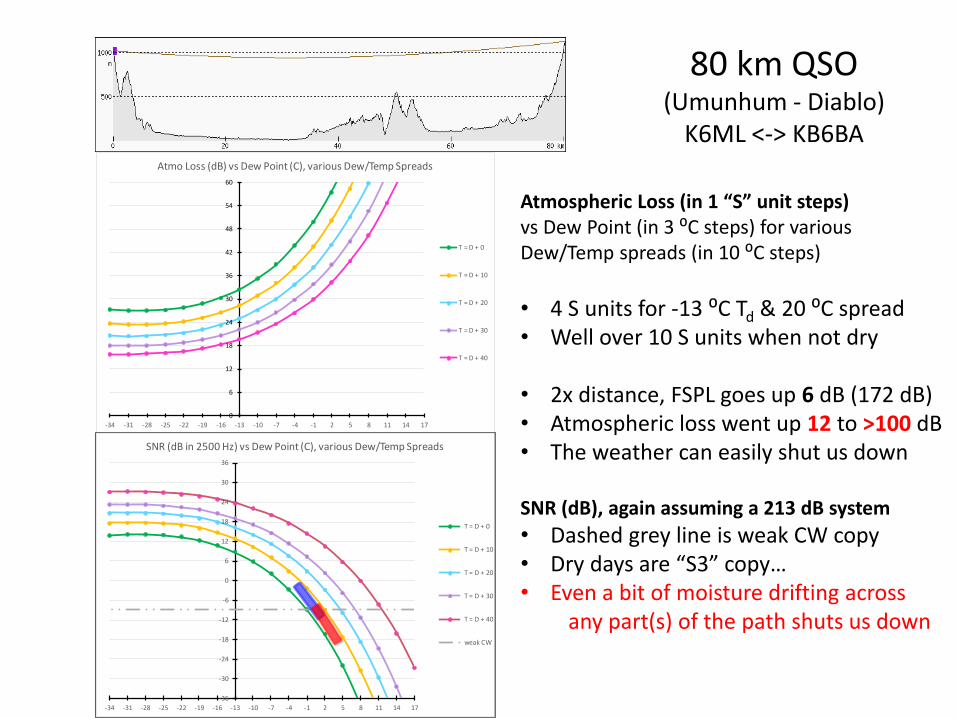
80 km QSO(Umunhum - Diablo)
K6ML <-> KB6BA
Atmospheric Loss (in 1 “S” unit steps)vs Dew Point (in 3 ⁰C steps) for variousDew/Temp spreads (in 10 ⁰C steps)
• 4 S units for -13 ⁰C Td & 20 ⁰C spread• Well over 10 S units when not dry
• 2x distance, FSPL goes up 6 dB (172 dB)• Atmospheric loss went up 12 to >100 dB• The weather can easily shut us down
SNR (dB), again assuming a 213 dB system
• Dashed grey line is weak CW copy• Dry days are “S3” copy…• Even a bit of moisture drifting across
any part(s) of the path shuts us down
0
6
12
18
24
30
36
42
48
54
60
-34 -31 -28 -25 -22 -19 -16 -13 -10 -7 -4 -1 2 5 8 11 14 17
Atmo Loss (dB) vs Dew Point (C), various Dew/Temp Spreads
T = D + 0
T = D + 10
T = D + 20
T = D + 30
T = D + 40
-36
-30
-24
-18
-12
-6
0
6
12
18
24
30
36
-34 -31 -28 -25 -22 -19 -16 -13 -10 -7 -4 -1 2 5 8 11 14 17
SNR (dB in 2500 Hz) vs Dew Point (C), various Dew/Temp Spreads
T = D + 0
T = D + 10
T = D + 20
T = D + 30
T = D + 40
weak CW

Haze/moisture rising at mid path(Sunol Ridge, caused QSB and dropouts)
KB6BA on Mt Umunhum
K6ML on Mt Diablo

Searching for the perfect wave …Searching in time & 2-D space
Tool: www.windy.comDew Point forecasts, Fri 1 pm thru Sat 4 pm
Fri 1300 Sat 0400 Sat 1000 Sat 1300 (wow!) Sat 1600
We want purple (close to -20C dew point) OVER THE ENTIRE PATH if possible…Doesn’t happen very often or for very long
BTW: I use “custom colors” to set color scale to highlight the path’s max. usable dew pt.

Searching for the perfect wave in 4-Dmoisture varies with elevation, too
“Skew-T” plots of dew pt(blue) and air temp (red)
vs
elevation (blue horiz lines, expressed in mbars of pressure)
Skewed red lines are constant temp/dew pt lines
Wide gap between blue (dew pt)& red (air temp) lines shows a“dry duct” at 850-800 mbars(1500-2000m elevation)(-37C dew / +5C temp / ~ 5% RH)
Forecasts: https://rucsoundings.noaa.gov/Archives: http://weather.uwyo.edu/upperair/sounding.html

Searching for the perfect wave…Sat 1300 viewed at correct altitudes along the path
1500m (too high)
900m (Mt Um) 600m (midpoint ‘droop’) 750m (Mt Vaca)

139 km QSO(Umunhum - Vaca)
New World Record
K6ML <-> KB6BA & N9JIM
0
6
12
18
24
30
36
42
48
54
60
-34 -31 -28 -25 -22 -19 -16 -13 -10 -7 -4 -1 2 5 8 11 14 17
Atmo Loss (dB) vs Dew Point (C), various Dew/Temp Spreads
T = D + 0
T = D + 10
T = D + 20
T = D + 30
T = D + 40
-36
-30
-24
-18
-12
-6
0
6
12
18
-34 -31 -28 -25 -22 -19 -16 -13 -10 -7 -4 -1 2 5 8 11 14 17
SNR (dB in 2500 Hz) vs Dew Point (C), various Dew/Temp Spreads
T = D + 0
T = D + 10
T = D + 20
T = D + 30
T = D + 40
weak CW
Atmospheric Loss (in 1 “S” unit steps)vs Dew Point (in 3 ⁰C steps) for variousDew/Temp spreads (in 10 ⁰C steps)
• 7.5 S units for -13 ⁰C Td & 20 ⁰C spread• Well over 10 S units when not dry• FSPL goes up 5 dB (177 dB) from 80 km• Atmospheric loss went up 21 to >100 dB
• The weather is THE critical factor…• First attempt failed
✓ Midpoint much worse than end pts
• About 2 weeks later, better WX = success✓ Over 8 S units of atmos. Loss✓ Much better midpoint condx
SNR (dB), again assuming a 213 dB system
• Very dry days are “weak CW” copy…• Even if we can get dry endpoints,
Wet points along the path can sink us