pathofusion: an open-source ai framework for recognition
TRANSCRIPT
cancers
Article
PathoFusion: An Open-Source AI Framework for Recognitionof Pathomorphological Features and Mapping ofImmunohistochemical Data
Guoqing Bao 1 , Xiuying Wang 1,*, Ran Xu 2,3, Christina Loh 2, Oreoluwa Daniel Adeyinka 2 , Dula Asheka Pieris 2,Svetlana Cherepanoff 4,5, Gary Gracie 4, Maggie Lee 5, Kerrie L. McDonald 6,7, Anna K. Nowak 6,8 ,Richard Banati 6,9,10, Michael E. Buckland 5,6 and Manuel B. Graeber 2,*
�����������������
Citation: Bao, G.; Wang, X.; Xu, R.;
Loh, C.; Adeyinka, O.D.; Pieris, D.A.;
Cherepanoff, S.; Gracie, G.; Lee, M.;
McDonald, K.L.; et al. PathoFusion:
An Open-Source AI Framework for
Recognition of Pathomorphological
Features and Mapping of
Immunohistochemical Data. Cancers
2021, 13, 617. https://doi.org/
10.3390/cancers13040617
Academic Editors: Fiona M. Lyng,
Pierre Brousset and Serge Weis
Received: 8 October 2020
Accepted: 29 January 2021
Published: 4 February 2021
Publisher’s Note: MDPI stays neutral
with regard to jurisdictional claims in
published maps and institutional affil-
iations.
Copyright: © 2021 by the authors.
Licensee MDPI, Basel, Switzerland.
This article is an open access article
distributed under the terms and
conditions of the Creative Commons
Attribution (CC BY) license (https://
creativecommons.org/licenses/by/
4.0/).
1 School of Computer Science, The University of Sydney, J12/1 Cleveland St, Darlington, Sydney,NSW 2008, Australia; [email protected]
2 Ken Parker Brain Tumour Research Laboratories, Brain and Mind Centre, Faculty of Medicine and Health,The University of Sydney, Sydney, NSW 2006, Australia; [email protected] (R.X.);[email protected] (C.L.); [email protected] (O.D.A.);[email protected] (D.A.P.)
3 Department of Neurosurgery, Xuanwu Hospital, Capital Medical University, No. 45 Changchun Street,Beijing 100053, China
4 St Vincent’s Hospital, Victoria Street, Darlinghurst, NSW 2010, Australia; [email protected] (S.C.);[email protected] (G.G.)
5 Department of Neuropathology, RPA Hospital and Brain and Mind Centre, Faculty of Medicine and Health,The University of Sydney, Sydney, NSW 2006, Australia; [email protected] (M.L.);[email protected] (M.E.B.)
6 Cooperative Trials Group of Neuro-Oncology (COGNO), Sydney, NSW 1450, Australia;[email protected] (K.L.M.); [email protected] (A.K.N.); [email protected] (R.B.)
7 Brain Cancer Consultancy, Sydney, NSW 2040, Australia8 Department of Medical Oncology, University of Western Australia, Perth, WA 6009, Australia9 Life Sciences, Australian Nuclear Science and Technology Organisation, Sydney, NSW 2234, Australia10 Medical Imaging and Radiation Sciences, Brain and Mind Centre, Faculty of Medicine and Health,
The University of Sydney, Sydney, NSW 2006, Australia* Correspondence: [email protected] (X.W.); [email protected] (M.B.G.)
Simple Summary: We present an open-source AI framework for marking, training, and automatedrecognition of pathological features in whole-slide scans of diagnostic tissue sections. The integratedsystem permits high-resolution qualitative as well as quantitative morphological analyses of entirehistological slides and harbors significant potential to facilitate the microscopic analysis of complexpathomorphological problems and the simultaneous mapping of immunohistochemical markers inroutine slide diagnostics.
Abstract: We have developed a platform, termed PathoFusion, which is an integrated system formarking, training, and recognition of pathological features in whole-slide tissue sections. The plat-form uses a bifocal convolutional neural network (BCNN) which is designed to simultaneouslycapture both index and contextual feature information from shorter and longer image tiles, re-spectively. This is analogous to how a microscopist in pathology works, identifying a cancerousmorphological feature in the tissue context using first a narrow and then a wider focus, hence bifocal.Adjacent tissue sections obtained from glioblastoma cases were processed for hematoxylin and eosin(H&E) and immunohistochemical (CD276) staining. Image tiles cropped from the digitized imagesbased on markings made by a consultant neuropathologist were used to train the BCNN. PathoFusiondemonstrated its ability to recognize malignant neuropathological features autonomously and mapimmunohistochemical data simultaneously. Our experiments show that PathoFusion achieved areasunder the curve (AUCs) of 0.985 ± 0.011 and 0.988 ± 0.001 in patch-level recognition of six typicalpathomorphological features and detection of associated immunoreactivity, respectively. On thisbasis, the system further correlated CD276 immunoreactivity to abnormal tumor vasculature. Corre-sponding feature distributions and overlaps were visualized by heatmaps, permitting high-resolutionqualitative as well as quantitative morphological analyses for entire histological slides. Recognition of
Cancers 2021, 13, 617. https://doi.org/10.3390/cancers13040617 https://www.mdpi.com/journal/cancers
Cancers 2021, 13, 617 2 of 14
more user-defined pathomorphological features can be added to the system and included in future tis-sue analyses. Integration of PathoFusion with the day-to-day service workflow of a (neuro)pathologydepartment is a goal. The software code for PathoFusion is made publicly available.
Keywords: artificial intelligence; bifocal convolutional neural network; CD276; malignant glioma;microvascular proliferation
1. Introduction
Image analysis is a driver for the development of artificial intelligence (AI) appli-cations and great progress has been made in recent years following the introduction ofconvolutional neural networks (CNNs) [1,2]. Morphological disciplines such as pathol-ogy are likely to benefit from the development of specific AI, and publications on theuse of CNNs in pathology as well as neuropathology have begun to appear [3,4]. AnAI-supported workflow in pathology can already be envisioned.
Immune checkpoint markers are of special interest in cancer research because theymay represent powerful new therapeutic targets, as suggested by the significant progressmade, especially in the field of melanoma [5–9]. Microvascular proliferation is one of theessential hallmarks of glioblastoma [10]. It is a more specific and reliable sign of malignancythan necrosis, another key morphological feature that distinguishes glioblastoma fromWHO grade III glioma. While it is not only endothelial cells that constitute the cellularsubstrate of microvascular proliferation [11–13], recent reports have shown that CD276(B7-H3), an immune checkpoint marker of prognostic significance [14–16], is stronglyexpressed by abnormal endothelial cells in various cancers including glioblastoma (FigureS1) [14,17–19]. The inclusion of immunohistochemical (IHC) data has become a standardfor cancer diagnostics and research.
Given the complex morphological characteristics of human tissue biopsies, theiranalysis requires an ever-increasing amount of computing resources and advanced learningalgorithms. The arrival of more advanced deep CNNs in recent years has made the analysisof whole-slide tissue sections possible. For example, deep residual networks (ResNet) [20]introduced skip connection to eliminate singularities and alleviate the vanishing gradientproblem, which enables training of CNNs that are hundreds and even thousands of layersdeep. One of the widely used ResNet models is ResNet-50, which is 50 layers deep and hasbeen used as the reference when comparing network performances. Even more complexarchitecture such as Xception [21] integrated skip connection with depth-wise separableconvolution and achieved superior performance in comparison to its predecessors.
On the basis of advanced deep learning models, we have developed an integratedsystem, termed PathoFusion, which is an AI-based platform for marking, training, andrecognition of pathological features in whole-slide images (WSIs). We have used tissue sec-tions obtained from glioblastoma cases to evaluate the system. Adjacent tissue sections wereprocessed for hematoxylin and eosin (H&E) staining and IHC (CD276), respectively, andscanned. PathoFusion is designed to meet three goals: (i) efficient training of convolutionalneural networks to recognize key pathomorphological features in routine H&E-stained,scanned histological slides; (ii) improved model generation and increased effectivenessof feature recognition, thus requiring fewer physical cases than conventionally neededfor neural network training; and (iii) establishing a method that allows the inclusion ofimmunohistochemical (IHC) data in the automated analysis given the great importance ofimmunohistochemistry in contemporary slide-based analyses.
2. Results2.1. Recognition of Morphological Features and Associated Immunoreactivity
A bifocal convolutional neural network (BCNN) was designed and integrated into thePathoFusion platform to make use of bifocal image pairs as described in the methods sec-
Cancers 2021, 13, 617 3 of 14
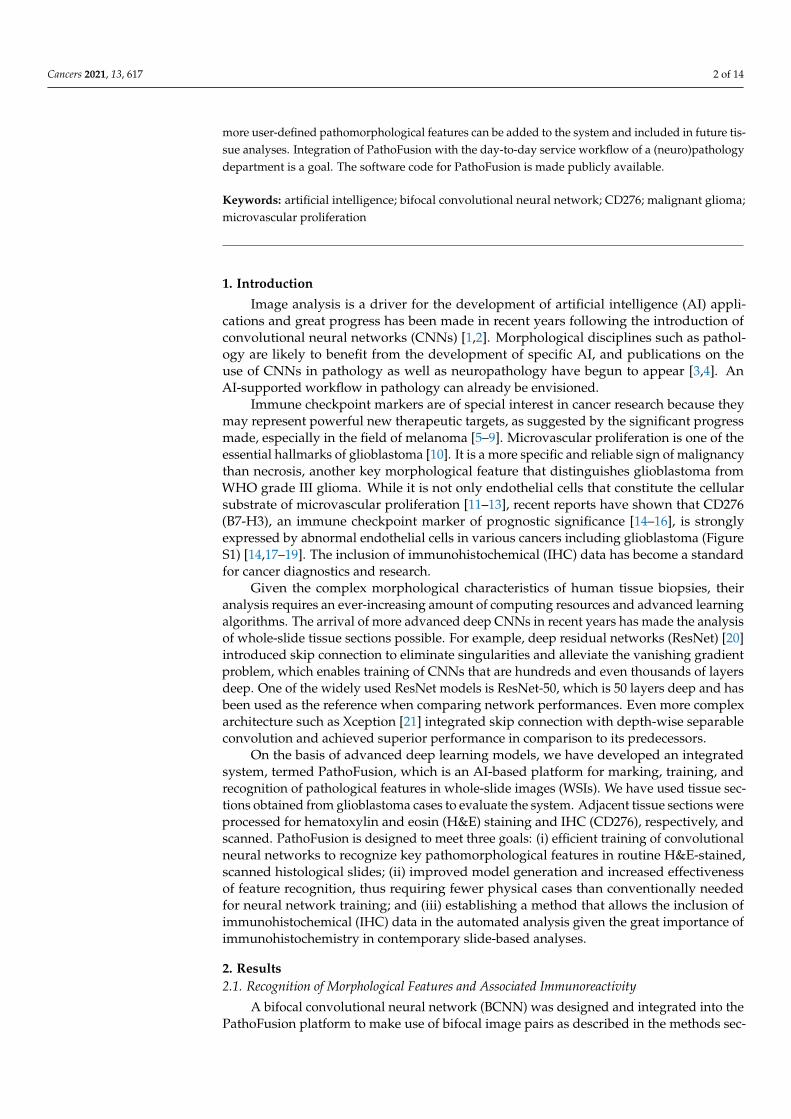
tion. The BCNN was trained on full training/cross-validation data and was subsequentlyevaluated on H&E and IHC test data, respectively. The predicted class of each pairedimage patch was assessed against expert marking (ground truth). As shown in Figure 1A,B,PathoFusion reliably identified morphological features (area under the curve (AUC) of0.985 ± 0.011, precision of 94.4%, and sensitivity of 94.7%) and immunoreactivities (AUCof 0.988 ± 0.001, precision of 96.2%, and sensitivity of 96.1%), respectively, enabling corre-lation of the tissue expression of CD276 with diagnostic morphological features.
Cancers 2021, 13, x 3 of 15
2. Results 2.1. Recognition of Morphological Features and Associated Immunoreactivity
A bifocal convolutional neural network (BCNN) was designed and integrated into the PathoFusion platform to make use of bifocal image pairs as described in the methods section. The BCNN was trained on full training/cross-validation data and was subse-quently evaluated on H&E and IHC test data, respectively. The predicted class of each paired image patch was assessed against expert marking (ground truth). As shown in Fig-ure 1A,B, PathoFusion reliably identified morphological features (area under the curve (AUC) of 0.985 ± 0.011, precision of 94.4%, and sensitivity of 94.7%) and immunoreactivi-ties (AUC of 0.988 ± 0.001, precision of 96.2%, and sensitivity of 96.1%), respectively, ena-bling correlation of the tissue expression of CD276 with diagnostic morphological fea-tures.
PathoFusion achieved higher prediction performance for microvascular proliferation (AUC of 0.994) and geographic necrosis (AUC of 0.994) than palisading necrosis (AUC of 0.964); Figure 1A. This result is consistent with a real-world scenario because the latter is also more difficult to identify for human observers. Therefore, the six selected pathomor-phological features are currently not recognized at the same level. This is also apparent from the confusion matrix in the left panel of Figure 2. In the much simpler binary case of immunostained sections, PathoFusion achieved the same high performance in recognition of both positive (AUC of 0.990) and negative (AUC of 0.987) tissue areas (Figure 1B and Figure 2 (right panel)) as expected.
Figure 1. Receiver operating characteristic (ROC) and area under the curve (AUC) performance on test data. ROC/AUC performance of the bifocal convolutional neural network (BCNN) for recognition of hematoxylin and eosin (H&E) (A) and immunohistochemical (IHC) (B) features. (C) Comparison of ROC/AUC performance of BCNN with state-of-the-art deep learning methods.
Figure 2. Confusion matrices for recognition of H&E (left) and IHC (right) features (BCNN; nor-malized).
Figure 1. Receiver operating characteristic (ROC) and area under the curve (AUC) performance on test data. ROC/AUCperformance of the bifocal convolutional neural network (BCNN) for recognition of hematoxylin and eosin (H&E) (A) andimmunohistochemical (IHC) (B) features. (C) Comparison of ROC/AUC performance of BCNN with state-of-the-art deeplearning methods.
PathoFusion achieved higher prediction performance for microvascular proliferation(AUC of 0.994) and geographic necrosis (AUC of 0.994) than palisading necrosis (AUC of0.964); Figure 1A. This result is consistent with a real-world scenario because the latter isalso more difficult to identify for human observers. Therefore, the six selected pathomor-phological features are currently not recognized at the same level. This is also apparentfrom the confusion matrix in the left panel of Figure 2. In the much simpler binary case ofimmunostained sections, PathoFusion achieved the same high performance in recognitionof both positive (AUC of 0.990) and negative (AUC of 0.987) tissue areas (Figures 1B and 2(right panel)) as expected.
Cancers 2021, 13, x 3 of 15
2. Results 2.1. Recognition of Morphological Features and Associated Immunoreactivity
A bifocal convolutional neural network (BCNN) was designed and integrated into the PathoFusion platform to make use of bifocal image pairs as described in the methods section. The BCNN was trained on full training/cross-validation data and was subse-quently evaluated on H&E and IHC test data, respectively. The predicted class of each paired image patch was assessed against expert marking (ground truth). As shown in Fig-ure 1A,B, PathoFusion reliably identified morphological features (area under the curve (AUC) of 0.985 ± 0.011, precision of 94.4%, and sensitivity of 94.7%) and immunoreactivi-ties (AUC of 0.988 ± 0.001, precision of 96.2%, and sensitivity of 96.1%), respectively, ena-bling correlation of the tissue expression of CD276 with diagnostic morphological fea-tures.
PathoFusion achieved higher prediction performance for microvascular proliferation (AUC of 0.994) and geographic necrosis (AUC of 0.994) than palisading necrosis (AUC of 0.964); Figure 1A. This result is consistent with a real-world scenario because the latter is also more difficult to identify for human observers. Therefore, the six selected pathomor-phological features are currently not recognized at the same level. This is also apparent from the confusion matrix in the left panel of Figure 2. In the much simpler binary case of immunostained sections, PathoFusion achieved the same high performance in recognition of both positive (AUC of 0.990) and negative (AUC of 0.987) tissue areas (Figure 1B and Figure 2 (right panel)) as expected.
Figure 1. Receiver operating characteristic (ROC) and area under the curve (AUC) performance on test data. ROC/AUC performance of the bifocal convolutional neural network (BCNN) for recognition of hematoxylin and eosin (H&E) (A) and immunohistochemical (IHC) (B) features. (C) Comparison of ROC/AUC performance of BCNN with state-of-the-art deep learning methods.
Figure 2. Confusion matrices for recognition of H&E (left) and IHC (right) features (BCNN; nor-malized).
Figure 2. Confusion matrices for recognition of H&E (left) and IHC (right) features (BCNN; normalized).
Cancers 2021, 13, 617 4 of 14
As shown in Figure 1C, the BCNN integrated into our framework achieved higherperformance than popular state-of-the-art deep learning models, including ResNet-50,Xception and transfer learning (TL)- [22–24] based Xception (pretrained on ImageNet [25]).Importantly, however, the BCNN utilizes only half of the number of network parameterscompared to ResNet-50 and Xception, suggesting that our BCNN is a more efficient neuralnetwork for the analysis of histopathology images. In addition, the BCNN achieved supe-rior performance compared to its subnet implementation (Figure 1C), which demonstratedthe effectiveness of the bifocal design. An analysis of the mechanisms underlying such aperformance gain is beyond the scope of this work and has been dealt with elsewhere [26].
2.2. Analysis of Entire Histological Sections
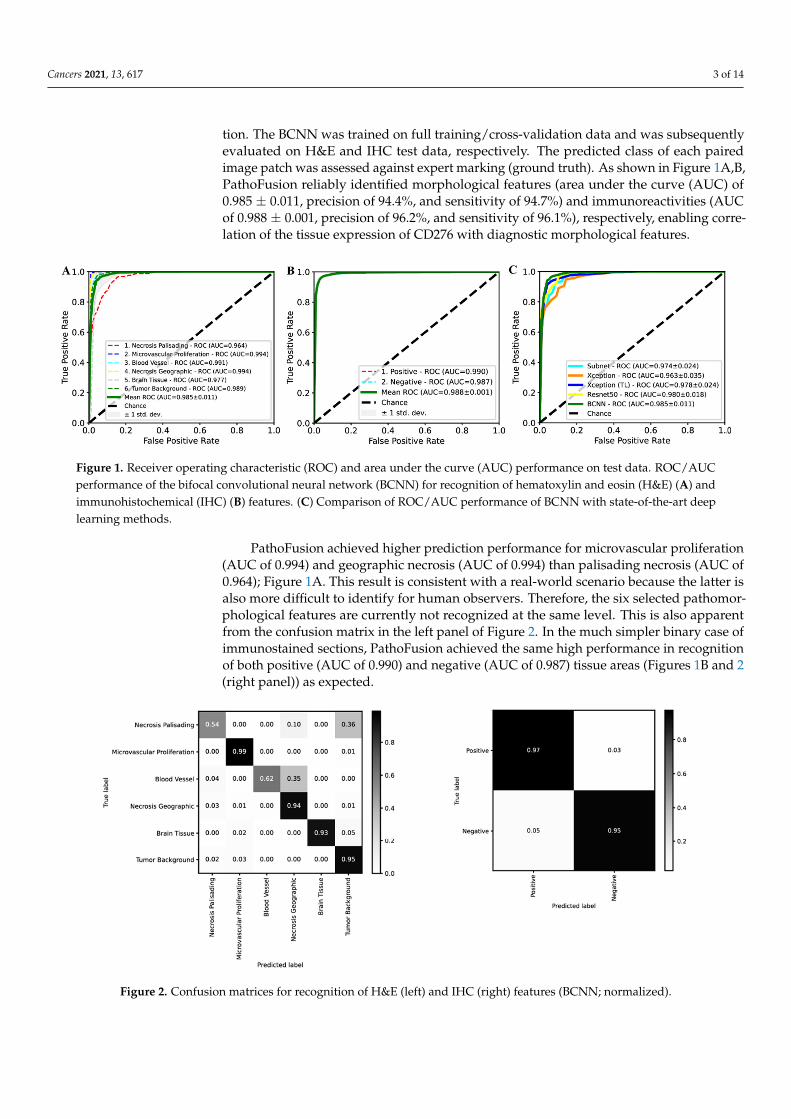
The capability of PathoFusion in tile-level recognition formed the basis for the auto-mated analysis of entire histological sections. As shown in Figure 3, adjacent whole-slideH&E and IHC images were recognized by the PathoFusion framework and converted intoheatmaps which visualize the tissue distribution of the six chosen morphological features(first column) as well as corresponding immunoreactivity (subsequent two columns). Sam-ple matching signals of detected microvascular proliferation in H&E whole-slide tissuesections are illustrated in Figure 4A. The predicted heatmaps can be transparently overlaidonto the corresponding H&E-stained tissue sections to allow direct visual inspection andcomparative checking (Video S1). The examples shown in Figure 5 demonstrate that theBCNN-recognized morphological features closely match the neuropathological featuresdelineated by expert marking. Certain morphological features of which subcategories existwill benefit from additional refinement. Quantitative analysis of sample cases revealed thatmicrovascular proliferation accounted for a sizeable fraction of the H&E heatmaps in linewith microscopic appearance (Table S1).
Cancers 2021, 13, x 4 of 15
As shown in Figure 1C, the BCNN integrated into our framework achieved higher performance than popular state-of-the-art deep learning models, including ResNet-50, Xception and transfer learning (TL)- [22–24] based Xception (pretrained on ImageNet [25]). Importantly, however, the BCNN utilizes only half of the number of network pa-rameters compared to ResNet-50 and Xception, suggesting that our BCNN is a more effi-cient neural network for the analysis of histopathology images. In addition, the BCNN achieved superior performance compared to its subnet implementation (Figure 1C), which demonstrated the effectiveness of the bifocal design. An analysis of the mechanisms underlying such a performance gain is beyond the scope of this work and has been dealt with elsewhere [26].
2.2. Analysis of Entire Histological Sections The capability of PathoFusion in tile-level recognition formed the basis for the auto-
mated analysis of entire histological sections. As shown in Figure 3, adjacent whole-slide H&E and IHC images were recognized by the PathoFusion framework and converted into heatmaps which visualize the tissue distribution of the six chosen morphological features (first column) as well as corresponding immunoreactivity (subsequent two columns). Sample matching signals of detected microvascular proliferation in H&E whole-slide tis-sue sections are illustrated in Figure 4A. The predicted heatmaps can be transparently overlaid onto the corresponding H&E-stained tissue sections to allow direct visual inspec-tion and comparative checking (Video S1). The examples shown in Figure 5 demonstrate that the BCNN-recognized morphological features closely match the neuropathological features delineated by expert marking. Certain morphological features of which subcate-gories exist will benefit from additional refinement. Quantitative analysis of sample cases revealed that microvascular proliferation accounted for a sizeable fraction of the H&E heatmaps in line with microscopic appearance (Table S1).
Figure 3. Predicted heatmaps of test cases showing distribution of machine-recognized features. First column: heatmaps showing the distribution of pathomorphological features predicted from scanned H&E whole-slide images; second and third columns: heatmaps of the same cases showing the distribution of CD276 immunoreactivity before and after image registration, respectively; last column: CD276 expression mapped to pathomorphological features following image regis-tration. Note: Probability heatmaps in the second column were generated using prediction probabilities as weighting fac-tors for pseudo-color mapping, which were then converted into classification heatmaps before image registration (third column) and image fusion (fourth column).
The literature on CD276 tissue staining is limited. We have checked the antibody la-beling using a second automated stainer system employing both tumor and non-tumor
Figure 3. Predicted heatmaps of test cases showing distribution of machine-recognized features. First column: heatmapsshowing the distribution of pathomorphological features predicted from scanned H&E whole-slide images; second andthird columns: heatmaps of the same cases showing the distribution of CD276 immunoreactivity before and after image reg-istration, respectively; last column: CD276 expression mapped to pathomorphological features following image registration.Note: Probability heatmaps in the second column were generated using prediction probabilities as weighting factors forpseudo-color mapping, which were then converted into classification heatmaps before image registration (third column)and image fusion (fourth column).
Cancers 2021, 13, 617 5 of 14Cancers 2021, 13, x 6 of 15
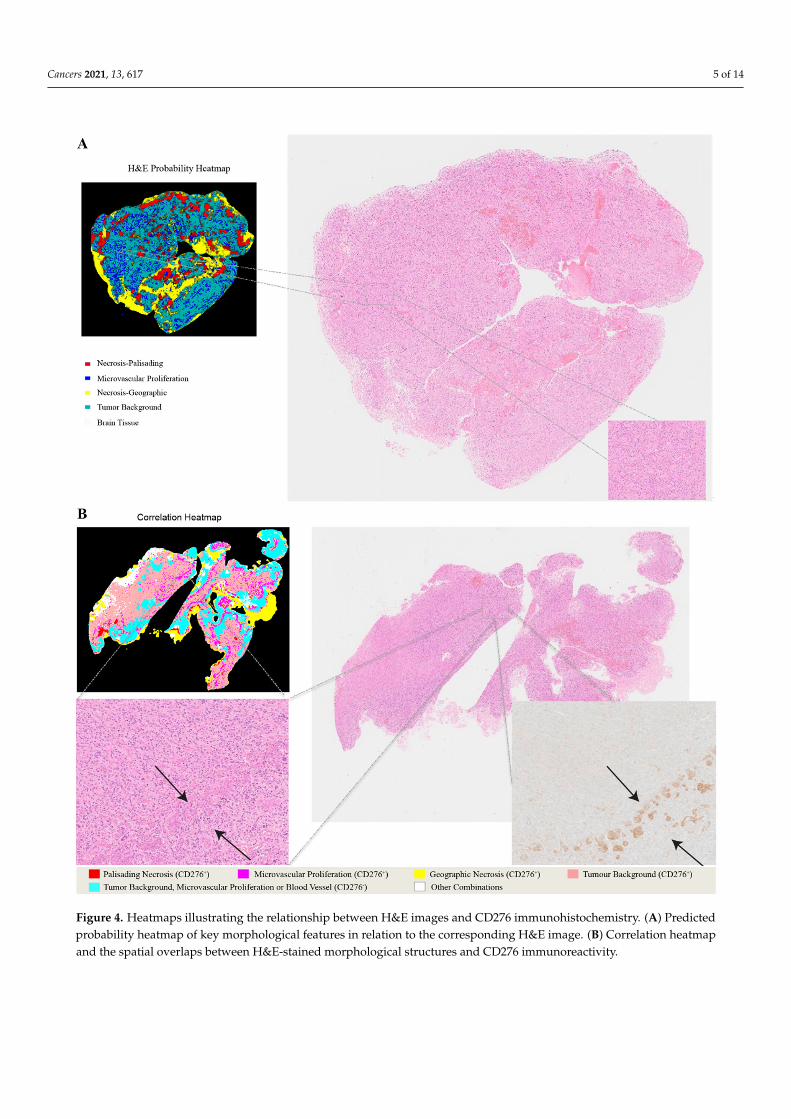
Figure 4. Heatmaps illustrating the relationship between H&E images and CD276 immunohistochemistry. (A) Predicted probability heatmap of key morphological features in relation to the corresponding H&E image. (B) Correlation heatmap and the spatial overlaps between H&E-stained morphological structures and CD276 immunoreactivity.
Figure 4. Heatmaps illustrating the relationship between H&E images and CD276 immunohistochemistry. (A) Predictedprobability heatmap of key morphological features in relation to the corresponding H&E image. (B) Correlation heatmapand the spatial overlaps between H&E-stained morphological structures and CD276 immunoreactivity.

Cancers 2021, 13, 617 6 of 14Cancers 2021, 13, x 7 of 15
Figure 5. Transparent overlays (left column) of predicted feature distribution heatmaps on original whole-slide test images (right column). Images and crops from the images were randomly selected. (A,B) Machine-recognized tissue areas (ar-rows; predicted to contain microvascular proliferation) closely match the expert marking (annotated yellow dots). (C) A machine-recognized tumor-infiltrated brain tissue sample (long arrow) also shows incipient microvascular proliferation (short arrows). (D) Another illustration of recognized pathomorphological features showing different subcategories of tissue necrosis: geographic necrosis (long arrows) and palisading necrosis (short arrows).
Figure 5. Transparent overlays (left column) of predicted feature distribution heatmaps on original whole-slide test images(right column). Images and crops from the images were randomly selected. (A,B) Machine-recognized tissue areas (arrows;predicted to contain microvascular proliferation) closely match the expert marking (annotated yellow dots). (C) A machine-recognized tumor-infiltrated brain tissue sample (long arrow) also shows incipient microvascular proliferation (shortarrows). (D) Another illustration of recognized pathomorphological features showing different subcategories of tissuenecrosis: geographic necrosis (long arrows) and palisading necrosis (short arrows).
Cancers 2021, 13, 617 7 of 14
The literature on CD276 tissue staining is limited. We have checked the antibodylabeling using a second automated stainer system employing both tumor and non-tumortissue for control (we compared Leica vs. Ventana). The staining of abnormal tumor bloodvessels was strong in both cases. However, it appears that the Ventana method may bemore sensitive and there is some interesting immunolabeling outside blood vessels withthe latter. Clearly, the additional result deserves further scrutiny.
2.3. Fusion of Bimodal Neuropathological Images
In addition to recognizing key pathomorphological features in glioblastoma, Patho-Fusion was shown to be capable of simultaneously mapping the expression of immunore-activity (CD276 in this work) in adjacent tissue sections, facilitating the interpretation ofcomplex immunohistochemical staining results. The correlative overlap between morpho-logical features and immunoreactivity in the bimodal whole-slide images was visualizedthrough image fusion of the corresponding predicted heatmaps. As shown in Figure 3,the H&E-based heatmaps (first column) were fused with the aligned IHC heatmaps (thirdcolumn), which resulted in correlation heatmaps (last column) representing feature overlapof the two modalities. For example, the color magenta represents matching signals in tissueareas harboring both microvascular proliferation and associated CD276 immunopositivity.The close association between CD276 and microvascular proliferation in (glioblastomamultiforme) GBM biopsies was clearly demonstrated, permitting qualitative as well asquantitative tissue analyses. Matching signals between microvascular proliferation andCD276 immunopositivity are further illustrated in Figure 4B.
Quantitative and correlation analyses confirmed that microvascular proliferation hada significantly higher (specific) CD276 expression compared to visually negative normalblood vessels (Table S2 and Figure S1). However, a detailed analysis of CD276 expressionis beyond the scope of this paper.
3. Discussion
Morphological diagnostic work in pathology, and especially in neuropathology—given the great structural complexity of the nervous system—has elements of an art. In fact,“painting with words” is a skill taught for the writing of useful microscopic reports thatconvey a synthesis of complex visual information, requiring both creativity and imaginationfor their generation. It may seem counterintuitive, therefore, that an AI should be capableof acquiring the equivalent of typical human skills, but similar developments are occurringin other fields, in- and outside of medicine—in software programming and even music, toname a few.
The PathoFusion framework introduced here provides new tools that may facilitate thetransfer of pathomorphological feature detection knowledge to machines. The frameworkis suited for the analysis of pathomorphological hallmarks in whole histological slides, asalso demonstrated in Video S1, allowing the development of a specific (neuro)pathologicalAI. Both marking and training times can be reduced when using the integrated system,accommodating the time constraints relevant to busy clinical consultants. Expert input isthe key limiting factor, since the marking of pathological features (“ground truth”) cannotbe delegated to less well-trained observers. On the other hand, a comparatively smallcohort of human biopsies was required to carry out the necessary training, which resultedin high testing performance. Being able to train neural networks effectively on the basis ofa relatively small number of cases should be useful in many scenarios.
The histological slides used in pathology and neuropathology can be scanned and con-verted into digital images. Those images contain an exceptionally rich variety of structuraldetail and staining patterns. The file size of these images is extremely large (gigabytes),which makes them very challenging to process using conventional methods. However, inall other respects, the images used here are comparable to the digital photographs that arewidely employed and have become a predominant focus of AI research. CNNs have beenfound to be particularly suited for the analysis of images.
Cancers 2021, 13, 617 8 of 14
A number of earlier studies have demonstrated the utility of repurposing CNNmodels pretrained on natural image collections such as ImageNet for medical imageanalysis [27,28]. This approach is referred to as transfer learning and has worked wellin some cases where a close relationship exists between the source and target domains,but failed in other instances where knowledge learned from the source domain was lessgeneral across sub-domains [29–31]. However, our study obviates the need for transferlearning through the use of a dual-path CNN model utilizing bifocal image tiles as input.Our model achieved better recognition performance than popular deep learning models,including ResNet-50 and Xception, pretrained on ImageNet, thus eliminating the need forresource-intensive pretraining.
The prognostic marker CD276 was chosen as a proof-of-concept example, allowingour AI system to validate its recognition ability autonomously by producing a fusionheatmap that demonstrates the overlap between a morphological feature, microvascularproliferation, and CD276 immunoreactivity. The specific task of mapping CD276 to asubset of blood vessels, and endothelial cells of abnormal tumor blood vessels in particular,can also be performed by a human observer, which is why this marker was chosen formachine recognition because a widely accepted feature is more convincing. A humanobserver may even be able to perform systematic recognition of a morphological feature inan entire histological section, but it would be a very tedious and time-consuming exercise.Interestingly, CD276 labeling in the present study was strong in tumor vasculature, asexpected, but not limited to it when using the Ventana automated tissue staining system.We believe that the CD276 labeling noted when using this staining system deserves furtheranalysis, which is beyond the scope of this manuscript. Extravascular CD276 labeling,which appeared to be partly cellular, is very interesting with regard to the function ofCD276 as an immune checkpoint molecule.
Following training, our BCNNs reliably identified the key morphological featuresthat they had been trained to recognize with AUC performances of 0.985 and 0.988 onH&E and immunohistochemical images, respectively. This formed the basis for the abil-ity to correlate the occurrence of individual pathomorphological features with the tissueexpression of CD276. Notably, the close association between CD276 and microvascularproliferation in GBM was faithfully reproduced and visualized by the heatmaps, permittinghigh-resolution (40× primary magnification) qualitative as well as quantitative morpho-logical analyses of complete histological sections. The method presented here allowsquantification of the occurrence of key morphological features and simultaneous matchingof immunoreactivities (or other molecular histological data such as in situ hybridizationresults) to those features. This has not been possible before and may harbor significantpotential for brain mapping projects (e.g., Allen Atlas). Another important quality of thePathoFusion framework consists of the independence of its prediction and fusion processes,which do not require human intervention once the BCNN model has been properly trained.The framework is expected to provide a comparable performance on other tumor types andalso on non-neoplastic pathological lesions, provided that a qualified observer (experiencedconsultant) performs the marking, thus establishing the relevant ground truth which isnecessary for CNN training.
There are several methods available to facilitate slide diagnostics—for example, DigitalSlide Archive is a web-based interactive system for annotating whole-slide histopathol-ogy images which shows a similarity in function to the labeling module of PathoFusion;Cytomine is a machine learning-based open-source platform for collaborative analysisof multi-gigapixel images, but it requires users to provide customized scripts for imageanalysis. Distinct from Digital Slide Archive and Cytomine, Digipath is the product ofa company that provides hardware (e.g., a scanner) as well as online training courses.Compared to all of these, PathoFusion is a light-weight automated framework for theanalysis of multi-modal histopathology images, which provides functions ranging from an-notation, training and whole-slide image detection to cross-modality quantitative analysis.PathoFusion is also flexible and can be integrated in existing annotation systems, such as
Cancers 2021, 13, 617 9 of 14
Digital Slide Archive, or enhance existing hardware solutions, e.g., a scanner that is capableof detecting tissue structures as well as producing heatmaps for abnormalities.
The present study has the following limitations. Firstly, we acknowledge that trainingfor the recognition of some pathomorphological features could be improved further bycreating more subcategories as well as carefully defining any similar-appearing morpholo-gies (mimics that can cause diagnostic pitfalls), e.g., geographic necrosis with and withoutbleeding, and palisading necrosis vs. tumor cell palisades without necrosis. Secondly,many additional pathomorphological features could be added to the training in order to befully prepared for possible confounding pathological signs of unrelated but co-occurringdiseases. Thirdly, the quantifications performed in this study were carried out for formalreasons and are not necessarily biologically understood. For instance, some of the novelCD276 immunohistochemical results such as lower-level CD276 expression outside of thetumor vasculature when using the Ventana system deserve additional study.
4. Materials and Methods4.1. Clinical Cases
Paraffin sections of 34 WHO grade IV glioma samples, provided by the AustralianGenomics and Clinical Outcomes of Glioma (AGOG) tissue bank, were used for thisstudy (University of Sydney Human Ethics Committee Project number 2016/027). Paraffinsections were stained with H&E and scanned at 40X magnification using an OlympusVS-120 scanner. Adjacent sections were processed for CD276 immunohistochemistry atSt. Vincent’s Hospital, Sydney, and at the Department of Neuropathology of Royal PrinceAlfred Hospital, respectively.
4.2. PathoFusion Framework4.2.1. Expert Marking and Datasets
An in-house labeling website was developed to facilitate marking of morphologicalfeatures by a neuropathology consultant (Figure S2). The website forms part of the Patho-Fusion framework, which, in addition to conventional web server hard- and software,makes use of a laptop computer for manually marking relevant structures. For the initialtraining and subsequent testing of the BCNN, six typical morphological features werechosen and marked by a consultant neuropathologist (M.B.G.) following WHO criteria [10]where appropriate: palisading necrosis (I), microvascular proliferation (II), histologicallynormal-appearing blood vessels (III), geographic necrosis (IV), brain tissue (V), and tumorbackground (extensive diffuse infiltration of brain tissue by glioma cells, (VI). We usedapproximately 850 marking dots on average in each whole-slide image to cover six typicalpathomorphological features. Each marking dot used for labeling a relevant feature pro-vided the tissue section co-ordinates for a whole or part of a specific morphological featureof interest.
In brief, a total of 58,526 paired image tiles (sizes of 512 × 512 and 256 × 256 pixels,respectively) were extracted from the 34 H&E whole-slide scans. Every paired image tilewas based on one of 29,106 individually marked coordinates (epicenters for extraction)for the recognition of the six selected morphological features. In contrast, the mark-ing of IHC images included only two criteria, i.e., the presence or absence of browndiaminobenzidine-peroxidase reaction product indicating antibody binding, which wasbased on pixel intensity. A total of 20,644 paired image tiles were extracted from CD276slide scans. Furthermore, 6648 paired image tiles from 10% of the cases were employedfor testing and 51,878 paired image tiles from the remaining scans were used for trainingand cross-validation. Training and testing data were extracted from different cases andthere was no overlap between them. Details of the marking and extraction procedure areillustrated in Figure 6A.
Cancers 2021, 13, 617 10 of 14
Cancers 2021, 13, x 11 of 15
paired image tiles were extracted from the upper L to bottom R of the whole-slide test images with a stride of 50 pixels (middle panel, Figure 6C). Each foreground image patch pair was classified by the model and assigned to one of the expert-defined morphological feature or immunoreactivity categories—for example, microvascular proliferation and im-munopositive expression. The prediction results were converted into feature heatmaps using pseudo-colors (bottom R, Figure 6). It is worth noting that no augmentation was involved at the recognition stage.
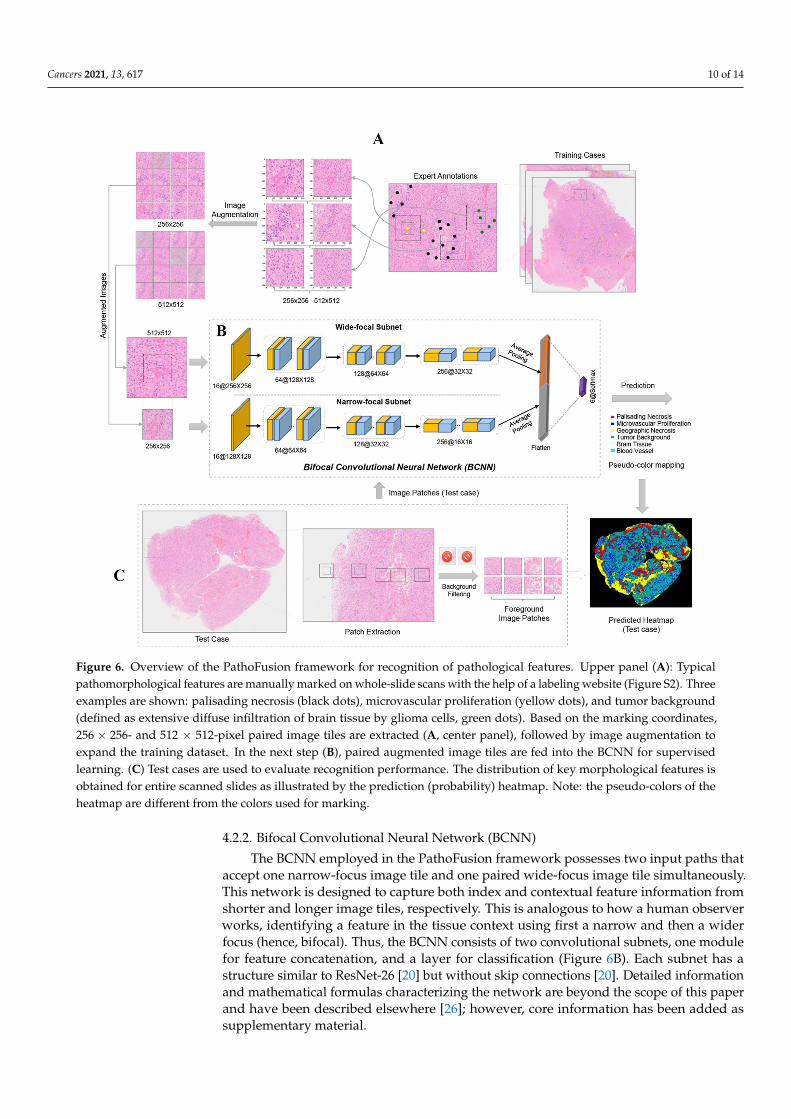
Figure 6. Overview of the PathoFusion framework for recognition of pathological features. Upper panel (A): Typical pathomorphological features are manually marked on whole-slide scans with the help of a labeling website (Figure S2). Three examples are shown: palisading necrosis (black dots), microvascular proliferation (yellow dots), and tumor back-ground (defined as extensive diffuse infiltration of brain tissue by glioma cells, green dots). Based on the marking coordi-nates, 256 × 256- and 512 × 512-pixel paired image tiles are extracted (A, center panel), followed by image augmentation to expand the training dataset. In the next step (B), paired augmented image tiles are fed into the BCNN for supervised learning. (C) Test cases are used to evaluate recognition performance. The distribution of key morphological features is obtained for entire scanned slides as illustrated by the prediction (probability) heatmap. Note: the pseudo-colors of the heatmap are different from the colors used for marking.
4.2.4. Method for Fusing Bimodal Histological Images An image fusion method was developed to visualize the correlation (spatial overlap)
between recognized morphological features and immunohistochemical staining results (both were BCNN predictions) using bimodal images. In order to achieve this, H&E and IHC whole-slide images were first processed by the pretrained BCNN model (Figure 7A) and then converted into heatmaps (Figure 7B). Since the corresponding H&E and IHC
Figure 6. Overview of the PathoFusion framework for recognition of pathological features. Upper panel (A): Typicalpathomorphological features are manually marked on whole-slide scans with the help of a labeling website (Figure S2). Threeexamples are shown: palisading necrosis (black dots), microvascular proliferation (yellow dots), and tumor background(defined as extensive diffuse infiltration of brain tissue by glioma cells, green dots). Based on the marking coordinates,256 × 256- and 512 × 512-pixel paired image tiles are extracted (A, center panel), followed by image augmentation toexpand the training dataset. In the next step (B), paired augmented image tiles are fed into the BCNN for supervisedlearning. (C) Test cases are used to evaluate recognition performance. The distribution of key morphological features isobtained for entire scanned slides as illustrated by the prediction (probability) heatmap. Note: the pseudo-colors of theheatmap are different from the colors used for marking.
4.2.2. Bifocal Convolutional Neural Network (BCNN)
The BCNN employed in the PathoFusion framework possesses two input paths thataccept one narrow-focus image tile and one paired wide-focus image tile simultaneously.This network is designed to capture both index and contextual feature information fromshorter and longer image tiles, respectively. This is analogous to how a human observerworks, identifying a feature in the tissue context using first a narrow and then a widerfocus (hence, bifocal). Thus, the BCNN consists of two convolutional subnets, one modulefor feature concatenation, and a layer for classification (Figure 6B). Each subnet has astructure similar to ResNet-26 [20] but without skip connections [20]. Detailed informationand mathematical formulas characterizing the network are beyond the scope of this paperand have been described elsewhere [26]; however, core information has been added assupplementary material.

Cancers 2021, 13, 617 11 of 14
4.2.3. Recognition of Morphological Features and Associated Immunoreactivity
At the training stage, image augmentation including rotation, contrast, and sharpnessadjustments was randomly applied to bifocal image tiles before they were fed into theBCNN model (Figure 6B). The actual training input was therefore diversified and expandedgreatly (n2 times) compared to conventional methods (n times) (left panel, Figure 6A),where n is the number of augmentation types. Following training of the model, pairedimage tiles were extracted from the upper L to bottom R of the whole-slide test imageswith a stride of 50 pixels (middle panel, Figure 6C). Each foreground image patch pairwas classified by the model and assigned to one of the expert-defined morphologicalfeature or immunoreactivity categories—for example, microvascular proliferation andimmunopositive expression. The prediction results were converted into feature heatmapsusing pseudo-colors (bottom R, Figure 6). It is worth noting that no augmentation wasinvolved at the recognition stage.
4.2.4. Method for Fusing Bimodal Histological Images
An image fusion method was developed to visualize the correlation (spatial overlap)between recognized morphological features and immunohistochemical staining results(both were BCNN predictions) using bimodal images. In order to achieve this, H&E andIHC whole-slide images were first processed by the pretrained BCNN model (Figure 7A)and then converted into heatmaps (Figure 7B). Since the corresponding H&E and IHCimages were obtained from adjacent tissue sections of the same biopsy, an image registra-tion algorithm [32], making use of feature point correspondences to establish matchingsignals, was used to align (pair) the IHC heatmap with the corresponding H&E featureheatmap to allow subsequent combined analysis (Figure 7C). The aligned heatmaps werethen merged to create the fusion heatmap, and each color in the final fused correlationheatmap represents a distinct spatial association between one of the morphological featuresand immunoreactivity.
Cancers 2021, 13, x 12 of 15
images were obtained from adjacent tissue sections of the same biopsy, an image registra-tion algorithm [32], making use of feature point correspondences to establish matching signals, was used to align (pair) the IHC heatmap with the corresponding H&E feature heatmap to allow subsequent combined analysis (Figure 7C). The aligned heatmaps were then merged to create the fusion heatmap, and each color in the final fused correlation heatmap represents a distinct spatial association between one of the morphological fea-tures and immunoreactivity.
Figure 7. Overview of the PathoFusion framework for mapping of immunohistochemical data to morphological features. Whole-slide histopathology images of different modalities (A) are processed by the BCNN and used to generate heatmaps, showing the predicted distribution of morphological features and CD276 expression patterns, respectively (B). The im-munohistochemical heatmap is then aligned with the H&E heatmap using image registration (C, lower panel). The corre-lation between the two modalities can be visualized through fusion of the corresponding heatmaps. Each color in the correlation heatmap (C, upper panel) indicates an overlap between the two modalities. The asterisks indicate that further marking and training are required to differentiate subcategories of palisading and geographic necrosis, respectively (see text for further explanation). The overlap between microvascular proliferation and CD276 immunopositivity is of special interest (magenta color in the upper panel of C).
4.2.5. Quantitative Analysis The area percentage for each of the six morphological features within H&E whole-
slide images was first determined based on classification heatmaps denoted as ( )he iP . Ac-
cordingly, ( )ihc iP represents the percentage of immunohistochemically positive and neg-
ative areas in relation to whole-slide IHC image scans. Next, the percentage of CD276 positivity for each of the diagnostic morphological features was calculated based on the correlation heatmaps as = ( )/i i he iP I F , where iI represents the intersection between a
morphological feature i and an immunopositive area, while ( )he iF denotes the area
taken by a morphological feature i .
4.2.6. Data Availability and Experimental Reproducibility The dataset and the source code used in this study have been released to the public
at https://github.com/guoqingbao/Pathofusion. The source code written for our pathology
Figure 7. Overview of the PathoFusion framework for mapping of immunohistochemical data to morphological features.Whole-slide histopathology images of different modalities (A) are processed by the BCNN and used to generate heatmaps,
Cancers 2021, 13, 617 12 of 14
showing the predicted distribution of morphological features and CD276 expression patterns, respectively (B). The immuno-histochemical heatmap is then aligned with the H&E heatmap using image registration (C, lower panel). The correlationbetween the two modalities can be visualized through fusion of the corresponding heatmaps. Each color in the correlationheatmap (C, upper panel) indicates an overlap between the two modalities. The asterisks indicate that further marking andtraining are required to differentiate subcategories of palisading and geographic necrosis, respectively (see text for furtherexplanation). The overlap between microvascular proliferation and CD276 immunopositivity is of special interest (magentacolor in the upper panel of C).
4.2.5. Quantitative Analysis
The area percentage for each of the six morphological features within H&E whole-slide images was first determined based on classification heatmaps denoted as Phe(i).Accordingly, Pihc(i) represents the percentage of immunohistochemically positive andnegative areas in relation to whole-slide IHC image scans. Next, the percentage of CD276positivity for each of the diagnostic morphological features was calculated based on thecorrelation heatmaps as Pi = Ii/Fhe(i),where Ii represents the intersection between amorphological feature i and an immunopositive area, while Fhe(i) denotes the area taken bya morphological feature i.
4.2.6. Data Availability and Experimental Reproducibility
The dataset and the source code used in this study have been released to the publicat https://github.com/guoqingbao/Pathofusion. The source code written for our pathol-ogy image marking website will be provided for non-commercial and research purposesupon request.
5. Conclusions
Taken together, our results demonstrate that routine histopathological sections froma comparatively small number of cases can be used to train a BCNN effectively. Appliedto entire histological sections, PathoFusion has the potential to facilitate the microscopicanalysis of complex immunohistochemical markers and H&E-stained tissues in real-worldscenarios. In addition, color normalization of histopathology images [33] may make ourmethod more widely applicable, i.e., when dealing with stained images from differentlaboratories where variations in color and intensity of the images exist. We are workingon improving the capabilities of PathoFusion further by adding more feature definitionsand refining the categorization of complex pathomorphological entities such as necrosissubtypes. Integration of the system with the workflows of a neuropathology or pathologydepartment is a goal. In the future, a fully developed expert AI system may especiallybenefit patients in geographic areas that do not have local access to specialist pathologicalservices such as neuropathology.
Supplementary Materials: The following are available online at https://www.mdpi.com/2072-6694/13/4/617/s1, Figure S1: CD276 immunopositivity of glioblastoma vasculature., Figure S2:Pathology image labeling module., Table S1: Percentage of each diagnostic feature within whole-slide H&E and IHC images (sample)., Table S2: Percentage of CD276 positivity for each diagnosticmorphological feature (sample)., Video S1: Video demonstration of the AI framework for detectionof cancerous features in whole-slide tissue sections.
Author Contributions: Conceptualization, M.B.G., X.W. and G.B.; methodology, G.B.; software,G.B. and M.B.G.; validation, M.B.G., G.B., R.X., C.L., O.D.A., D.A.P. and S.C.; formal analysis, G.B.;investigation, M.B.G., G.B., X.W. and R.X.; resources, G.G., M.L., K.L.M., A.K.N., R.B. and M.E.B.;data curation, G.B., R.X. and M.B.G.; writing—original draft preparation, G.B. and M.B.G.; writing—review and editing, G.B., M.B.G. and R.X.; visualization, G.B.; supervision, M.B.G. and X.W.; projectadministration, M.B.G., A.K.N., R.B. and M.E.B.; funding acquisition, M.B.G. All authors have readand agreed to the published version of the manuscript.
Cancers 2021, 13, 617 13 of 14
Funding: Aspects of this work were funded by an Australian Research Council (ARC) grant,DP150104472 (MBG).
Institutional Review Board Statement: The study was conducted according to the guidelines of theDeclaration of Helsinki, and approved by the Institutional Review Board (or Ethics Committee) ofThe University of Sydney (Project No.: 2016/027, Approval Date: 14 February 2016).
Informed Consent Statement: Informed consent was obtained from all subjects involved in the study.
Data Availability Statement: The datasets for image patches presented in this study are openlyavailable in https://github.com/guoqingbao/Pathofusion/tree/master/data; Data of the tissuesections are available from the authors.
Acknowledgments: Biopsies were provided by the Australian Genomics and Clinical Outcomes ofGlioma (AGOG) tissue bank.
Conflicts of Interest: The authors declare no conflict of interest.
References1. LeCun, Y.; Bengio, Y. Convolutional networks for images, speech, and time series. In The Handbook of Brain Theory and Neural
Networks; The MIT Press: Cambridge, MA, USA, 1995; Volume 3361, p. 1995.2. Krizhevsky, A.; Sutskever, I.; Hinton, G.E. Imagenet classification with deep convolutional neural networks. In Advances in Neural
Information Processing Systems; NIPS: Lake Tahoe, Nevada, USA, 2012; pp. 1097–1105.3. Niazi, M.; Parwani, A.; Gurcan, M. Digital pathology and artificial intelligence. Lancet Oncol. 2019, 20, e253–e261. [CrossRef]4. Signaevsky, M.; Prastawa, M.; Farrell, K.; Tabish, N.; Baldwin, E.; Han, N.; Iida, M.A.; Koll, J.; Bryce, C.; Purohit, D.; et al. Artificial
intelligence in neuropathology: Deep learning-based assessment of tauopathy. Lab. Invest. 2019, 99, 1019–1029. [CrossRef][PubMed]
5. Zhang, J.; Wang, J.; Marzese, D.M.; Wang, X.; Yang, Z.; Li, C.; Zhang, H.; Zhang, J.; Chen, C.C.; Kelly, D.F.; et al. B7H3 regulatesdifferentiation and serves as a potential biomarker and theranostic target for human glioblastoma. Lab. Invest. 2019, 99, 1117–1129.[CrossRef] [PubMed]
6. Papanicolau-Sengos, A.; Yang, Y.; Pabla, S.; Lenzo, F.L.; Kato, S.; Kurzrock, R.; DePietro, P.; Nesline, M.; Conroy, J.; Glenn, S.; et al.Identification of targets for prostate cancer immunotherapy. Prostate 2019, 79, 498–505. [CrossRef] [PubMed]
7. Majzner, R.G.; Theruvath, J.L.; Nellan, A.; Heitzeneder, S.; Cui, Y.; Mount, C.W.; Rietberg, S.P.; Linde, M.H.; Xu, P.; Rota, C.; et al.CAR T Cells Targeting B7-H3, a Pan-Cancer Antigen, Demonstrate Potent Preclinical Activity Against Pediatric Solid Tumors andBrain Tumors. Clin. Cancer Res. 2019, 25, 2560–2574. [CrossRef] [PubMed]
8. Dong, P.; Xiong, Y.; Yue, J.; Hanley, S.J.B.; Watari, H. B7H3 As a Promoter of Metastasis and Promising Therapeutic Target.Front. Oncol. 2018, 8, 264. [CrossRef] [PubMed]
9. Rogiers, A.; Boekhout, A.; Schwarze, J.K.; Awada, G.; Blank, C.U.; Neyns, B. Long-Term Survival, Quality of Life, and PsychosocialOutcomes in Advanced Melanoma Patients Treated with Immune Checkpoint Inhibitors. J. Oncol. 2019, 2019, 5269062. [CrossRef][PubMed]
10. Louis, D.N.; Ohgaki, H.; Wiestler, O.D.; Cavenee, W.K. World Health Organization Histological Classification of Tumours of the CentralNervous System; International Agency for Research on Cancer: Lyon, France, 2016.
11. Rojianl, A.; Dorovini-Zis, K. Microvascular proliferation in glioblastoma multiforme. J. Neuropathol. Exp. Neurol. 1990, 49, 300.[CrossRef]
12. Wesseling, P.; Schlingemann, R.O.; Rietveld, F.J.; Link, M.; Burger, P.C.; Ruiter, J.D. Early and extensive contribution of peri-cytes/vascular smooth muscle cells to microvascular proliferation in glioblastoma multiforme: An immuno-light and immuno-electron microscopic study. J. Neuropathol. Exp. Neurol. 1995, 54, 304–310. [CrossRef] [PubMed]
13. Brat, D.J.; van Meir, E.G. Glomeruloid microvascular proliferation orchestrated by VPF/VEGF: A new world of angiogenesisresearch. Am. J. Pathol. 2001, 158, 789–796. [CrossRef]
14. Takashima, Y.; Kawaguchi, A.; Hayano, A.; Yamanaka, R. CD276 and the gene signature composed of GATA3 and LGALS3 enableprognosis prediction of glioblastoma multiforme. PLoS ONE 2019, 14, e0216825. [CrossRef] [PubMed]
15. Inamura, K.; Yokouchi, Y.; Kobayashi, M.; Sakakibara, R.; Ninomiya, H.; Subat, S.; Nagano, H.; Nomura, K.; Okumura, S.;Shibutani, T.; et al. Tumor B7-H3 (CD276) expression and smoking history in relation to lung adenocarcinoma prognosis. LungCancer 2017, 103, 44–51. [CrossRef] [PubMed]
16. Benzon, B.; Zhao, S.G.; Haffner, M.C.; Takhar, M.; Erho, N.; Yousefi, K.; Hurley, P.; Bishop, J.L.; Tosoian, J.; Ghabili, K.; et al.Correlation of B7-H3 with androgen receptor, immune pathways and poor outcome in prostate cancer: An expression-basedanalysis. Prostate Cancer Prostatic Dis. 2017, 20, 28–35. [CrossRef]
17. Lemke, D.; Pfenning, P.-N.; Sahm, F.; Klein, A.-C.; Kempf, T.; Warnken, U.; Schnölzer, M.; Tudoran, R.; Weller, M.; Platten, M.; et al.Costimulatory protein 4IgB7H3 drives the malignant phenotype of glioblastoma by mediating immune escape and invasiveness.Clin. Cancer Res. 2012, 18, 105–117. [CrossRef]
Cancers 2021, 13, 617 14 of 14
18. Kraan, J.; Broek, P.V.D.; Verhoef, C.; Grunhagen, D.J.; Taal, W.; Gratama, J.W.; Sleijfer, S. Endothelial CD276 (B7-H3) expressionis increased in human malignancies and distinguishes between normal and tumour-derived circulating endothelial cells. Br. J.Cancer 2014, 111, 149–156. [CrossRef]
19. Gootjes, E.C.; Kraan, J.; Buffart, T.; Verhoef, C.; Verheul, H.M.; Sleijfer, S. ORCHESTRA Study Group CD276-positive circulatingendothelial cells in advanced colorectal cancer. J. Clin. Oncol. 2019, 37, 572. [CrossRef]
20. He, K.; Zhang, X.; Ren, S.; Sun, J. Deep residual learning for image recognition. In Proceedings of the IEEE Conference onComputer Vision and Pattern Recognition, Las Vegas, NV, USA, 27–30 June 2016; pp. 770–778.
21. Chollet, F. Xception: Deep learning with depthwise separable convolutions. In Proceedings of the IEEE Conference on ComputerVision and Pattern Recognition, Honolulu, HI, USA, 21–26 July 2017; pp. 1251–1258.
22. Mezirow, J. Transformative Dimensions of Adult Learning. In Proceedings of the ERIC, Alexandria, VA, USA, 30 October–1 November 1991.
23. Raina, R.; Battle, A.; Lee, H.; Packer, B.; Ng, A.Y. Self-taught learning: Transfer learning from unlabeled data. In Proceedings ofthe 24th International Conference on Machine Learning, Corvalis, OR, USA, 20–24 June 2007; ACM: New York, NY, USA, 2007;pp. 759–766.
24. Bengio, Y. Deep learning of representations for unsupervised and transfer learning. In Proceedings of the ICML Workshop onUnsupervised and Transfer Learning, Edinburgh, UK, 1–26 July 2012; pp. 17–36.
25. Deng, J.; Dong, W.; Socher, R.; Li, L.-J.; Li, K.; Fei-Fei, L. Imagenet: A large-scale hierarchical image database. In Proceedings ofthe 2009 IEEE Conference on Computer Vision and Pattern Recognition, Miami, FL, USA, 20–25 June 2009; pp. 248–255.
26. Bao, G.; Graeber, M.B.; Wang, X. A Bifocal Classification and Fusion Network for Multimodal Image Analysis in Histopathology.In Proceedings of the 16th International Conference on Control, Automation, Robotics and Vision (ICARCV 2020), Shenzhen,China, 13–15 December 2020.
27. Shan, H.; Zhang, Y.; Yang, Q.; Kruger, U.; Kalra, M.K.; Sun, L.; Cong, W.; Wang, G. 3-D Convolutional Encoder-Decoder Networkfor Low-Dose CT via Transfer Learning From a 2-D Trained Network. IEEE Trans. Med Imaging 2018, 37, 1522–1534. [CrossRef][PubMed]
28. Samala, R.K.; Chan, H.; Hadjiiski, L.; Helvie, M.A.; Richter, C.D.; Cha, K.H. Breast Cancer Diagnosis in Digital Breast Tomosyn-thesis: Effects of Training Sample Size on Multi-Stage Transfer Learning Using Deep Neural Nets. IEEE Trans. Med Imaging 2019,38, 686–696. [CrossRef] [PubMed]
29. Weiss, K.; Khoshgoftaar, T.M.; Wang, D. A survey of transfer learning. J. Big Data 2016, 3, 9. [CrossRef]30. Kornblith, S.; Shlens, J.; Le, Q.V. Do better imagenet models transfer better? In Proceedings of the IEEE Conference on Computer
Vision and Pattern Recognition, Long Beach, CA, USA, 15–20 June 2019; pp. 2661–2671.31. Raghu, M.; Zhang, C.; Kleinberg, J.; Bengio, S. Transfusion: Understanding transfer learning for medical imaging. In Advances in
Neural Information Processing Systems; Vancouver Convention Center: Vancouver, BC, Canada, 2019; pp. 3342–3352.32. Dubrofsky, E. Homography Estimation. Master’s Thesis, Univerzita Britské Kolumbie, Vancouver, BC, Canada, 2009.33. Janowczyk, A.; Basavanhally, A.; Madabhushi, A. Stain normalization using sparse autoencoders (StaNoSA): Application to
digital pathology. Comput. Med Imaging Graph. 2017, 57, 50–61. [CrossRef] [PubMed]