pathway to low-carbon lignite utilization - cslf · pathway to low-carbon lignite utilization –...
TRANSCRIPT
PATHWAY TO LOW-CARBON LIGNITE UTILIZATION –
A PARTNERSHIP OF RESOURCE OWNERS/ DEVELOPERS, ENERGY PRODUCERS, STATE AND FEDERAL GOVERNMENT, TECHNOLOGY DEVELOPERS, AND RESEARCH PROVIDERS
Tom EricksonCEO
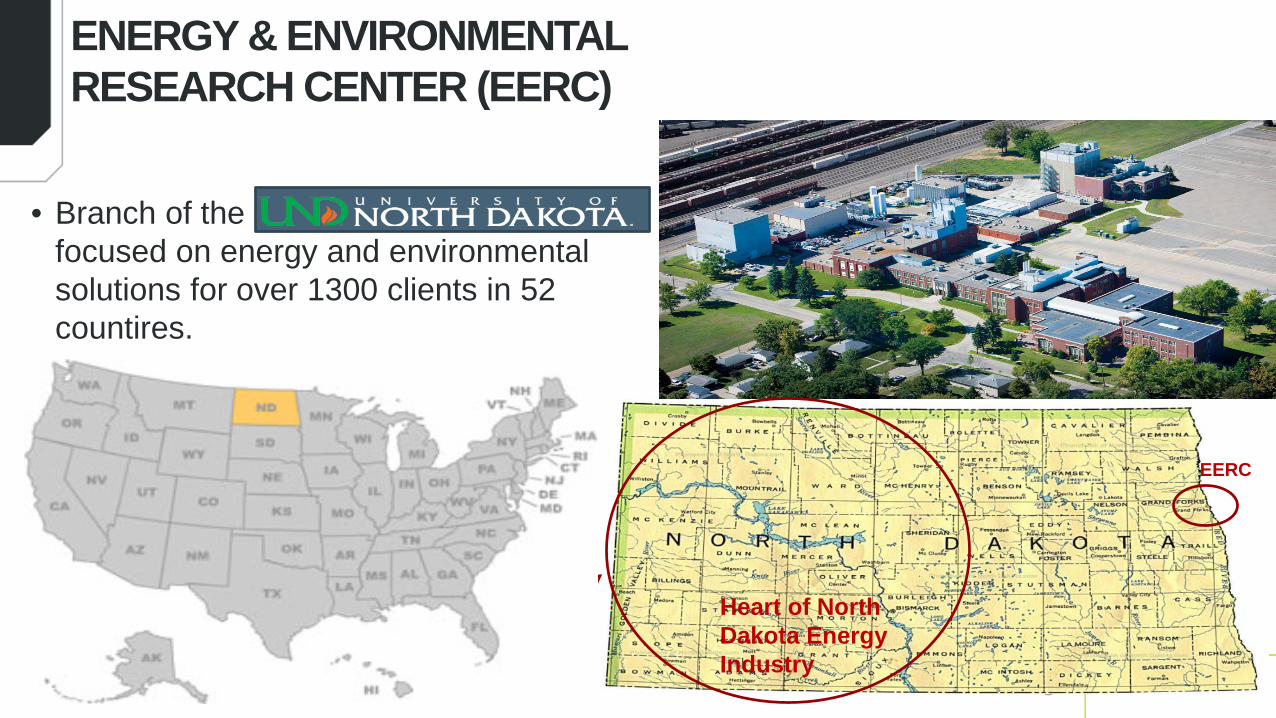
ENERGY & ENVIRONMENTAL RESEARCH CENTER (EERC)
• Branch of the University of North Dakota focused on energy and environmental solutions for over 1300 clients in 52 countires.
EERC
Heart of North Dakota Energy Industry
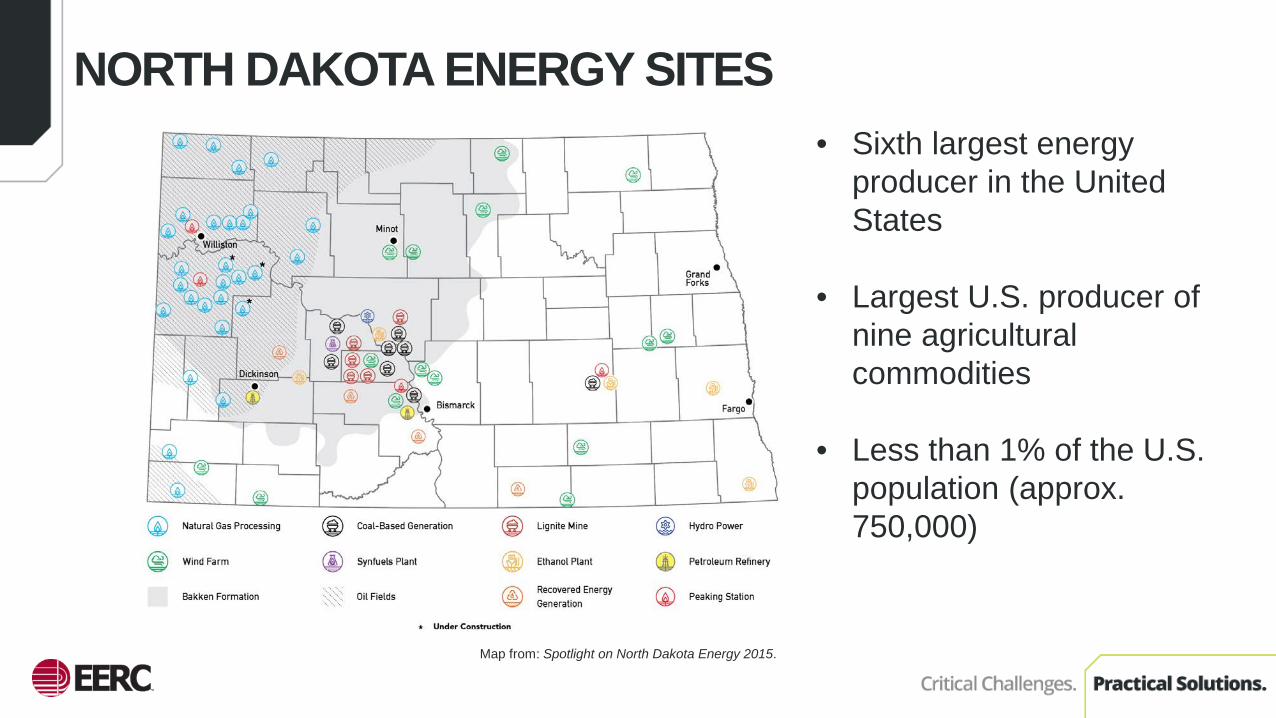
NORTH DAKOTA ENERGY SITES
Map from: Spotlight on North Dakota Energy 2015.
• Sixth largest energy producer in the United States
• Largest U.S. producer of nine agricultural commodities
• Less than 1% of the U.S. population (approx. 750,000)
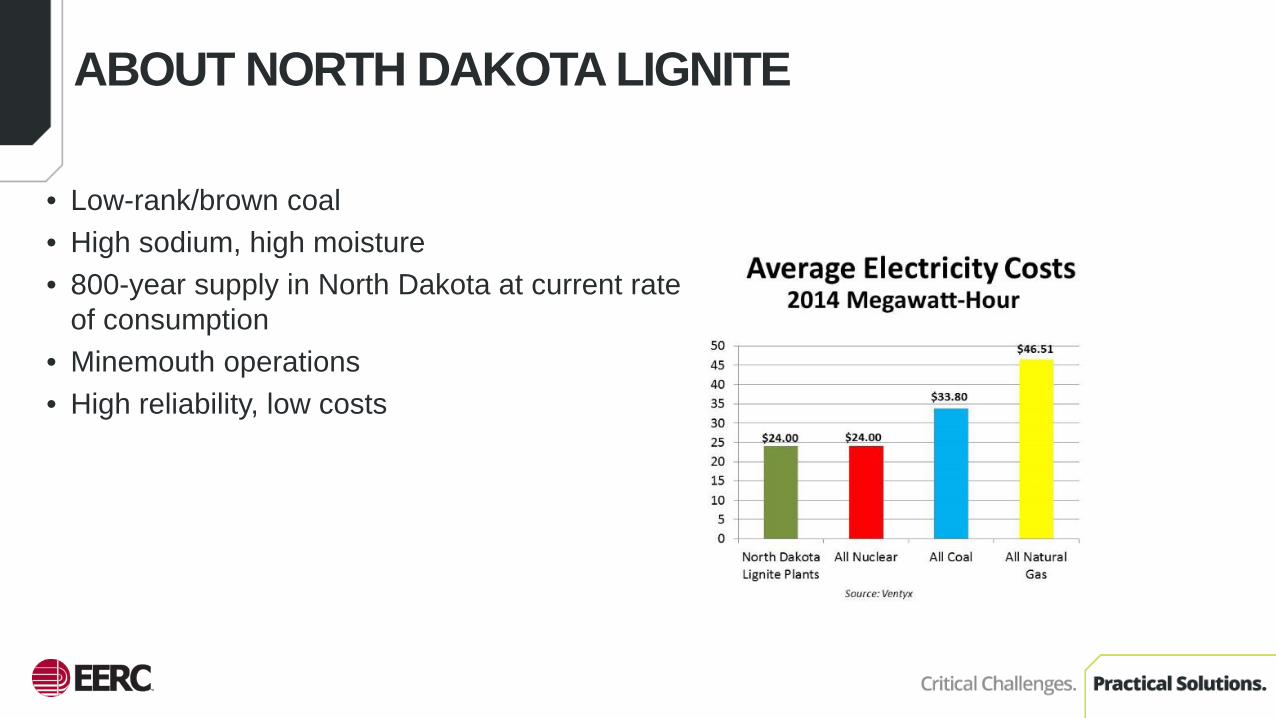
ABOUT NORTH DAKOTA LIGNITE
• Low-rank/brown coal• High sodium, high moisture• 800-year supply in North Dakota at current rate
of consumption• Minemouth operations• High reliability, low costs

NORTH DAKOTA LIGNITE HAS SIMILAR PROPERTIES TO MANY OTHER COALS FROM AROUND THE WORLD
0
0.2
0.4
0.6
0.8
1
1.2
0
50
100
150
200
250
300
350
Inte
rnat
iona
l Coa
ls, #
Freq
uenc
y of
Ana
lysi
s N
D, #
Na2O in ash, wt%
Australian-Loy Yang(high Na)
China - Zinjiang(High Na)
Indonesia-Berau (high Na)German-Rhenish (high Na)
Canada-Fort Union (high Na)
China-Zhundong(med Na)
Indonesia-Berau(med Na)
Canada-FortUnion (low Na)
Australian-Yalloum(low Na)
China-Hulumbuir(low Na)
ND Lignite Frequency Distribution, 1300 Samples
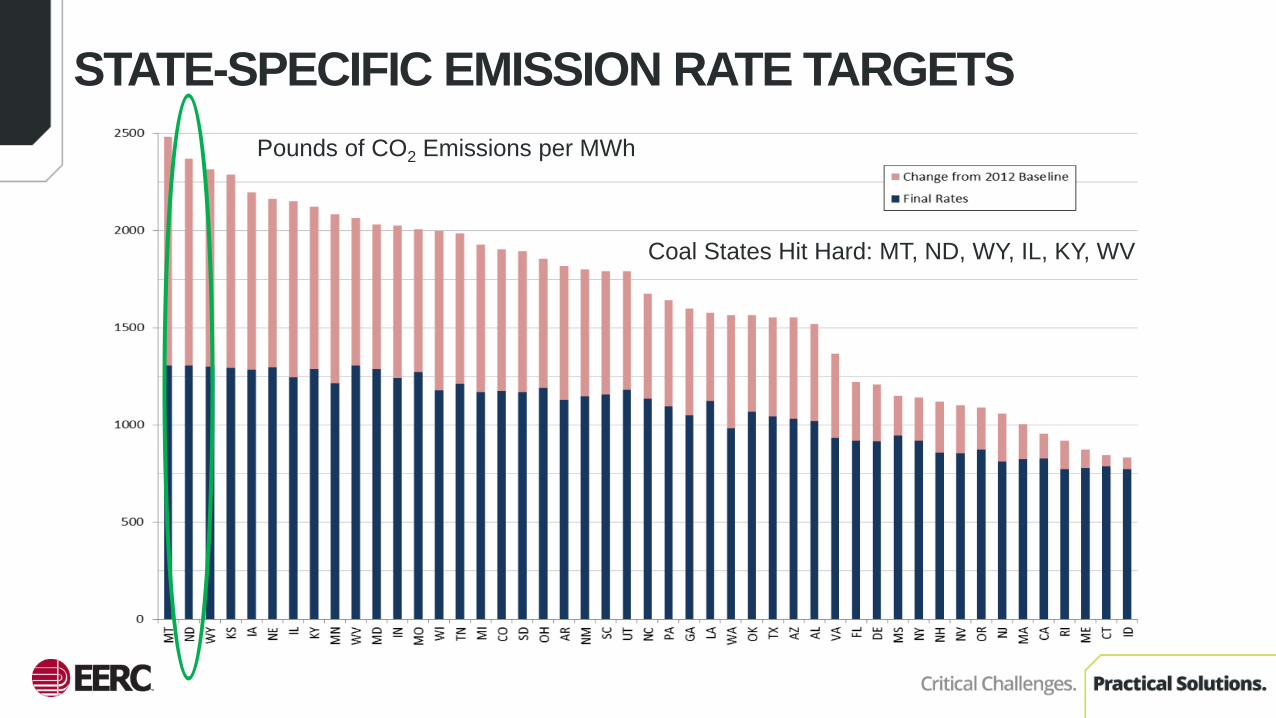
STATE-SPECIFIC EMISSION RATE TARGETSPounds of CO2 Emissions per MWh
Coal States Hit Hard: MT, ND, WY, IL, KY, WV

LOWERING THE CARBON INTENSITY – STRENGTHENING NORTH DAKOTA’S ECONOMY
Advanced PowerCycles
Carbon CaptureTechnologies
Renewables/Agriculture
Carbon Storage Conventional EOR Bakken EOR
Ener
gy P
rodu
ctio
nC
O2
Util
izat
ion
North Dakota’s Economy
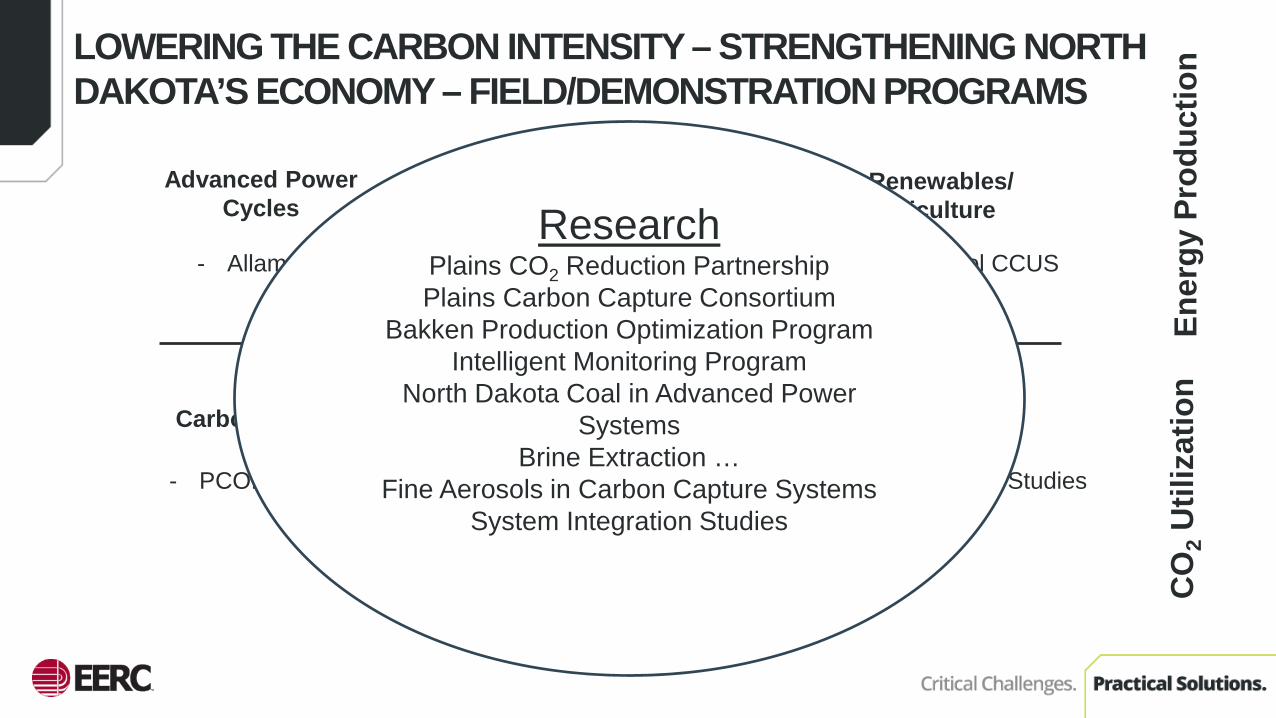
LOWERING THE CARBON INTENSITY – STRENGTHENING NORTH DAKOTA’S ECONOMY – FIELD/DEMONSTRATION PROGRAMS
Advanced PowerCycles
Carbon CaptureTechnologies
Renewables/Agriculture
Carbon Storage Conventional EOR Bakken EOR
- Allam Cycle - Project Tundra - Ethanol CCUS
- PCOR Partnership - Bell Creek - CO2 EOR Field Studies
Ener
gy P
rodu
ctio
nC
O2
Util
izat
ion
ResearchPlains CO2 Reduction PartnershipPlains Carbon Capture Consortium
Bakken Production Optimization ProgramIntelligent Monitoring Program
North Dakota Coal in Advanced Power Systems
Brine Extraction …Fine Aerosols in Carbon Capture Systems
System Integration Studies
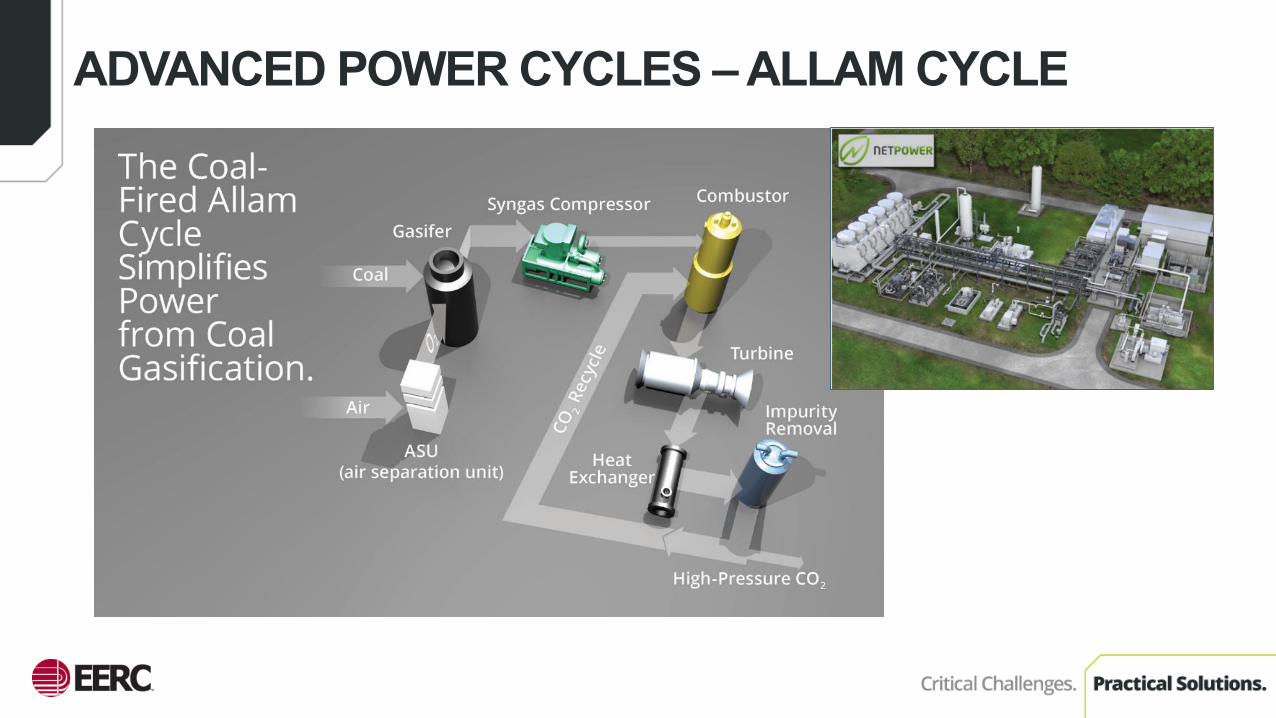
ADVANCED POWER CYCLES ‒ ALLAM CYCLE
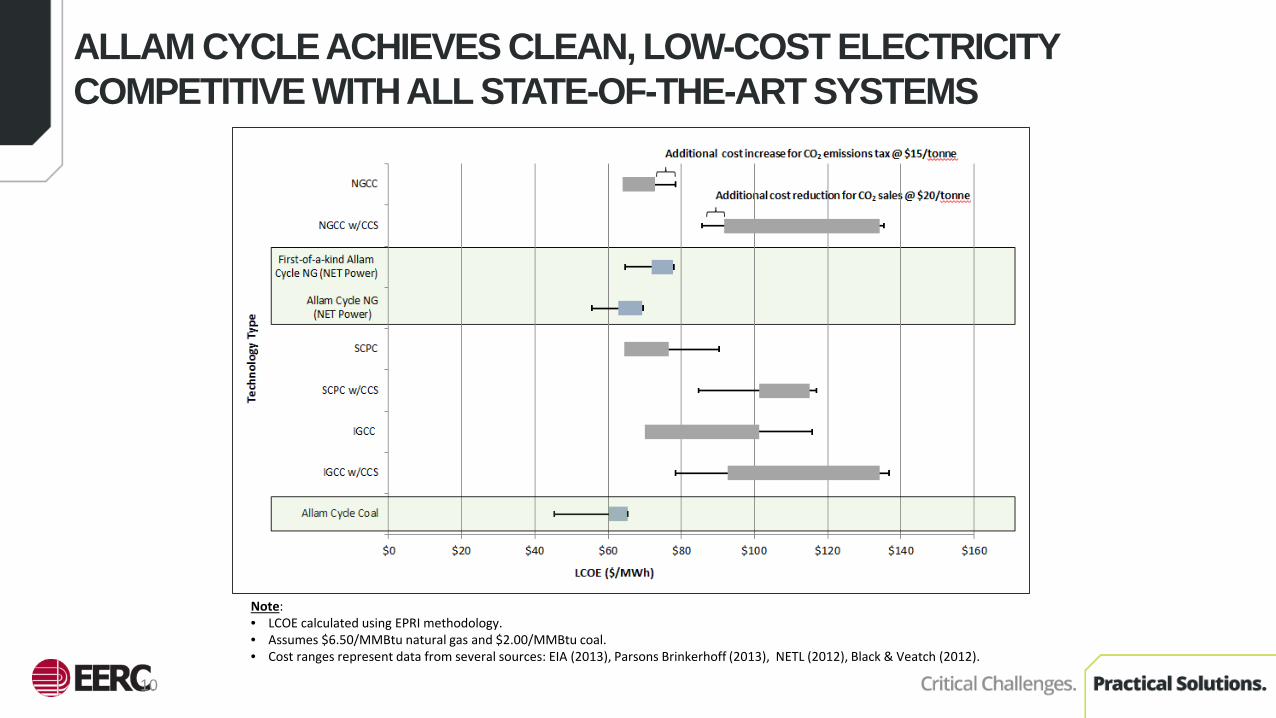
ALLAM CYCLE ACHIEVES CLEAN, LOW-COST ELECTRICITY COMPETITIVE WITH ALL STATE-OF-THE-ART SYSTEMS
10
Note:• LCOE calculated using EPRI methodology.• Assumes $6.50/MMBtu natural gas and $2.00/MMBtu coal.• Cost ranges represent data from several sources: EIA (2013), Parsons Brinkerhoff (2013), NETL (2012), Black & Veatch (2012).

PATHWAY TO LOW-CARBON LIGNITE UTILIZATION
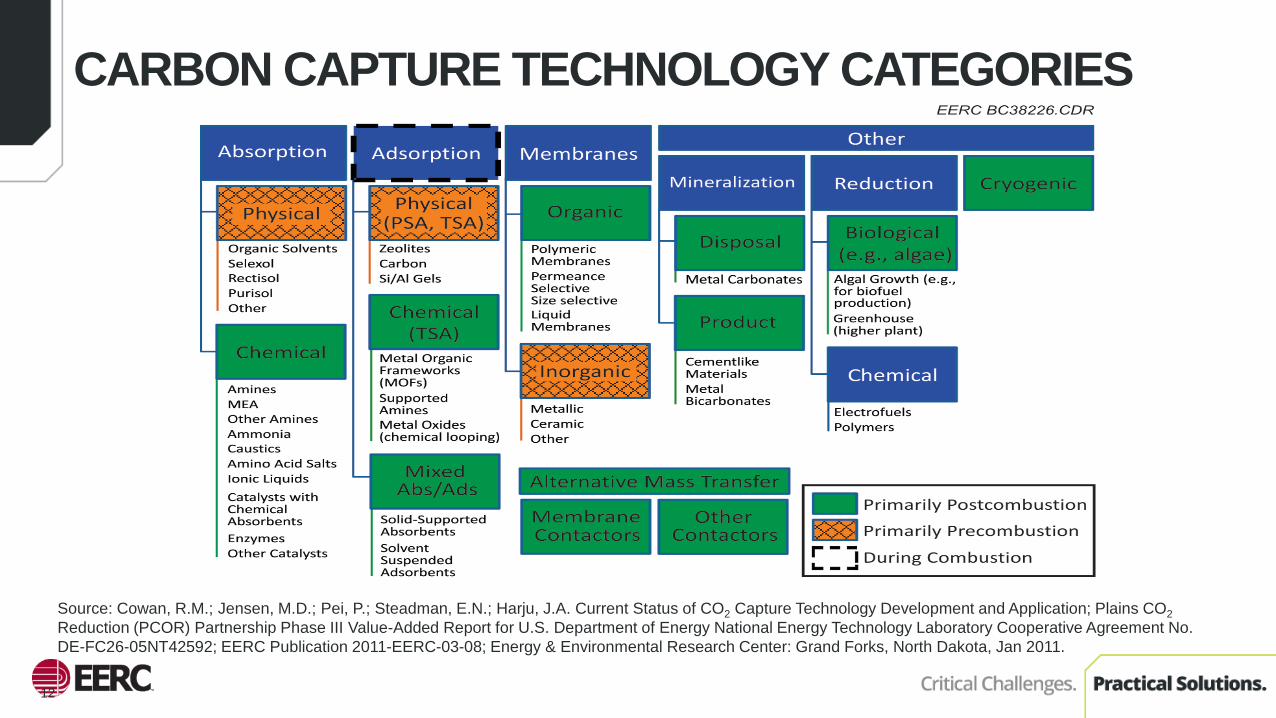
CARBON CAPTURE TECHNOLOGY CATEGORIES
Source: Cowan, R.M.; Jensen, M.D.; Pei, P.; Steadman, E.N.; Harju, J.A. Current Status of CO2 Capture Technology Development and Application; Plains CO2Reduction (PCOR) Partnership Phase III Value-Added Report for U.S. Department of Energy National Energy Technology Laboratory Cooperative Agreement No. DE-FC26-05NT42592; EERC Publication 2011-EERC-03-08; Energy & Environmental Research Center: Grand Forks, North Dakota, Jan 2011.
12

PARTNERSHIP FOR CO2 CAPTURE (PCO2C) PROGRAM

AEROSOL ISSUES FOR CARBON CAPTURE• Very small particle
derived from fuel impurities (Flagan, 1988)
• Growth of aerosol in the CO2 capture system – resulting in lost solvent and emissions

Utility Industry Carbon Solutions – Project Tundra
Key Technology ImprovementsAddressing the key technical challenges from recent projects to improve efficiency and performance.
Tundra Design –Gen 2.0 ProjectAdvance technology: Scale up and broaden design and its application for industry.Federal and state funding and tax credit support.
CO2 for EOR and SequestrationIdentify locations and partners; design and test sequestration; permit corridor for CO2 pipeline and infrastructure for EOR and sequestration.
Pre-FEED and FEED & Pilot TestingFEED for full project and agreements for offtake and sequestration.Pilot testing at MR Young Station.Finalize federal and state support.
Commercial ApplicationDetailed engineering, procurement, & construction.Operation and affirmation of capture, EOR, and sequestration solutions for industry.
August 2016
CO2 to Sequestration
Time Line and Cost Estimate
2015–2016$1 million
2016–2017$5 million
2017–2018$50 million
2018–2019$100 million
2020–2022$1.1 billion
Project Tundra Road Map
Bakken Oil and Gas Fields
Coal Mine
16
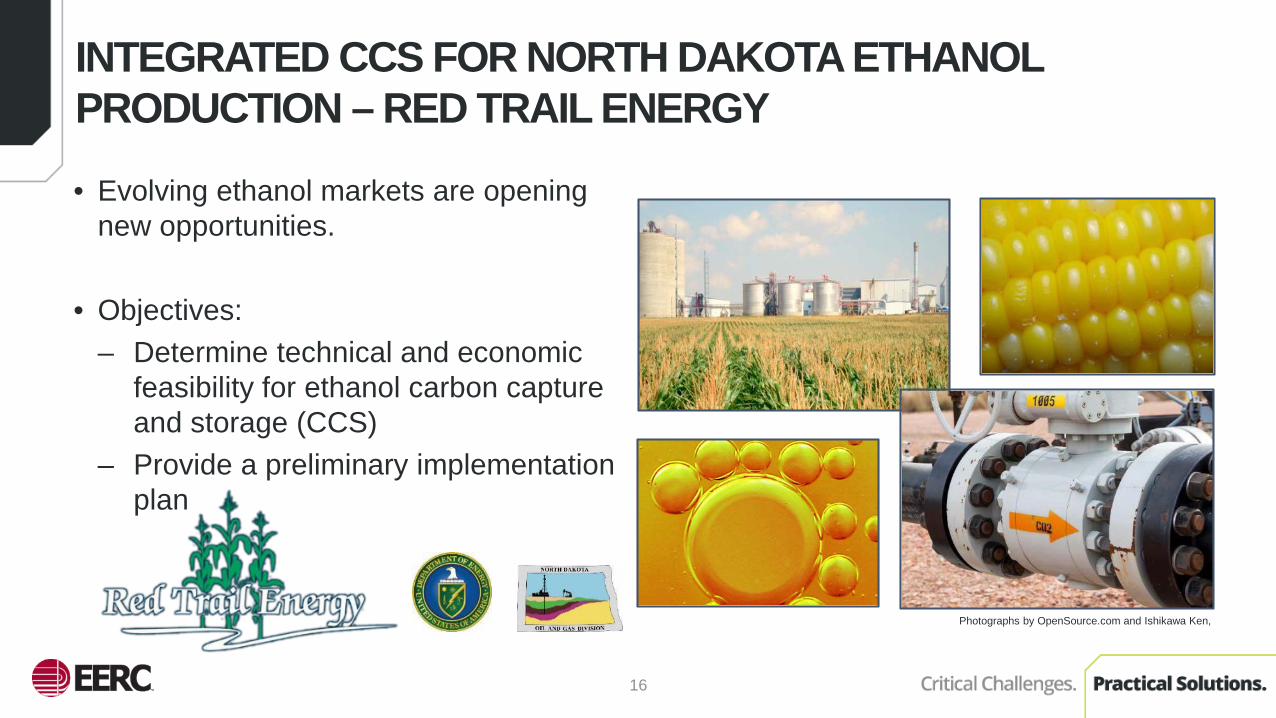
INTEGRATED CCS FOR NORTH DAKOTA ETHANOL PRODUCTION – RED TRAIL ENERGY
• Evolving ethanol markets are opening new opportunities.
• Objectives: – Determine technical and economic
feasibility for ethanol carbon capture and storage (CCS)
– Provide a preliminary implementation plan
Photographs by OpenSource.com and Ishikawa Ken,

ETHANOL FUTURE WITH CCS
0 20 40 60 80 100CI, gCO2e/MJ
Source: California Air Resources Board (July 2016)
LCFS Gasoline 2020 Goal
LCFS Gasoline 2016
Midwest Ethanol Producers 2016
RTE 2016
RTE Goal w/CCS
Current and Projected Carbon Intensity (CI) by Fuel Type

REGIONAL CO2 PARTNERSHIPS ACROSS NORTH AMERICA
18

PCOR PARTNERSHIP

Oil Fields6000+ fields evaluated.
Fields in the Williston, Powder River, Denver–Julesberg, and Alberta Basins were evaluated.
Used two methods:enhanced oil recovery (EOR) and
volumetric
• EOR approach: Evaluated ~160 fields
Sequestration capacity = 1 billion tonsIncremental oil
>3 billion bbl• Volumetric approach:
Thousands of fields, totalcapacity >10 billion tons

THE BRAVE NEW WORLD –UNCONVENTIONAL RESERVOIRS
BAKKEN CO2 DEMAND FOR NORTH DAKOTA –A 30,000-FT VIEW
Based on the following:• Traditional evaluation techniques• North Dakota Industrial Commission (NDIC)
original-oil-in-place (OOIP) estimates• 4% incremental recovery• Net utilization of 5000 and 8000 ft3/bbl
2–3.2 Bt of CO2 needed, yielding 4–7 Bbbl of oil. North Dakota currently produces ~33 Mtpy of CO2. Bakken growth is creating a projected increase in
power demand.
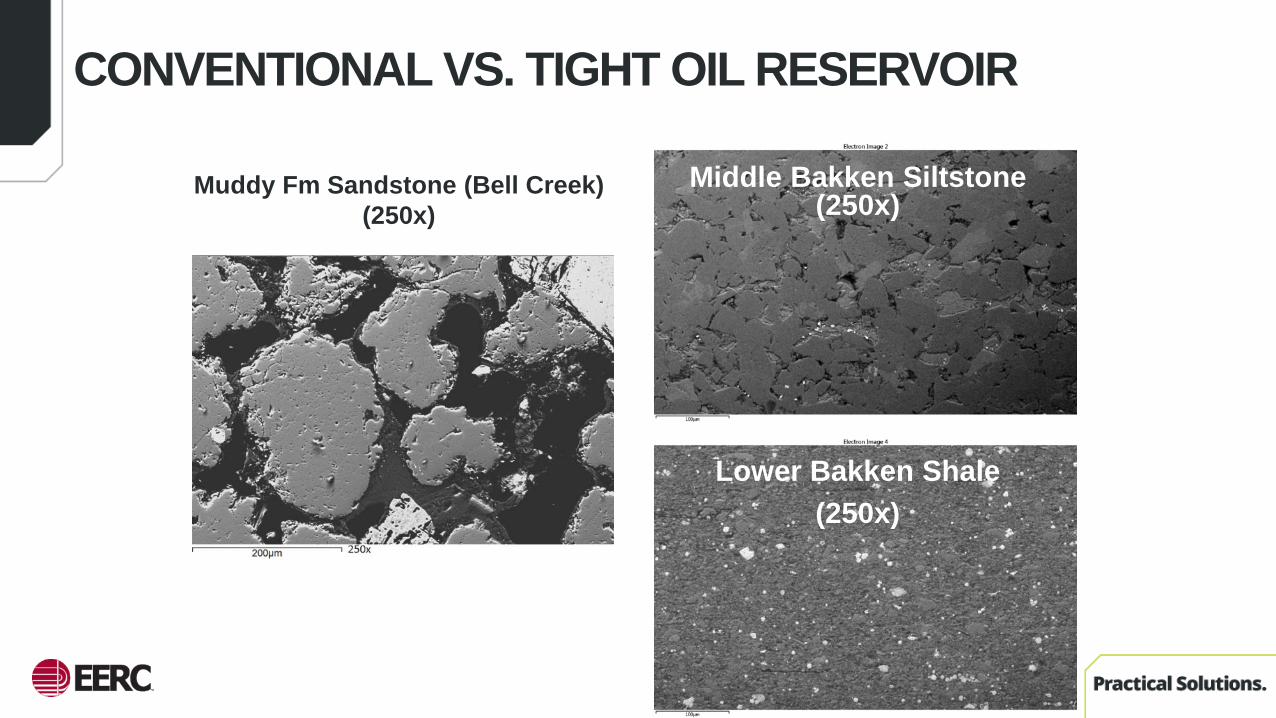
CONVENTIONAL VS. TIGHT OIL RESERVOIR
Muddy Fm Sandstone (Bell Creek)(250x)
Lower Bakken Shale (250x)
Middle Bakken Siltstone (250x)
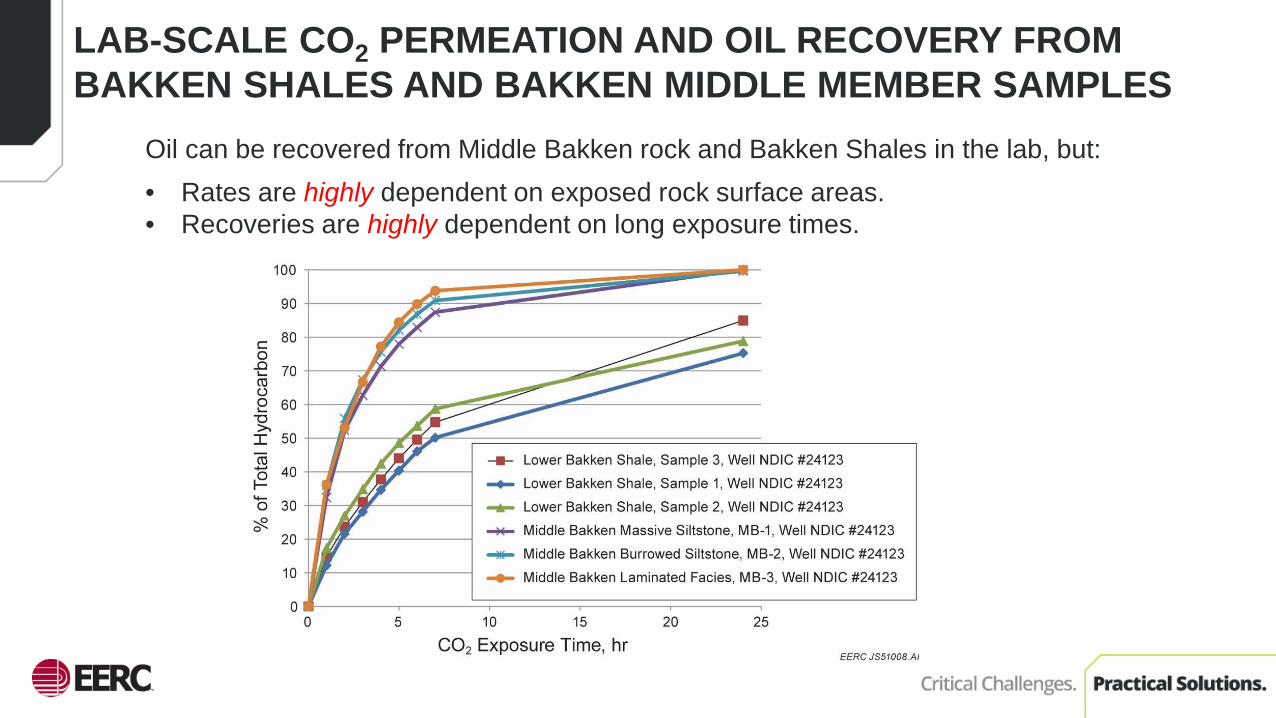
Oil can be recovered from Middle Bakken rock and Bakken Shales in the lab, but:• Rates are highly dependent on exposed rock surface areas.• Recoveries are highly dependent on long exposure times.
LAB-SCALE CO2 PERMEATION AND OIL RECOVERY FROM BAKKEN SHALES AND BAKKEN MIDDLE MEMBER SAMPLES
27
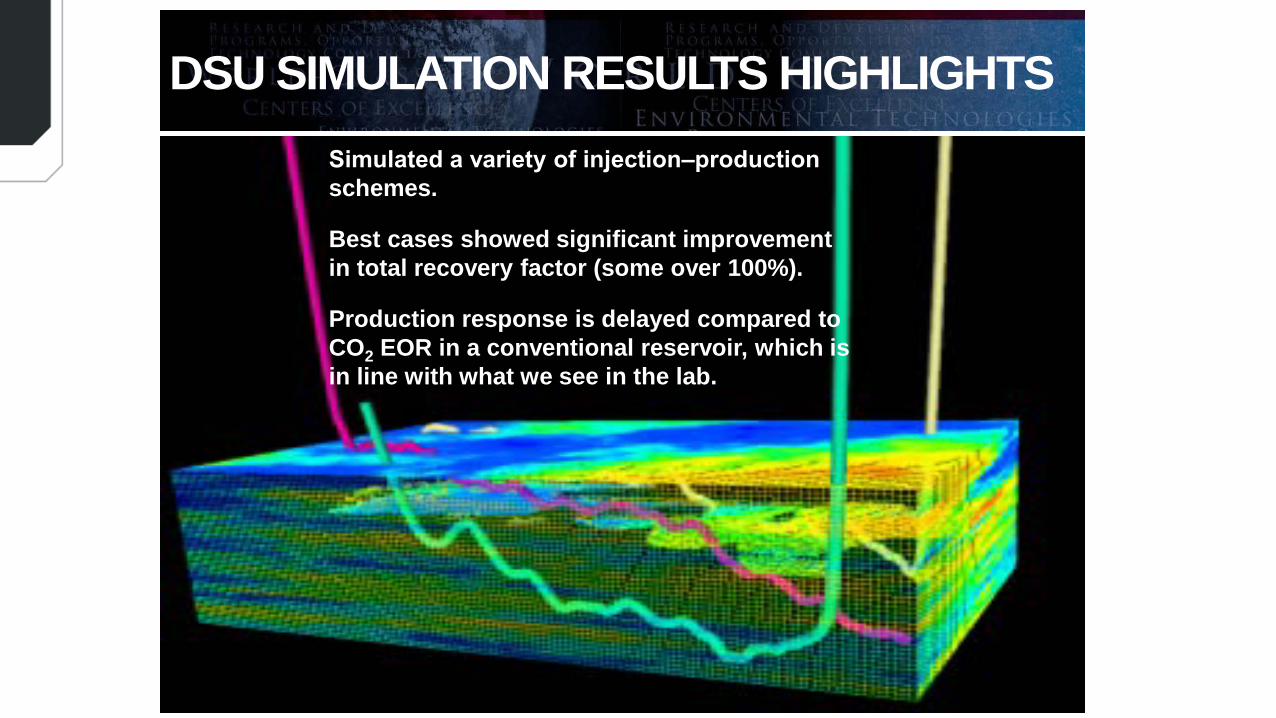
DSU SIMULATION RESULTS HIGHLIGHTS
DFNFrom NW McGregor (Mission Canyon)
From NW McGregor (Mission Canyon)
Simulated a variety of injection‒production schemes.
Best cases showed significant improvement in total recovery factor (some over 100%).
Production response is delayed compared to CO2 EOR in a conventional reservoir, which is in line with what we see in the lab.
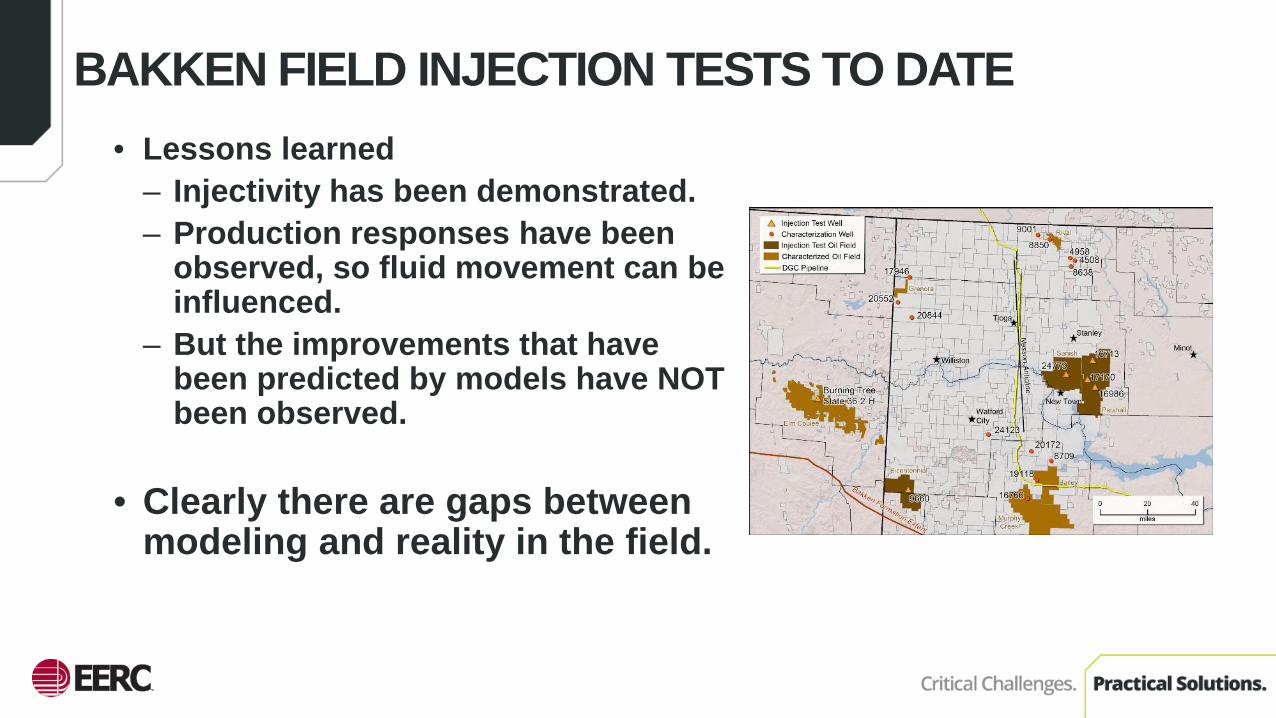
BAKKEN FIELD INJECTION TESTS TO DATE• Lessons learned
– Injectivity has been demonstrated.– Production responses have been
observed, so fluid movement can be influenced.
– But the improvements that have been predicted by models have NOT been observed.
• Clearly there are gaps between modeling and reality in the field.
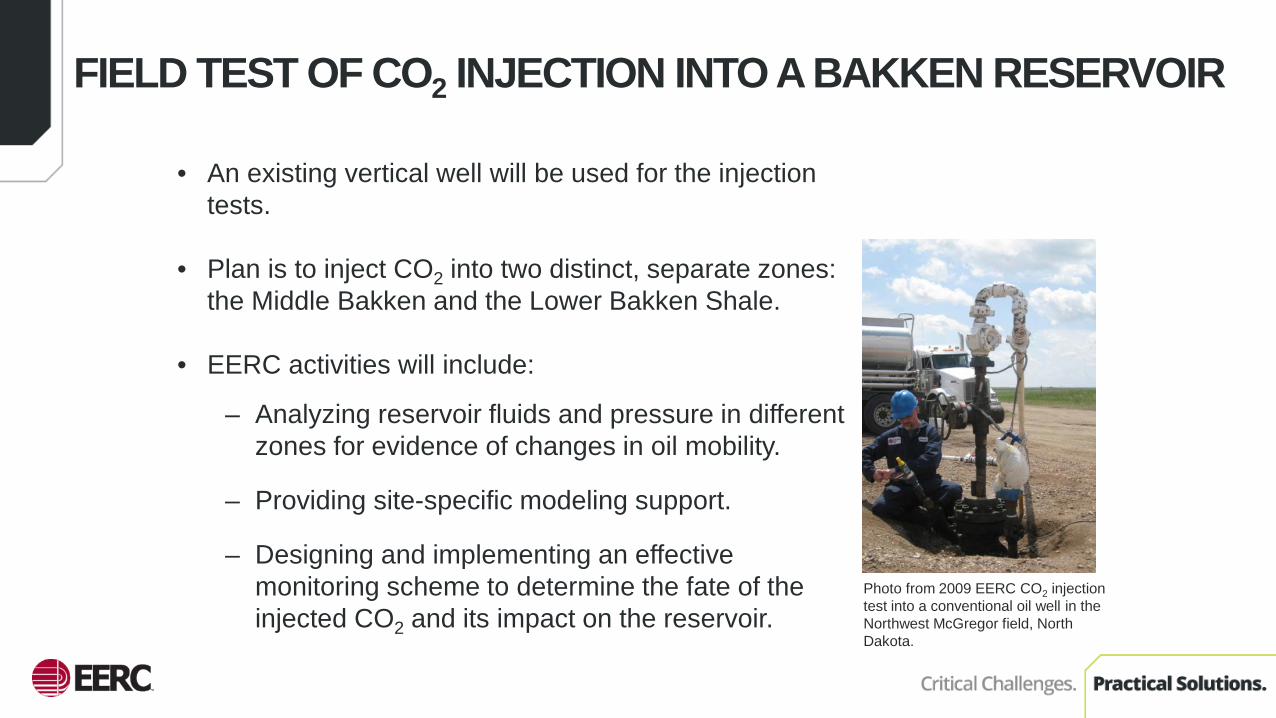
FIELD TEST OF CO2 INJECTION INTO A BAKKEN RESERVOIR
• An existing vertical well will be used for the injection tests.
• Plan is to inject CO2 into two distinct, separate zones: the Middle Bakken and the Lower Bakken Shale.
• EERC activities will include:
– Analyzing reservoir fluids and pressure in different zones for evidence of changes in oil mobility.
– Providing site-specific modeling support.
– Designing and implementing an effective monitoring scheme to determine the fate of the injected CO2 and its impact on the reservoir.
Photo from 2009 EERC CO2 injection test into a conventional oil well in the Northwest McGregor field, North Dakota.

NORTH DAKOTA’S SOLUTION MUST FOCUS ON WORKING TOGETHER!
Coal
Oil
Gas
CarbonManagement Water
Wind
Biomass

THANK YOU!

CONTACT INFORMATION
Energy & Environmental Research CenterUniversity of North Dakota15 North 23rd Street, Stop 9018Grand Forks, ND 58202-9018
www.undeerc.org701.777.5000 (phone)701.777.5181 (fax)