pathways - stanford university · pathways th overt n nequalit eport rac n thnicit the stanford...
TRANSCRIPT
Pathwaysa magazine on poverty, inequality, and social policy Special Issue 2017
2017
SUBSCRIBE NOW!Would you like to continue receiving a free copy of Pathways? Sign up for hard copy delivery or PDF notification at inequality.stanford.edu.
Stanford Center on Poverty and Inequality inequality.stanford.edu
Established in 2007, the Stanford Center
on Poverty and Inequality is a program
of the Institute for Research in the Social
Sciences at Stanford University. We
gratefully acknowledge core support from
the Elfenworks Foundation for the Center,
Pathways Magazine, and the State of the
Union on Poverty and Inequality.

PATHWAYS • The Poverty and Inequality Report • Race and Ethnicity
table of contents
Executive Summary David B. Grusky, Charles Varner, and Marybeth Mattingly
Employment Michael Hout
Poverty Linda M. Burton, Marybeth Mattingly, Juan Pedroza, and Whitney Welsh Safety Net Mark Duggan and Valerie Scimeca Housing Matthew Desmond
Education Sean F. Reardon and Erin M. Fahle Incarceration Becky Pettit and Bryan Sykes
Health Rucker C. Johnson
Earnings Colin Peterson, C. Matthew Snipp, and Sin Yi Cheung
Wealth Thomas Shapiro
Intergenerational Mobility Florencia Torche
3
5
9
13
16
20
24
27
32
36
39

Special Issue 2017
Pathwaysa magazine on poverty, inequality, and social policy
EDITORIAL BOARD
Peter Bearman, Columbia UniversityDavid Card, University of California at Berkeley Joshua Cohen, Apple University and Stanford UniversityDalton Conley, Princeton UniversityGreg Duncan, University of California at Irvine Kathryn Edin, Johns Hopkins University Paula England, New York UniversityRobert Frank, Cornell University Mark Granovetter, Stanford UniversityRobert Hauser, National Research CouncilMichael Hout, New York UniversityJon Krosnick, Stanford UniversityGlenn Loury, Brown UniversityHazel Markus, Stanford UniversityDouglas Massey, Princeton University Susan Mayer, University of ChicagoCharles Murray, American Enterprise Institute for Public Policy ResearchKatherine Newman, University of MassachusettsThomas Piketty, Paris School of EconomicsWoody Powell, Stanford UniversityBarbara Reskin, University of WashingtonRichard Saller, Stanford UniversityWilliam Julius Wilson, Harvard University
STANFORD CENTER ON POVERTY AND INEQUALITY
Building 370, 450 Serra Mall, Stanford UniversityStanford, CA 94305-2029Tel: 650-724-6912 Fax: 650-736-9883Email: [email protected]: inequality.stanford.edu
The contents of this issue are solely the responsibility of the authors and do not necessarily reflect the views or official policies of the Stanford Center on Poverty and Inequality or any of its funders, including the Corporation for National and Community Service and the U.S. Department of Health and Human Services; nor does mention of trade names, commercial practices, or organizations imply endorsement by the U.S. Government or by the Stanford Center on Poverty and Inequality or any of its funders.
SUGGESTED CITATION FORMAT
Stanford Center on Poverty and Inequality, ed. 2017. “State of the Union: The Poverty and Inequality Report.” Special issue, Pathways Magazine.
Hout, Michael. 2017. “Employment.” In “State of the Union: The Poverty and Inequality Report,” ed. Stanford Center on Poverty and Inequality, special issue, Pathways Magazine.
© Stanford Center on Poverty and Inequality, 2017. All rights reserved.
SENIOR EDITORSDavid GruskyCharles VarnerMarybeth Mattingly
RESEARCH SCHOLARJonathan Fisher
COMMUNICATIONS MANAGERStephanie Garlow
ART DIRECTORRobin Weiss
COPY EDITORElissa Rabellino
ADMINISTRATORDanielle Choi
PATHWAYS • The Poverty and Inequality Report • Race and Ethnicity
The Stanford Center on Poverty and Inequality
the poverty and inequality report
The Stanford Center on Poverty and Inequality (CPI) is a nonpartisan organization dedicated to monitoring trends in key poverty and inequality outcomes, under-
standing the sources of such trends, and developing science-based policy targeting those sources. We present here our fourth annual report examining the “state of the union” on poverty, inequality, and labor market outcomes. In this year’s report, we focus on racial and ethnic gaps in poverty and inequality, with the simple objective of describing the size of those gaps in 10 key domains (i.e., employment, poverty, safety net use, housing, education, incarceration, health, earnings, wealth, and mobility).
There are of course all manner of excellent studies that address each of these domains separately. This report provides an integrated analysis that brings together evidence across domains and thus allows for a more comprehensive assessment of where the country stands. In the absence of such integrated analysis, it is easy to default to piecemeal policy targeted to particular disparities, even when those disparities emanate from common causes and might be addressed in a more coordinated and powerful way. There is some virtue, then, in occasionally stepping back and asking whether the country’s piecemeal approach to policy is working.
What are the main descriptive findings coming out of our report? It would be difficult not to be concerned, first and foremost, by the profound inequalities that persist in many domains. This point may be illustrated, for example, by considering racial and ethnic disparities in homeownership, long viewed as the litmus test of social inclusion and an especially important commitment within the American Dream. We might well have hoped that, some eight decades after the New Deal’s expansion of home mort-gages, the most important racial and ethnic inequalities in homeownership would have been largely resolved. The home-mortgage expansion, as Matthew Desmond nicely
BY DAVID B. GRUSKY, CHARLES VARNER,
AND MARYBETH MATTINGLY
STATE OF THE UNION 2017

PATHWAYS • The Poverty and Inequality Report • Race and Ethnicity
4 executive summary
lays out, in fact had quite the opposite effect. In 2014, a full 71 percent of white families lived in owner-occupied housing, as compared with 41 percent of black families and 45 percent of Hispanic families (see p. 16). This gap is partly attributable to the still-substantial wealth, income, and employment gaps among racial and ethnic groups. The prime-age employment ratio for black men, for example, was 11 percentage points lower (in January 2017) than the corresponding ratio for white men (see p. 6). There are likewise large racial and ethnic gaps in educational test scores, educational attainment, poverty, wealth, and much more.
This is not to gainsay the importance of declining disparities in many domains. The ongoing effort to reform the country’s criminal justice system has, for example, yielded modest changes and may ultimately bring about truly transformative ones (see pp. 24–26). In 2015, 9.1 percent of young black men (ages 20–34) were incarcerated, a rate that is 5.7 times higher than that of young white men (1.6%). The corresponding dis-parity ratio in 2000 was as high as 7.7 (i.e., black incarceration rate: 11.5%; white incarceration rate: 1.5%). Although the racial gap in incarceration has thus only begun to decline, the changes have been larger in some of our other domains (see, especially, pp. 39–41).
In almost all domains, the gaps nonetheless remain substan-tial, indeed the rate of decline is sometimes slowing down or even stalling out. The earnings series provide a case in point: Between 1970 and 2010, the earnings gap between whites and blacks narrowed somewhat, but most of the decline was secured in the immediate aftermath of the Civil Rights Move-ment (see p. 32). At the end of the series, median earnings for black males were still 32 percent lower than median earnings for white males, a modest improvement of just 7 percentage points in four decades. Meanwhile, the median earnings gap between white and Hispanic males actually grew, from 29 percent to 42 percent. It also bears noting that much recent policy, such as anti-immigrant legislation, has had the effect of increasing rather than reducing inequality.
This evidence suggests that major institutional reforms, like the Civil Rights Movement, often do more disruptive work than the “gradualist processes” that we often bank on. It has been commonplace to emphasize such gradualist changes as (a) the diffusion of meritocratic and bureaucratic hiring prac-tices, (b) the expansion of secondary and post-secondary schooling, or (c) the “weeding out” of firms that are uncom-petitive by virtue of their inefficient tastes for discrimination. If gradualism of this sort ever worked, it seems that it has nearly reached its limits.
What would a more disruptive approach entail? There is grow-ing evidence that a very substantial reduction in disparities could be secured by simply equalizing “starting conditions” across racial and ethnic groups. As both Sean Reardon (pp. 20–23) and Rucker Johnson (pp. 27–31) emphasize, much of the inequality that shows up later in the life course is due to the one-two punch of (a) profound disparities in family background (e.g., racial-ethnic differences in parental wealth, education, and income), and (b) profound disparities in neigh-borhood conditions (e.g., racial-ethnic differences in such neighborhood amenities as high-quality schooling, low crime rates, or the absence of environmental hazards). These very unequal starting conditions are of course then reinforced by subsequent exposure to educational, labor market, and criminal justice institutions that are riddled with discrimina-tory practices. Will it suffice, then, to eliminate disparities in starting conditions? Of course not. It is nonetheless espe-cially attractive to cut off at the source those processes of cumulative advantage and disadvantage that convert smaller differences early in life to larger ones in adulthood.
The upshot is that, insofar as the country were ever to com-mit to fair competition among children of all racial and ethnic groups, substantial headway in reducing racial and ethnic inequalities could be made. Although some might label this “disruptive reform,” it in fact entails nothing more than a full-throated and authentic commitment to old-fashioned equal opportunity initiatives. ■
head 5
The Stanford Center on Poverty and Inequality
PATHWAYS • The Poverty and Inequality Report • Race and Ethnicity
Jobs and employment are central to the history of dis-crimination and exclusion in the United States. Even
in the 21st century, racial and ethnic disparities persist.1 This report will show that, in the two recessions of this century, African-American men’s employment rates fell farther and recovered more slowly than did other men’s employment. The effects of job loss linger, too, in the anxiety of people who are working. African-American and Hispanic workers, both male and female, feel less secure in their jobs than do non-Hispanic white men and women.
The prime-age employment ratio—the percentage of people 25 to 54 years old who are employed—is the pre-ferred measure of labor force conditions over long time spans. The monthly unemployment rate is more familiar, of course, but it can give a distorted view of long-term trends because many people stop looking for work dur-ing recessions, behavior that is not reflected in official unemployment statistics. Also, given the dramatic growth in women’s formal employment during the second half of the last century, it is important to distinguish between men and women in addressing these long-term employ-ment trends.
Figure 1 traces the trends in the prime-age employment ratio for men and women (separately) from four different racial and ethnic groups (again, separately) from January 2000 to January 2017.2 This figure highlights the two sets of recession months (March 2001 to November 2001; December 2007 to June 2009) for easy reference.
At the turn of the century, the economy was strong, and Congress was debating how to dispose of the first fed-eral budget surplus in a generation. Prime-age men’s employment was the highest it had been in 12 years;3 roughly 90 percent of prime-age white and Hispanic men were employed. Prime-age African-American men’s employment was significantly lower, close to 80 percent,
but substantially higher than it was in the early 1990s. Prime-age women’s employment was the highest ever recorded;4 75 percent of white and African-American women were employed. Prime-age Hispanic women’s employment rates were significantly lower than other women’s but also at historic highs for them.
The data for African-Americans are striking in two ways. The first striking result: African-American men’s employ-ment has been 11 to 15 percentage points lower than other men’s employment in every month since January 2000. In fact, for every month for which we have data (i.e., back to 1940), African-American men’s employ-ment rate has been lower than that of other men. These descriptive trends are not sufficient to establish cause-and-effect relationships, but research designed to isolate the causes of black men’s worse employment outcomes consistently finds significant effects of racial discrimination, arrest records, and, for older men, weaker educational credentials.5
The second striking result speaks to the interaction between race and recession. African-American men’s employment deficit grew worse during both of the last two recessions, especially during the Great Recession (2007–2009), and it stayed worse for more than a year after the recessions ended. These trends are clear in Fig-
KEY FINDINGS
• Full recovery from the job losses of the Great Recession eluded African-American men even as the rest of the population approached full employment.
• Job loss can also unsettle those who haven’t lost their jobs. 1 in 9 African-Americans and 1 in 6 Hispanic Americans fear a job loss within one year, while just 1 in 18 whites do.
BY MICHAEL HOUT
employmentSTATE OF THE UNION 2017

50
60
70
80
90
100
2000 2004 2008 2012 2016 2000 2004 2008 2012 2016
Men Women
White
Observed
Smoothed
Black
Observed
Smoothed
Hispanic
Observed
Smoothed
Asian
Observed
Smoothed
Prim
e-ag
e E
mpl
oym
ent R
atio
Year
50
60
70
80
90
100
2000 2004 2008 2012 2016 2000 2004 2008 2012 2016
Men Women
White
Observed
Smoothed
Black
Observed
Smoothed
Hispanic
Observed
Smoothed
Asian
Observed
Smoothed
Prim
e-ag
e E
mpl
oym
ent R
atio
Year
PATHWAYS • The Poverty and Inequality Report • Race and Ethnicity
6 employment
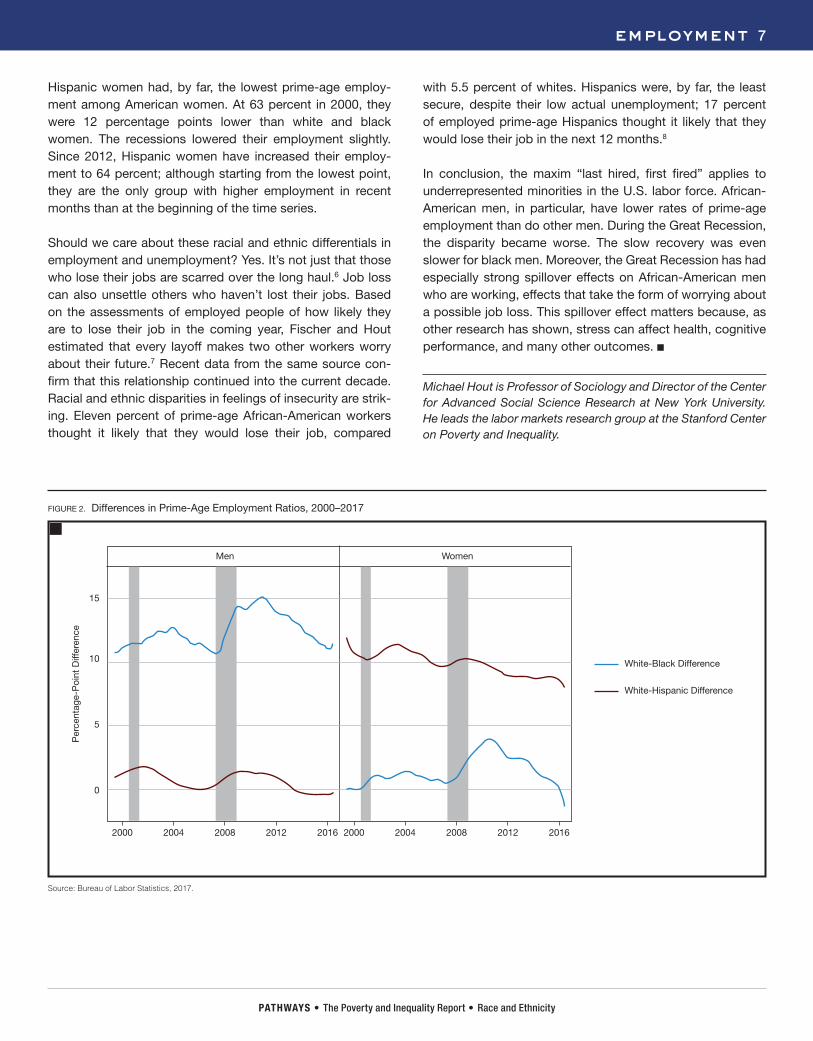
ure 2. The black-white gap in men’s prime-age employment rose from 11 percentage points in January 2000 to almost 13 percentage points in June 2004, fell back to about 11 percent-age points on the eve of the Great Recession in December 2007, rose very rapidly through the recession, paused and then reached its contemporary peak of 15 percentage points from April through October 2011, and receded to 11 percent-age points again only in recent months.
But what about other groups? Hispanic men face many of the challenges that African-American men face, but their employment ratios differed little from those of white men in any month. Hispanic men’s employment fell about two per-centage points more than white men’s did in each of the recessions, but the gap quickly returned to zero each time.
Asian men had slightly higher employment than white or His-panic men in each month for which we have data. The gap is less than one percentage point, on average, but it is signifi-cant that, except for a few months in 2015, Asian men had a consistently higher employment ratio.
The racial and ethnic trends for women differ from those for men. Women’s prime-age employment peaked right around the turn of the century. For white women, that peak was 75 percent in January 2000. White women’s employment was lowest throughout 2011 and 2012, at just below 70 percent. This trough occurred two to three years after the end of the Great Recession and persisted months after men’s employ-ment started upward again. In the last four years, prime-age white women’s employment rose slowly to almost 72 percent (in January 2017).
African-American women’s employment also peaked in Janu-ary 2000 at 75 percent. The Great Recession affected black women’s employment more than white women’s; it fell to 66 percent through 2011. Since then, prime-age black women have found employment at a higher rate than white women; 73 percent of prime-age African-American women were employed in January 2017. The black-white gap for women is clearly very different from that for men.
FIGURE 1. Prime-Age Employment Ratio by Racial-Ethnic Group and Gender, 2000–2017
Source: Bureau of Labor Statistics, 2017.
50
60
70
80
90
100
2000 2004 2008 2012 2016 2000 2004 2008 2012 2016
Men Women
White
Observed
Smoothed
Black
Observed
Smoothed
Hispanic
Observed
Smoothed
Asian
Observed
Smoothed
Prim
e-ag
e E
mpl
oym
ent R
atio
Year2004 20042000 20002008 20082012 20122016 2016
100
90
80
70
60
50
Prim
e-A
ge E
mp
loym
ent
Rat
io (%
)
Men Women
PATHWAYS • The Poverty and Inequality Report • Race and Ethnicity
head 7 employment 7
Hispanic women had, by far, the lowest prime-age employ-ment among American women. At 63 percent in 2000, they were 12 percentage points lower than white and black women. The recessions lowered their employment slightly. Since 2012, Hispanic women have increased their employ-ment to 64 percent; although starting from the lowest point, they are the only group with higher employment in recent months than at the beginning of the time series.
Should we care about these racial and ethnic differentials in employment and unemployment? Yes. It’s not just that those who lose their jobs are scarred over the long haul.6 Job loss can also unsettle others who haven’t lost their jobs. Based on the assessments of employed people of how likely they are to lose their job in the coming year, Fischer and Hout estimated that every layoff makes two other workers worry about their future.7 Recent data from the same source con-firm that this relationship continued into the current decade. Racial and ethnic disparities in feelings of insecurity are strik-ing. Eleven percent of prime-age African-American workers thought it likely that they would lose their job, compared
with 5.5 percent of whites. Hispanics were, by far, the least secure, despite their low actual unemployment; 17 percent of employed prime-age Hispanics thought it likely that they would lose their job in the next 12 months.8
In conclusion, the maxim “last hired, first fired” applies to underrepresented minorities in the U.S. labor force. African-American men, in particular, have lower rates of prime-age employment than do other men. During the Great Recession, the disparity became worse. The slow recovery was even slower for black men. Moreover, the Great Recession has had especially strong spillover effects on African-American men who are working, effects that take the form of worrying about a possible job loss. This spillover effect matters because, as other research has shown, stress can affect health, cognitive performance, and many other outcomes. ■
Michael Hout is Professor of Sociology and Director of the Center for Advanced Social Science Research at New York University. He leads the labor markets research group at the Stanford Center on Poverty and Inequality.
FIGURE 2. Differences in Prime-Age Employment Ratios, 2000–2017
Source: Bureau of Labor Statistics, 2017.
20042000 2008 2012 2016 20042000 2008 2012 2016
15
10
5
0
Per
cent
age-
Poi
nt D
iffer
ence
Men Women
White-Black Difference
White-Hispanic Difference

PATHWAYS • The Poverty and Inequality Report • Race and Ethnicity
8 employment
NOTES
1. Hout, Michael, Asaf Levanon, and Erin Cumberworth. 2012. “Job Loss and Unemployment.” In The Great Recession, eds. David B. Grusky, Bruce Western, and Christopher Wimer. New York: Russell Sage Foundation, 59–80.
2. Data series for Asian Americans begin in 2010. Seasonally adjusted data are not available for specific racial or ethnic groups.
3. Hout et al., 2012.
4. Hout et al., 2012.
5. Massey, Douglas. 2008. Categorically Unequal: The American Stratification System. New York: Russell Sage Foundation.
6. Gangl, Markus. 2006. “Scar Effects of Unemployment: An Assessment of Institutional Complementarities.” American Sociological Review 71(6), 986–1013.
7. Fischer, Claude S., and Michael Hout. 2006. Century of Difference: How America Changed in the Last One Hundred Years. New York: Russell Sage Foundation, 131–133.
8. Original calculations for the chapter from the General Social Survey, 2012–2016.
DATA
Each month, the Census Bureau, on behalf of the Bureau of Labor Statistics (BLS), collects data from a representative sample of American households. One person answers on behalf of all persons, 16 years old and over, in the household. The BLS releases its monthly estimates on the first Friday of the following month. The BLS releases counts of the total number of jobs in the economy, based on a survey of employers, the same day they release the household data. They usually slightly revise all estimates a month or two later as subsequent events clarify uncertainties in the survey data. See https://www.bls.gov/data/ for details. Sampling introduces some volatility into the time series, and seasonal employment cycles (such as holiday hiring) add to that volatility. I mitigate their effects by focusing on the smoothed time series, ignoring month-to-month variation that is not reflected in the smoothed trends.
I supplement the objective employment data with subjective data from the General Social Survey (GSS), a biennial survey of a representative sample of U.S. households. Employed persons answer the question: “Thinking about the next 12 months, how likely do you think it is that you will lose your job or be laid off? Would that be very likely, fairly likely, not too likely, or not at all likely?” Sample sizes are much smaller than in the employment surveys (about 2,800 per survey). The associated sampling error is plus or minus 4 percentage points for whites and higher for smaller groups.
BLS DATA SERIES USED
Prime-Age Employment, Men All: LNS12300061 White: LNU02300064 Black: LNU02300067 Hispanic: LNU02300070 Asian: LNU02332330
Prime-Age Employment, Women All: LNS12300062 White: LNU02300065 Black: LNU02300068 Hispanic: LNU02300071 Asian: LNU02332371
head 9
The Stanford Center on Poverty and Inequality
PATHWAYS • The Poverty and Inequality Report • Race and Ethnicity
STATE OF THE UNION 2017
Who are America’s poor? The popular discourse leads many to believe that they comprise blacks
residing in urban ghettos, Hispanic immigrants parceled into Latino and Chicano enclaves across rural and urban locales, Native Americans in geographically isolated reservations, and whites with long-standing intergenera-tional ties to Appalachia. Is this popular discourse—which melds together race, ethnicity, and place—on the mark?
We take a closer look at poverty by race and place by asking whether these commonly reported profiles of the poor mask different types of spatial variation within specific racial-ethnic groups. Throughout our analysis, we focus on household heads aged 25 and over.1 Our data are from the Decennial Census (1980, 1990, 2000), the American Community Survey (2015), and the Annual Social and Economic Supplement of the Current Popula-tion Survey (2007–2015).
Trends in Poverty by Race and EthnicityLooking back over the past 35 years, we see dramatic differences by race and ethnicity in the risk of poverty. We see two Americas, with blacks, Hispanics, and Native Americans experiencing the high-poverty America, and Asians and whites experiencing the (relatively) low-pov-erty America.2 This portrait holds in rough form over the entire time series shown in Figure 1. Although Hispan-ics had somewhat lower poverty rates than blacks and Native Americans in 1980, this gap closed during the Great Recession.
In the most recent data from 2015, one in four blacks and Native Americans, and one in five Hispanics, are poor. This contrasts with one in ten whites and Asians. Although the poverty rate for whites is low, whites make up the major-ity of the nation’s poor because there are more whites in the total population. In comparison, blacks and Hispan-ics, who comprise just 25 percent of all household heads, account for 44 percent of the nation’s poor.
The Geography of Poverty by Race and EthnicityHow is poverty arrayed spatially? Cities have the highest poverty rate (18%), rural areas have a somewhat lower rate (15%), and suburban areas have the lowest rate (9%). If poverty is examined by region, we find that the poverty rate in the South (14%) is slightly higher than in the rest of the country (13%). Yet given its larger popula-tion, the South has a much higher share of the country’s poor households (41%). In comparison, the West has 22 percent, the Midwest 20 percent, and the Northeast 17 percent of the country’s poor households.
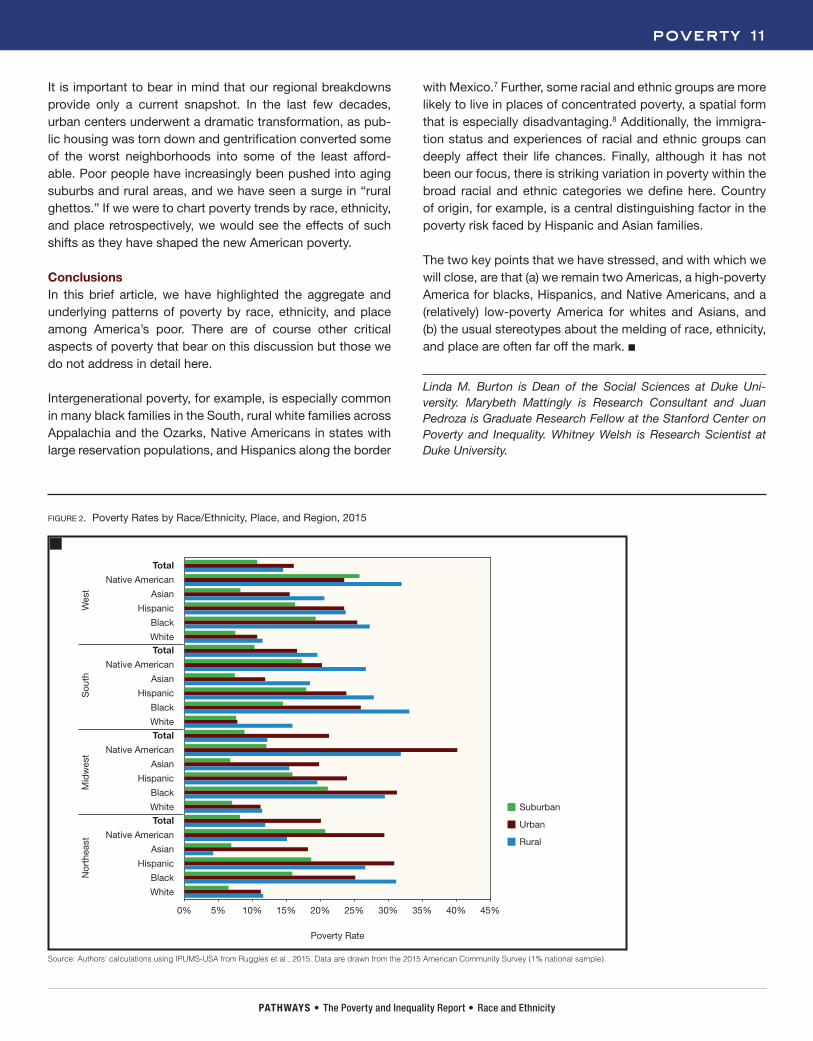
These broad characterizations of the spatial distribu-tion of poverty, which do not consider race and ethnicity, hide much variability. While the inner city provides the prototypical image of poverty in the United States, rural poverty rates are often higher for some groups. When we examine the geography of racial and ethnic poverty, as we do in Figure 2, we find that blacks (33%) and Hispan-ics (28%) in the rural South, blacks in the rural Northeast (31%), and Native Americans in the rural West (32%) have among the highest poverty rates in the country. The latter rural groups face a greater poverty risk than these same racial and ethnic groups do in the cities of these regions.
KEY FINDINGS
• Though some gaps have narrowed, there remain substantial racial-ethnic differences in poverty, with blacks and Native Americans continuing to experience the highest poverty rates, Hispanics following with slightly lower rates, and whites and Asians experiencing the lowest poverty rates.
• The sizes of these racial-ethnic gaps often differ substantially by region, with black women in the rural South, for example, facing poverty rates as high as 37 percent.
BY LINDA M. BURTON, MARYBETH MATTINGLY,
JUAN PEDROZA, AND WHITNEY WELSH
poverty

PATHWAYS • The Poverty and Inequality Report • Race and Ethnicity
10 poverty
The high poverty rate in the rural South (20% overall) is partic-ularly noteworthy. Why is this rate so high? It is partly because black women in the rural South have a poverty rate of 37 per-cent (in 2015). In fact, single mothers in the rural South face some of the highest rates of poverty in the nation.3
The rural South, of course, has a unique context given the legacy of slavery. This legacy lives on in continued forms of racial exclusion and disadvantage. Impoverished rural minority communities serve as “dumping grounds” for urban America:
Economically declining rural communities have become home for America’s growing prison population, hazardous and toxic waste sites, landfills, slaughterhouses, and commerical feedlots (that pollute the groundwater, rivers, and streams). These forms of economic development often involve matters of environmental justice and racial discrimination, bringing many competing economic and community interests into potential conflict.4
More detailed data also reveal that poor Hispanics are increasingly settling in rural areas and Southeastern states.5 Although cities in the Northeast have the highest Hispanic poverty rate (nearly 31%), the Hispanic population in the Northeast is a small fraction of the country’s total Hispanic population. Indeed, just 11 percent of poor Hispanics now reside in the Northeastern urban core.
The rural South is also exceptional for its high white poverty rate. Whites experience similar poverty rates (11–12%) in the urban and rural areas of the West, Northeast, and Midwest. In the South, however, poverty rates are much higher (16%) among rural whites than they are among whites residing in cities (8%). This difference is tied closely to declines in extrac-tive industries, like mining, that historically provided decent jobs without large investments in education. Similar to inner cities experiencing economic distress, many of these com-munities today lack a strong education infrastructure. Limited skills and limited opportunity present a double challenge for residents in these communities.6
FIGURE 1. Poverty Rates by Race/Ethnicity, 1980–2015
19851980 1990 1995 2000 2005 2010 2015
35%
30%
25%
20%
15%
10%
5%
0%
White Black Hispanic Asian Native American
Po
vert
y R
ate
Note: Figures 1 and 2 are limited to heads of household aged 25 and over who identify as one of the five racial/ethnic categories above. The poverty rates pertain to the Official Poverty Measure.Source: Authors’ calculations using IPUMS-USA from Ruggles et al., 2015, and IPUMS-CPS microdata from Flood et al., 2015. Data are drawn from the Decennial Census (1980 5% state sample; 1990 1% metro sample; and 2000 5% sample) and the Annual Social and Economic Supplement of the Current Population Survey (2007–2015).
PATHWAYS • The Poverty and Inequality Report • Race and Ethnicity
poverty 11
It is important to bear in mind that our regional breakdowns provide only a current snapshot. In the last few decades, urban centers underwent a dramatic transformation, as pub-lic housing was torn down and gentrification converted some of the worst neighborhoods into some of the least afford-able. Poor people have increasingly been pushed into aging suburbs and rural areas, and we have seen a surge in “rural ghettos.” If we were to chart poverty trends by race, ethnicity, and place retrospectively, we would see the effects of such shifts as they have shaped the new American poverty.
ConclusionsIn this brief article, we have highlighted the aggregate and underlying patterns of poverty by race, ethnicity, and place among America’s poor. There are of course other critical aspects of poverty that bear on this discussion but those we do not address in detail here.
Intergenerational poverty, for example, is especially common in many black families in the South, rural white families across Appalachia and the Ozarks, Native Americans in states with large reservation populations, and Hispanics along the border
with Mexico.7 Further, some racial and ethnic groups are more likely to live in places of concentrated poverty, a spatial form that is especially disadvantaging.8 Additionally, the immigra-tion status and experiences of racial and ethnic groups can deeply affect their life chances. Finally, although it has not been our focus, there is striking variation in poverty within the broad racial and ethnic categories we define here. Country of origin, for example, is a central distinguishing factor in the poverty risk faced by Hispanic and Asian families.
The two key points that we have stressed, and with which we will close, are that (a) we remain two Americas, a high-poverty America for blacks, Hispanics, and Native Americans, and a (relatively) low-poverty America for whites and Asians, and (b) the usual stereotypes about the melding of race, ethnicity, and place are often far off the mark. ■
Linda M. Burton is Dean of the Social Sciences at Duke Uni-versity. Marybeth Mattingly is Research Consultant and Juan Pedroza is Graduate Research Fellow at the Stanford Center on Poverty and Inequality. Whitney Welsh is Research Scientist at Duke University.
FIGURE 2. Poverty Rates by Race/Ethnicity, Place, and Region, 2015
Source: Authors’ calculations using IPUMS-USA from Ruggles et al., 2015. Data are drawn from the 2015 American Community Survey (1% national sample).
Total
Native American
Asian
Hispanic
Black
WhiteTotal
Native American
Asian
Hispanic
Black
White
Total
Native American
Asian
Hispanic
Black
White
Total
Native American
Asian
Hispanic
Black
White
Wes
tS
outh
Mid
wes
tN
orth
east
0% 15% 30%5% 20% 35%10% 25% 40% 45%
Rural
Urban
Suburban
Poverty Rate

PATHWAYS • The Poverty and Inequality Report • Race and Ethnicity
12 poverty
NOTES
1. We assume that the primary survey respondent is the household head. The age group in our analysis (25 and over) includes those who have had an opportunity to complete formal education. We restrict our analysis to household heads so as not to include duplicate respondents from the same address. All figures are limited to five racial/ethnic categories as follows: Hispanic and non-Hispanic whites, blacks, Asians, and Native Americans.
2. Ruggles, Steven, Katie Genadek, Ronald Goeken, Josiah Grover, and Matthew Sobek. 2015. Integrated Public Use Microdata Series: Version 6.0 [dataset]. Minneapolis: University of Minnesota. Retrieved from http://doi.org/10.18128/D010.V6.0; Flood, Sarah, Miriam King, Steven Ruggles, and J. Robert Warren. 2015. Integrated Public Use Microdata Series, Current Population Survey: Version 4.0 [dataset]. Minneapolis: University of Minnesota. Retrieved from http://doi.org/10.18128/D030.V4.0.
3. Mattingly, Marybeth J., and Jessica A. Bean. 2010. “The Unequal Distribution of Child Poverty: Highest Rates Among Young Blacks and Children of Single Mothers in Rural America.” Issue Brief No. 18. University of New Hampshire. Retrieved from http://scholars.unh.edu/cgi/viewcontent.cgi?article=1123&context=carsey.
4. Burton, Linda M., Daniel T. Lichter, Regina S. Baker, and John M. Eason. 2013. “Inequality, Family Processes, and Health in the ‘New’ Rural America.” American Behavioral Scientist 57(8), 1134.
5. Saenz, Rogelio. 2012. “Rural Race and Ethnicity.” In International Handbook of Rural Demography, eds. László J. Kulcsár and Katherine J. Curtis. New York: Springer, 207–223; Macartney, Suzanne, Alemayehu Bishaw, and Kayla Fontenot. 2013. “Poverty Rates for Selected Detailed Race and Hispanic Groups by State and Place: 2007–2011.” American Community Survey Briefs. Retrieved from https://www.census.gov/prod/2013pubs/acsbr11-17.pdf.
6. Roscigno, Vincent J., Donald Tomaskovic-Devey, and Martha L. Crowley. 2006. “Education and the Inequalities of Place.” Social Forces 84(4), 2121–2145.
7. Macartney et al., 2013; Schaefer, Andrew, Marybeth Mattingly, and Kenneth M. Johnson. 2016. “Child Poverty Higher and More Persistent in Rural America.” National Issue Brief No. 97. University of New Hampshire. Retrieved from http://scholars.unh.edu/cgi/viewcontent.cgi?article=1265&context=carsey.
8. Chetty, Raj, Nathaniel Hendren, Patrick Kline, and Emmanuel Saez. 2014. “Where Is the Land of Opportunity? The Geography of Intergenerational Mobility in the United States.” Quarterly Journal of Economics 129(4), 1553–1623.
head 13
The Stanford Center on Poverty and Inequality
PATHWAYS • The Poverty and Inequality Report • Race and Ethnicity
STATE OF THE UNION 2017
Federal, state, and local governments provide assis-tance to individuals with low incomes and assets
through dozens of different “safety net” programs. The purpose of this article is to examine how safety net usage varies across racial and ethnic groups in the most recent year for which data are available. This variability might of course be structured in many ways, but two possibilities that are usefully distinguished are (a) a “compensation effect” in which racial and ethnic groups that have histori-cally faced especially severe problems in the labor market (e.g., blacks, American Indians) are enrolled in safety net programs at rates in excess of their underlying poverty rates, or (b) a “double disadvantage effect” in which such groups are instead underenrolled (again, relative to their underlying poverty rates). Given the constraints of space, this question cannot be exhaustively examined here, but it will be possible to explore it for three especially impor-tant federal safety net programs.
An Example of Double DisadvantageThe largest federal safety net program in terms of both enrollment and expenditures is Medicaid. It provided health insurance to 72 million low-income U.S. residents in 2015,1 with total expenditures of $545 billion.2 Med-icaid enrollment grew substantially during the last several years, in spite of the improving economy, because of the Affordable Care Act (ACA). This increase would have been much larger if all states, as called for in the leg-islation, had expanded the program to individuals with incomes below 138 percent of the federal poverty line. Instead, 19 states have not expanded their Medicaid programs,3 resulting in very different rates of Medicaid enrollment across states. In California, a state that did expand its Medicaid program, 32 percent of all state resi-dents are now enrolled in Medicaid. In contrast, only 18 percent of residents in Texas are covered, even though its poverty rate is similar to California’s. This is primarily because Texas did not expand Medicaid following ACA passage.
Like most government agencies, the Centers for Medi-care and Medicaid Services, which administers Medicaid, does not report data on the race and ethnicity of program recipients. Arguably, the best available source of racial and ethnic data is the March Current Population Survey (CPS), which is conducted annually by the Bureau of Labor Statistics.4 One limitation with using survey data is that individuals are known to underreport their enrollment for many government programs.5 However, the fraction reporting Medicaid coverage in the 2015 CPS (19.7%) is relatively close to the actual share enrolled (22.4%). The CPS also contains detailed demographic information along with information on the economic circumstances of respondents and their families. Taken together, these data can shed light on how enrollment in Medicaid and other government programs varies by race and ethnicity.
The March 2016 CPS reports each person’s race as white, black, American Indian/Alaska Native (AIAN), Asian, Hawaiian/Pacific Islander, or one of more than 20 other categories for different race combinations.6 The most common categories are white (77.1%), black (13.1%), and Asian (5.7%). If one groups together all individuals listing two or more races, the resulting “mixed” group is the next most common, accounting for 2.4 percent of the
KEY FINDINGS
• Given that poverty rates are significantly higher among blacks, Hispanics, and American Indians than in the general population, it is not surprising that their enrollment in federal safety net programs, such as Medicaid and food stamps, is also higher.
• However, poor blacks and American Indians are significantly less likely than other racial and ethnic groups to enroll in Medicaid, which is the largest federal safety net program. No similar gap exists for enrollment in the food stamp or Supplemental Security Income programs.
BY MARK DUGGAN AND VALERIE SCIMECA
safety net
PATHWAYS • The Poverty and Inequality Report • Race and Ethnicity
14 safety net
population. Additionally, the survey includes information on whether an individual (of any race) is of Hispanic origin, with an estimated 17.8 percent of the population in this group.
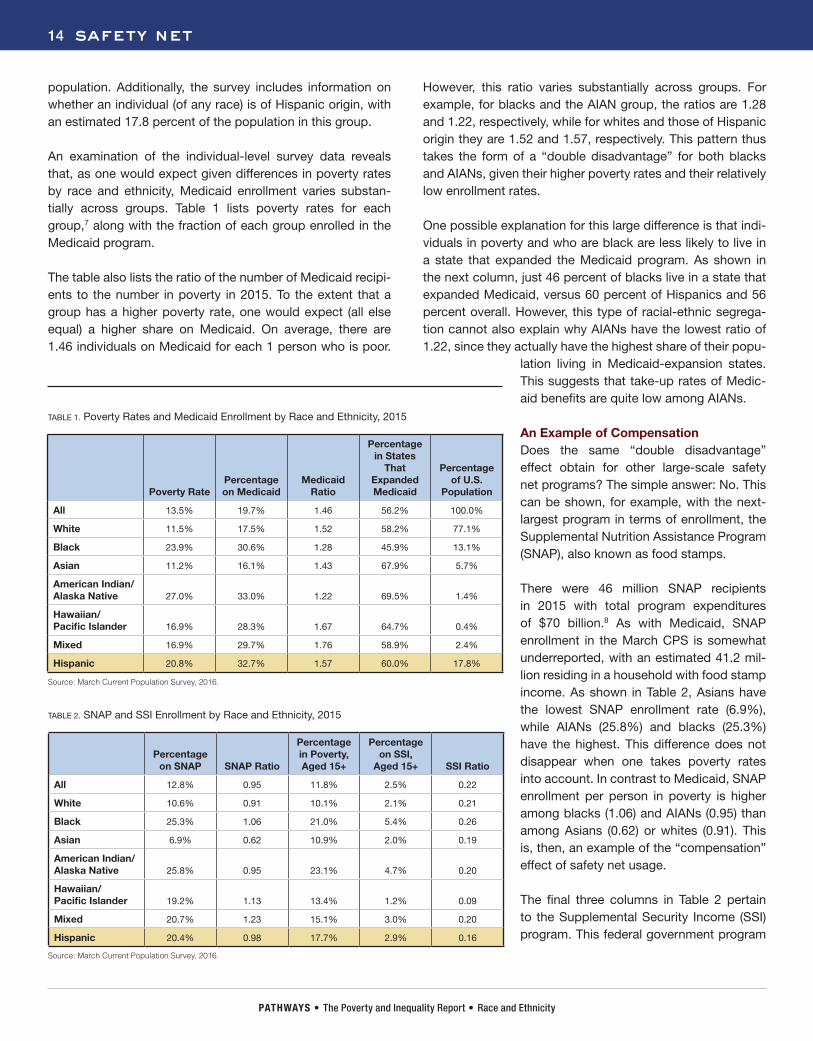
An examination of the individual-level survey data reveals that, as one would expect given differences in poverty rates by race and ethnicity, Medicaid enrollment varies substan-tially across groups. Table 1 lists poverty rates for each group,7 along with the fraction of each group enrolled in the Medicaid program.
The table also lists the ratio of the number of Medicaid recipi-ents to the number in poverty in 2015. To the extent that a group has a higher poverty rate, one would expect (all else equal) a higher share on Medicaid. On average, there are 1.46 individuals on Medicaid for each 1 person who is poor.
However, this ratio varies substantially across groups. For example, for blacks and the AIAN group, the ratios are 1.28 and 1.22, respectively, while for whites and those of Hispanic origin they are 1.52 and 1.57, respectively. This pattern thus takes the form of a “double disadvantage” for both blacks and AIANs, given their higher poverty rates and their relatively low enrollment rates.
One possible explanation for this large difference is that indi-viduals in poverty and who are black are less likely to live in a state that expanded the Medicaid program. As shown in the next column, just 46 percent of blacks live in a state that expanded Medicaid, versus 60 percent of Hispanics and 56 percent overall. However, this type of racial-ethnic segrega-tion cannot also explain why AIANs have the lowest ratio of 1.22, since they actually have the highest share of their popu-
lation living in Medicaid-expansion states. This suggests that take-up rates of Medic-aid benefits are quite low among AIANs.
An Example of CompensationDoes the same “double disadvantage” effect obtain for other large-scale safety net programs? The simple answer: No. This can be shown, for example, with the next-largest program in terms of enrollment, the Supplemental Nutrition Assistance Program (SNAP), also known as food stamps.
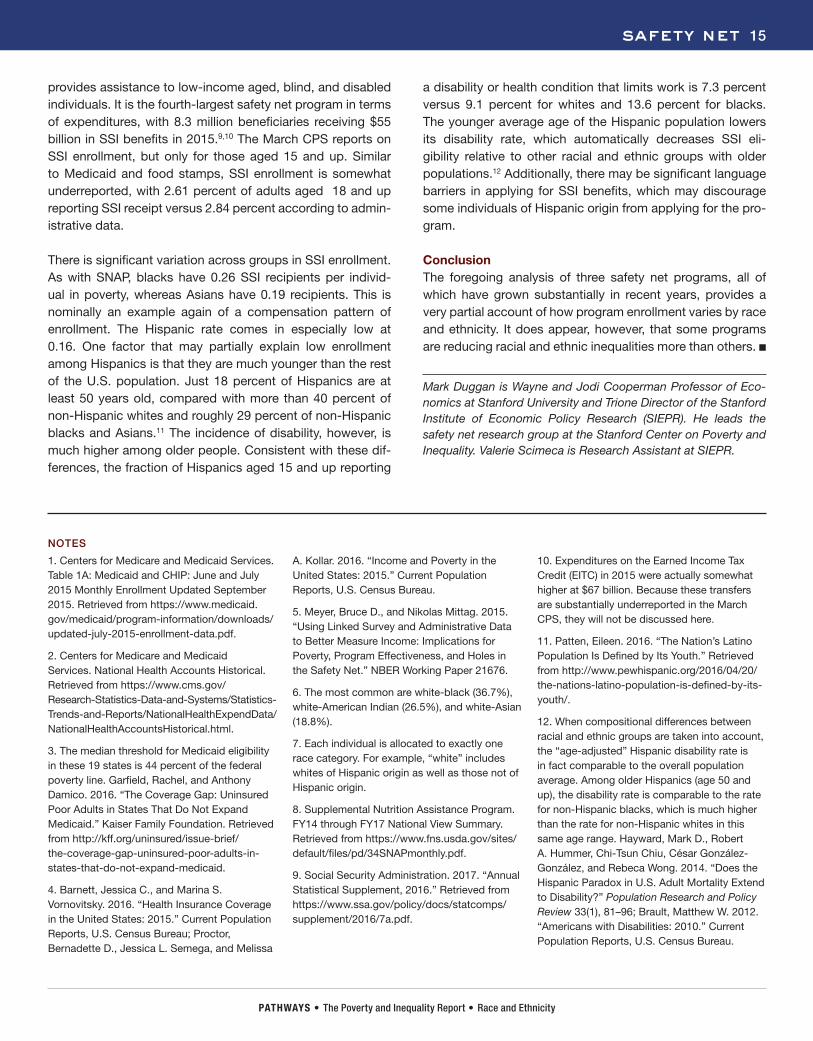
There were 46 million SNAP recipients in 2015 with total program expenditures of $70 billion.8 As with Medicaid, SNAP enrollment in the March CPS is somewhat underreported, with an estimated 41.2 mil-lion residing in a household with food stamp income. As shown in Table 2, Asians have the lowest SNAP enrollment rate (6.9%), while AIANs (25.8%) and blacks (25.3%) have the highest. This difference does not disappear when one takes poverty rates into account. In contrast to Medicaid, SNAP enrollment per person in poverty is higher among blacks (1.06) and AIANs (0.95) than among Asians (0.62) or whites (0.91). This is, then, an example of the “compensation” effect of safety net usage.
The final three columns in Table 2 pertain to the Supplemental Security Income (SSI) program. This federal government program
TABLE 1. Poverty Rates and Medicaid Enrollment by Race and Ethnicity, 2015
TABLE 2. SNAP and SSI Enrollment by Race and Ethnicity, 2015
Poverty RatePercentage on Medicaid
Medicaid Ratio
Percentage in States
That Expanded Medicaid
Percentage of U.S.
Population
All 13.5% 19.7% 1.46 56.2% 100.0%
White 11.5% 17.5% 1.52 58.2% 77.1%
Black 23.9% 30.6% 1.28 45.9% 13.1%
Asian 11.2% 16.1% 1.43 67.9% 5.7%
American Indian/Alaska Native 27.0% 33.0% 1.22 69.5% 1.4%
Hawaiian/ Pacific Islander 16.9% 28.3% 1.67 64.7% 0.4%
Mixed 16.9% 29.7% 1.76 58.9% 2.4%
Hispanic 20.8% 32.7% 1.57 60.0% 17.8%
Percentage on SNAP SNAP Ratio
Percentage in Poverty, Aged 15+
Percentage on SSI,
Aged 15+ SSI Ratio
All 12.8% 0.95 11.8% 2.5% 0.22
White 10.6% 0.91 10.1% 2.1% 0.21
Black 25.3% 1.06 21.0% 5.4% 0.26
Asian 6.9% 0.62 10.9% 2.0% 0.19
American Indian/Alaska Native 25.8% 0.95 23.1% 4.7% 0.20
Hawaiian/ Pacific Islander 19.2% 1.13 13.4% 1.2% 0.09
Mixed 20.7% 1.23 15.1% 3.0% 0.20
Hispanic 20.4% 0.98 17.7% 2.9% 0.16
Source: March Current Population Survey, 2016.
Source: March Current Population Survey, 2016.
PATHWAYS • The Poverty and Inequality Report • Race and Ethnicity
safety net 15
provides assistance to low-income aged, blind, and disabled individuals. It is the fourth-largest safety net program in terms of expenditures, with 8.3 million beneficiaries receiving $55 billion in SSI benefits in 2015.9,10 The March CPS reports on SSI enrollment, but only for those aged 15 and up. Similar to Medicaid and food stamps, SSI enrollment is somewhat underreported, with 2.61 percent of adults aged 18 and up reporting SSI receipt versus 2.84 percent according to admin-istrative data.
There is significant variation across groups in SSI enrollment. As with SNAP, blacks have 0.26 SSI recipients per individ-ual in poverty, whereas Asians have 0.19 recipients. This is nominally an example again of a compensation pattern of enrollment. The Hispanic rate comes in especially low at 0.16. One factor that may partially explain low enrollment among Hispanics is that they are much younger than the rest of the U.S. population. Just 18 percent of Hispanics are at least 50 years old, compared with more than 40 percent of non-Hispanic whites and roughly 29 percent of non-Hispanic blacks and Asians.11 The incidence of disability, however, is much higher among older people. Consistent with these dif-ferences, the fraction of Hispanics aged 15 and up reporting
a disability or health condition that limits work is 7.3 percent versus 9.1 percent for whites and 13.6 percent for blacks. The younger average age of the Hispanic population lowers its disability rate, which automatically decreases SSI eli-gibility relative to other racial and ethnic groups with older populations.12 Additionally, there may be significant language barriers in applying for SSI benefits, which may discourage some individuals of Hispanic origin from applying for the pro-gram.
ConclusionThe foregoing analysis of three safety net programs, all of which have grown substantially in recent years, provides a very partial account of how program enrollment varies by race and ethnicity. It does appear, however, that some programs are reducing racial and ethnic inequalities more than others. ■
Mark Duggan is Wayne and Jodi Cooperman Professor of Eco-nomics at Stanford University and Trione Director of the Stanford Institute of Economic Policy Research (SIEPR). He leads the safety net research group at the Stanford Center on Poverty and Inequality. Valerie Scimeca is Research Assistant at SIEPR.
NOTES
1. Centers for Medicare and Medicaid Services. Table 1A: Medicaid and CHIP: June and July 2015 Monthly Enrollment Updated September 2015. Retrieved from https://www.medicaid.gov/medicaid/program-information/downloads/updated-july-2015-enrollment-data.pdf.
2. Centers for Medicare and Medicaid Services. National Health Accounts Historical. Retrieved from https://www.cms.gov/Research-Statistics-Data-and-Systems/Statistics-Trends-and-Reports/NationalHealthExpendData/NationalHealthAccountsHistorical.html.
3. The median threshold for Medicaid eligibility in these 19 states is 44 percent of the federal poverty line. Garfield, Rachel, and Anthony Damico. 2016. “The Coverage Gap: Uninsured Poor Adults in States That Do Not Expand Medicaid.” Kaiser Family Foundation. Retrieved from http://kff.org/uninsured/issue-brief/the-coverage-gap-uninsured-poor-adults-in-states-that-do-not-expand-medicaid.
4. Barnett, Jessica C., and Marina S. Vornovitsky. 2016. “Health Insurance Coverage in the United States: 2015.” Current Population Reports, U.S. Census Bureau; Proctor, Bernadette D., Jessica L. Semega, and Melissa
A. Kollar. 2016. “Income and Poverty in the United States: 2015.” Current Population Reports, U.S. Census Bureau.
5. Meyer, Bruce D., and Nikolas Mittag. 2015. “Using Linked Survey and Administrative Data to Better Measure Income: Implications for Poverty, Program Effectiveness, and Holes in the Safety Net.” NBER Working Paper 21676.
6. The most common are white-black (36.7%), white-American Indian (26.5%), and white-Asian (18.8%).
7. Each individual is allocated to exactly one race category. For example, “white” includes whites of Hispanic origin as well as those not of Hispanic origin.
8. Supplemental Nutrition Assistance Program. FY14 through FY17 National View Summary. Retrieved from https://www.fns.usda.gov/sites/default/files/pd/34SNAPmonthly.pdf.
9. Social Security Administration. 2017. “Annual Statistical Supplement, 2016.” Retrieved from https://www.ssa.gov/policy/docs/statcomps/supplement/2016/7a.pdf.
10. Expenditures on the Earned Income Tax Credit (EITC) in 2015 were actually somewhat higher at $67 billion. Because these transfers are substantially underreported in the March CPS, they will not be discussed here.
11. Patten, Eileen. 2016. “The Nation’s Latino Population Is Defined by Its Youth.” Retrieved from http://www.pewhispanic.org/2016/04/20/the-nations-latino-population-is-defined-by-its-youth/.
12. When compositional differences between racial and ethnic groups are taken into account, the “age-adjusted” Hispanic disability rate is in fact comparable to the overall population average. Among older Hispanics (age 50 and up), the disability rate is comparable to the rate for non-Hispanic blacks, which is much higher than the rate for non-Hispanic whites in this same age range. Hayward, Mark D., Robert A. Hummer, Chi-Tsun Chiu, César González-González, and Rebeca Wong. 2014. “Does the Hispanic Paradox in U.S. Adult Mortality Extend to Disability?” Population Research and Policy Review 33(1), 81–96; Brault, Matthew W. 2012. “Americans with Disabilities: 2010.” Current Population Reports, U.S. Census Bureau.
PATHWAYS • The Poverty and Inequality Report • Race and Ethnicity
titleThe Stanford Center on Poverty and Inequality
STATE OF THE UNION 2017
Homeownership is firmly pressed into America’s national identity. The Founding Fathers knotted full citizenship to
land ownership and saw the yeoman farmer, sweating over his own soil, as the beating heart of America. Tenancy was seen as a social ill: Congress heard arguments that it “annihi-lates the love of country.” “Democracy,” Walt Whitman wrote, “asks for men and women with occupations, well-off, owners of houses and acres, and with cash in the bank ... and has-tens to make them.”1
American democracy did not, however, “hasten to make” everyone an owner. The country’s history of housing its people is inextricably bound up with its legacy of racism. Slavery and sharecropping; the creation of northern urban ghettos, ethnic tenements, and shack-settlements for migrant workers; the forcible resettlement of Native Americans to reservations; the systematic exclusion of nonwhite families from government-insured home mortgages—on and on, the history of racial injustice in the United States is in large part a history of the systematic dispossession of people of color from the land.2
Throughout the 19th and 20th centuries, if fathers couldn’t leave an actual house to their children, they continued to pass along the dream of a house; indeed, it became “a model, a lesson,” says literary historian Jan Cohn.3 There was a “sym-bolic inheritance” involved, as an intergenerational link to ownership was a ticket not only to some prosperity but also to full belonging.
This is said to be the American story, but as with all American stories, some are left out of its pages. In the 1930s and 1940s, New Deal policies that lifted millions of Americans into the middle class—particularly through a massive expansion of government-insured home mortgages—were denied to fami-lies of color. Black veterans, in particular, were excluded from GI mortgages, which accounted for 40 percent of all home loans in the years following World War II, and the Federal Housing Authority’s official policy of redlining, enforced from
1934 to 1968, inhibited homeownership in African-American communities.4 White families got a New Deal; black families got the old one.
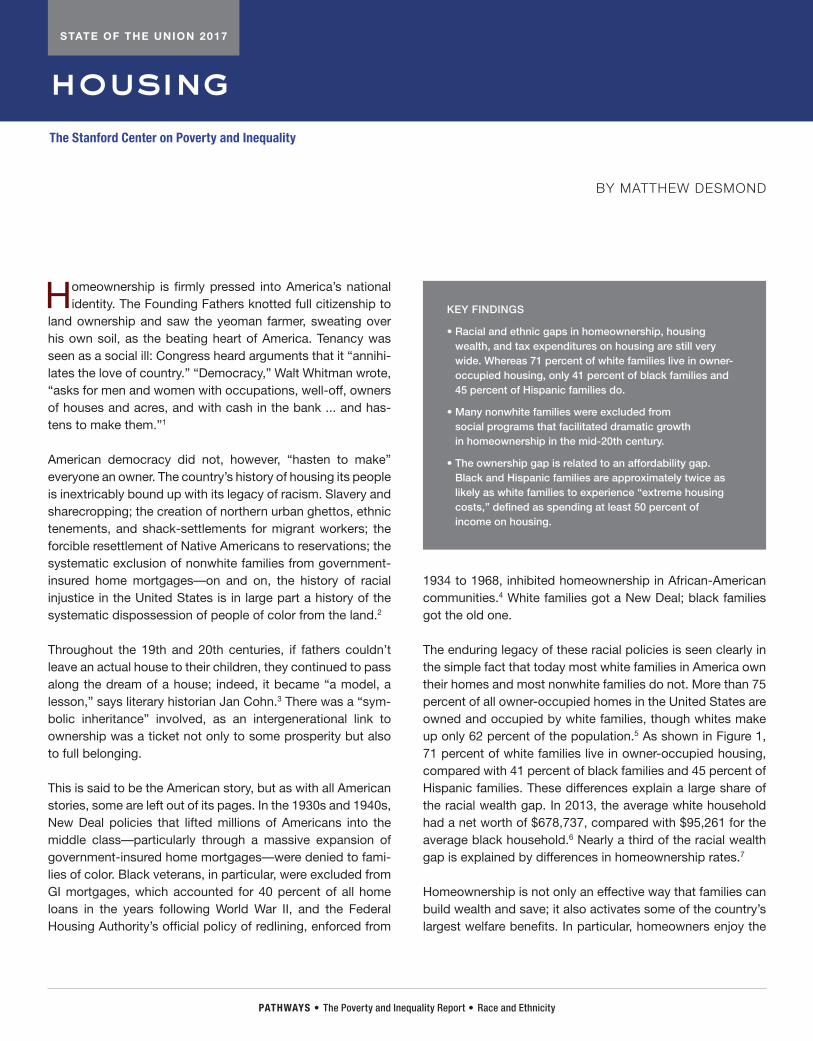
The enduring legacy of these racial policies is seen clearly in the simple fact that today most white families in America own their homes and most nonwhite families do not. More than 75 percent of all owner-occupied homes in the United States are owned and occupied by white families, though whites make up only 62 percent of the population.5 As shown in Figure 1, 71 percent of white families live in owner-occupied housing, compared with 41 percent of black families and 45 percent of Hispanic families. These differences explain a large share of the racial wealth gap. In 2013, the average white household had a net worth of $678,737, compared with $95,261 for the average black household.6 Nearly a third of the racial wealth gap is explained by differences in homeownership rates.7
Homeownership is not only an effective way that families can build wealth and save; it also activates some of the country’s largest welfare benefits. In particular, homeowners enjoy the
KEY FINDINGS
• Racial and ethnic gaps in homeownership, housing wealth, and tax expenditures on housing are still very wide. Whereas 71 percent of white families live in owner-occupied housing, only 41 percent of black families and 45 percent of Hispanic families do.
• Many nonwhite families were excluded from social programs that facilitated dramatic growth in homeownership in the mid-20th century.
• The ownership gap is related to an affordability gap. Black and Hispanic families are approximately twice as likely as white families to experience “extreme housing costs,” defined as spending at least 50 percent of income on housing.
housing
BY MATTHEW DESMOND
STATE OF THE UNION 2017
head 17
PATHWAYS • The Poverty and Inequality Report • Race and Ethnicity
housing 17
FIGURE 1. Homeownership Rates by Race/Ethnicity
Source: American Community Survey, 2014.
80%
70%
60%
50%
40%
30%
20%
10%
0%White Black Hispanic
Hom
eow
ners
hip
Rat
e
mortgage interest deduction, an entitlement that allows them to deduct from their taxes interest paid on home mortgages valued at $1 million or less. In 2016, the federal government dedicated $71 billion to the mortgage interest deduction and an additional $63 billion to other homeowner subsidies, such as real estate and property tax exclusions, making such expenditures some of the most lavish in the tax code.8 But the majority of nonwhite families are excluded from home-owner subsidies. Even after controlling for age and household income, black families are 57 percent less likely than white families to own mortgaged homes. Hispanic families are 51 percent less likely and American Indian families are 41 per-cent less likely.9
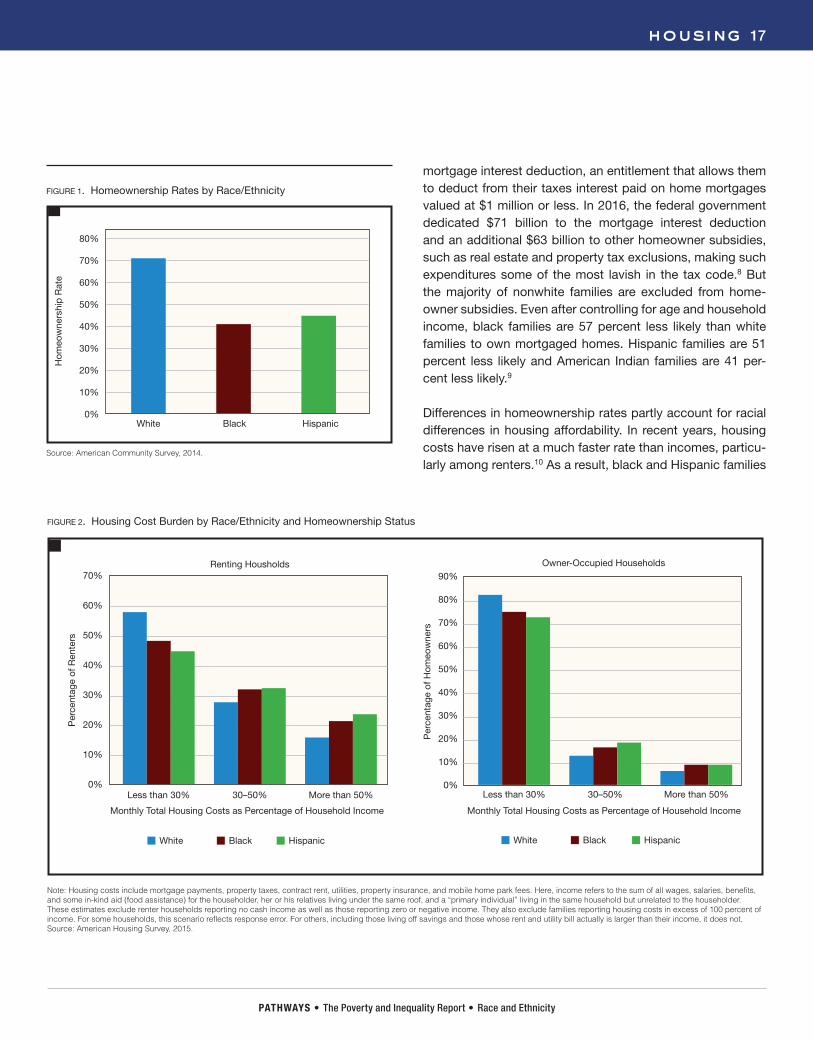
Differences in homeownership rates partly account for racial differences in housing affordability. In recent years, housing costs have risen at a much faster rate than incomes, particu-larly among renters.10 As a result, black and Hispanic families
FIGURE 2. Housing Cost Burden by Race/Ethnicity and Homeownership Status
Monthly Total Housing Costs as Percentage of Household Income
Per
cent
age
of H
omeo
wne
rs
Less than 30% 30–50% More than 50%
90%
80%
70%
60%
50%
40%
30%
20%
10%
0%
White Black Hispanic
Owner-Occupied Households
Per
cent
age
of R
ente
rs
70%
60%
50%
40%
30%
20%
10%
0%Less than 30% 30–50% More than 50%
White Black Hispanic
Renting Housholds
Monthly Total Housing Costs as Percentage of Household Income
Note: Housing costs include mortgage payments, property taxes, contract rent, utilities, property insurance, and mobile home park fees. Here, income refers to the sum of all wages, salaries, benefits, and some in-kind aid (food assistance) for the householder, her or his relatives living under the same roof, and a “primary individual” living in the same household but unrelated to the householder. These estimates exclude renter households reporting no cash income as well as those reporting zero or negative income. They also exclude families reporting housing costs in excess of 100 percent of income. For some households, this scenario reflects response error. For others, including those living off savings and those whose rent and utility bill actually is larger than their income, it does not. Source: American Housing Survey, 2015.
PATHWAYS • The Poverty and Inequality Report • Race and Ethnicity
are twice as likely as white families to experience “extreme housing costs,” defined as spending at least 50 percent of income on housing. Roughly 1 in 6 black and Hispanic house-holds dedicate at least half of their income to housing costs, compared with 1 in 12 white families. But the majority of homeowners, regardless of race, spend less than 30 per-cent of their income on housing. As displayed in Figure 2, only 9 percent of black and Hispanic homeowners spend over half of their income on housing, compared with more than 20 per-cent of black and Hispanic renters.
The spillover effects of these racial and ethnic differences in affordability are profound. Families living in unaffordable housing make fewer investments in their children, which likely has direct effects on those children’s cognitive development and later well-being.11 Rent-burdened families also have less money to buy basic necessities, such as medical care and clothing. Researchers have connected unaffordable hous-ing to stress-induced illnesses, such as hypertension and anxiety, while others have shown that families who receive housing assistance after years on the waiting list consistently use their freed-up income to purchase more food, helping their children to become better nourished and healthier.12
Because they are disproportionately renters, black and His-panic families are also more vulnerable to eviction and involuntary mobility. Researchers have linked eviction to downward mobility, material hardship, savings and job loss, depression, suicide, and other negative outcomes, showing it to be a cause, not just a condition, of poverty.13 One study from Milwaukee found that between 2009 and 2011, 9 per-cent of white renters, 12 percent of black renters, and (owing in large part to landlord foreclosures) 23 percent of Hispanic renters had experienced a forced move in the previous two years.14 Women of color, and mothers in particular, are at especially high risk of eviction.15
Housing is a fundamental human need, necessary to pro-mote family, economic, and community stability. The lack of stable, affordable housing is a wellspring for multiple kinds of social maladies, from homelessness and material hardship to school instability and health disparities. Unequal access to affordable, stable, and owner-occupied housing remains a prime driver of racial and ethnic inequality in America. ■
Matthew Desmond is John L. Loeb Associate Professor of the Social Sciences at Harvard University. He leads the housing research group at the Stanford Center on Poverty and Inequality.
18 housing
PATHWAYS • The Poverty and Inequality Report • Race and Ethnicity
housing 19
NOTES
1. Vale, Lawrence J. 2000. From the Puritans to the Projects: Public Housing and Public Neighbors. Cambridge, MA: Harvard University Press, 94–96, 93.
2. Katznelson, Ira. 2005. When Affirmative Action Was White. New York: Norton.
3. Vale, 2000, 101.
4. Madrigal, Alexis C. 2014. “The Racist Housing Policy That Made Your Neighborhood.” Atlantic. Retrieved from https://www.theatlantic.com/business/archive/2014/05/the-racist-housing-policy-that-made-your-neighborhood/371439.
5. U.S. Census Bureau. 2011–2015 American Community Survey 5-Year Estimates.
6. Jones, Janelle. 2017. “The Racial Wealth Gap: How African-Americans Have Been Shortchanged Out of the Materials to Build Wealth.” Economic Policy Institute. Retrieved from http://www.epi.org/blog/the-racial-wealth-gap-how-african-americans-have-been-shortchanged-out-of-the-materials-to-build-wealth.
7. Begley, Jaclene. 2017. “Legacies of Homeownership: Housing Wealth and Bequests.” Journal of Housing Economics 35, 37–50; Oliver, Melvin, and Thomas Shapiro. 2006. Black Wealth, White Wealth: A New Perspective on Racial Inequality. Abingdon: Taylor & Francis; Traub, Amy, Catherine Ruetschlin, and Tamara Draut. 2016. “The Racial Wealth Gap: Why Policy Matters.” Demos. Retrieved from http://www.demos.org/publication/racial-wealth-gap-why-policy-matters.
8. Fischer, Will, and Barbara Sard. 2017. “Chart Book: Federal Housing Spending Is Poorly Matched to Need.” Center on Budget and Policy Priorities. Retrieved from http://www.cbpp.org/research/housing/chart-book-federal-housing-spending-is-poorly-matched-to-need.
9. Chacón, Felipe. 2016. “Minorities and Women Are Losing Out on Homeownership and Tax Breaks.” Trulia. Retrieved from https://www.trulia.com/blog/trends/minorities-women-mortgage.
10. Desmond, Matthew. 2016. Evicted: Poverty and Profit in the American City. New York: Crown.
11. Newman, Sandra, and C. Scott Holupka. 2014. “Housing Affordability and Investments in Children.” Journal of Housing Economics 24, 89–100; Newman, Sandra, and C. Scott Holupka. 2016. “Housing Affordability and Children’s Cognitive Achievement.” Health Affairs 35(11), 2092–2099.
12. Meyers, Alan, Dana Rubin, Maria Napoleone, and Kevin Nichols. 1993. “Public Housing Subsidies May Improve Poor Children’s Nutrition.” American Journal of Public Health 83(1), 115; Pollack, Evan, Beth Ann Griffin, and Julia Lynch. 2010. “Housing Affordability and Health Among Homeowners and Renters.” American Journal of Preventive Medicine 39(6), 515–521; Sandel, Megan, and Jean Zotter. 2000. “How Substandard Housing Affects Children’s Health.” Contemporary Pediatrics 17(10), 134.
13. Desmond, Matthew, and Carl Gershenson. 2016. “Housing and Employment Insecurity Among the Working Poor.” Social Problems 63, 46–67; Desmond, Matthew, and Rachel Tolbert Kimbro. 2015. “Eviction’s Fallout: Housing, Hardship, and Health.” Social Forces 94(1), 295–324; Rojas, Yerko, and Sten-Åke Stenberg. 2015. “Evictions and Suicide: A Follow-Up Study of Almost 22,000 Swedish Households in the Wake of the Global Financial Crisis.” Journal of Epidemiology and Community Health 70(4), 409–413; Sullivan, Esther. 2017. “Displaced in Place: Manufactured Housing, Mass Eviction, and the Paradox of State Intervention.” American Sociological Review 118(2), 243–269; Vásquez-Vera, Hugo, Laia Palència, Ingrid Magna, Carlos Mena, Jaime Neira, and Carme Borrell. 2017. “The Threat of Home Eviction and Its Effects on Health Through the Equity Lens: A Systematic Review.” Social Science & Medicine 175, 199–208.
14. Desmond, Matthew, and Tracey Shollenberger. 2015. “Forced Displacement from Rental Housing: Prevalence and Neighborhood Consequences.” Demography 52(5), 1751–1772.
15. Desmond, Matthew. 2012. “Eviction and the Reproduction of Urban Poverty.” American Journal of Sociology 118(1), 88–133; Desmond, Matthew, Weihua An, Richelle Winkler, and Thomas Ferriss. 2013. “Evicting Children.” Social Forces 92(1), 303–327.
PATHWAYS • The Poverty and Inequality Report • Race and Ethnicity
The Stanford Center on Poverty and Inequality
STATE OF THE UNION 2017
BY SEAN F. REARDON AND ERIN M. FAHLE
The United States has made some progress toward closing racial and ethnic gaps in educational outcomes. However,
continued large disparities in academic achievement provide clear evidence that black and Hispanic children grow up with more limited educational opportunities than white children.
The National Assessment of Educational Progress (NAEP) provides the best evidence of historical trends in racial and ethnic academic achievement gaps. The U.S. Department of Education administers NAEP tests in math and reading to nationally representative samples of students. We use data from the main NAEP assessments, which were first adminis-tered in the early 1990s, to measure trends in white-black and white-Hispanic achievement gaps in the United States from 1990 to 2015 (shown in Figure 1). The gaps are measured in standard deviations of student achievement. In interpreting these gaps, it should be noted that one standard deviation is roughly equivalent to a three-grade-level difference in aca-demic skills.
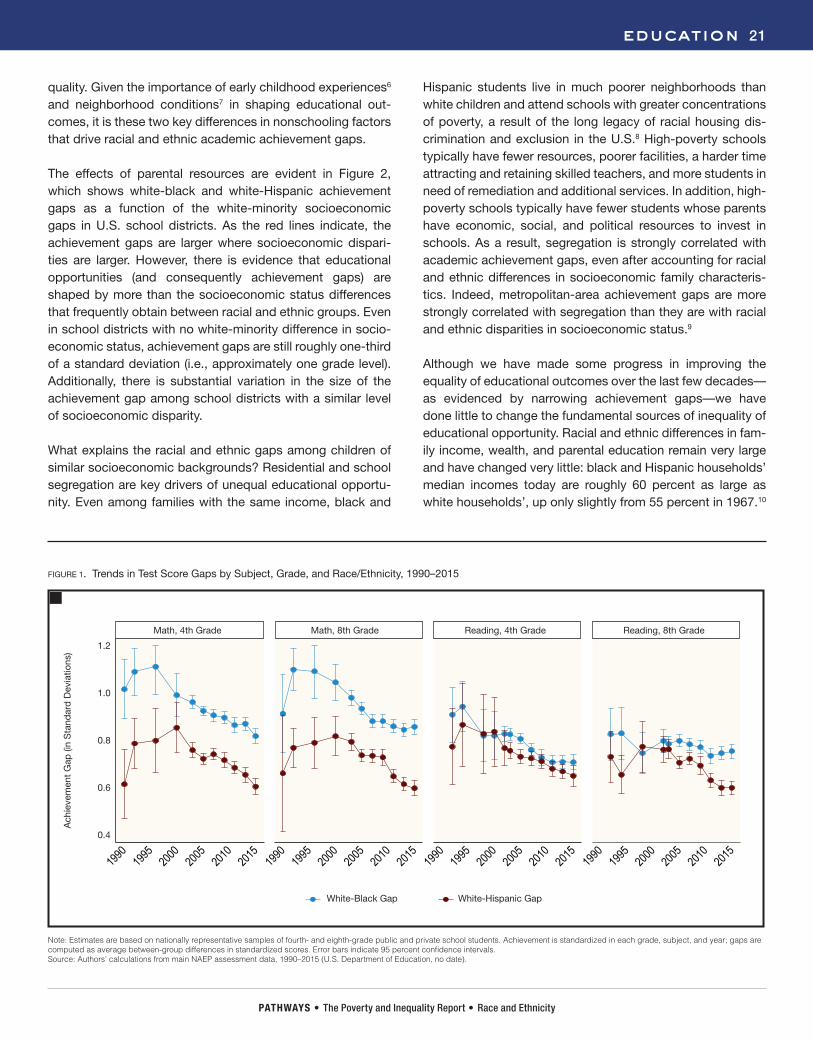
Over this 25-year period, the achievement gaps in math and reading in fourth and eighth grade have declined 15 to 25 per-cent, depending on the grade, subject, or group.1 These gaps have not closed because white performance has declined: To the contrary, average academic performance improved for all racial and ethnic groups, although it grew fastest among black and Hispanic students.2 In particular, the average test scores among black and Hispanic students improved by one-third of a standard deviation in reading and two-thirds of a standard deviation in math since 1990. As shown in Figure 1, these greater improvements among black and Hispanic children led to narrowing achievement gaps, particularly during the last 15 to 20 years. Similar trends are evident in high school gradu-ation rates: white-black and white-Hispanic graduation rate gaps have narrowed sharply over the last two decades.3
The narrowing of white-black and white-Hispanic achieve-ment and graduation rate gaps constitutes notable progress. However, Figure 1 provides little evidence that this narrow-
ing can be attributed to changes in K–12 schooling. Racial and ethnic achievement gaps are roughly the same size in fourth and eighth grade.4 This suggests that the narrowing of achievement gaps in recent years is, instead, the result of equalizing educational opportunity during early childhood or early elementary school.5
Moreover, the achievement gaps are still very large: The white-Hispanic gaps are three-fifths of a standard deviation (almost two grade levels), and the white-black gaps are even larger (0.70 to 0.85 standard deviations, roughly two to two-and-a-half grade levels). Even if these gaps continue to narrow at the same rate as they have for the last two decades, it will be more than 50 years before they are eliminated.
Causes of Racial and Ethnic Disparities in EducationWhy, then, do large racial and ethnic achievement gaps per-sist? Research consistently points to two main contributors: (a) disparities in family socioeconomic background and (b) residential segregation. White, black, and Hispanic children have very different family resources (e.g., parental income and education). They also grow up in neighborhoods of unequal
KEY FINDINGS
• Between 1990 and 2015, average academic performance improved for students of all racial and ethnic groups, but grew fastest among black and Hispanic students. As a result, white-black and white-Hispanic achievement gaps have declined by 15 to 25 percent.
• But achievement gaps remain large: Hispanic students lag almost two grade levels, and black students lag roughly two to two-and-a-half grade levels behind whites.
• Two nonschooling factors—persistent racial and ethnic disparities in family resources and segregation patterns—are fundamental determinants of unequal educational opportunity for minority students.
education
PATHWAYS • The Poverty and Inequality Report • Race and Ethnicity
education 21
quality. Given the importance of early childhood experiences6 and neighborhood conditions7 in shaping educational out-comes, it is these two key differences in nonschooling factors that drive racial and ethnic academic achievement gaps.
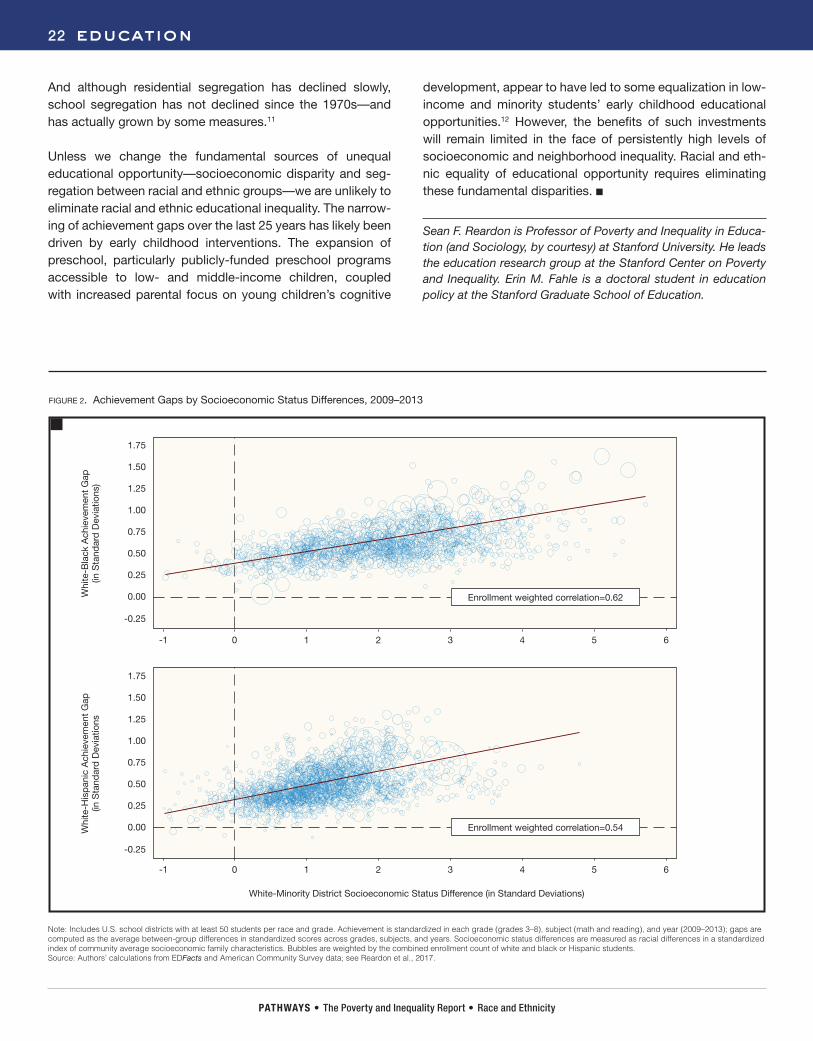
The effects of parental resources are evident in Figure 2, which shows white-black and white-Hispanic achievement gaps as a function of the white-minority socioeconomic gaps in U.S. school districts. As the red lines indicate, the achievement gaps are larger where socioeconomic dispari-ties are larger. However, there is evidence that educational opportunities (and consequently achievement gaps) are shaped by more than the socioeconomic status differences that frequently obtain between racial and ethnic groups. Even in school districts with no white-minority difference in socio-economic status, achievement gaps are still roughly one-third of a standard deviation (i.e., approximately one grade level). Additionally, there is substantial variation in the size of the achievement gap among school districts with a similar level of socioeconomic disparity.
What explains the racial and ethnic gaps among children of similar socioeconomic backgrounds? Residential and school segregation are key drivers of unequal educational opportu-nity. Even among families with the same income, black and
Hispanic students live in much poorer neighborhoods than white children and attend schools with greater concentrations of poverty, a result of the long legacy of racial housing dis-crimination and exclusion in the U.S.8 High-poverty schools typically have fewer resources, poorer facilities, a harder time attracting and retaining skilled teachers, and more students in need of remediation and additional services. In addition, high-poverty schools typically have fewer students whose parents have economic, social, and political resources to invest in schools. As a result, segregation is strongly correlated with academic achievement gaps, even after accounting for racial and ethnic differences in socioeconomic family characteris-tics. Indeed, metropolitan-area achievement gaps are more strongly correlated with segregation than they are with racial and ethnic disparities in socioeconomic status.9
Although we have made some progress in improving the equality of educational outcomes over the last few decades—as evidenced by narrowing achievement gaps—we have done little to change the fundamental sources of inequality of educational opportunity. Racial and ethnic differences in fam-ily income, wealth, and parental education remain very large and have changed very little: black and Hispanic households’ median incomes today are roughly 60 percent as large as white households’, up only slightly from 55 percent in 1967.10
Note: Estimates are based on nationally representative samples of fourth- and eighth-grade public and private school students. Achievement is standardized in each grade, subject, and year; gaps are computed as average between-group differences in standardized scores. Error bars indicate 95 percent confidence intervals. Source: Authors’ calculations from main NAEP assessment data, 1990–2015 (U.S. Department of Education, no date).
FIGURE 1. Trends in Test Score Gaps by Subject, Grade, and Race/Ethnicity, 1990–2015
1990
1995 20
0020
0520
1020
1519
9019
95 2000
2005
2010
2015
1990
1995 20
0020
0520
1020
1519
9019
95 2000
2005
2010
2015
Math, 4th Grade Math, 8th Grade Reading, 4th Grade Reading, 8th Grade
1.2
1.0
0.8
0.6
0.4
White-Black Gap White-Hispanic Gap
Ach
ieve
men
t G
ap (i
n S
tand
ard
Dev
iatio
ns)
PATHWAYS • The Poverty and Inequality Report • Race and Ethnicity
FIGURE 2. Achievement Gaps by Socioeconomic Status Differences, 2009–2013
22 education
And although residential segregation has declined slowly, school segregation has not declined since the 1970s—and has actually grown by some measures.11
Unless we change the fundamental sources of unequal educational opportunity—socioeconomic disparity and seg-regation between racial and ethnic groups—we are unlikely to eliminate racial and ethnic educational inequality. The narrow-ing of achievement gaps over the last 25 years has likely been driven by early childhood interventions. The expansion of preschool, particularly publicly-funded preschool programs accessible to low- and middle-income children, coupled with increased parental focus on young children’s cognitive
development, appear to have led to some equalization in low-income and minority students’ early childhood educational opportunities.12 However, the benefits of such investments will remain limited in the face of persistently high levels of socioeconomic and neighborhood inequality. Racial and eth-nic equality of educational opportunity requires eliminating these fundamental disparities. ■
Sean F. Reardon is Professor of Poverty and Inequality in Educa-tion (and Sociology, by courtesy) at Stanford University. He leads the education research group at the Stanford Center on Poverty and Inequality. Erin M. Fahle is a doctoral student in education policy at the Stanford Graduate School of Education.
Note: Includes U.S. school districts with at least 50 students per race and grade. Achievement is standardized in each grade (grades 3–8), subject (math and reading), and year (2009–2013); gaps are computed as the average between-group differences in standardized scores across grades, subjects, and years. Socioeconomic status differences are measured as racial differences in a standardized index of community average socioeconomic family characteristics. Bubbles are weighted by the combined enrollment count of white and black or Hispanic students.Source: Authors’ calculations from EDFacts and American Community Survey data; see Reardon et al., 2017.
Enrollment weighted correlation=0.62
1.75
1.50
1.25
1.00
0.50
0.75
0.25
-0.25
0.00
0-1 1 2 3 4 5 6
Enrollment weighted correlation=0.54
1.75
1.50
1.25
1.00
0.50
0.75
0.25
-0.25
0.00
0-1 1 2 3 4 5 6
Whi
te-B
lack
Ach
ieve
men
t G
ap
(in S
tand
ard
Dev
iatio
ns)
Whi
te-H
isp
anic
Ach
ieve
men
t G
ap
(in S
tand
ard
Dev
iatio
ns
White-Minority District Socioeconomic Status Difference (in Standard Deviations)
PATHWAYS • The Poverty and Inequality Report • Race and Ethnicity
education 23
NOTES
1. The white-black and white-Hispanic gaps were much larger in the early 1970s but narrowed during the 1970s and early 1980s before widening modestly in the late 1980s and 1990s. See Musu-Gilette, Lauren, Jennifer Robinson, Joel McFarland, Angelina KewalRamani, Anlan Zhang, and Sidney Wilkinson-Flicker. 2016. “Status and Trends in the Education of Racial and Ethnic Groups 2016.” National Center for Education Statistics. Retrieved from https://nces.ed.gov/pubs2016/2016007.pdf; Reardon, Sean F., Joseph P. Robinson-Cimpian, and Ericka S. Weathers. 2015. “Patterns and Trends in Racial/Ethnic and Socioeconomic Academic Achievement Gaps.” In Handbook of Research in Education Finance and Policy, 2nd ed., eds. Helen F. Ladd and Margaret E. Goertz. New York: Routledge, 491–509.
2. U.S. Department of Education, Institute of Education Sciences, National Center for Education Statistics. NAEP Data Explorer. Retrieved from https://nces.ed.gov/nationsreportcard/naepdata/.
3. McFarland, Joel, Patrick Stark, and Jiashan Cui. 2016. “Trends in High School Dropout and Completion Rates in the United States: 2013.” National Center for Education Statistics, figures 2.2 and 4.2. Retrieved from https://nces.ed.gov/pubs2016/2016117rev.pdf; Murnane, Richard J. 2013. “U.S. High School Graduation Rates: Patterns and Explanations.” Journal of Economic Literature 51(2), 370–422.
4. Reardon et al., 2015, show that racial and ethnic achievement gaps change little after third grade.
5. Magnuson, Katherine, and Greg J. Duncan. 2016. “Can Early Childhood Interventions Decrease Inequality of Economic Opportunity?” Russell Sage Foundation Journal of the Social Sciences 2(2), 123–141; Reardon, Sean F., and Ximena A. Portilla. 2016. “Recent Trends in Income, Racial, and Ethnic School Readiness Gaps at Kindergarten Entry.” AERA Open 2(3), 1–18.
6. Duncan, Greg J., and Jeanne Brooks-Gunn, eds. 1997. Consequences of Growing Up Poor. New York: Russell Sage Foundation; Magnuson and Duncan, 2016.
7. Chetty, Raj, and Nathaniel Hendren. 2015. “The Impacts of Neighborhoods on Intergenerational Mobility: Childhood Exposure Effects and County-Level Estimates.” Retrieved from http://scholar.harvard.edu/files/hendren/files/nbhds_paper.pdf; Chetty, Raj, Nathaniel Hendren, and Lawrence F. Katz. 2016. “The Effects of Exposure to Better Neighborhoods on Children: New Evidence from the Moving to Opportunity Experiment.” American Economic Review 106(4), 855–902.
8. Pattillo, Mary. 2013. Black Picket Fences: Privilege and Peril Among the Black Middle Class. Chicago: University of Chicago Press. Reardon, Sean F., Lindsay Fox, and Joseph Townsend. 2015. “Neighborhood Income Composition by Race and Income, 1990–2009.” Annals of the American Academy of Political and Social Science 660(1), 78–97; Rothstein, Richard. 2017. The Color of Law: A Forgotten History of How Our Government Segregated America. New York: Liveright Publishing Corporation; Sharkey, Patrick. 2014. “Spatial Segmentation and the Black Middle Class.” American Journal of Sociology 119(4), 903–954.
9. Reardon, Sean F. 2016. “School Segregation and Racial Achievement Gaps.” Russell Sage Foundation Journal of the Social Sciences 2(5), 34–57; Reardon, Sean F., Demetra Kalogrides, and Ken Shores. 2017. “The Geography of Racial/Ethnic Test Score Gaps.” Center for Education Policy Analysis Working Paper No. 16-10.
10. Bloome, Deirdre. 2014. “Racial Inequality Trends and the Intergenerational Persistence of Income and Family Structure.” American Sociological Review 79(6), 1196–1225; Monnat, Shannon M., Lawrence E. Raffalovich, and Hui-shien Tsao. 2012. “Trends in the Family Income Distribution by Race/Ethnicity and Income Source, 1988–2009.” Population Review 51(1), 85–115; Pew Research Center. 2016. “On Views of Race and Inequality, Blacks and Whites Are Worlds Apart.” Retrieved from http://assets.pewresearch.org/wp-content/uploads/sites/3/2016/06/ST_2016.06.27_Race-Inequality-Final.pdf.
11. Reardon, Sean F., and Ann Owens. 2014. “60 Years After Brown: Trends and Consequences of School Segregation.” Annual Review of Sociology 40(1), 199–218.
12. Bassok, Daphna, RaeHyuck Lee, Sean F. Reardon, and Jane Waldfogel. 2016. “Socioeconomic Gaps in Early Childhood Experiences, 1998 to 2010.” AERA Open, 2(3), 1–22.

PATHWAYS • The Poverty and Inequality Report • Race and Ethnicity
The Stanford Center on Poverty and Inequality
STATE OF THE UNION 2017
BY BECKY PETTIT AND BRYAN SYKES
The sheer scale of criminal justice contact among racial and ethnic minority men makes it a central concern for
accounts of inequality in the United States. Despite grow-ing policy attention to criminal justice reform, incarceration persists at a historic high and remains disproportionately concentrated among racial and ethnic minorities.
Crime is lower than it has been in decades. Both victimization surveys and police report data show sustained declines in violent and property crime since the mid-1990s. In 2015, the violent victimization rate was down 75 percent from its peak in 1993.1 Violent crimes reported to the police fell from 713.6 per 100,000 in 1993 to 372.6 per 100,000 in 2015, a decline of close to 50 percent.2 Similar declines are found in other measures of victimization and reported crime, including non-violent property offenses.
A number of factors have prompted discussion of criminal justice reform at federal, state, and local levels.3 Cities have enhanced community-based policing efforts, states have ceased new prison and jail construction projects, and law-makers have engaged in a wide range of sentencing reforms. The Civil Rights Division of the Department of Justice has also played an important role by drawing attention to criminal justice practices that violate existing law.4
Has this new wave of reform discussion precipitated a sea change in incarceration practices? No. Despite observed declines in crime and much talk of criminal justice reform, the United States continues to incarcerate a large segment of the population. To be sure, the number of people under criminal justice supervision has fallen somewhat in the last decade, yet close to 2.2 million people are still incarcerated in federal, state, and local prisons and jails, and 4.7 million people are still under the surveillance of probation or parole agencies.5
The United States incarcerates a much larger fraction of its population than any other advanced industrialized country.6
Figure 1 shows incarceration rates in the United States com-pared with rates in Western Europe.7 In 1983, in the early years of criminal justice expansion, the U.S. incarceration rate was already more than twice the rates in Austria and Ger-many, which had the highest incarceration rates among the nine European countries shown. Yet by 2001, the U.S. incar-ceration rate was six to eight times the Austrian and German rates. Data from 2015 show that even after recent declines in the number of inmates, the United States continues to incarcerate a much larger fraction of its population than other countries. People living in the United States are more than 10 times as likely to be in prison or jail as people living in Den-mark, Sweden, and the Netherlands and four times as likely compared with residents of the United Kingdom.
These simple counts of the number of people incarcerated or the percentage of the population in prison or jail do not show the extent to which contact with the criminal justice system is stratified by race and ethnicity. In the United States, incarceration is disproportionately concentrated among Afri-can-American and Latino men, particularly those with low levels of formal schooling. Table 1 shows racial and eth-
KEY FINDINGS
• Despite observed declines in crime and much talk of criminal justice reform, the United States continues to incarcerate a much larger fraction of its population than any other advanced industrialized country.
• The burden of this intensive incarceration continues to fall disproportionately on black men: At the end of 2015, a full 9.1 percent of young black men (ages 20–34) were incarcerated, a rate that is 5.7 times that of young white men (1.6%).
• Fully 10 percent of black children had an incarcerated parent in 2015, compared with 3.6 percent of Hispanic children and 1.7 percent of white children.
incarceration

PATHWAYS • The Poverty and Inequality Report • Race and Ethnicity
incarceration 25
nic differences in exposure to incarceration.8 The top panel shows the percentage of young men incarcerated in federal, state, and local prisons and jails. In 1985, only 0.8 percent of young white men aged 20–34 were incarcerated. In contrast, the incarceration rate among young black men was 5.9 per-cent, over seven times the incarceration rate of whites. Racial inequality in incarceration rates peaked in the mid-2000s, with young blacks close to eight times as likely as young whites to be incarcerated. Even with recent declines in incarceration, 1 in 11 young black men (9.1%) was incarcerated at the end of 2015, an incarceration rate 5.7 times that of young white men (1.6%). Incarceration among young Hispanic men has risen, such that 3.9 percent were incarcerated at the end of 2015. Incarceration is also disproportionately concentrated among those with low levels of formal schooling. In 2010, when U.S. incarceration was near its peak, fully one-third of young black men who dropped out of high school were incarcerated.9 By the end of 2015, the black-white gap in incarceration for high school dropouts was substantially larger than the gap among those with some college education or more.10
Inequality in exposure to incarceration shows up intergenera-tionally as well. The bottom panel of Table 1 displays race and ethnic inequalities in children’s exposure to having a parent incarcerated. Parental incarceration is much more common
FIGURE 1. Incarceration Rates in the United States and Western Europe
Source: U.S. rates are from Western, 2006; Beck et al., 2002; Kaeble and Glaze, 2016. European rates are from the Council of Europe, 1983 and 2002; Aebi et al., 2016.
1000 200 300 400 500 600 700
United States
United Kingdom
Sweden
Netherlands
Italy
Germany
France
Denmark
Belgium
Austria
Incarceration Rate (per 100,000)
2015
2001
1983
for black and Hispanic children than for white children. In 2015, parental incarceration rates for Hispanic children were approximately twice as high as for white children, while black children were over five times more likely than white children to have a parent incarcerated. The consequences of parental incarceration are severe for children. Having a father incarcer-ated increases the risk of homelessness among black youth, elevates the odds of infant mortality, increases internalizing and externalizing behaviors in children, and places minors at risk of educational failure and future criminal justice contact.11
It is important to bear in mind that racial and ethnic dispari-ties in incarceration are not a reflection of trends in crime or victimization. The concentration of incarceration in racial and ethnic minority groups is due to shifts in policing, prosecu-tion, and sentencing that disproportionately affect historically disadvantaged groups.12
It is easy to normalize this state of affairs. Stripped of this normalization, we are left with the simple fact that the United States is warehousing a large segment of the African-Amer-ican population, a policy that can reasonably be interpreted as an institutionalized form of social control.13 Others con-tend that the criminal justice system has such significance in the lives of young black men that it has become one of the

PATHWAYS • The Poverty and Inequality Report • Race and Ethnicity
26 incarceration
key institutions generating racial and economic inequality.14 Spending time in prison or jail has negative consequences for employment, earnings, and other indicators of economic self-sufficiency.15 Moreover, the weight of empirical evidence suggests that parental incarceration negatively impacts mea-sures of child well-being and undergirds the intergenerational transmission of inequality.16 Despite decades of declines in crime and much talk about criminal justice reform, incarcera-tion remains a critical axis of racial and ethnic inequality in the United States. ■
Becky Pettit is Professor of Sociology at the University of Texas at Austin. Bryan Sykes is Assistant Professor of Criminology, Law and Society (and Sociology and Public Health, by courtesy) at the University of California, Irvine. 17
NOTES
1. Truman, Jennifer, and Rachel Morgan. 2016. “Criminal Victimization.” Washington, D.C.: Bureau of Justice Statistics. NCJ 250180.
2. FBI. 2015. “Crime in the United States.” Retrieved from https://ucr.fbi.gov/crime-in-the-u.s/2015/crime-in-the-u.s.-2015/tables/table-1.
3. For a discussion of some recent policy initiatives, see Obama, Barack. 2017. “The President’s Role in Advancing Criminal Justice Reform.” Harvard Law Review 130(3), 811–865.
4. See, for example, U.S. Department of Justice, Civil Rights Division. 2015. “Investigation of the Ferguson Police Department.” Retrieved from https://www.justice.gov/sites/default/files/opa/press-releases/attachments/2015/03/04/ferguson_police_department_report.pdf.
5. Kaeble, Danielle, and Lauren Glaze. 2016. “Correctional Populations in the United States, 2015.” Washington, D.C.: Bureau of Justice Statistics. NCJ 250374.
6. Coyle, Andrew, Helen Fair, Jessica Jacobson, and Roy Walmsley. 2016. Imprisonment Worldwide: The Current Situation and an Alternative Future. Bristol, U.K.: Policy Press.
7. Western, Bruce. 2006. Punishment and Inequality in America. New York: Russell Sage Foundation; Beck, Allen, Jennifer Karberg,
and Paige Harrison. 2002. “Prison and Jail Inmates at Midyear 2001.” Washington, D.C.: Bureau of Justice Statistics. NCJ 191702; Kaeble and Glaze, 2016; Council of Europe. 1983. “Prison Information Bulletin.”; Council of Europe. 2002. “Prison Information Bulletin.”; Aebi, Marcelo F., Melanie M. Tiago, and Christine Burkhardt. 2016. SPACE I—Council of Europe Annual Penal Statistics: Prison Populations. Survey 2015. Strasbourg: Council of Europe.
8. Pettit, Becky, Bryan Sykes, and Bruce Western. 2009. Technical Report on Revised Population Estimates and NLSY 79 Analysis Tables for the Pew Public Safety and Mobility Project. Cambridge, MA: Harvard University; Sykes, Bryan, and Becky Pettit. 2014. “Mass Incarceration, Family Complexity, and the Reproduction of Childhood Disadvantage.” Annals of the American Academy of Political and Social Science 654, 127–149.
9. Travis, Jeremy, Bruce Western, and Steve Redburn, eds. 2014. The Growth of Incarceration in the United States: Exploring Causes and Consequences. Washington, D.C.: National Academies Press.
10. The 2015 estimates are based on the authors’ calculations using data from the Survey of Inmates, the Current Population Survey, and the Bureau of Justice Statistics. For further details, please contact the authors.
11. Wakefield, Sara, and Christopher Wildeman. 2013. Children of the Prison Boom: Mass Incarceration and the Future of American Inequality. New York: Oxford University Press; Turney, Kristin, and Anna Haskins. 2014. “Falling Behind? Children’s Early Grade Retention After Paternal Incarceration.” Sociology of Education 87, 241–258; Hagan, John, and Holly Foster. 2012. “Intergenerational School Effects of Mass Imprisonment in America.” Sociology of Education 85, 259–286.
12. Travis et al., 2014; Moore, Nina. 2015. The Political Roots of Racial Tracking in American Criminal Justice. New York: Cambridge University Press.
13. Wacquant, Loic. 2001. “Deadly Symbiosis: When Ghetto and Prison Meet and Mesh.” Punishment and Society 3(1), 95–134; Alexander, Michelle. 2010. The New Jim Crow: Mass Incarceration in the Age of Colorblindness. New York: The New Press.
14. Western, 2006; Pettit, Becky. 2012. Invisible Men: Mass Incarceration and the Myth of Black Progress. New York: Russell Sage Foundation; Wakefield and Wildeman, 2013.
15. Travis et al., 2014.
16. Wakefield and Wildeman, 2013.
17. Direct correspondence to Becky Pettit ([email protected]) and Bryan Sykes ([email protected]).
TABLE 1. Exposure to Incarceration by Race and Ethnicity
Incarceration Rate for Adult Men, Aged 20–34
1985 2000 2015
Non-Hispanic White 0.8 1.5 1.6
Non-Hispanic Black 5.9 11.5 9.1
Hispanic 2.3 3.7 3.9
Percentage with a Parent Incarcerated Among Children, Aged 0–17
1985 2000 2015
Non-Hispanic White 0.6 1.4 1.7
Non-Hispanic Black 4.1 10.1 10.0
Hispanic 2.0 3.7 3.6
Note: 2015 estimates are based on the authors’ calculations. Source: Pettit et al., 2009; Sykes and Pettit, 2014.

head 27
PATHWAYS • The Poverty and Inequality Report • Race and Ethnicity
The Stanford Center on Poverty and Inequality
STATE OF THE UNION 2017
BY RUCKER C. JOHNSON
health
“Of all the forms of inequality, injustice in health care is the most shocking and inhumane.”—Martin Luther King Jr., speaking at the Medical Committee for Human Rights in 1966.
Racial and ethnic minorities experience higher-than-average rates of illness, have higher age-specific death rates throughout the life course, and are more likely to suffer from early onset of illnesses and more severe diseases than whites.1,2 In this article, I examine these and other differences in health outcomes for whites and blacks in the United States and show that black-white health disparities are large and appear to widen over the life cycle.3,4 I also discuss several policy changes that served to narrow racial health disparities in the past and consider how future policies might help ameliorate racial inequities in health.
Health Disparities and Their CausesThe starting point for this article is the simple but stark finding that, across a broad range of health outcomes, blacks experience much poorer health than whites. For example, hypertension and diabetes are two to three times more common among blacks than whites, which partly explains the greater burden of cardiovascular dis-ease among blacks. Deaths from heart disease are almost twice as common for black men compared with white men and almost three times higher for black women than for white women. Every seven minutes a black person dies prematurely in the United States; this translates to more than 200 black people dying daily who would not have died if the health of blacks and whites were equalized.5 At age 25, there is a five-year life expectancy gap between blacks and whites.6 More than half of this racial disparity in longevity is due to the higher prevalence among blacks of risk factors related to cardiovascular disease.7
While these health inequities have been well docu-mented, they are not the product of our genes but the
consequences of our policies and history. In particular, racial differences in adult health can be largely accounted for by childhood family and neighborhood factors.8 Fig-ures 1 and 2 show the cumulative likelihood by race of the onset of hypertension, and of stroke, heart attack, or heart disease, respectively. The results show large black-white differences in the onset of these serious health conditions in adulthood. However, after account-ing for childhood family and neighborhood factors (e.g., parental income, birth weight, health insurance access, child neighborhood poverty rate), these large disparities nearly disappear. In other words, adult health differences are small when black and white children are exposed to similar family and neighborhood environments. Con-temporaneous adult socioeconomic factors, such as education and income, account for relatively little of these gaps.9,10
In fact, the early-life origins of adult disease may begin in the womb. When a fetus receives limited nutrition, its metabolic and physiological makeup fundamentally changes. While the consequences may not be evident at birth, or even in early childhood, they can appear much
KEY FINDINGS
• Racial disparities in health remain profoundly large. For example, hypertension and diabetes rates are two to three times higher among blacks than whites, which partly explains blacks’ higher burden of cardiovascular disease (the leading cause of death).
• These disparities emerge because of racial differences in childhood conditions, such as parental income, access to health care, neighborhood poverty rates, and other childhood family and neighborhood factors. It follows that public policies addressing these childhood differences can reduce health disparities.
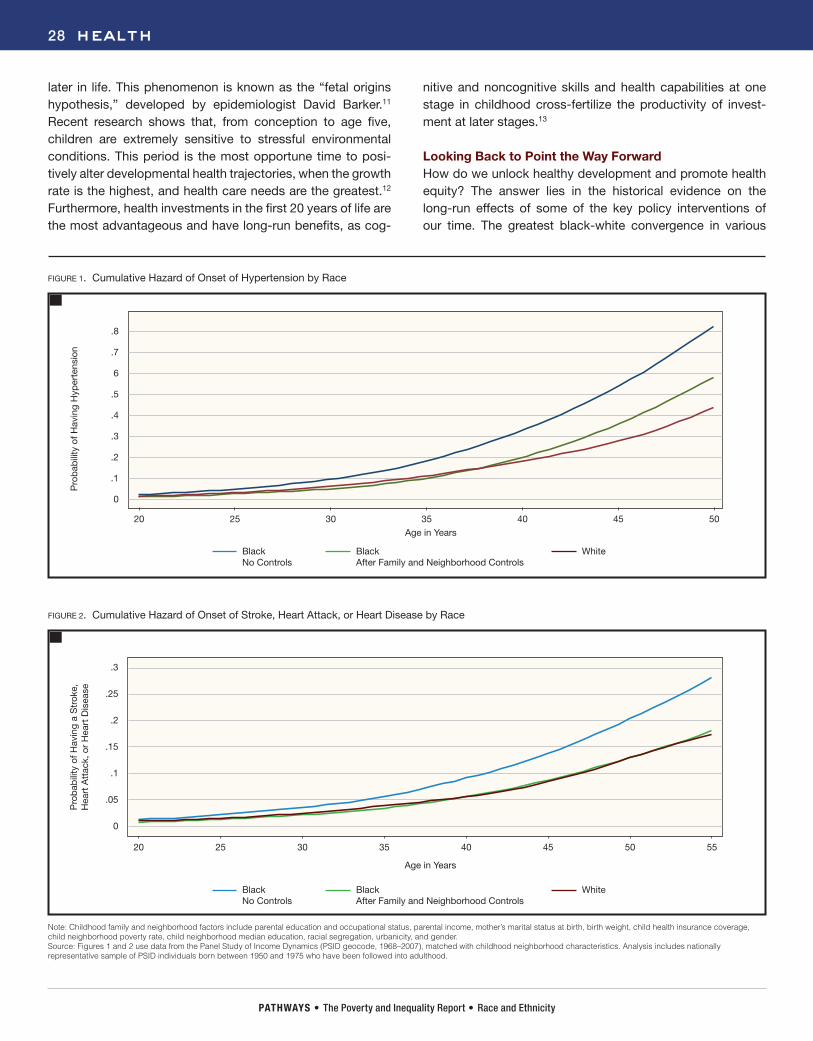
FIGURE 1. Cumulative Hazard of Onset of Hypertension by Race
FIGURE 2. Cumulative Hazard of Onset of Stroke, Heart Attack, or Heart Disease by Race
Note: Childhood family and neighborhood factors include parental education and occupational status, parental income, mother’s marital status at birth, birth weight, child health insurance coverage, child neighborhood poverty rate, child neighborhood median education, racial segregation, urbanicity, and gender. Source: Figures 1 and 2 use data from the Panel Study of Income Dynamics (PSID geocode, 1968–2007), matched with childhood neighborhood characteristics. Analysis includes nationally representative sample of PSID individuals born between 1950 and 1975 who have been followed into adulthood.
PATHWAYS • The Poverty and Inequality Report • Race and Ethnicity
28 health
later in life. This phenomenon is known as the “fetal origins hypothesis,” developed by epidemiologist David Barker.11 Recent research shows that, from conception to age five, children are extremely sensitive to stressful environmental conditions. This period is the most opportune time to posi-tively alter developmental health trajectories, when the growth rate is the highest, and health care needs are the greatest.12 Furthermore, health investments in the first 20 years of life are the most advantageous and have long-run benefits, as cog-
nitive and noncognitive skills and health capabilities at one stage in childhood cross-fertilize the productivity of invest-ment at later stages.13
Looking Back to Point the Way ForwardHow do we unlock healthy development and promote health equity? The answer lies in the historical evidence on the long-run effects of some of the key policy interventions of our time. The greatest black-white convergence in various
Pro
bab
ility
of H
avin
g H
yper
tens
ion
Age in Years2520 30 35 40 45 50
.8
.7
6
.2
.1
.5
.4
.3
0
Black No Controls
Black After Family and Neighborhood Controls
White
Pro
bab
ility
of H
avin
g a
Str
oke,
H
eart
Att
ack,
or
Hea
rt D
isea
se
Age in Years
2520 30 35 40 45 50 55
.3
.25
.2
.15
.1
.05
0
Black No Controls
Black After Family and Neighborhood Controls
White
PATHWAYS • The Poverty and Inequality Report • Race and Ethnicity
health 29
dimensions of health over the life course occurred for cohorts born between 1965 and 1980. This period coincided with the rollout of Medicaid, hospital and school desegregation, and the introduction of Head Start. Each of these policies sub-stantially improved early-life health and led to educational investments that in turn narrowed opportunity gaps for minor-ity and poor children. These policies remain very important today. For example, Medicaid and the Children’s Health Insur-ance Program currently provide low-cost health coverage to nearly 44 million children, covering one-half of all low-income children.14
How can we be sure that these policies had truly causal effects on health? The staggered introduction of Medic-aid across states (1966–1982) and cross-state variation in Medicaid eligibility allow us to isolate the causal effects of childhood health insurance access and the long-run returns to childhood Medicaid spending.15 In recent research, I have compared otherwise-similar children (born since 1950) exposed to a differing number of childhood years in which they were eligible for Medicaid, with the objective of com-paring their subsequent life trajectories through adulthood. For child cohorts born after Medicaid implementation, child-hood health care utilization increased. These increases in children’s insurance access led to reductions in the likelihood of low birth weight, increases in educational attainment and the likelihood of graduating from high school, reductions in poverty and increases in earnings in adulthood, and reduc-tions in adult mortality and the incidence of health problems. The latter changes were even more pronounced among chil-dren from high-Medicaid-eligibility states, particularly poor and minority children. We also see larger improvements in adult outcomes among cohorts for whom the increases in county Medicaid spending and health care access occurred at younger ages.16
Analyses of hospital desegregation reveal similarly compelling evidence of the long-run effects of early-childhood access to health care. This access improved black infant health and reduced racial disparities in infant mortality resulting from ill-nesses like diarrhea and pneumonia.17 In related research, it
has been shown that a declining black-white gap in early-life health and hospital access led to a significant narrowing of the racial test score gap.18
Finally, when considering the role of policy in narrowing health disparities, it is important to consider the interrelation-ship and synergies between early-childhood investments in health and public school spending.19 When these two types of investments occur together, the combined effect can be substantial, and larger than the sum of the two investments in isolation. For example, successive cohorts of black children born from the early 1960s to the early 1970s (a) were exposed to desegregated schools and hospitals and (b) enjoyed access to better-quality schools. These cohorts saw substan-tial improvements in intergenerational mobility.20 Such gains likely would have been much smaller without the interactive policy effects.
ConclusionRacial gaps in health are large and persistent. But they are not immutable. The health improvements that resulted from Med-icaid expansions and hospital desegregation demonstrate that policy can play an important role in narrowing these gaps. Improving infant and child health has the potential to deliver long-term educational, health, and economic benefits, a fact that policymakers would be well advised to consider as they work to implement and recast the Affordable Care Act or to roll back safety net programs.21
Although the evidence suggests that past policy has nar-rowed gaps, this does not mean that we have identified the best ways to reduce disparities. It should be a high priority to better understand the relationship between childhood condi-tions and health outcomes over the life course and develop even more cost-effective ways to improve overall population health and eliminate health disparities related to race, ethnic-ity, and socioeconomic status. ■
Rucker C. Johnson is Associate Professor at the Goldman School of Public Policy at the University of California, Berkeley.
PATHWAYS • The Poverty and Inequality Report • Race and Ethnicity
30 health
NOTES
1. Williams, David, and Chiquita Collins. 1995. “U.S. Socioeconomic and Racial Differences in Health: Patterns and Explanations.” Annual Review of Sociology 21, 349–386; Johnson, Rucker C. 2012. “Health Dynamics and the Evolution of Health Inequality over the Life Course: The Importance of Neighborhood and Family Background.” B.E. Journal of Economic Analysis & Policy 11(3); Meara, Ellen R., Seth Richards, and David M. Cutler. 2008. “The Gap Gets Bigger: Changes in Mortality and Life Expectancy by Education, 1981–2000.” Health Affairs 27(2), 350–360; Chetty, Raj, Michael Stepner, Sarah Abraham, Shelby Lin, Benjamin Scuderi, Nicholas Turner, Augustin Bergeron, and David Cutler. 2016. “The Association Between Income and Life Expectancy in the United States, 2001–2014.” JAMA 315(16), 1750–1766.
2. The “Hispanic paradox,” which refers to the finding that Hispanic Americans have relatively good health outcomes, especially lower mortality risk, is a main exception to this general finding. For a recent review, see Markides, Kyriakos S., and Karl Eschbach. 2011. “Hispanic Paradox in Adult Mortality in the United States.” In International Handbook of Adult Mortality. Springer Netherlands, 227–240.
3. I wish to thank the Panel Study of Income Dynamics (PSID) staff for access to the confidential, restricted-use PSID geocode data. I am grateful to Andrew Goodman-Bacon for sharing data on the timing of Medicaid implementation and pre-Medicaid state health insurance and welfare eligibility rates. This research was supported by the National Institutes of Health.
4. I focus in this report on black-white differences primarily because data limitations in the PSID reduce the sample sizes of other racial or ethnic groups that have been followed from birth to adulthood.
5. Williams, David. 2005. “Social Sources of Racial Disparities in Health.” Health Affairs 24(2), 325–334.
6. Braveman, Paula A., Catherine Cubbin, Susan Egerter, David Williams, and Elsie Pamuk. 2010. “Socioeconomic Disparities in Health in the United States: What the Patterns Tell Us.” American Journal of Public Health 100(Suppl 1), S186–S196.
7. Barghaus, Katherine M., David M. Cutler, Roland G. Fryer Jr., and Edward L. Glaeser. 2008. “An Empirical Examination of Racial Differences in Health.” Retrieved from http://isites.harvard.edu/fs/docs/icb.topic709943.files/salt%20final.pdf; Johnson, Rucker C. 2010. “The Place of Race in Health Disparities: How Family Background and Neighborhood Conditions in Childhood Impact Later-Life Health.” In Neighborhood and Life Chances: How Place Matters in Modern America, eds. Harriet Newburger, Eugenie L. Birch, and Susan M. Wachter. Philadelphia: University of Pennsylvania Press.
8. Childhood residential segregation influences access to high-quality schools and medical care, exposure to crime and violence, housing and neighborhood conditions, and future employment opportunities. Black children are substantially more likely than white children to both grow up in concentrated poverty neighborhoods and attend high-poverty schools. For example, 45 percent of black students attend schools in which more than three-fourths of students are poor, while only 8 percent of white students attend such schools. Likewise, 30 percent of white students attend low-poverty schools (<25% poor), while only 8 percent of black students attend such schools.
9. In fact, white high school graduates who did not attend college live longer than blacks with a college degree or more education (see Braveman et al., 2010).
10. Johnson, 2012.
11. Barker, D. J. P. 1998. Mothers, Babies and Health in Later Life. Edinburgh: Churchill Livingstone.
12. Johnson, Rucker C., and Robert F. Schoeni. 2011. “The Influence of Early-Life Events on Human Capital, Health Status, and Labor Market Outcomes Over the Life Course.” B.E. Journal of Economic Analysis & Policy: Advances, 11(3); Lynch, John, and George Davey Smith. 2005. “A Life Course Approach to Chronic Disease Epidemiology.” Annual Review of Public Health 26, 1–35; Heckman, James J. 2007. “The Economics, Technology, and Neuroscience of Human Capability Formation.” Proceedings of the National Academy of Sciences 104(33), 13250–13255.
13. Heckman, 2007.
14. Council of Economic Advisers. 2016. “Economic Report of the President.”
15. This recent research, which I describe briefly here, extends the related finding that Medicaid reduced black infant and child mortality by 20 percent in the 1960s and 1970s (see Goodman-Bacon, Andrew. Forthcoming. “Public Insurance and Mortality: Evidence from Medicaid Implementation.” Journal of Political Economy).
16. Studies using quasi-experimental methods find that legislative expansions of Medicaid eligibility since 1980 led to large reductions in mortality for infants, children, and adults (see Currie, Janet, and Jonathan Gruber. 1996a. “Health Insurance Eligibility, Utilization of Medical Care, and Child Health.” Quarterly Journal of Economics 111(2), 431–466; Currie, Janet, and Jonathan Gruber. 1996b. “Saving Babies: The Efficacy and Cost of Recent Changes in the Medicaid Eligibility of Pregnant Women.” Journal of Political Economy 104(6), 1263–1296; Sommers, Benjamin D., Katherine Baicker, and Arnold M. Epstein. 2012. “Mortality and Access to Care Among Adults After State Medicaid Expansions.” New England Journal of Medicine 367, 1025–1034; Wherry, Laura R., and Bruce D. Meyer. 2016. “Saving Teens: Using a Policy Discontinuity to Estimate the Effects of Medicaid Eligibility.” Journal of Human Resources, 51(3), 556–588). However, because the corresponding increases in insurance coverage are relatively small during this later period, the mechanism for
PATHWAYS • The Poverty and Inequality Report • Race and Ethnicity
health 31
these effects is unclear (see Card, David, and Lara D. Shore-Sheppard. 2004. “Using Discontinuous Eligibility Rules to Identify the Effects of the Federal Medicaid Expansions on Low-Income Children.” Review of Economics and Statistics 86(3), 752–766). The Oregon Health Insurance Experiment, while providing the strongest research design to tease out health insurance coverage effects, is limited to short-run health outcomes (see Finkelstein, Amy, Sarah Taubman, Bill Wright, Mira Bernstein, Jonathan Gruber, Joseph P. Newhouse, Heidi Allen, Katherine Baicker, and Oregon Health Study Group. 2012. “The Oregon Health Insurance Experiment: Evidence from the First Year.” Quarterly Journal of Economics 127(3), 1057–1106). Recent studies find these Medicaid expansions (since 1980) led to improvements in poor children’s academic outcomes (see Cohodes, Sarah R., Daniel S. Grossman, Samuel A. Kleiner, and Michael F. Lovenheim. 2016. “The Effect of Child Health Insurance Access on Schooling: Evidence from Public Insurance Expansions.” Journal of Human Resources 51(3), 727–759; Levine, Philip B., and Diane Schanzenbach. 2009. “The Impact of Children’s Public Health Insurance Expansions on Educational Outcomes.” Forum for Health Economics & Policy 12(1), 1–26).
17. There was a 40 percent reduction in black infant mortality between 1964 and 1972. In the early 1960s, black infant mortality rates were significantly higher in states (and the District of Columbia) with de jure segregation than in non–Jim Crow Northern states. By the late 1960s, these North-South differences in black infant mortality rates had disappeared (see Krieger, Nancy, Jarvis T. Chen, Brent Coull, Pamela D. Waterman, and Jason Beckfield. 2013. “The Unique Impact of Abolition of Jim Crow Laws on Reducing Inequities in Infant Death Rates and Implications for Choice of Comparison Groups in Analyzing Societal Determinants of Health.” American Journal of Public Health 103(12), 2234–2244).
18. Chay, Kenneth Y., Jonathan Guryan, and Bhashkar Mazumder. 2009. “Birth Cohort and the Black-White Achievement Gap: The Roles of Access and Health Soon After Birth.” NBER Working Paper 15078.
19. Johnson, Rucker, and Kirabo Jackson. Forthcoming. “Reducing Inequality Through Dynamic Complementarity: Evidence from Head Start and Public School Spending.” NBER Working Paper.
20. Johnson, Rucker. 2016. “Can Schools Level the Intergenerational Playing Field? Lessons from Equal Educational Opportunity Policies.” Economic Mobility: Research and Ideas on Strengthening Families, Communities and the Economy. St. Louis: Federal Reserve Bank of St. Louis, 289–323.
21. ACA’s broad Medicaid expansion to poor families was effectively turned into a state opt-in, and seven of the 10 states with the highest black populations chose not to expand Medicaid. Consequently, more than half of the people without affordable health care coverage are minorities; 30 percent of them are black.
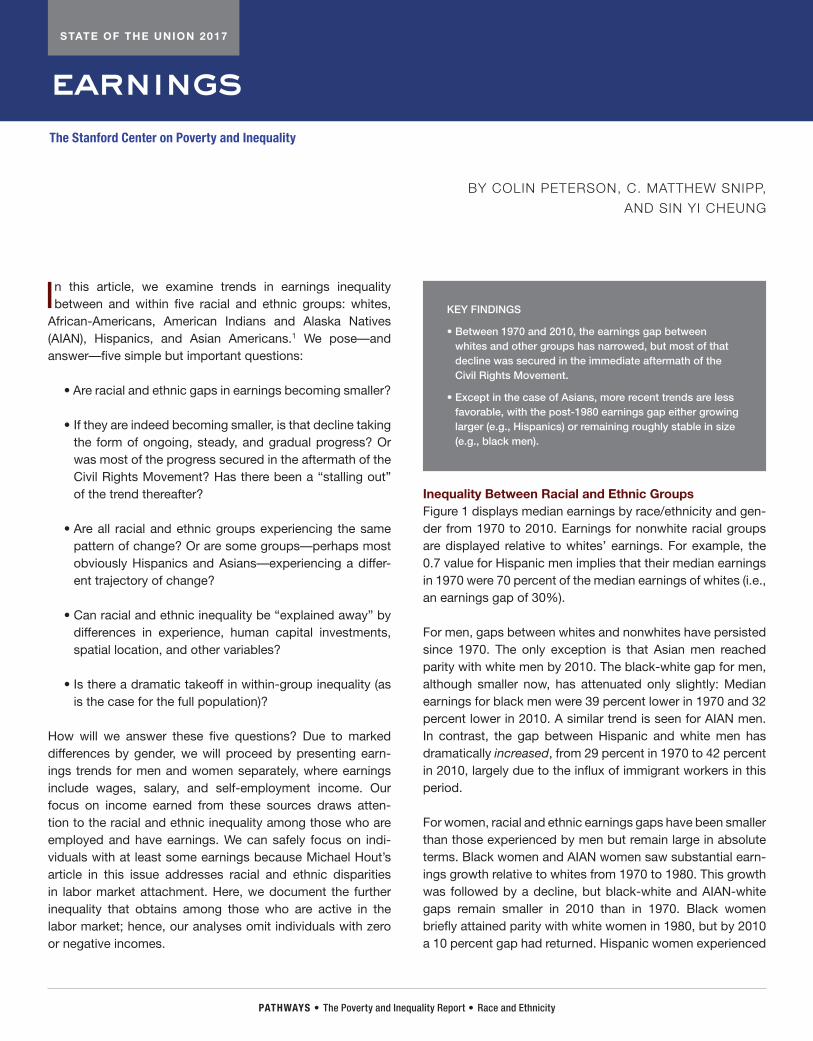
PATHWAYS • The Poverty and Inequality Report • Race and Ethnicity
The Stanford Center on Poverty and Inequality
STATE OF THE UNION 2017
In this article, we examine trends in earnings inequality between and within five racial and ethnic groups: whites,
African-Americans, American Indians and Alaska Natives (AIAN), Hispanics, and Asian Americans.1 We pose—and answer—five simple but important questions:
• Are racial and ethnic gaps in earnings becoming smaller?
• If they are indeed becoming smaller, is that decline taking the form of ongoing, steady, and gradual progress? Or was most of the progress secured in the aftermath of the Civil Rights Movement? Has there been a “stalling out” of the trend thereafter?
• Are all racial and ethnic groups experiencing the same pattern of change? Or are some groups—perhaps most obviously Hispanics and Asians—experiencing a differ-ent trajectory of change?
• Can racial and ethnic inequality be “explained away” by differences in experience, human capital investments, spatial location, and other variables?
• Is there a dramatic takeoff in within-group inequality (as is the case for the full population)?
How will we answer these five questions? Due to marked differences by gender, we will proceed by presenting earn-ings trends for men and women separately, where earnings include wages, salary, and self-employment income. Our focus on income earned from these sources draws atten-tion to the racial and ethnic inequality among those who are employed and have earnings. We can safely focus on indi-viduals with at least some earnings because Michael Hout’s article in this issue addresses racial and ethnic disparities in labor market attachment. Here, we document the further inequality that obtains among those who are active in the labor market; hence, our analyses omit individuals with zero or negative incomes.
Inequality Between Racial and Ethnic GroupsFigure 1 displays median earnings by race/ethnicity and gen-der from 1970 to 2010. Earnings for nonwhite racial groups are displayed relative to whites’ earnings. For example, the 0.7 value for Hispanic men implies that their median earnings in 1970 were 70 percent of the median earnings of whites (i.e., an earnings gap of 30%).
For men, gaps between whites and nonwhites have persisted since 1970. The only exception is that Asian men reached parity with white men by 2010. The black-white gap for men, although smaller now, has attenuated only slightly: Median earnings for black men were 39 percent lower in 1970 and 32 percent lower in 2010. A similar trend is seen for AIAN men. In contrast, the gap between Hispanic and white men has dramatically increased, from 29 percent in 1970 to 42 percent in 2010, largely due to the influx of immigrant workers in this period.
For women, racial and ethnic earnings gaps have been smaller than those experienced by men but remain large in absolute terms. Black women and AIAN women saw substantial earn-ings growth relative to whites from 1970 to 1980. This growth was followed by a decline, but black-white and AIAN-white gaps remain smaller in 2010 than in 1970. Black women briefly attained parity with white women in 1980, but by 2010 a 10 percent gap had returned. Hispanic women experienced
KEY FINDINGS
• Between 1970 and 2010, the earnings gap between whites and other groups has narrowed, but most of that decline was secured in the immediate aftermath of the Civil Rights Movement.
• Except in the case of Asians, more recent trends are less favorable, with the post-1980 earnings gap either growing larger (e.g., Hispanics) or remaining roughly stable in size (e.g., black men).
BY COLIN PETERSON, C. MATTHEW SNIPP,
AND SIN YI CHEUNG
earnings

PATHWAYS • The Poverty and Inequality Report • Race and Ethnicity
earnings 33
an even more dramatic decline in median earnings relative to whites than Hispanic men did, from a 16 percent gap in 1970 to a 32 percent gap in 2010.
These results allow us to answer three of the five questions with which we led off. On the matter of the overall “descriptive” trend in racial and ethnic gaps, one would be hard-pressed to represent Figure 1 as revealing some substantial across-the-board decline in inequality. For men, the net decline between 1970 and 2010 was quite small for blacks and AIANs, and the gap actually increased for Hispanics. Moreover, the fore-going declines were secured entirely in the aftermath of the Civil Rights Movement, and the AIAN gap has in fact (slightly) increased since then. The only unqualified success story: The gap for Asians has disappeared.2 For women, blacks and AIANs secured more substantial gains in the aftermath of the Civil Rights Movement, but some of those gains have now been given back.
Causes of Racial and Ethnic InequalityThese are of course wholly descriptive comparisons of median earnings by race and ethnicity. Although we cannot speak definitively to causes in this short article, it is useful to present evidence on net gaps as well as total gaps.
Except in the case of Asian Americans, nonwhites tend to
earn less than whites partly due to (a) disparities in human capital and educational attainment, and (b) differences in hours worked. Table 1 shows differences in earnings by race and ethnicity for each gender, net of the influence of edu-cation, work experience, location, hours worked per week, and several other factors, as detailed elsewhere by Snipp and Cheung.3 As before, the differences presented here are rela-tive to the earnings of white men and white women, meaning that they pertain to the proportion of white earnings secured by each group after adjusting for any differences between groups in the “control variables.” These proportions may be interpreted, then, as the “cost” of a given minority group sta-tus. Although there are likely some omitted variables in our analyses, the net penalties in Table 1 partly result from dis-crimination in the labor market, a causal effect that has been widely documented in audit studies of employers.4
Net racial and ethnic penalties are consistently larger for men than for women. However, the penalties for both men and women have attenuated since 1970, with the reductions for blacks, Chinese, Filipinos, and Japanese men especially large. Even so, the penalties for nonwhites remain large, except in the case of Japanese men and women, Chinese women, and Filipino women. For nonwhite non-Asians, the earnings penalty for being a person of color ranges from 16 to 19 percent for men and 6 to 10 percent for women.
FIGURE 1. Median Earnings Gaps by Race/Ethnicity and Gender, 1970–2010
Source: U.S. Decennial Census (1970, 1980, 1990, 2000) and American Community Survey (2010).
19801970 1990 2000 2010
1.2
1
1.1
0.8
0.7
0.6
0.5
0.9
Men
19801970 1990 2000 2010
1.2
1
1.1
0.8
0.7
0.6
0.5
0.9
Women
AIANs
Whites
Blacks
Hispanics
Asians
Med
ian
Ear
ning
s G
ap
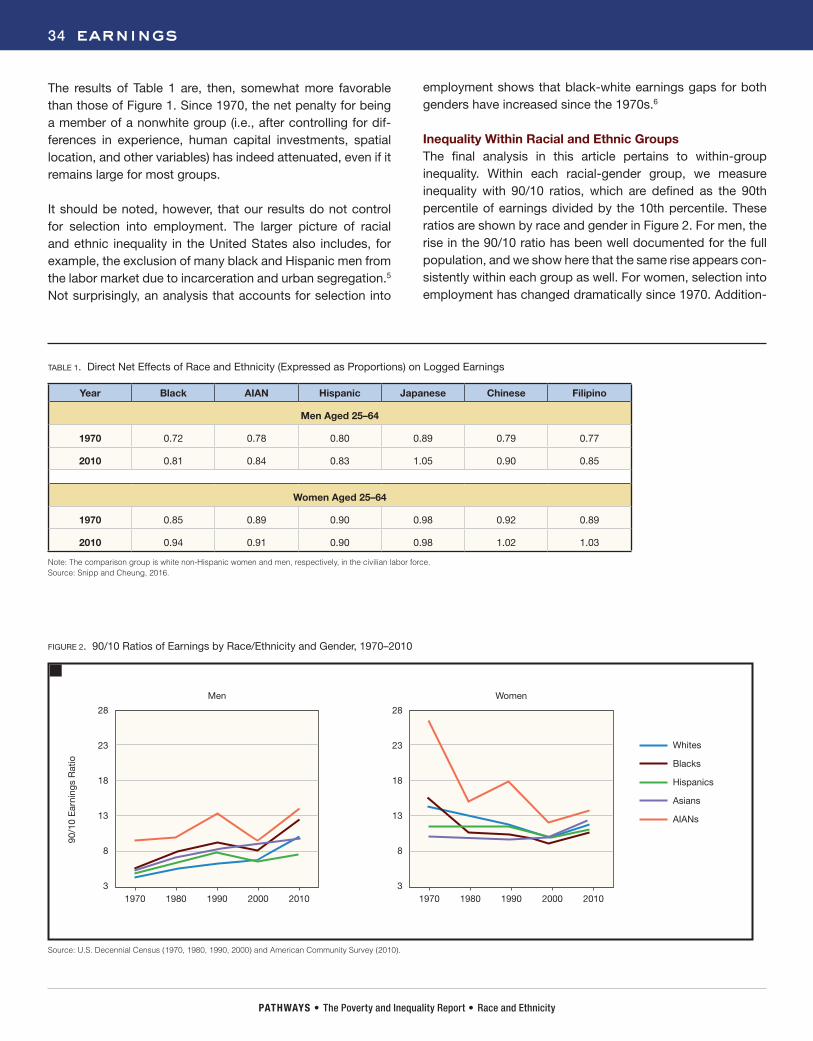
PATHWAYS • The Poverty and Inequality Report • Race and Ethnicity
34 earnings
The results of Table 1 are, then, somewhat more favorable than those of Figure 1. Since 1970, the net penalty for being a member of a nonwhite group (i.e., after controlling for dif-ferences in experience, human capital investments, spatial location, and other variables) has indeed attenuated, even if it remains large for most groups.
It should be noted, however, that our results do not control for selection into employment. The larger picture of racial and ethnic inequality in the United States also includes, for example, the exclusion of many black and Hispanic men from the labor market due to incarceration and urban segregation.5 Not surprisingly, an analysis that accounts for selection into
employment shows that black-white earnings gaps for both genders have increased since the 1970s.6
Inequality Within Racial and Ethnic GroupsThe final analysis in this article pertains to within-group inequality. Within each racial-gender group, we measure inequality with 90/10 ratios, which are defined as the 90th percentile of earnings divided by the 10th percentile. These ratios are shown by race and gender in Figure 2. For men, the rise in the 90/10 ratio has been well documented for the full population, and we show here that the same rise appears con-sistently within each group as well. For women, selection into employment has changed dramatically since 1970. Addition-
Source: U.S. Decennial Census (1970, 1980, 1990, 2000) and American Community Survey (2010).
Note: The comparison group is white non-Hispanic women and men, respectively, in the civilian labor force.Source: Snipp and Cheung, 2016.
Year Black AIAN Hispanic Japanese Chinese Filipino
Men Aged 25–64
1970 0.72 0.78 0.80 0.89 0.79 0.77
2010 0.81 0.84 0.83 1.05 0.90 0.85
Women Aged 25–64
1970 0.85 0.89 0.90 0.98 0.92 0.89
2010 0.94 0.91 0.90 0.98 1.02 1.03
TABLE 1. Direct Net Effects of Race and Ethnicity (Expressed as Proportions) on Logged Earnings
FIGURE 2. 90/10 Ratios of Earnings by Race/Ethnicity and Gender, 1970–2010
19801970 1990 2000 2010
28
18
23
8
3
13
Men
19801970 1990 2000 2010
28
18
23
8
3
13
Women
AIANs
Whites
Blacks
Hispanics
Asians
90/1
0 E
arni
ngs
Rat
io
PATHWAYS • The Poverty and Inequality Report • Race and Ethnicity
earnings 35
ally, there was greater equality among women in the number of hours worked per week by 2010 than in 1970. Hence, one sees a fall—rather than an increase—in the 90/10 ratio.
ConclusionThese are not, by and large, pleasant results to report. The main conclusion: The overall amount of racial and ethnic earnings inequality has not changed much after an initial improvement in the early post–Civil Rights years. The sole success story is that, for Asian men, the earnings gap has disappeared (whereas Asian women have, throughout this period, earned in excess of white women). Worse yet, racial and ethnic inequalities are yet larger when unearned income
is also considered, and they are further exacerbated by inequalities in wealth and mobility.7 It is manifestly clear that business-as-usual policy is falling short. ■
Colin Peterson is Ph.D. Candidate in Sociology at Stanford Uni-versity and Graduate Research Fellow at the Stanford Center on Poverty and Inequality. C. Matthew Snipp is Burnet C. and Mildred Finley Wohlford Professor of Humanities and Sciences in the Department of Sociology at Stanford University. He leads the race, ethnicity, and immigration research group at the Stan-ford Center on Poverty and Inequality. Sin Yi Cheung is Reader in Sociology and Director for International and Engagement at Cardiff University.
NOTES
1. Throughout this article, whites are limited to non-Hispanic whites; Hispanic blacks and Hispanic American Indians are treated as blacks and American Indians, respectively. Pacific Islanders are included in the pan-ethnic Asian racial group.
2. A more disaggregated analysis would show that this change is almost entirely the result of gains by Japanese and, to a lesser extent, Chi-nese men. Other groups such as Filipinos have not fared as well.
3. Snipp, C. Matthew, and Sin Yi Cheung. 2016. “Changes in Racial and Gender Inequality Since 1970.” Annals of the American Academy of Political and Social Science 663(1), 80–98.
4. See, for example, Bertrand, Marianne, and Sendhil Mullainathan. 2004. “Are Emily and Greg More Employable Than Lakisha and Jamal? A Field Experiment on Labor Market Discrimination.” American Economic Review 94(4), 991–1013; Pager, Devah, Bruce Western, and Bart Bonikowski. 2009. “Discrimination in a Low-Wage Labor Market: A Field Experiment.” American Sociological Review 74(5), 777–799.
5. Massey, Douglas S., and Nancy A. Denton. 1993. American Apartheid: Segregation and the Making of the Underclass. Cambridge, MA: Harvard University Press; Alexander, Michelle. 2012. The New Jim Crow: Mass Incarceration in the Age of Colorblindness. New York: The New Press.
6. Hirsch, Barry T., and John V. Winters. 2014. “An Anatomy of Racial and Ethnic Trends in Male Earnings in the U.S.” Review of Income and Wealth 60(4), 930–947; Fisher, Jonathan D., and Christina A. Houseworth. Forthcoming. “The Widening Black-White Wage Gap Among Women.” Labour: Review of Labour Economics and Industrial Relations.
7. Oliver, Melvin, and Thomas Shapiro. 1995. Black Wealth/White Wealth: A New Perspec-tive on Racial Inequality. New York: Routledge; Shapiro, Thomas. 2017. “Wealth Inequality.” Pathways Magazine Special Issue: State of the Union. Stanford Center on Poverty and Inequal-ity; Yamaguchi, Kazuo. 2009. “Black–White Differences in Social Mobility in the Past 30 Years: A Latent-Class Regression Analysis.” Research in Social Stratification and Mobility 27(2), 65–78.
PATHWAYS • The Poverty and Inequality Report • Race and Ethnicity
The Stanford Center on Poverty and Inequality
STATE OF THE UNION 2017
“Yes, there have been examples of success within black America that would have been unimaginable a half-century ago, ... [but] the gap in wealth between races has not less-ened, it’s grown.”—President Barack Obama, August 28, 2013, commemorat-ing the 50th anniversary of the March on Washington for Jobs and Freedom.
The social sciences traditionally have relied upon income and earnings to understand inequality, living standards, pov-erty, and program eligibility. This is partly for reasons of data availability: Data on family financial assets and liabilities have simply not been collected until recently. Nationally represen-tative surveys have collected information on wealth only since the mid-1980s. The research and policy worlds have since been playing catch-up: New results on wealth inequality and racial or ethnic wealth gaps have increasingly become part of the public, policy, advocacy, and scholarly discourse.1
This discussion of wealth has changed how we understand the sources of inequality. Whereas income is tied to contem-porary labor markets and how work is valued, wealth brings past policies and institutional arrangements more directly into the picture, especially those pertaining to housing and its intergenerational transmission. This is because (a) wealth often results from direct intergenerational transmission, and (b) homeownership is the largest reservoir of family wealth, constituting two-thirds of all middle-class wealth. To under-stand wealth accumulation, we must therefore understand the housing market and residential segregation. These two institutions have been deeply shaped by policy in the form of subsidies via federal tax expenditures and home-financing regulations. The relationship between wealth and overt policy is thus unusually strong.
Why should we care about wealth? It serves an insurance function by protecting against economic shocks, health and personal crises, and mishaps. It brings access to qual-ity health care, educational opportunities, better-resourced
communities, and other services. It shapes family economic mobility. It provides retirement security and a springboard for future generations’ investments in human capital and resources. And finally, social and political influence, as well as personal identity, are attached to wealth.
It thus matters whether opportunities to amass wealth are equally available. The simple result that will be discussed here: Access to building wealth is vastly unequal.
It’s partly that wealth begets wealth. It increasingly matters whether one is so lucky as to be born into a wealthy family.2 The story of racial and ethnic wealth inequality is, then, partly a “starting point” story. African-American and Hispanic chil-dren are born into families that are, on average, less wealthy, which disadvantages them in a host of ways, affecting the prospects of both current and future generations. Wealth gaps are a core determinant of many forms of racial and eth-nic inequality in the United States.
Measuring Racial and Ethnic Wealth GapsThe Federal Reserve System conducts the Survey of Con-sumer Finances (SCF) every three years. To understand the financial condition of families in the United States, nationally representative data are collected on savings, investments, debt payments, pension coverage, business ownership, use of financial institutions, credit discrimination, and financial markets. The SCF data provide a foundational baseline for median family wealth by race and ethnicity.3
KEY FINDINGS
• African-Americans own less than 8 cents and Hispanics less than 10 cents of wealth for every dollar amassed by whites.
• The racial wealth divide increased threefold (in absolute dollars) among families followed between 1984 and 2013.
BY THOMAS SHAPIRO
wealth

PATHWAYS • The Poverty and Inequality Report • Race and Ethnicity
wealth 37
What do the data on wealth tell us? As shown in Figure 1, the median white family had $141,900 in wealth. For every dollar of wealth held by the median white family, the median African-American family had less than 8 cents in wealth, and the median Hispanic family had less than 10 cents.
Although we now have more data on wealth, there are still major problems arising from small sample sizes and researcher neglect. Even when data are sufficient for gauging the wealth of a racial or ethnic group as a whole, the information cannot be disaggregated further. For example, Hispanic wealth can only be measured for all Hispanics, but geographic, historical, cultural, and immigrant histories are likely linked to differential wealth within this broadly defined group. The National Asset Scorecard for Communities of Color4 is a welcome recent addition, but the sample size and limited number of cities covered remain a challenge.
The Racial Wealth Gap over Three DecadesWhy are racial and ethnic wealth gaps so large? A plausible hypothesis is that they arise from massive differences in start-ing conditions that in turn result from historical racial legacies and racialized policies (e.g., residential redlining) as well as immigrant legacies (e.g., immigrants who enter the United
States with limited wealth). The available data, however, do not fully support such an interpretation, at least not in its sim-plest form.
This question can be addressed by turning to the Panel Study of Income Dynamics (PSID), which has been following a sample of 5,000 families and their descendants since 1968. Primarily focused on income and related attitudinal informa-tion, the PSID added a wealth module three decades ago. In 1984, the white-black wealth gap at the median was $84,400, as shown in Figure 2. These same PSID families experienced American policy, institutions, and communities over the next 29 years, and the racial wealth gap nearly tripled to $245,000.5
The tripling of the black-white wealth gap was due in part to “starting point” differences. For example, the enormous starting-point racial differences in home equity returned far more wealth to white homeowners than to blacks, as did racial differences in other types of wealth. This is a matter of wealth begetting wealth. But other policies exacerbate and extend such “starting point” differences. For example, there are sizable racial differences in unemployment spells and in educational attainment, both of which independently convert into differential capacities for accumulation.6
FIGURE 2. Wealth Accumulation of PSID Families, 1984–2013FIGURE 1. Median Net Wealth by Race and Ethnicity, 2013
Note: Institute on Assets and Social Policy calculations from Survey of Consumer Finances. Note: Institute on Assets and Social Policy calculations from Panel Study of Income Dynamics; 2013 dollars.
Net
Wea
lth
Net
Wea
lth
White Families Black Families Hispanic Families
$11,000 $13,700
$140K
$100K
$40K
$120K
$60K
$80K
$20K
0
$141,900$350K
$250K
$100K
$300K
$150K
$200K
$50K
019941984 2001 2005 2009 2013
$84,400
$245,000
White Families Black Families
PATHWAYS • The Poverty and Inequality Report • Race and Ethnicity
38 wealth
ConclusionsWe need to know much more about the origins of wealth inequalities as well as potential remedies. Scholars of inequal-ity are increasingly examining wealth, but improved data and measurement capacity are needed to understand the persis-tence of racial and ethnic wealth gaps.7
One key innovation would be an Asset Poverty Index, a wealth-based corollary to standard income-based poverty measures. Some policy groups define asset poverty as the minimum amount of wealth needed to keep a family out of poverty for three months. By this definition, 44 percent of American families fell below the asset poverty line in 2009.8 This result speaks to the economic fragility of American families.
And black and Hispanic families are especially fragile by this measure. In 2010, 29 percent of Hispanic households and 34 percent of black households owned zero or negative net wealth, as compared to 14 percent of white households. The lack of a wealth buffer makes black and Hispanic households especially vulnerable to everyday shocks (e.g., employment shocks, eviction shocks, car repair shocks) that, perversely, are also more likely to hit them. ■
Thomas Shapiro is Professor of Law and Social Policy and Director of the Institute on Assets and Social Policy at Brandeis University.
NOTES
1. Oliver, Melvin, and Thomas Shapiro. 1995. Black Wealth/White Wealth: A New Perspective on Racial Inequality. New York: Routledge.
2. Saez, Emmanuel, and Gabriel Zucman. 2016. “Wealth Inequality in the United States Since 1913: Evidence from Capitalized Income Tax Data.” Quarterly Journal of Economics 131(2), 519–578.
3. The Survey on Income and Program Partici-pation (SIPP) is often utilized for descriptive and analytic purposes when researchers examine race, ethnicity, and wealth.
4. See, for example, Meschede, Tatjana, Dar-rick Hamilton, Ana Patricia Muñoz, Regine Jackson, and William Darity. 2016. “Inequality in the ‘Cradle of Liberty’: Race/Ethnicity and Wealth in Greater Boston.” Race and Social Problems 8(1), 18–28.
5. Median wealth for whites in 2013 is higher in Figure 2 than in Figure 1 because Figure 2 follows the same households since 1984, and therefore its sample is of older and higher wealth households in more recent years. The same explanation holds for black house-holds in Figure 2, though black wealth did not increase as much. In contrast, Figure 1 is based on the Survey of Consumer Finances, which draws a nationally representative sample of all households.
6. Shapiro, Thomas, Tatjana Meschede, and Sam Osoro. 2013. “The Roots of the Widening Racial Wealth Gap: Explaining the Black-White Economic Divide.” IASP Research and Policy Brief.
7. For a fuller description, see Shapiro, Thomas. 2017. Toxic Inequality: How America’s Wealth Gap Destroys Mobility, Deepens the Racial Divide, and Threatens Our Future. New York: Basic Books.
8. Shapiro, Thomas, Melvin Oliver, and Tatjana Meschede. 2009. “The Asset Security and Opportunity Index.” IASP Research and Policy Brief.
head 39
PATHWAYS • The Poverty and Inequality Report • Race and Ethnicity
The Stanford Center on Poverty and Inequality
STATE OF THE UNION 2017
In contrast to the “land of opportunity” narrative, the United States does not rank as a high-mobility coun-
try when compared with its advanced-industrial peers.1 Moreover, we know that the United States has wide racial and ethnic differences in socioeconomic well-being, with whites enjoying higher levels of education, earnings, and wealth than blacks and Hispanics.
Will such racial and ethnic gaps persist? If black and His-panic Americans have greater upward mobility than white Americans do, then racial gaps in well-being might close in the future. But, if blacks and Hispanics are more likely to move downward, these gaps in racial and ethnic well-being are likely to amplify.
An informative way to examine racial differences in inter-generational mobility is to measure (a) the probability that individuals move up from a condition of childhood disadvantage by the time they reach adulthood, and (b) the probability that individuals experience the opposite transition—moving down from comfortable social ori-gins—by the time they reach adulthood.2 In this article, I examine trends in upward and downward mobility for black and white Americans since the mid-20th century.3
The chances for upward and downward mobility have historically been vastly different for blacks and whites. We begin by looking at the mobility profiles of people born around 1960, for whom intergenerational mobility depended heavily on race. Figure 1 considers two mea-sures of upward mobility.4 The two bars on the left side of the figure show the probability of moving out of the poorest one-fifth of households (ranked by income in the parents’ generation) by the time a person reached roughly age 40; the two bars on the right side of the figure show the probability of moving out of the poorest one-half of households.
Both measures of upward mobility tell a similar story: Blacks had a much lower probability of moving up than whites of similar social origins. Blacks who grew up in the bottom fifth of the household income distribution (i.e., in poverty or close to the poverty line) had about a 50 percent chance of getting out of the bottom fifth during adulthood. In contrast, for whites the chance was about 75 percent. The white-black gap is of similar mag-nitude (i.e., about 25 percentage points) when mobility is instead measured as the probability of moving up from the bottom half.
Figure 2, which presents results on downward mobil-ity, again shows significant racial disparity. Blacks who grew up in more affluent households in the 1960s and 1970s had a greater chance of moving downward com-pared with whites of similar origins. For example, blacks growing up in the top half of the income distribution had about a 60 percent chance of moving to the bottom half as adults; the probability for similar whites was less than 40 percent.
In sum, intergenerational mobility in the United States is racially asymmetrical: The persistence of affluence has been stronger for whites, while the persistence of poverty has been stronger for blacks. This means that, compared with similar whites, black Americans have had much
KEY FINDINGS
• The persistence of affluence is stronger for whites, while the persistence of poverty is stronger for blacks.
• However, beginning with generations that came of age in the mid-1960s, the white-black gap in the chance of escaping poverty has closed significantly.
intergenerational mobility
BY FLORENCIA TORCHE
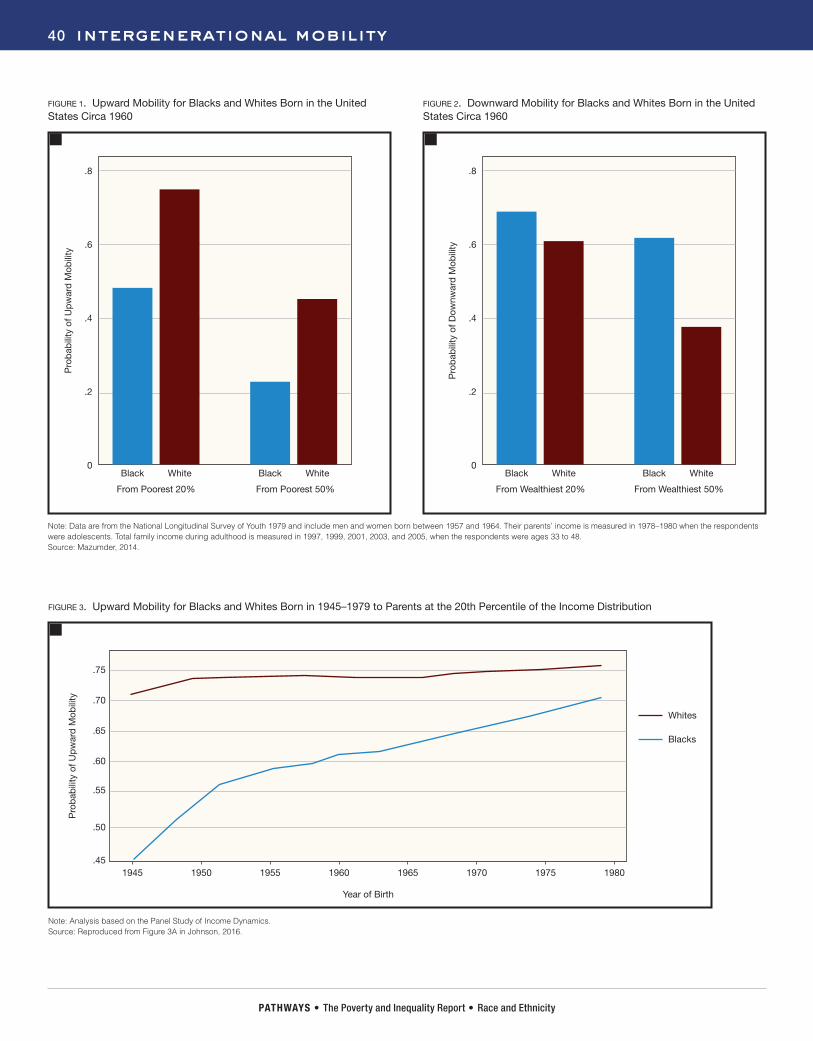
PATHWAYS • The Poverty and Inequality Report • Race and Ethnicity
40 intergenerational mobility
Note: Analysis based on the Panel Study of Income Dynamics.Source: Reproduced from Figure 3A in Johnson, 2016.
FIGURE 3. Upward Mobility for Blacks and Whites Born in 1945–1979 to Parents at the 20th Percentile of the Income Distribution
Pro
bab
ility
of U
pw
ard
Mob
ility
19501945 1955 1960 1965 1970 1975 1980
.75
.70
.65
.60
.55
.50
.45
Whites
Blacks
Year of Birth
FIGURE 2. Downward Mobility for Blacks and Whites Born in the United States Circa 1960
FIGURE 1. Upward Mobility for Blacks and Whites Born in the United States Circa 1960
Note: Data are from the National Longitudinal Survey of Youth 1979 and include men and women born between 1957 and 1964. Their parents’ income is measured in 1978–1980 when the respondents were adolescents. Total family income during adulthood is measured in 1997, 1999, 2001, 2003, and 2005, when the respondents were ages 33 to 48. Source: Mazumder, 2014.
Pro
bab
ility
of U
pw
ard
Mob
ility
Black
From Poorest 20%
White Black
From Poorest 50%
White
.8
.6
.4
.2
0P
rob
abili
ty o
f Dow
nwar
d M
obili
ty
Black
From Wealthiest 20%
White Black
From Wealthiest 50%
White
.8
.6
.4
.2
0

PATHWAYS • The Poverty and Inequality Report • Race and Ethnicity
intergenerational mobility 41
more difficulty both in overcoming disadvantaged origins and in retaining economic advantage achieved by their parents.
Trends in Black and White Mobility The foregoing comparisons depict sharply different structures of opportunity for black and white Americans. However, much has changed since the mid-20th century, when social scien-tists originally diagnosed this mobility disparity as a “vicious cycle” of intergenerational persistence of poverty among black Americans.5 Important transformations such as the Civil Rights Movement, the end of legally enforced racial segrega-tion, and anti-discrimination legislation reduced some of the barriers that black Americans historically faced in securing education and other forms of human capital.
Figure 3 suggests that such changes have indeed reduced the racial mobility gap over time. The probability of mov-ing upward for children growing up at the 20th percentile of household income has remained relatively constant for whites, at about 75 percent. However, there has been much improvement for blacks, with the probability of upward mobil-ity increasing from less than 50 percent for cohorts born in the mid-1940s to about 70 percent among those born in the late 1970s.
What accounts for this remarkable racial convergence in upward mobility from disadvantaged origins? The con-vergence rules out any essential differences in ability or endowments between racial groups, because these dif-
ferences would likely persist over time, and suggests that institutions and policy play an important role in shaping opportunities for different racial groups.
An important study by Rucker Johnson examines the influ-ence of Head Start, the largest targeted early-childhood intervention program in the United States; of school desegre-gation policies that integrated the educational experience of blacks and whites; and of school finance reform that equal-ized economic resources among schools serving poor and affluent children.6 By exploiting variation in these programs across time and place, the study shows that they contrib-uted to the upward mobility of black and low-income children. Several pathways likely account for their effects, including the equalization of economic resources, the racial integration of peer groups, and the change in expectations for minority chil-dren.
The substantial decline in the black-white mobility gap pro-vides strong evidence that policies reducing racial exclusion and fostering opportunity for disadvantaged children are effective tools to reduce racial disparities and provide an ave-nue for further equalization of life chances across racial and ethnic groups in the United States. ■
Florencia Torche is Professor of Sociology at Stanford University. She leads the social mobility research group at the Stanford Cen-ter on Poverty and Inequality.
NOTES
1. Corak, Miles. 2016. “Economic Mobil-ity.” Pathways Magazine Special Issue: State of the Union. Stanford Center on Pov-erty and Inequality. Retrieved from http://inequality.stanford.edu/sites/default/files/Path-ways-SOTU-2016-Economic-Mobility-3.pdf.
2. Note that these are not the most com-mon measures of intergenerational mobility. Typically, mobility is measured with a single summary measure, such as the rank-rank income relationship. The rank-rank measure is constructed by (a) ranking parents’ income when children were growing up and current adult children’s income, and (b) estimat-ing the slope of the line linking these ranked measures. Larger values of the rank-rank relationship indicate a tighter link between the
income of parents and adult children—that is, less mobility. However, the single summary measure is not a good approach when com-paring social groups that have vastly different levels of economic well-being, such as blacks and whites in the United States.
3. Research on race and mobility to date focuses on blacks and whites. While this focus is understandable given that Hispanic samples available in surveys were small until the most recent decades, it is increasingly less suitable in a country in which Hispanics now make up 18 percent of the population and 23 percent of births. New administrative data sources will expand researchers’ ability to examine trends in mobility for Hispanics and even smaller racial and ethnic groups.
4. Mazumder, Bhashkar. 2014. “Black-White Differences in Intergenerational Economic Mobility in the United States.” Economic Per-spectives 38(1), 1–18.
5. Blau, Peter M., and Otis Dudley Duncan. 1967. The American Occupational Structure. New York: John Wiley and Sons, 203–204.
6. Johnson, Rucker. 2016. “Can Schools Level the Intergenerational Playing Field? Lessons from Equal Educational Opportunity Policies.” Economic Mobility: Research and Ideas on Strengthening Families, Communities and the Economy. St. Louis: Federal Reserve Bank of St. Louis, 289–323.

Inside Back Cover
Studies in Social Inequality
RECENT TITLES FROM STANFORD UNIVERSITY PRESS
Most Stanford titles are available as e-books: www.sup.org/ebooks
S TA N F O R DU N I V E R S I T Y P R E S S800.621.2736 www.sup.org
INEQUALITY IN THE PROMISED LANDRace, Resources, and Suburban SchoolingR. L’HEUREUX LEWIS-MCCOY$24.95 paper $85.00 cloth
ALSO OF INTEREST
INCOME INEQUALITYEconomic Disparities and the Middle Class in Affluent CountriesEdited by JANET C. GORNICK and MARKUS JÄNTTI “This is one of the most important books on inequality published in the past decade. Focusing on what has happened to the middle class since the 1980s, during a period of substantial economic and political restructuring, this volume’s remarkable insights and influence will span disciplines.” —Jason Beckfield,
Harvard University$24.95 paper
DETERMINED TO SUCCEED?Performance versus Choice in Educational AttainmentEdited by MICHELLE JACKSON “Following in the tradition of seminal works on comparative studies of education, Determined to Succeed offers an excellent assessment of social origin and educational attainment. Important and innovative, the volume is sure to find wide influence and readership in the sociology of education.”
—Hans Peter Blossfeld, University of Bamberg
$60.00 cloth
SOCIAL CLASS AND CHANGING FAMILIES IN AN UNEQUAL AMERICAEdited by MARCIA J. CARLSON and PAULA ENGLAND$24.95 paper $80.00 cloth
BROKEHow Debt Bankrupts the Middle ClassEdited by KATHERINE PORTER $24.95 paper $80.00 cloth
IMPROVING LEARNING ENVIRONMENTSSchool Discipline and Student Achievement in Comparative PerspectiveEdited by RICHARD ARUM and MELISSA VELEZ$60.00 cloth
THE NEW GILDED AGEThe Critical Inequality Debates of Our TimeEdited by DAVID B. GRUSKY and TAMAR KRICHELI-KATZ“Those looking for answers to questions about the new inequality will find them in this trenchant book edited by David Grusky and Tamar Kricheli-Katz, who have brought together eminent thinkers to address the moral, political, and social problems stemming from today’s hyper-inequality.” —Douglas S. Massey,
Princeton University$24.95 paper $85.00 cloth
Stanford Center on Poverty and InequalityBuilding 370, 450 Serra MallStanford UniversityStanford, CA 94305-2029
NON PROFIT ORG.U.S. POSTAGE
PAIDPermit No. 28 PALO ALTO, CA
inequality.stanford.edu
Established in 2007, the Stanford Center on Poverty and Inequality
is a program of the Institute for Research in the Social Sciences at
Stanford University. We gratefully acknowledge core support from the
Elfenworks Foundation for the Center, Pathways Magazine, and the
State of the Union on Poverty and Inequality.