patient comfort level prediction during transport using...
TRANSCRIPT

Turk J Elec Eng & Comp Sci(2019) 27: 2817 – 2832© TÜBİTAKdoi:10.3906/elk-1807-258
Turkish Journal of Electrical Engineering & Computer Sciences
http :// journa l s . tub i tak .gov . t r/e lektr ik/
Research Article
Patient comfort level prediction during transport using artificial neural network
Željko JOVANOVIĆ1,∗ , Marija BLAGOJEVIĆ1 , Dragan JANKOVIĆ2 , Aleksandar PEULIĆ3
1Faculty of Technical Sciences, University of Kragujevac, Čačak, Serbia2Faculty of Electronic Engineering, University of Niš, Niš, Serbia
3Faculty of Engineering, University of Kragujevac, Kragujevac, Serbia
Received: 24.07.2018 • Accepted/Published Online: 22.02.2019 • Final Version: 26.07.2019
Abstract: Since patient comfort during transport is a matter of paramount importance, this paper aims to determinethe possibilities of applying neural networks for its prediction and monitoring. Specific objectives of the research includemonitoring and predicting patient transport comfort, with subjective assessment of comfort by medical personnel. Anoriginal Android application that collects signals from an accelerometer and a GPS sensor was used with the aim ofachieving the research goals. The collected signals were processed and a total of twelve parameters were calculated. Amultilayer perceptron was created in the proposed research. The evaluation results indicate acceptable accuracy andgive the possibility to apply the same model to the next patient transport. The root mean square error was 0.0215 andthe overall confusion matrix prediction accuracy was 90.07%. Moreover, the results were validated in real usage. Thelimitations and future work are highlighted.
Key words: Patient comfort, artificial neural network, android application, accelerometer
1. IntroductionWhile the comfort of passengers is regarded as one of the most significant features of vehicles, a problem ariseswhen it comes to its measuring. The difficulty lies in the fact that comfort is dependent on numerous factors. Ingeneral, the acceleration (vibration) that passengers feel during a ride is considered to have the greatest impacton the comfort they experience. The three most important factors that are responsible for the vibration in avehicle are the vehicle’s condition, the driver’s skills (driving style), and road conditions. Although the conditionof the vehicle is determined based on numerous characteristics, it is generally accepted that suspension and tiresinfluence vibration to the greatest extent. The effect of vibration on humans in various situations was addressedin [1, 2]. However, it must be noted that the transport of patients should be regarded as a specific categoryof transportation since patients are passengers with mental or physical health problems and the comfort of theride affects the mental and physical conditions of even healthy passengers. Therefore, the effect of vibrations,noise, temperature, and other subjective parameters could be even greater when it comes to patients sincethese can exacerbate their already existent health problems. There are two types of patient transport: primarytransport and secondary transport. Primary transport [3] is the movement of patients from the scene of anaccident or the onset of illness to the first hospital contact, where their injuries or illnesses can be stabilized andtreated. It is usually undertaken by paramedics and it is called prehospital care. Secondary transport [4] is themovement of the patient after initial treatment and may include transfer to specialized facilities within the same∗Correspondence: [email protected]
This work is licensed under a Creative Commons Attribution 4.0 International License.2817

JOVANOVIĆ et al./Turk J Elec Eng & Comp Sci
hospital (intrahospital transfer) or transfer from one hospital to another for continuing clinical care (interhospitaltransfer). Road ambulance vehicles are mostly used for patient transport from or between places of treatment.In many instances, these vehicles must provide medical care to the patient; therefore, they are specificallydesigned for patient transport and should be aligned with the regulations presented in [5]. This Europeanstandard outlines the requirements for the design, testing, performance, and equipping of road ambulances usedfor the transport and care of patients. The design of emergency medical service (EMS) vehicles, as shown in[6], specifies a number of recommendations for patient transport. The transport of patients with severe headinjuries was presented in [7], whereas the adequate transport of patients with spinal injuries was described in [8].The most significant recommendations relate to careful and steady transport of patients. Having this in mind,this paper focuses on the monitoring and prediction of patient transport comfort in EMS vehicles. The purposeof the research is to determine the possibilities of applying neural networks in predicting patient comfort. Thespecific aims of the research relate to monitoring and predicting the comfort of patients during transport. Theresults were obtained using the subjective evaluation of comfort by medical staff in EMS vehicles. An Androidapplication presented in [9] was used to collects signals from an accelerometer and GPS sensor. Moreover, theresults were validated in real usage. This paper also puts an emphasis on the potential to use the predictionalgorithm in emerging and rapidly developing technologies. The remainder of this paper is structured in thefollowing way: Section 2 presents the related work, Section 3 focuses on the research methodology, Section 4presents the obtained results, and the final conclusions are shown in Section 5.
2. Related workThis section presents the previous work related to patient comfort during transport and the application of neuralnetworks in predicting it. As mentioned above, riding comfort is regarded as one of the primary characteristics ofvehicles and the acceleration (vibration) of the vehicle during the ride is generally considered the most significantfactor that affects the comfort of the passengers. The general term that relates to the vibrations (mechanicaloscillations) of any frequency that are transferred to the human body is whole-body vibration (WBV). Anoverview of current standards and regulations regarding WBV was given in [10]. These are:
• ISO Standard 2631-1 (1997) [2];
• British Standard 6841 (1987) [11];
• ANSI S3.18:2002 [12];
• European Directive 2002/44/EC [13];
• Control of Vibration at Work Regulations [14].
The International Standard Organization (ISO) presented a popular and useful criterion for ride comfort(ISO 2631) [2], which addresses the effects of vibrations on a passenger. Comfort levels are defined accordingto [2]. Only vertical axes are used for the classification of comfort levels.
Both standards and regulations presuppose that acceleration magnitude, frequency spectrum, and dura-tion represent the crucial exposure variables, which may lead to potential harmful effects. The Serbian nationalstandard that relates to this field is ICS 13.160 (SRPS ISO 2631-1:2014, Mechanical vibration and shock: Eval-uation of human exposure to whole-body vibration, Part 1: General requirements). The proposed research
2818

JOVANOVIĆ et al./Turk J Elec Eng & Comp Sci
highlights the subjective assessment of comfort, while the calculated values were used for neural network train-ing. The impact of vibration duration and the amount of rest between successive vibrations were analyzed in[15]. No significant differences were found in discomfort between 15-s or 20-s vibration exposure, nor between5-s and 10-s rest duration for any type of vibration exposure. The research presented here applied the samedriving conditions for the testing of the decision interval with 10-s and 15-s durations. The relationship be-tween discomfort and the vibration total value for different axes of vibration was given in [16]. A number ofstatistically significant differences were observed in discomfort between the different axes of vibration for similarranges of vibration total values. Less discomfort was typically associated with single axis vertical vibrationsthan with multiaxis vibrations. This finding implies that the frequency weighting scheme presented in ISO2631-1 does not achieve interaxis equivalence. Consequently, it is necessary to conduct a more detailed analysisof multiaxis vibration that will lead to changes in the ISO 2631-1 weighting factors. Accordingly, all three axeswere included in the prediction of comfort in the proposed research. An accelerometer is a device that candetect and measure static gravity influence, as well as dynamic movement influence. The authors of [17–19]devised automotive real-time observers and an attitude estimation system based on an extended Kalman filter(EKF). The authors of [20] detected road potholes with high-pass filtered accelerometer data. A high-pass (HP)filter was used for passing high-frequency vibrations in the proposed research. The use of mobile health devicesis becoming increasingly common in this field of research since they have sensors (accelerometers, gyroscope,GPS), multicore processors, etc. The conclusion that the authors of [21] reached was that mobile technologiesmay transform care delivery across populations and within individuals in the foreseeable future. The authors of[22] outlined a mobile sensing system for road irregularity detection using Android OS-based smartphones. Onlythe Z-axis was used in their calculations. However, the calculations in the present paper were performed over allthree axes. The authors of [23] considered the problem of monitoring road and traffic conditions in a city usingsmartphones. Smartphones were also used in the proposed research, but to monitor and predict patient trans-port comfort levels, not to detect the cause of discomfort. According to the ISO 2631-1 standard, exposure toWBV brings health risks. The authors of [24, 25] concluded that ISO 2631-1 comfort prediction results did notmatch self-reported results for heavy machinery routines for construction, forestry, and mining vehicles. Sincethe subjective experience of the comfort level was different from the predicted one, in the proposed researchneural networks (NNs) are implemented in order to predict subjective comfort. The relation between disabilityretirement and workers’ exposure to WBV was the subject of many papers. A strong association between thesewas shown in [26]. The authors of [27] concluded that both the age and the weight of drivers were important.Although this was not taken into consideration in the proposed research, it will be considered as an additionalinput parameter in a future work. Very few papers deal with neural network implementation in predictingpatient comfort during transport. Neural networks were successfully implemented in drug transport modelingand simulation in [28]. As opposed to the research conducted in [28], in the proposed research patient transportcomfort is analyzed using artificial neural networks. In [29], neural networks were implemented to predict icejam occurrence. The authors of [29] found that the application of neural networks could be more successful forthis issue than the application of other techniques of data mining, thereby concluding that NNs provide earlywarning and permit rapid and effective mitigation of ice jams. Provided that the true data-generating process isunknown and hard to identify, which was the case in this study, the authors of [30] suggested the implementa-tion of neural networks. Such an approach involved creating, testing, and evaluating models of neural networks[30]. Neural networks were also successfully applied in the analysis of the quality of public transport in [31]. In[32], unlike in the proposed research, a Bayesian network was used for identifying the mode of transport: walk-
2819
JOVANOVIĆ et al./Turk J Elec Eng & Comp Sci
ing or cycling. The authors in [33] proposed decentralized intelligent transportation systems with distributedintelligence based on classification techniques. By analyzing the related research in the application of neuralnetworks for predicting comfort levels, one can observe similarities and differences with the proposed methodof each shown survey. The analysis of related research has found that neural networks have been used in theanalysis of various transportation problems. However, very few studies dealt with transport comfort using theaforementioned techniques. In this sense, the proposed research is innovative in its approach, with its purposeof determining the possibility of implementing artificial neural networks for the presented research problem.
3. Materials and methodsIn this section the methods and materials for analysis are presented. In order to collect the data for patientcomfort monitoring, an Android application was developed to calculate several parameters and passengers’subjective comfort levels during patient transport. The collected data are further used to train, test, andvalidate the neural network in order to detect the subjective patient comfort level.
3.1. Android application for patient transport comfort monitoring
For patient transport comfort monitoring, an Android application was developed. It is based on three axes’accelerometer data calculations. The development of the main application functionalities was presented in[34] and full functionalities were presented in [9]. In order to collect parameters for patient transport comfortanalysis, accelerometer calculations, GPS monitoring, and main application threads are created using RxJava[35]. The developed Android application algorithm is presented in Figure 1.
After application parameters are set up, the accelerometer and GPS threads start. At the beginning,the application calibrates the accelerometer axis orientation as follows: X is the movement direction, Y is thelateral movement direction, and Z is the vertical movement direction. Thanks to these, it is possible to analyzethe discomfort cause direction, with axis discomfort as follows:
• Z-axis: ertical discomfort,
• Y-axis: lateral discomfort,
• X-axis: moving direction discomfort.
After the calibration, the comfort calculation is performed. Live three-axis acceleration caused by thevehicle’s vibrations are plotted on the phone display. After the decision time interval expires, the applicationrequests the user to enter the subjective comfort level (comfortable; medium uncomfortable; uncomfortable).The marked comfort level is presented in the display’s upper right-hand corner with a green, yellow, or red lightbulb, respectively. Calculated and subjectively marked data are saved to KML and TXT files. Implementedcalculations are presented in the next section.
3.2. Implemented calculations
The application is designed to calculate accumulated vibrations in standard time intervals according to Eq. (1):
azRMS =
√1
n(a2z1 + a2z2 + · · ·+ a2zn). (1)
2820

JOVANOVIĆ et al./Turk J Elec Eng & Comp Sci
START
LOGIN
APPLICATION
PARAMETERS
SETUP
ACCELEROMETER
THREAD START
GPS THREAD
START
ACCELEROMETER
CALIBRATION
ACCELEROMETER
SAMPLING/COMFORT
APPLICATION
DECISION TIME
EXPIRED
DATA RECORDING TO
FILES
SUBJECTIVE
COMFORT LEVEL
RECORDING
Figure 1. Algorithm of the developed Android application.
This calculation is performed for all three axes (RMS_X, RMS_Y, RMS_Z). Beside these values, for everyacceleration sample, the application calculates the magnitude of all three axes’ accelerations according to Eq.(2):
aiRMS =√a2xi + a2yi + a2zi, (2)
where axi , ayi , and azi are the X-, Y-, and Z-axis accelerations for the ith sample and aiRMS is the magnitudeof all three axes’ accelerations. Using these values in the decision time interval, aRMS is calculated accordingto Eq. (3):
aRMS =
√1
n(a21RMS + a22RMS + . . .+ a2nRMS), (3)
where aiRMS is the ith magnitude of all three axes’ accelerations and n is the number of samples.According to the ISO (ISO2631-1:1997), the weighting factors for the X- and Y-axis are 1.4 while for the
Z-axis it is 1.Exposure to WBV, based on weighting factors, is calculated with the following formula (ISO2631-1:1997):
a =√1.42a2x + 1.42a2y + a2z [m/s2]. (4)
Although many researchers use the k -factor (i.e. 1.4) for the accelerations along the X- and Y-axes whenevaluating WBV, as noted in the application of ISO 2631, there is debate about this number due to ambiguity
2821
JOVANOVIĆ et al./Turk J Elec Eng & Comp Sci
regarding the axes to be evaluated. The ambiguity comes from the anomalous use of a multiplying factor of 1.4for ax and ay . Guidance is only provided regarding the evaluation of health effects of WBV, not the effects ofWBV on comfort. As an alternative, the vector sum of the RMS accelerations with no weighting factor can beused (ISO 2631-1:1997), as in Eq. (2).
This formula is being used with many machinery devices to measure the acceleration.Beside these calculations, maximum magnitude values (APEAK) and their axis values (APEAK_X,
APEAK_Y, APEAK_Z) are calculated. For detected APEAK the GPS data (latitude, longitude, altitude,speed, time) are stored. For the analysis of suffered vibrations all three axes’ maximum accelerations arecalculated. According to these, after the decision time interval the next values are stored in predefined fileformats:
• IDT: location marker ID
• RMS_X: Eq. (1),
• RMS_Y: Eq. (1),
• RMS_Z: Eq. (1),
• ARMS: Eq. (3),
• APEAK: Eq. (2),
• APEAK_X, APEAK_Y, APEAK_Z: axis values for APEAK sample,
• LATITUDE,LONGITUDE, TIME, SPEED: GPS data for APEAK sample,
• MAX_X, MAX_Y, MAX_Z: maximum detected absolute values by axes,
• COMFORT: subjectively marked comfort level (0 = comfortable; 1 = a little uncomfortable; 2 = uncom-fortable).
In order to measure the real acceleration of the device, the contribution of the force of gravity must beeliminated. This is achieved by applying a HP filter over raw accelerometer data according to Eq. (5):
HPXi = HPXi−1 − ((RX · fc) + HPXi−1 · (1− fc)) , (5)
where HPXi is the ith HP-filtered X-axis acceleration, RX is raw X-axis acceleration data, and fc = 0.1 is thefilter coefficient that cuts 10% of the lower frequencies. Raw and filtered data for all three axes are presentedin Figure 2a and Figure 2b, respectively.
As presented in Figure 2, the gravity influence is eliminated without significant loss of information. Sincethe phone was almost in an ideal vertical position the gravity impact was largest on the X-axis. The HP-filtereddata calculations in Eqs. (1)–(3) were performed for all three axes. Cumulative signals with marked calculateddata are presented in Figure 2c. In the presented data sample’s signal, APEAK_Z is also the maximum detectedvalue for the Z-axis acceleration (MAX_Z) in the decision interval. Maximum values for the X- and Y-axes aredetected from the aPeak sample. All calculated data presented in Figure 2c are presented in Table 1.
According to the calculated results, the vertical (Z) axis had a higher RMS value, while the movingdirection (X) axis and lateral (Y) axis had lower RMS values. The application is improved with sensitivity leveldetermination, as shown in Figure 3.
2822

JOVANOVIĆ et al./Turk J Elec Eng & Comp Sci
0 100 200 300
t [s]
-5
0
5
10
15
acc
[m/s
2]
HP XYZ
0 100 200 300
t [s]
-5
0
5
10
15
acc
[m/s
2]
RAW XYZ
0 100 200 300
t [s]
-5
0
5
acc
[m/s
2]
HP ALL
HP X HP Y HP Z aRMS
max y
a peak
a peak_z, max z
a peak_x
a peak_y
max x
Figure 2. Raw and HP-filtered acceleration data for all three accelerometer axes: a) raw XYZ; b) high pass XYZ; c)decision interval signals for all three axes with marked calculated data.
Table 1. Calculated data.
RMSX RMSY RMSZ ARMS[m/s2] [m/s2] [m/s2] [m/s2]
0.287 0.238 0.401 0.548APEAKX APEAKY APEAKZ APEAK[m/s2] [m/s2] [m/s2] [m/s2]
1.731 0.084 3.846 4.218MAXX MAXY MAXZ Speed[m/s2] [m/s2] [m/s2] [km/h]3.414 1.975 3.845 46.35
2823

JOVANOVIĆ et al./Turk J Elec Eng & Comp Sci
The sensitivity thresholds were determined experimentally in cooperation with medical staff. For example,Category 1 sensitivities include groups I, O, and P; Category 2 includes group G diagnosis; and Category 3includes diagnoses C, D, F, K, and N. Diagnosis groups are as defined by the World Health Organization(International Statistical Classification of Diseases and Related Health Problems (International Classificationof Diseases), 10th Revision - Version: 2010, Vol. 1, 2010).
Figure 3. Sensitivity level.
3.3. Android application usage in patient transport monitoring
The proposed research application presents the usage of an EMS vehicle (type B) in Čačak, Serbia. Theapplication is used for the secondary type of patient transport between Čačak and Belgrade medical institutions.The example of one transport between Čačak and Belgrade is given in Figure 4. For validation, in this researcha completely new route is used: Čačak-Užice. Besides the driver and a patient, two medical staff members arepresent during every transportation to provide necessary medical care if needed. Patients who participated inthe transport had cardiac problems with arrhythmia. For future work it is planned to gather data for differenttypes of medical diseases and also different types of roads. The phone with the installed Android applicationwas attached to the windshield using a phone holder, as presented in Figure 4. This phone position is alsouseful for the driver, who is able to monitor vibration signals plotted on the display and to adjust the drivingstyle accordingly.
Thirty patients from Čačak medical institutions were transported to other medical institutions in Serbiafor necessary medical treatment. Their medical conditions demanded special equipment only present in spe-cialized medical institutions outside of Čačak. During the first five cases, the application was tested in realconditions and the medical staff were trained for its appropriate usage. Others were used for data collectionfor neural network training and testing. The comfort decision interval was set to 10 s. After its expiry, one ofthe medical staff members in consultation with the patient marked the subjective comfort level among comfort-able, medium uncomfortable, and uncomfortable. Calculated data and comfort level were saved to KML andTXT files in the phone’s internal memory. Upon completion of the transportation, XML and TXT files weretransferred from the phone’s memory to a computer for further analysis. The KML file is displayed using theGoogle Earth program, as shown in Figure 4. The marker color presents the 10-s marked comfort level (green
2824
JOVANOVIĆ et al./Turk J Elec Eng & Comp Sci
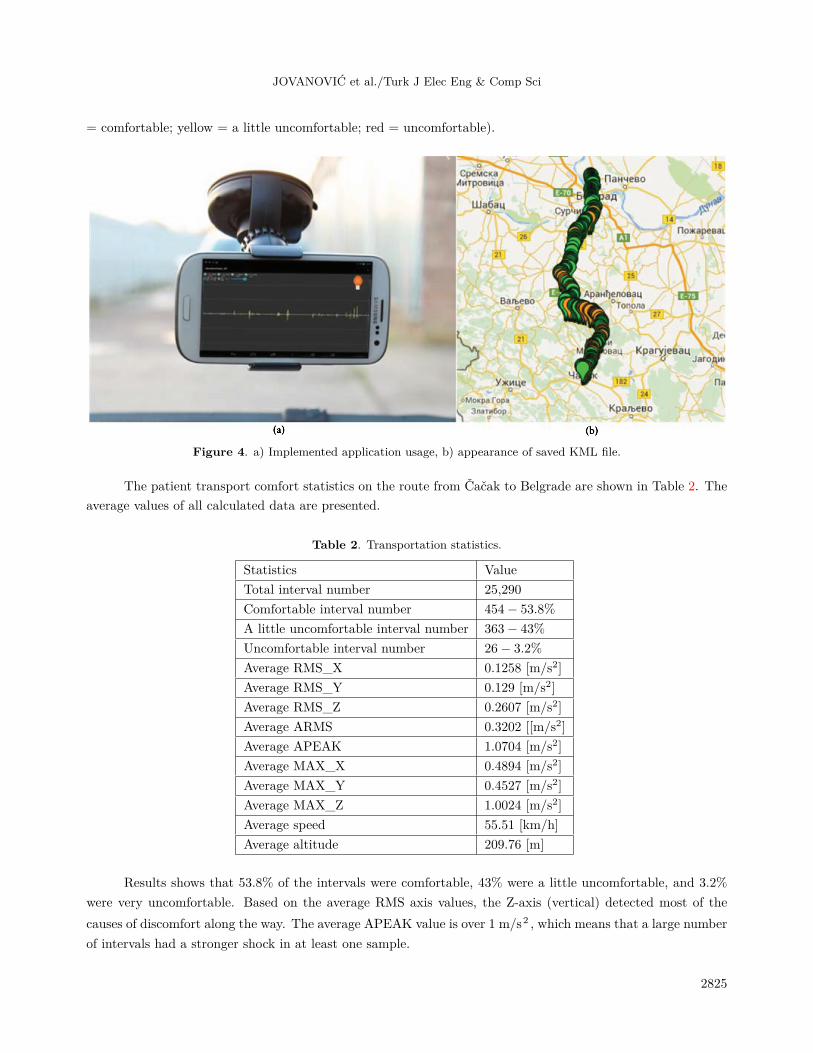
= comfortable; yellow = a little uncomfortable; red = uncomfortable).
Figure 4. a) Implemented application usage, b) appearance of saved KML file.
The patient transport comfort statistics on the route from Čačak to Belgrade are shown in Table 2. Theaverage values of all calculated data are presented.
Table 2. Transportation statistics.
Statistics ValueTotal interval number 25,290Comfortable interval number 454− 53.8%A little uncomfortable interval number 363− 43%Uncomfortable interval number 26− 3.2%Average RMS_X 0.1258 [m/s2]
Average RMS_Y 0.129 [m/s2]
Average RMS_Z 0.2607 [m/s2]
Average ARMS 0.3202 [[m/s2]
Average APEAK 1.0704 [m/s2]
Average MAX_X 0.4894 [m/s2]
Average MAX_Y 0.4527 [m/s2]
Average MAX_Z 1.0024 [m/s2]
Average speed 55.51 [km/h]Average altitude 209.76 [m]
Results shows that 53.8% of the intervals were comfortable, 43% were a little uncomfortable, and 3.2%were very uncomfortable. Based on the average RMS axis values, the Z-axis (vertical) detected most of thecauses of discomfort along the way. The average APEAK value is over 1 m/s2 , which means that a large numberof intervals had a stronger shock in at least one sample.
2825
JOVANOVIĆ et al./Turk J Elec Eng & Comp Sci
3.4. Neural networks: selection of dataThe survey was conducted on one route, Belgrade-Čačak, thirty times. The distance between these two citiesis 150 km. The number of recorded points for thirty transports and the descriptions thereof are given in thecontext of Table 1.
3.4.1. Preprocessing and data transformation:This phase involves solving the problem of incomplete and incorrect data. In this study, incomplete valueswere ignored, because, as stated in [36] and [37], where techniques for solving this problem were compared, thisapproach has proved to be the most appropriate.
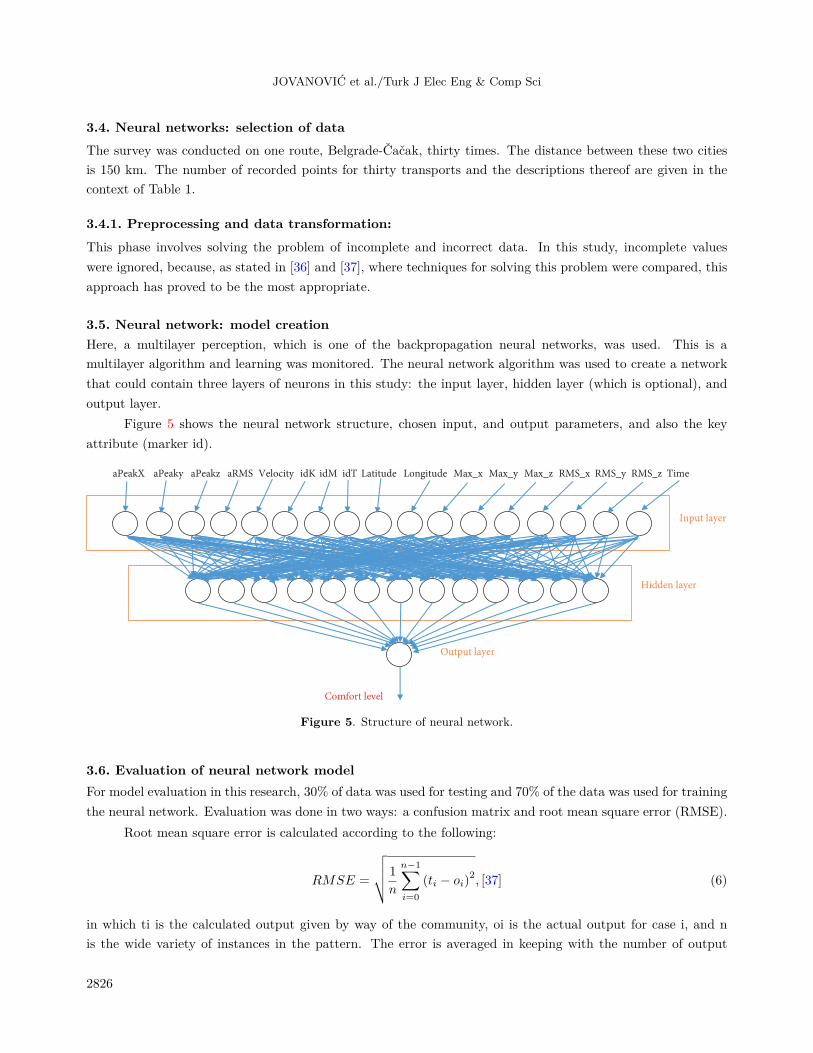
3.5. Neural network: model creationHere, a multilayer perception, which is one of the backpropagation neural networks, was used. This is amultilayer algorithm and learning was monitored. The neural network algorithm was used to create a networkthat could contain three layers of neurons in this study: the input layer, hidden layer (which is optional), andoutput layer.
Figure 5 shows the neural network structure, chosen input, and output parameters, and also the keyattribute (marker id).
aPeakX aPeaky aPeakz aRMS Velocity idK idM idT Latitude Longitude Max_x Max_y Max_z RMS_x RMS_y RMS_z Time
Input layer
Hidden layer
Output layer
Comfort level
Figure 5. Structure of neural network.
3.6. Evaluation of neural network modelFor model evaluation in this research, 30% of data was used for testing and 70% of the data was used for trainingthe neural network. Evaluation was done in two ways: a confusion matrix and root mean square error (RMSE).
Root mean square error is calculated according to the following:
RMSE =
√√√√ 1
n
n−1∑i=0
(ti − oi)2, [37] (6)
in which ti is the calculated output given by way of the community, oi is the actual output for case i, and nis the wide variety of instances in the pattern. The error is averaged in keeping with the number of output
2826

JOVANOVIĆ et al./Turk J Elec Eng & Comp Sci
variables and associated with the variety of instances wherein the pattern is calculated. The confusion matrix[38] is determined between the target class and output class. The diagonal cells in each table display the numberof cases that were labeled correctly, and the off-diagonal cells show the misclassified cases. The blue cell at thebottom right suggests the whole percentage of correctly categorized instances (inexperienced) and the wholepercentage of misclassified cases (in pink). Gray cells numbered 1, 2, and 3 in the fourth row show the popularityaccuracy of comfortable, slightly uncomfortable, and uncomfortable styles, respectively. Gray cells numbered 1,2, and 3 inside the fourth column of the confusion matrices represent the precision or positive predictive value(PPV) and negative predictive value (NPV) of comfortable, slightly uncomfortable, and uncomfortable styles,respectively. The high quality and NPVs are the proportions of positive and negative consequences in confusionchecks, which are true positive and true negative results. Mathematically, the PPV and NPV can be expressedas:
PPV =TP
TP + FP, NPV =
TN
TN + FN, (7)
where TP is the true positive rate, FP is the false positive rate, TN is the true negative rate, and FN is thefalse negative rate. The receiver operating characteristic (ROC) curve is a graphical technique that illustratesthe overall performance of a classification. The curve is created by plotting the actual high quality againstthe false positive rate. In a perfect balance of positive and negative results, the ROC curve is positioned inthe upper left. The training and checking of the classifiers was completed with the use of the pass-validationmethodology. The dataset was divided at random into k distinct units. Training is accomplished on ok-1 setsand the ultimate set is tested. For all of the variable training and check units, this is repeated. Averages of allk effects are the category results.
4. Results and discussionThis section provides the results of evaluation regarding the RMSE and confusion matrix. Results are also givenregarding Data Mining Extension (DMX) queries together with a discussion of the research.
4.1. Results of evaluationThis section provides results related to types of evaluation as described in Section 3.6. The RMSE value in thisresearch is 0.0245. Compared to similar work in [39] and [40], the RMSE has an acceptable value. Figure 6shows the confusion matrix and the ROC curve.
Based on the results for the confusion matrix, we can discuss the following aspects:
• 124 cases were classified correctly as 1, whereas 7 cases were classified incorrectly as 2;
• 97 cases were classified correctly as 2, whereas 9 cases were classified incorrectly as 1 and 6 cases wereclassified incorrectly as 2;
• 6 cases were classified correctly as 3, whereas 3 cases were classified incorrectly as 2.
• The confusion matrix shows that there are no incorrect classifications from states 1 to 3 and vice versa.
ROC analysis was also employed to evaluate the performance of the proposed method in classifyingpatterns into one of three classes. The ROC curve graphs in Figure 6 demonstrate the accuracy rate of patternclassification. In order to predict the accuracy rate of recognition, the graphs are plotted between true positiverates and false positive rates.
2827

JOVANOVIĆ et al./Turk J Elec Eng & Comp Sci
b) False positive rate
0
0.1
0.2
0.3
0.4
0.5
0.6
0.7
0.8
0.9
1
0 0.1 0.2 0.3 0.4 0.5 0.6 0.7 0.8 0.9 1
ROC
Class 1 Class 2 Class 3
Confusion matrix
ssalc t
upt
uO
1
124
49.2%
9
3.6%
0
0.0%
93.2%
6.8%
2
7
2.8%
97
38.5%
3
1.2%
90.7%
9.3%
3
0
0.0%
6
2.4%
6
2.4%
59.1%
40.9%
94.7
5.3%
86.6
13.4%
66.7
33.3%
90.1%
9.9%
1 2 3
a) Target Class
Figure 6. a) Confusion matrix; b) ROC curve.
The classifiers are trained and tested using 10-fold cross-validation to ensure exhaustive testing with allsamples. According to this technique the dataset is divided at random into a set of K = 10 distinct sets. Thentraining is performed on K - 1 sets and the remaining set is tested. This process is repeated for all possible Ktraining and test sets. The classification results are averages of all K results.
4.2. Results: testing neural networks
The testing of neural networks in this research was conducted via DMX query [41]. The aim of using a DMXquery is related to creating queries against the model in order to get the desired results and an answer to theresearch questions is obtained. In this study, the goal was to obtain the predicted probability of access to certainmodules. DMX queries can be created within Microsoft Visual Studio 2008, using a wizard, or queries can bewritten directly within Microsoft SQL Server Management Studio 2008 after the selection of models and typesof queries. We used singleton queries for the predictions. The following is an example of a query:
SELECT [Tacke].[Comfort], Predict ([Comfort])From [Tacke]NATURAL PREDICTION JOIN(SELECT '0.1132' as [aPeak], '0.0657' as [a RMS], '43.8882666' as [Latitude],'20.340825' as [Longitude], '0.115509704' as [Max X], '-0.067291334' as [Max Y],'0.791438103' as [Max Z]) AS t
This anticipated comfort on the basis of entered parameters for Apeak, aRMS , Latitude, Longitude, MaxX, Y Max, and Max Z. Requests allowed us to change input parameters and test values for the user’s needs.As a result, the comfort level was predicted as 0, which represents comfortable transport. Bearing this in mind,the results obtained through testing the neural network can be discussed with regard to the importance of usingDMX queries. The above-mentioned queries can be used successfully for the specific needs of users, listing theselected input parameters and obtaining results from different perspectives in relation to the selected functionprediction.
2828

JOVANOVIĆ et al./Turk J Elec Eng & Comp Sci
4.3. Validation in real usage
For system validation in real usage, another transportation was conducted for Čačak-Užice, Serbia. Thegenerated KML file is shown in Figure 7.
Figure 7. Generated KML file for Čačak-Užice transport.
Every marker comfort level is validated using the presented neural network model. Real usage validationresults are presented using the confusion matrix and ROC curve. Figure 8 shows the generated confusion matrixand the ROC curve.
b) False positive rate
0
0.1
0.2
0.3
0.4
0.5
0.6
0.7
0.8
0.9
1
0 0.1 0.2 0.3 0.4 0.5 0.6 0.7 0.8 0.9 1
ROC
Class 1 Class 3 Class 2
Confusion matrix
Ou
tpu
t c
lass
1
137
49.1%
3
1.1%
0
0.0%
97.9%
2.1%
2
16
5.7%
98
35.1%
3
1.1%
83.8%
16.2%
3
0
0.0%
9
3.2%
13
4.7%
59.1%
40.9%
89.5
10.5%
89.1
10.9%
81.3
18.8%
88.9%
11.1%
1 2 3
a) Target Class
Figure 8. The confusion matrix (a) and ROC curve (b) for Čačak-Užice.
As presented in Figure 7, overall precision is 88.9% which is 1.2% less than the results presented inFigure 5.
2829
JOVANOVIĆ et al./Turk J Elec Eng & Comp Sci
These results are satisfying since the measurement was conducted on a new route that was not used forthe neural network training.
5. ConclusionWe can draw conclusions in several areas:
• Analysis of comfort in the transport of patients:According to the results, comfort levels can be estimated with satisfactory accuracy. The proposedapproach highlights the potential to use the prediction algorithm in emerging and rapidly developingtechnologies. The evaluation results indicate acceptable accuracy and give the possibility to apply thesame model to the next patient transport. The results enable further work on determining the transport’simpact on the patient’s medical condition. In this paper we analyzed the transportation of patients withone type of medical problem (cardiac problems). As future work, we plan to analyze other types ofmedical problems and include them as additional input values in the neural network. Then the neuralnetwork could be trained to predict comfort levels according to patients’ medical problems and transportparameters.
• Android applications:After examining the results obtained by the created Android application we can conclude the advantagesand disadvantages of the application. The created application is mobile and simple to install and use.The limitations of the application are real-time neural network predictions, which are implemented offline.Future work will address real-time neural network implementation.
• Applying neural networks in predicting patient comfort during transport:Neural networks, based on the presented results, can be used successfully to predict patient comfort duringtransport. The created model gave satisfying accuracy and could be applied for future patient transport.Future work in the field of neural networks relates to the creation of Web-based applications that receiveinput data and, as a result, provide the comfort level and driving style recommendations.
AcknowledgmentsThe work presented in this paper was funded by Grant No. TR32043 and III44006 for the period of 2011-2019from the Ministry of Education and Science of the Republic of Serbia.
References
[1] Griffin M. Handbook of Human Vibration. London, UK: Elsevier Academic Press, 1996.
[2] ISO. Standard by Technical Committee ISO/TC 108/SC 4. Human Exposure to Mechanical Vibration and Shock,ISO 2631-1 Mechanical Vibration and Shock - Evaluation of Human Exposure to Whole-Body Vibration - Part 1:General Requirements. Geneva, Switzerland: ISO, 1997.
[3] Coats T, Davies G. Prehospital care for road traffic casualties. British Medical Journal 2002; 324 (7346): 1135.
[4] Gray A. Secondary transport of the critically ill and injured adult. Emerging Medicine Journal 2004; 21 (3): 281-285.
[5] British Standards Institution. British-Adopted European Standard. BS EN 1789:2007+A2:2014: Medical Vehiclesand their Equipment - Road Ambulances. London, UK: BSI, 2014.
[6] Ferreira J, Hignett S. Reviewing ambulance design for clinical efficiency and paramedic safety. Application Er-gonomics 2005; 36 (1): 97-105.
2830
JOVANOVIĆ et al./Turk J Elec Eng & Comp Sci
[7] Ferdinande P. Recommendations for intra-hospital transport of the severely head injured patient. Intensive CareMedicine 1999; 25 (12): 1441-1443.
[8] Theodore N, Aarabi B, Dhall S, Gelb DE, Hurlbert RJ. Transportation of patients with acute traumatic cervicalspine injuries. Neurosurgery 2013; 72 (Suppl. 2): 35-39.
[9] Jovanovic Z, Bacevac R, Markovic R. Information system for the centralized display of the transport comfortinformation. Facta Universitatis Series Electronics and Energetics 2017; 30 (4): 5547-5570.
[10] Paschold H, Mayton A. Whole-body vibration: building awareness in SH&E. Professional Safety 2011; 56 (4): 30.
[11] BSI. Standard BS 6841, Guide to Measurement and Evaluation of Human Exposure to Whole-Body MechanicalVibration and Repeated Shock. London, UK: BSI, 1987.
[12] American National Standards Institute. ASA S2.72-2002/Part 1 / ISO 2631-1:1997 (R2012). Washington, DC, USA;American National Standards Institute, 2002.
[13] European Union. Directive 2002/44/EC, Vibration - Safety and Health at Work - EU-OSHA. Brussels, Belgium:EU, 2002.
[14] HSE. The Control of Vibration at Work Regulations. Guidance on Regulations (L140), 104. London, UK: HSE,2005.
[15] Dickey J, Oliver M, Boileau P. Multi-axis sinusoidal whole-body vibrations: Part I - How long should the vibrationand rest exposures be for reliable discomfort measures? Journal of Low Frequency Noise Vibration and ActiveControl 2006; 25 (3): 175-184.
[16] Dickey J, Eger T, Oliver M. Multi-axis sinusoidal whole-body vibrations: Part II - Relationship between vibrationtotal value and discomfort varies between vibration axes. Journal of Low Frequency Noise Vibration and ActiveControl 2009; 26 (3): 195-204.
[17] Cuadrado J, Dopico D, Perez J. Automotive observers based on multibody models and the extended Kalman filter.Multibody System Dynamics 2012; 27 (1): 3-19.
[18] Lee J, Park E, Robinovitch S. Estimation of attitude and external acceleration using inertial sensor measurementduring various dynamic conditions. IEEE Transactions Instruments Measurements 2012; 61 (8): 2262-2273.
[19] Blanco-Claraco J, Torres-Moreno J, Giménez-Fernández A. Multibody dynamic systems as Bayesian networks:applications to robust state estimation of mechanisms. Multibody System Dynamics 2015; 34 (2): 103-128.
[20] Eriksson J, Girod L, Hull B. The pothole patrol: using a mobile sensor network for road surface monitoring. In:Proceedings of the 6th International Conference; Breckenridge, CO, USA; June 2008. pp. 29-39.
[21] Shaw R, Steinberg, D, Bonnet J. Mobile health devices: will patients actually use them? Journal of the AmericanMedical Informatics Association 2006; 23 (3): 462-466.
[22] Mednis A, Strazdins G, Zviedris R, Kanonirs G, Selavo L. Real time pothole detection using Android smartphoneswith accelerometers. In: International Conference on Distributed Computing in Sensor Systems and Workshops;Ottawa,Canada; 2011. doi: http://dx.doi.org/10.1155/2015/869627
[23] Mohan P, Padmanabhan V, Ramjee R. TrafficSense? Rich monitoring of road and traffic conditions using mobilesmartphones. In: 6th ACM Conference on Embedded Networked Sensory System; Rayleigh, NC, USA; 2008. pp.1-29.
[24] Plewa K, Eger T, Oliver M. Comparison between ISO 2631-1 comfort prediction equations and self-reported comfortvalues during occupational exposure to whole-body vehicular vibration. Journal of Low Frequency Noise, Vibrationand Active Control 2012; 31 (1): 43-53.
[25] Grenier S, Eger T, Dickey J. Predicting discomfort scores reported by LHD operators using whole-body vibrationexposure values and musculoskeletal pain scores. Work 2010; 35 (1): 49-62.
[26] Tüchsen F, Feveile H, Christensen K, Krause N. The impact of self-reported exposure to whole-body-vibrations onthe risk of disability pension among men: a 15 year prospective study. BMC Public Health 2010; 10: 305.
2831

JOVANOVIĆ et al./Turk J Elec Eng & Comp Sci
[27] Ayari H, Thomas M, Dor S. A design of experiments for statistically predicting risk of adverse health effects ondrivers exposed to vertical vibrations. International Journal of Occupational Safety and Ergonomics 2011; 17 (3):221-232.
[28] Munish P, Yashwant P, Vijau S, Tipparaju S, Moreno W. Artificial Neural Network for Drug Design, Delivery andDisposition. Amsterdam, the Netherlands: Academic Press, 2015.
[29] Massie D, White K, Daly S. Application of neural networks to predict ice jam occurrence. Cold Regions Scienceand Technology 2002; 35 (2): 115-122.
[30] Karlaftis M, Vlahogianni E. Statistical methods versus neural networks in transportation research: differences,similarities and some insights. Transportation Research Part C: Emerging Technologies 2011; 19 (3): 387-399.
[31] Garrido C, De Oña R, De Oña J. Neural networks for analyzing service quality in public transportation. ExpertSystems and Applications 2014; 41 (15): 6830-6838.
[32] Xiao G, Juan Z, Zhang C. Travel mode detection based on GPS track data and Bayesian networks. Computers,Environment and Urban Systems 2015; 54: 14-22.
[33] Osaba E, Onieva E, Moreno A. Decentralised intelligent transport system with distributed intelligence based onclassification techniques. IET Intelligent Transportation Systems 2016; 10 (10): 674-682.
[34] Jovanovic Z, Bacevic R, Markovic R. Android application for observing data streams from built-in sensors usingRxJava. In: 2015 23rd Telecommunications Forum; Belgrade, Serbia; 2015. pp. 918-921.
[35] Christensen B, Nurkiewitz T. Reactive Programming with RxJava. Sebastopol, CA, USA: O’Reilly Media, 2016.
[36] Grzymala-Busse J, Hu M. A comparison of several approaches to missing attribute values in data mining. In:International Conference on Rough Sets and Current Trends in Computing; Canada; 2000. pp. 378-385.
[37] Harper G. Viability of artificial neural networks in mobile healthcare. PhD, Goteburg University, Oulu, Finland,2011.
[38] Kohavi R, Provost F. Glossary of terms special issue on applications of machine learning and the knowledge discoveryprocess. Machine Learning 1998; 30 (2/3): 271-274.
[39] Chukwu A, Nwachukwu S. Analysis of some meteorological parameters using artificial neural network method forMakurdi, Nigeria. African Journal of Environmental Science and Technology 2012; 6 (3): 182-188.
[40] Senkal S, Ozgonenel O. Performance analysis of artificial and wavelet neural networks for short term wind speedprediction. In: 8th International Conference on Electrical and Electronics Engineering; Bursa, Turkey; 2013. pp.196-198.
[41] Blokduk G. Data Mining Extensions. Brisbane, Australia: Emereo Pty. Ltd., 2018.
2832