patients at risk: new insights into acute blood pressure ...casecag.com/htn_final coreslides...
TRANSCRIPT
Patients at Risk:
New Insights Into Acute Blood Pressure Management
Edwin G. Avery IV, MD, CPI
Chief, Division of Cardiac Anesthesia
Associate Professor of Anesthesiology
Harrington-McLaughlin Heart and Vascular Institute
University Hospitals Case Medical Center
Case Western Reserve University School of Medicine
DISCLOSURES
The Medicines Company: funded research,
speaker’s bureau, advisory board
Cubist Pharmaceuticals: funded research,
advisory board
Covidien: funded research
Educational Initiative Learning Objectives
– Upon completion of this activity, participants should be able to:
• Identify the patients at risk for complications due to inadequate BP management
• Understand the evidence for BP management affecting outcomes
in the acute care setting
• Discuss the evolving treatment paradigm for BP management in the surgical and non-surgical patient
• Discuss how different patient conditions affect the treatment of acute BP.

ACKNOWLEDGEMENTS:
Sol Aronson, MD - Duke
Mac Dyke, MD - Houston
Jerrold Levy, MD - Emory
Alan Multz, MD - LIJ
Ed Avery - UHCMC
Al Cheung, MD - UPENN
Stan Shernan, MD - BWH
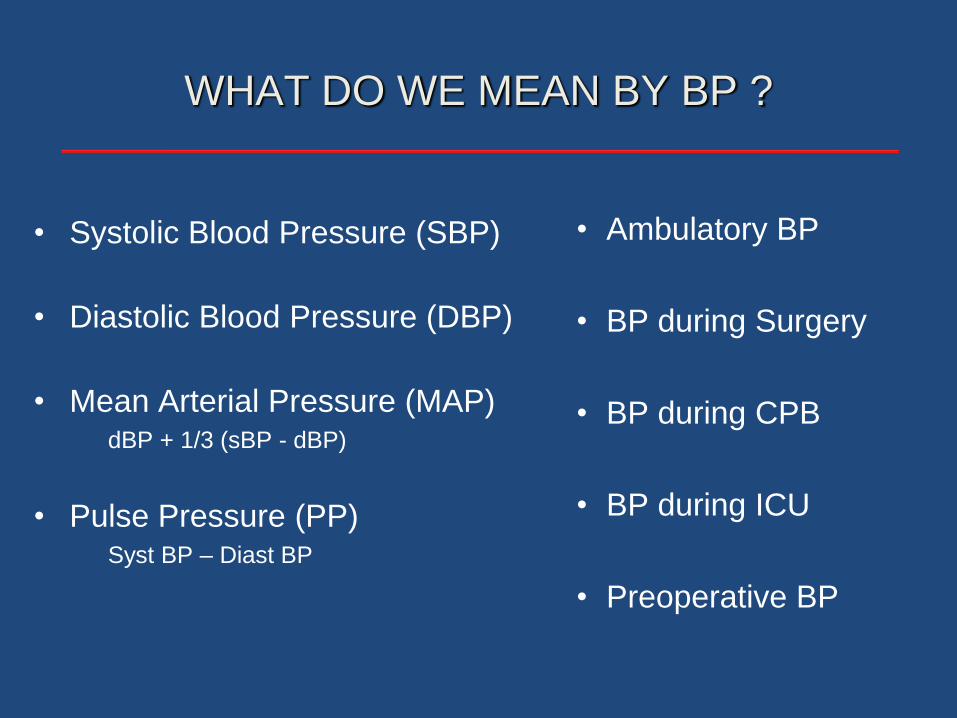
WHAT DO WE MEAN BY BP ?
• Ambulatory BP
• BP during Surgery
• BP during CPB
• BP during ICU
• Preoperative BP
• Systolic Blood Pressure (SBP)
• Diastolic Blood Pressure (DBP)
• Mean Arterial Pressure (MAP)dBP + 1/3 (sBP - dBP)
• Pulse Pressure (PP)Syst BP – Diast BP

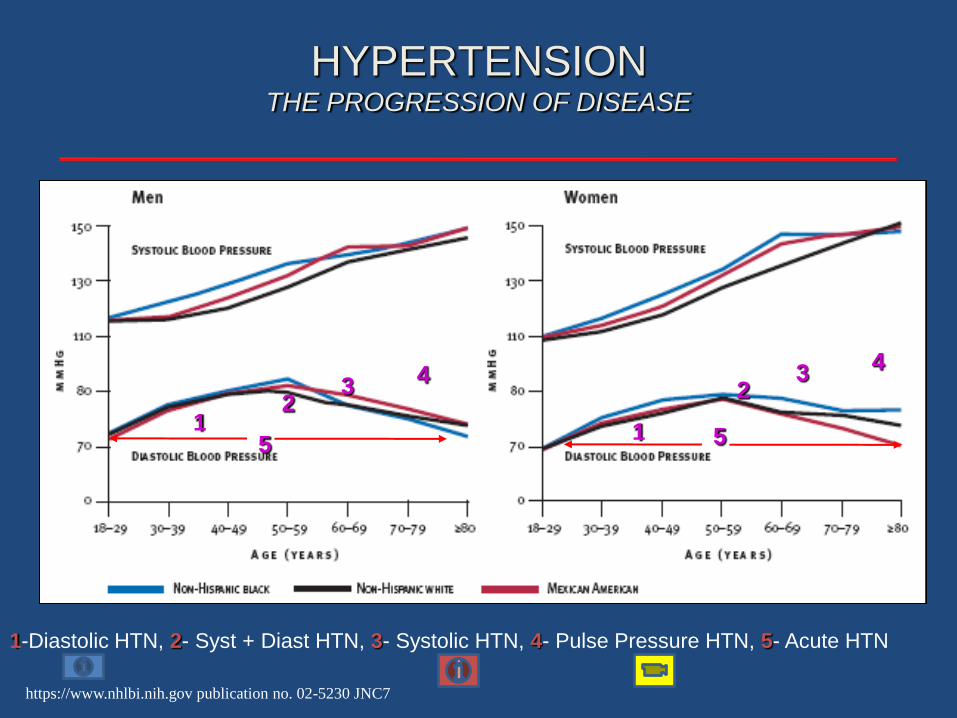
https://www.nhlbi.nih.gov publication no. 02-5230 JNC7
JNC 7 ON PREVENTION, DETECTION,
EVALUATION & TREATMENT OF HIGH BP
Classification of Blood Pressure for Adults
Blood Pressure
Classification
SBP
mmHg
DBP
mmHg
Normal <120 and <80
Pre-hypertension 120-139 or 80-89
Stage 1 hypertension 140-159 or 90-99
Stage 2 hypertension ≥160 or ≥100
JNC - Joint National Committee on the Prevention, Detection, Evaluation, and Treatment of High Blood Pressure

Chronic
Hypertension
Hypertension
Emergencies
HYPERTENSION: CLINICAL CONTEXT
Renovascular- e.g. renal artery stenosis
- renal parenchymal disease
Essential-Diastolic hypertension
-Systolic hypertension
Metabolic- e.g. pheochromocytoma

HYPERTENSIVE EMERGENCIES
• Acute cerebrovascular syndromes
– subarachnoid hemorrhage
– cerebral bleeding
– cerebral infarction
• Acute coronary syndromes
• Acute Decompensated Heart failure
• Aortic dissection
• Hypertensive encephalopathy
Mansoor GA, Frishman WH. Heart Dis. 2002;4:358-371.
Varon J, Marik PE. Chest. 2000;118:214-227.
Brain
Stroke
Hypertensive encephalopathy
Retina
Hemorrhages
Exudates
Papilledema
Cardiovascular System
Unstable angina
Acute heart failure
Acute MI
Dissecting aortic aneurysm
Kidney
Hematuria
Proteinuria
Decreasing renal function
End-Organ Damage in
Hypertension Emergencies:
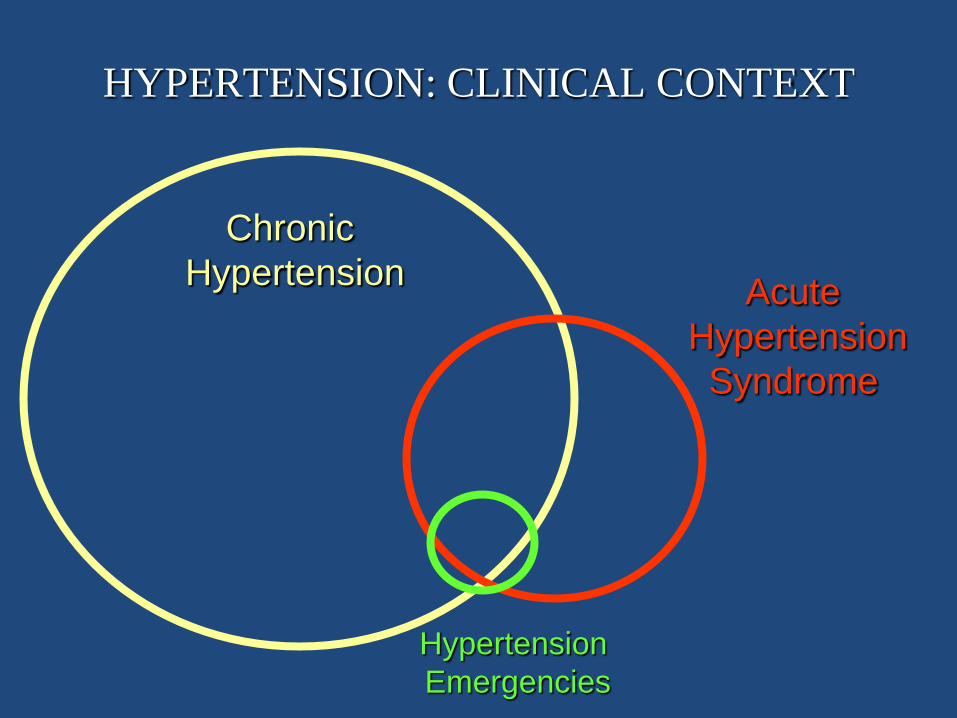
Chronic
Hypertension
Hypertension
Emergencies
Acute
Hypertension
Syndrome
HYPERTENSION: CLINICAL CONTEXT
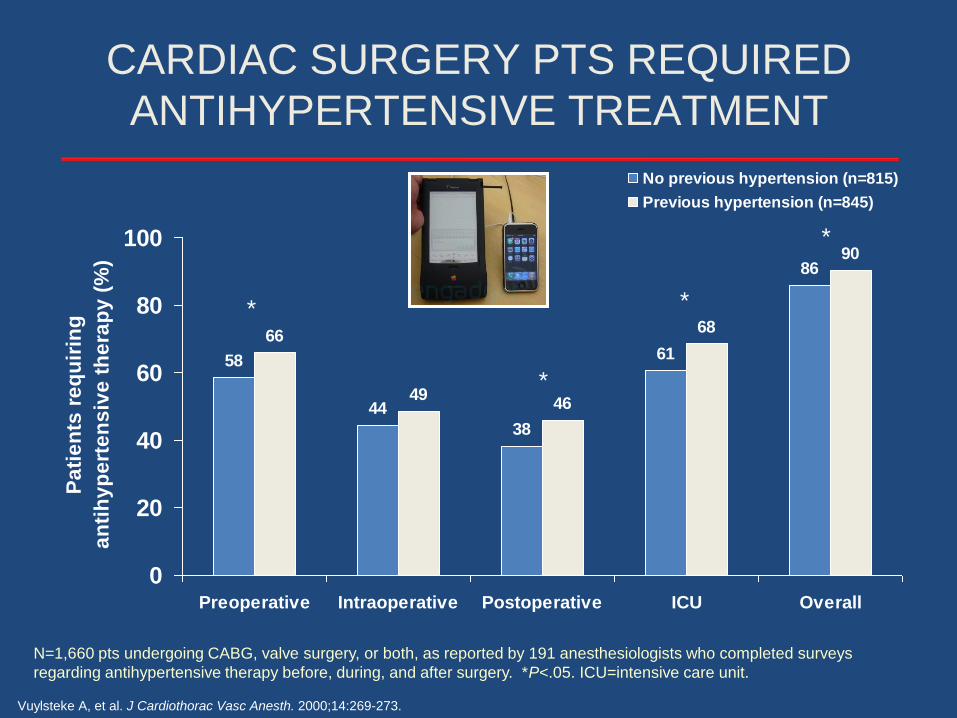
CARDIAC SURGERY PTS REQUIRED
ANTIHYPERTENSIVE TREATMENT
Vuylsteke A, et al. J Cardiothorac Vasc Anesth. 2000;14:269-273.
N=1,660 pts undergoing CABG, valve surgery, or both, as reported by 191 anesthesiologists who completed surveys
regarding antihypertensive therapy before, during, and after surgery. *P<.05. ICU=intensive care unit.
58
44
38
61
86
66
4946
68
90
0
20
40
60
80
100
Preoperative Intraoperative Postoperative ICU Overall
Pa
tie
nts
re
qu
irin
g
an
tih
yp
ert
en
siv
e t
he
rap
y (
%)
No previous hypertension (n=815)
Previous hypertension (n=845)
*
*
*
*
https://www.nhlbi.nih.gov publication no. 02-5230 JNC7
HYPERTENSIONTHE PROGRESSION OF DISEASE
1-Diastolic HTN, 2- Syst + Diast HTN, 3- Systolic HTN, 4- Pulse Pressure HTN, 5- Acute HTN
1
32
4
51
32
4
5
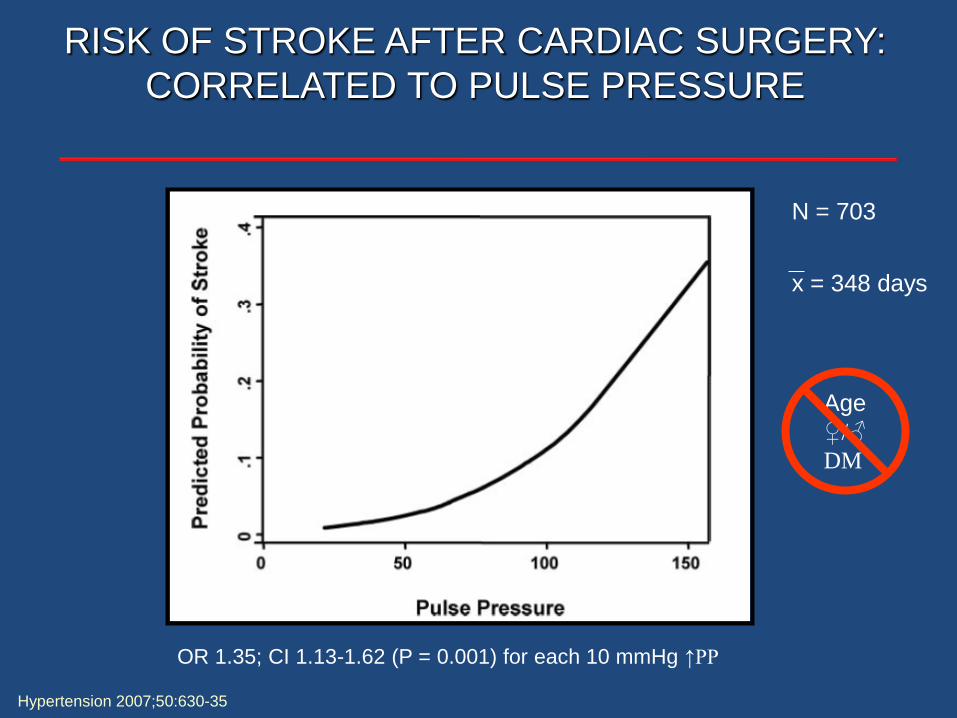
RISK OF STROKE AFTER CARDIAC SURGERY:
CORRELATED TO PULSE PRESSURE
Hypertension 2007;50:630-35
OR 1.35; CI 1.13-1.62 (P = 0.001) for each 10 mmHg ↑PP
N = 703
x = 348 days
Age
♀/♂
DM
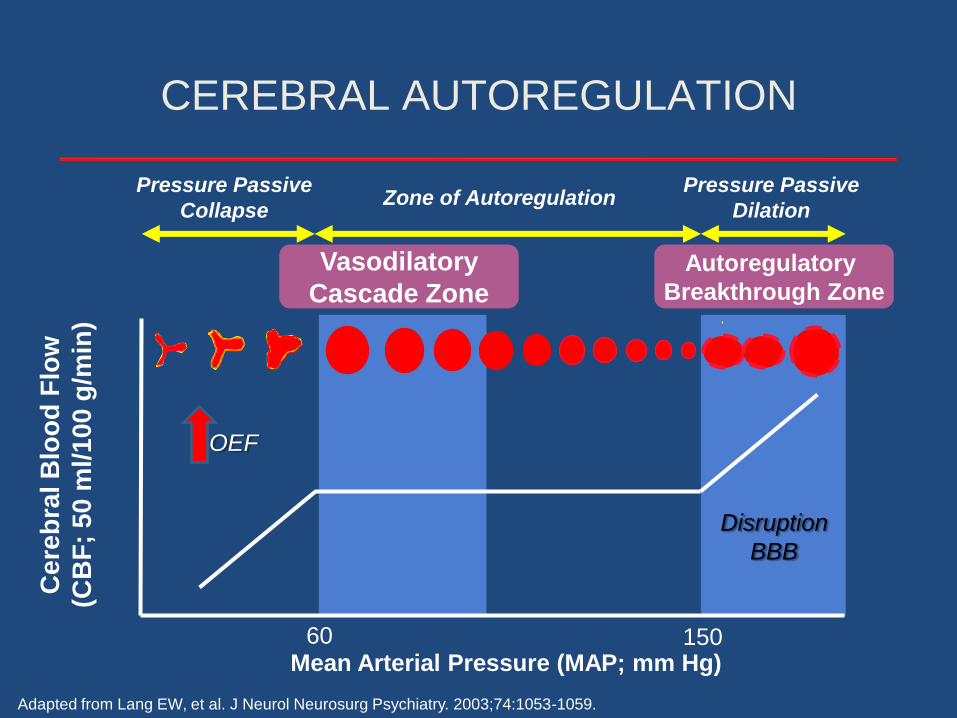
CEREBRAL AUTOREGULATION
Zone of Autoregulation
Ce
reb
ral B
loo
d F
low
(CB
F;
50
ml/1
00
g/m
in)
Mean Arterial Pressure (MAP; mm Hg)
Pressure Passive
Collapse
Pressure Passive
Dilation
Adapted from Lang EW, et al. J Neurol Neurosurg Psychiatry. 2003;74:1053-1059.
Autoregulatory
Breakthrough Zone
Vasodilatory
Cascade Zone
60 150
OEF
Disruption
BBB

Neurocritical Care 2004; 3: 287-300
CEREBRAL VASCULAR
AUTOREGULATION
Traumatic Brain Injury
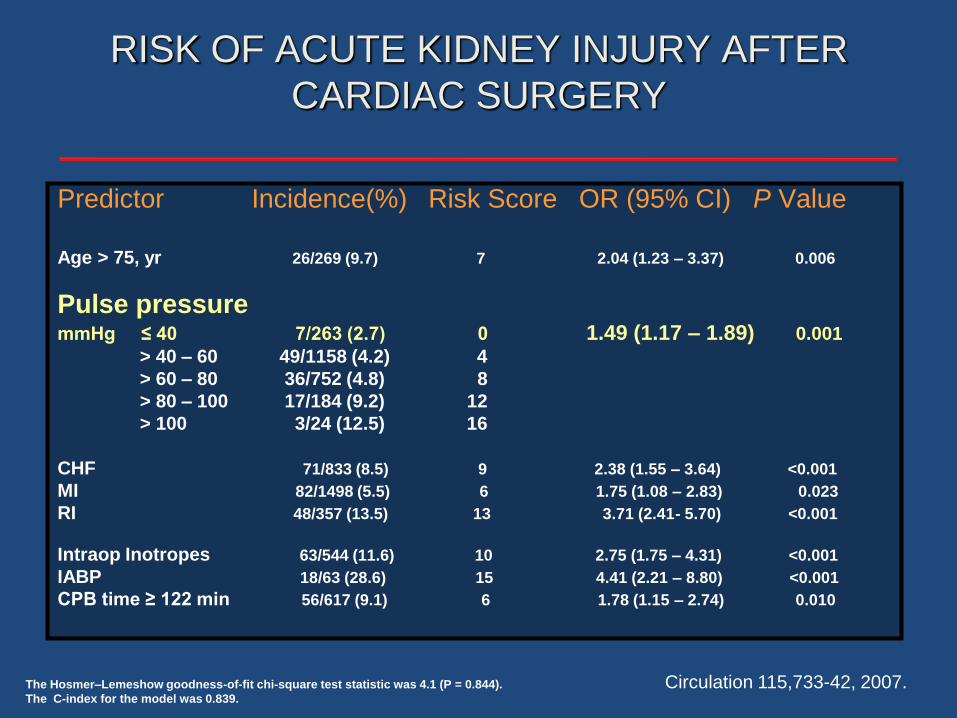
RISK OF ACUTE KIDNEY INJURY AFTER
CARDIAC SURGERY
Predictor Incidence(%) Risk Score OR (95% CI) P Value
Age > 75, yr 26/269 (9.7) 7 2.04 (1.23 – 3.37) 0.006
Pulse pressuremmHg ≤ 40 7/263 (2.7) 0 1.49 (1.17 – 1.89) 0.001
> 40 – 60 49/1158 (4.2) 4
> 60 – 80 36/752 (4.8) 8
> 80 – 100 17/184 (9.2) 12
> 100 3/24 (12.5) 16
CHF 71/833 (8.5) 9 2.38 (1.55 – 3.64) <0.001
MI 82/1498 (5.5) 6 1.75 (1.08 – 2.83) 0.023
RI 48/357 (13.5) 13 3.71 (2.41- 5.70) <0.001
Intraop Inotropes 63/544 (11.6) 10 2.75 (1.75 – 4.31) <0.001
IABP 18/63 (28.6) 15 4.41 (2.21 – 8.80) <0.001
CPB time ≥ 122 min 56/617 (9.1) 6 1.78 (1.15 – 2.74) 0.010
The Hosmer–Lemeshow goodness-of-fit chi-square test statistic was 4.1 (P = 0.844).
The C-index for the model was 0.839.
Circulation 115,733-42, 2007.

N Engl J Med 2007;357:797-805.
RENAL VASCULAR AUTOREGULATION
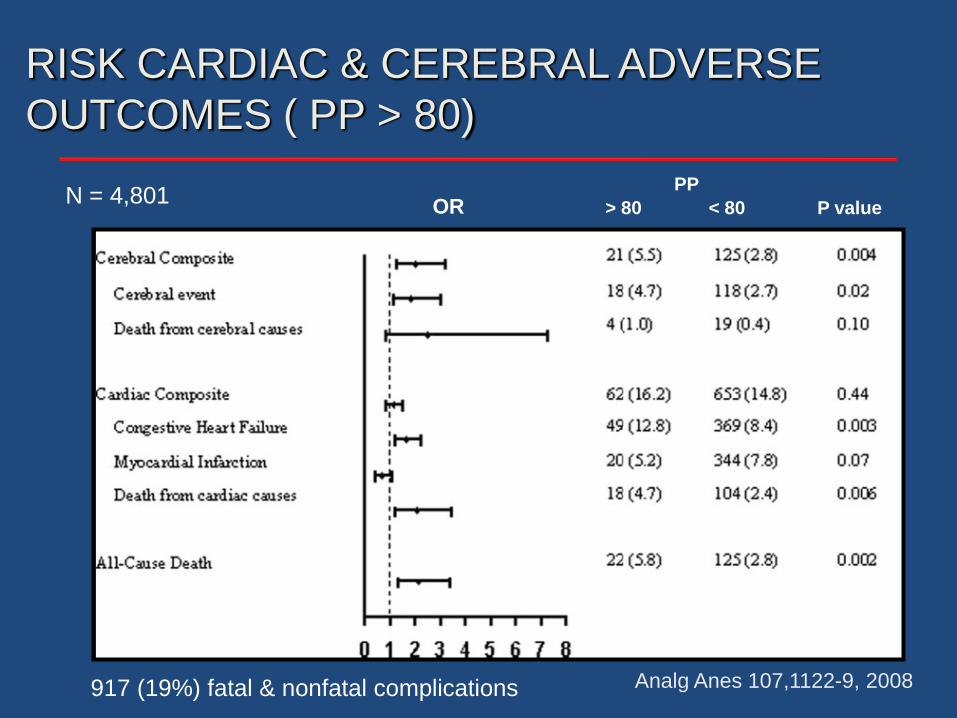
OR P value> 80 < 80
PP
RISK CARDIAC & CEREBRAL ADVERSE
OUTCOMES ( PP > 80)
Analg Anes 107,1122-9, 2008
N = 4,801
917 (19%) fatal & nonfatal complications
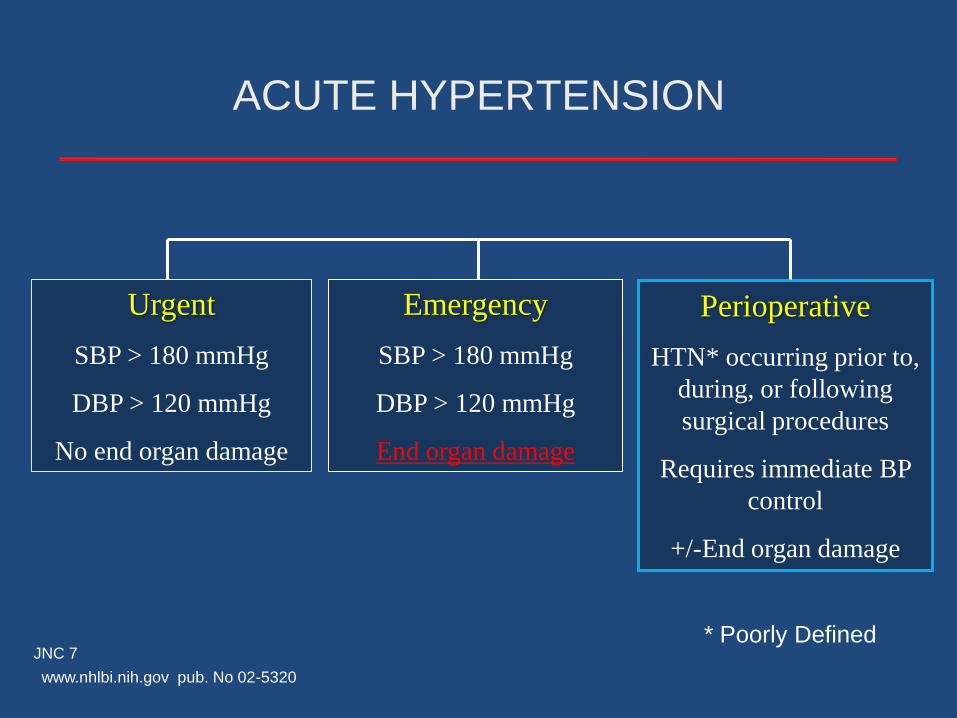
Urgent
SBP > 180 mmHg
DBP > 120 mmHg
No end organ damage
Emergency
SBP > 180 mmHg
DBP > 120 mmHg
End organ damage
Perioperative
HTN* occurring prior to,
during, or following
surgical procedures
Requires immediate BP
control
+/-End organ damage
ACUTE HYPERTENSION
JNC 7
www.nhlbi.nih.gov pub. No 02-5320
* Poorly Defined

Acute Hypertension
Small artery
Physiology:
exch
ange3
d.c
om

ACUTE HYPERTENSION
Pathophysiology: Endothelium
Smooth Muscle
= Nitric Oxide & Prostacyclin
= Norepinephrine
= Angiotension II
= Endothelin 1
= Aldosterone
= Vasopressin
= Thromboxane
Shear Stress
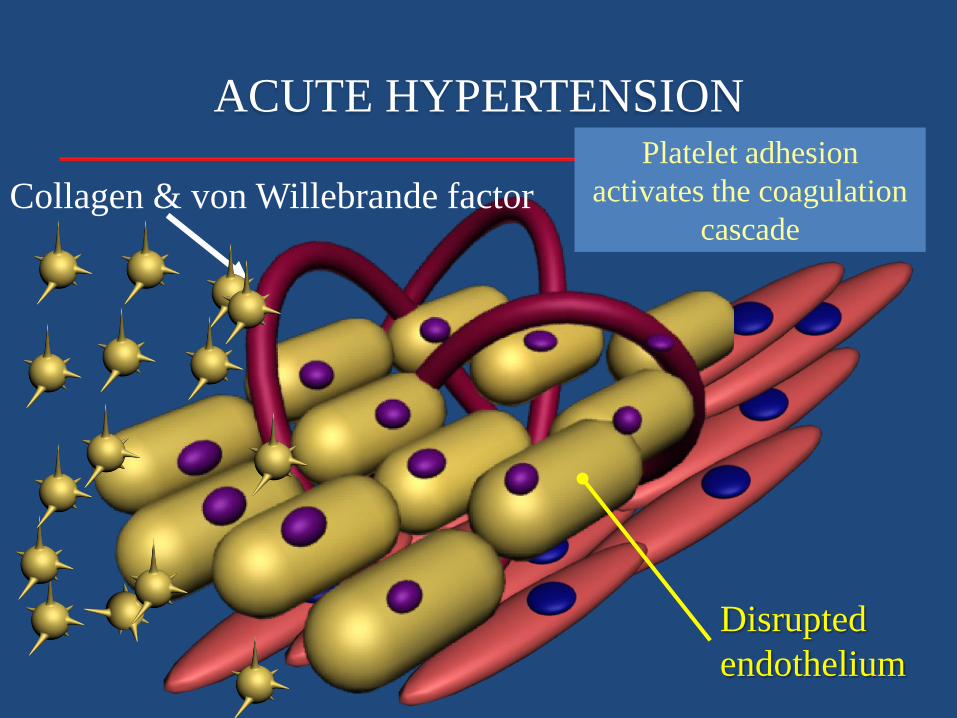
ACUTE HYPERTENSION
Collagen & von Willebrande factor
Disrupted
endothelium
Platelet adhesion
activates the coagulation
cascade
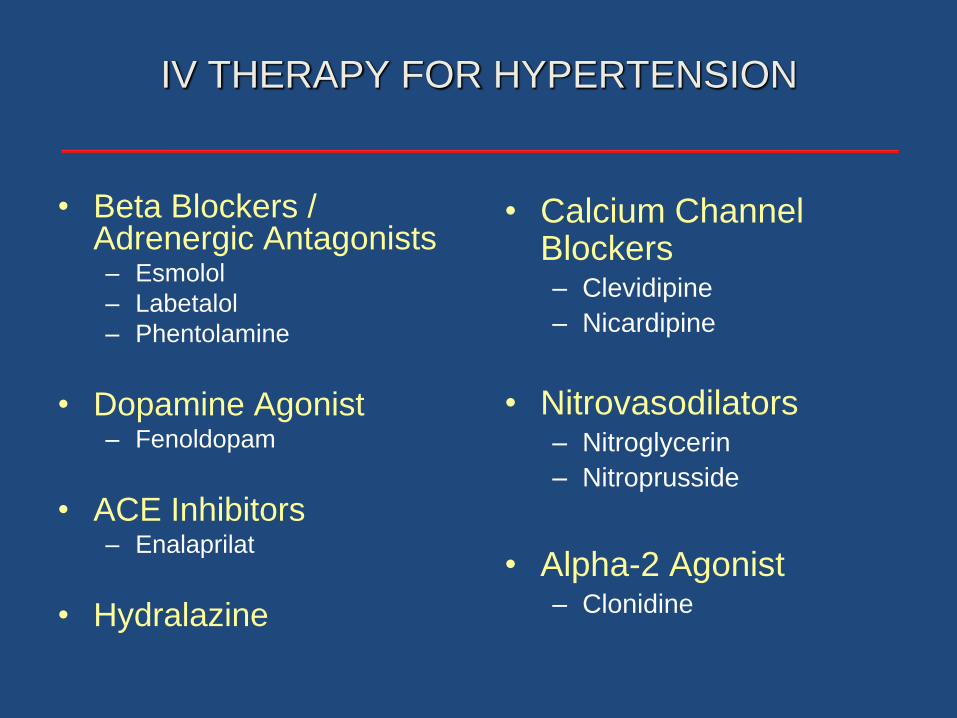
IV THERAPY FOR HYPERTENSION
• Beta Blockers / Adrenergic Antagonists– Esmolol
– Labetalol
– Phentolamine
• Dopamine Agonist– Fenoldopam
• ACE Inhibitors– Enalaprilat
• Hydralazine
• Calcium Channel Blockers– Clevidipine
– Nicardipine
• Nitrovasodilators– Nitroglycerin
– Nitroprusside
• Alpha-2 Agonist– Clonidine

Nitroglycerin Sodium Nitroprusside
Administration Continuous infusion Continuous infusion
Onset 2-5 min. 30 sec
Offset 5-10 min. 1-2 min.
Metabolism Generation of NO Release of CN, then NO
HR ++ ++
SVR Decreased Decreased
Cardiac output +/- +/-
Contraindications Hypovolemia Hypovolemia
NITROVASODILATORS
Bates JN: Biochem Pharmacol 1991; 42 Suppl: S157-65; Bates JN Basic Res Cardiol 1991; 86 Suppl 2: 17-26; Harrison DG,
Bates JN: Circulation 1993; 87: 1461-7; Kurz MA. Circ Res 1991; 68: 847-55
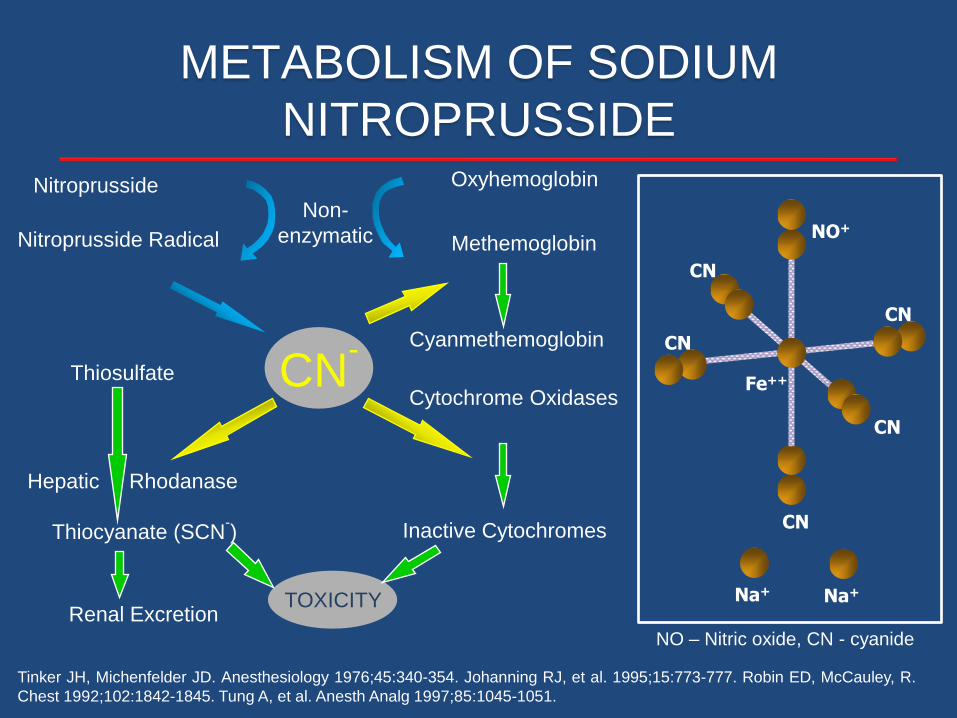
Tinker JH, Michenfelder JD. Anesthesiology 1976;45:340-354. Johanning RJ, et al. 1995;15:773-777. Robin ED, McCauley, R.
Chest 1992;102:1842-1845. Tung A, et al. Anesth Analg 1997;85:1045-1051.
Thiocyanate (SCN-)
Thiosulfate
Renal Excretion
Cytochrome Oxidases
Inactive Cytochromes
CN-
TOXICITY
Hepatic Rhodanase
Nitroprusside
Nitroprusside Radical
Oxyhemoglobin
Methemoglobin
Non-
enzymatic
Cyanmethemoglobin
METABOLISM OF SODIUM
NITROPRUSSIDE
Na+
CN
NO+
CN
Fe++
CN
CN
CN
Na+
NO – Nitric oxide, CN - cyanide
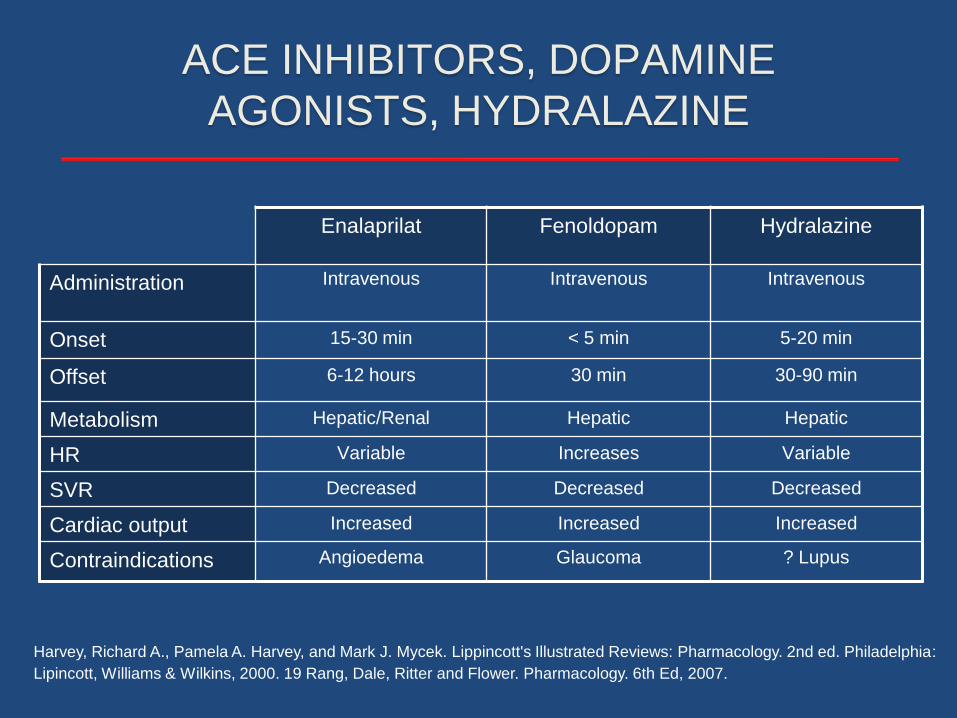
ACE INHIBITORS, DOPAMINE
AGONISTS, HYDRALAZINE
Enalaprilat Fenoldopam Hydralazine
Administration Intravenous Intravenous Intravenous
Onset 15-30 min < 5 min 5-20 min
Offset 6-12 hours 30 min 30-90 min
Metabolism Hepatic/Renal Hepatic Hepatic
HR Variable Increases Variable
SVR Decreased Decreased Decreased
Cardiac output Increased Increased Increased
Contraindications Angioedema Glaucoma ? Lupus
Harvey, Richard A., Pamela A. Harvey, and Mark J. Mycek. Lippincott's Illustrated Reviews: Pharmacology. 2nd ed. Philadelphia:
Lipincott, Williams & Wilkins, 2000. 19 Rang, Dale, Ritter and Flower. Pharmacology. 6th Ed, 2007.
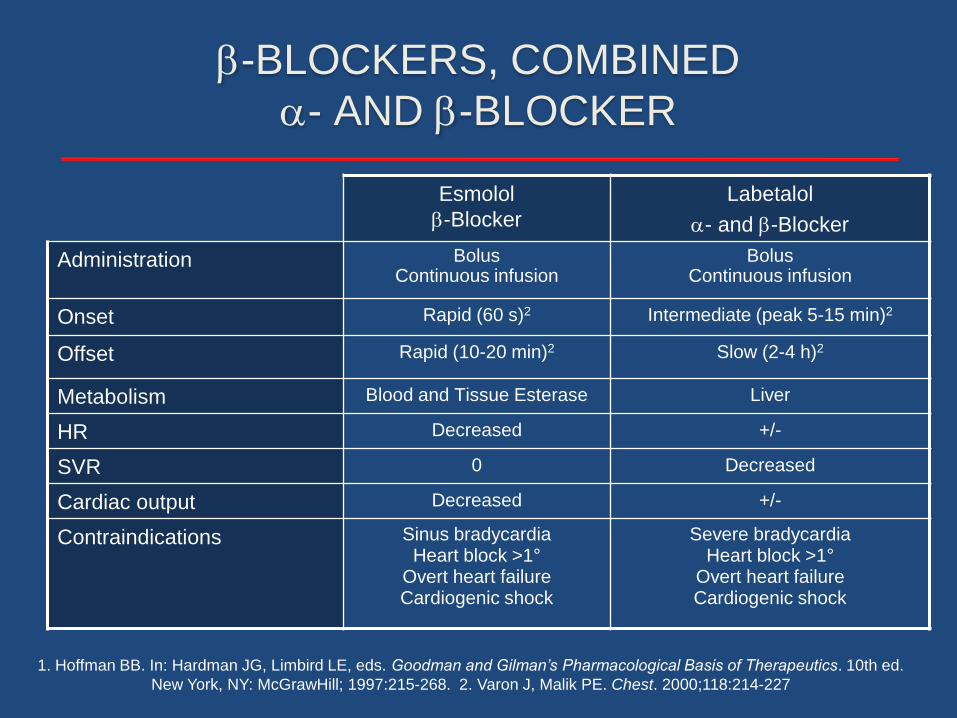
-BLOCKERS, COMBINED
- AND -BLOCKER
Esmolol
-Blocker
Labetalol
- and -Blocker
Administration BolusContinuous infusion
BolusContinuous infusion
Onset Rapid (60 s)2 Intermediate (peak 5-15 min)2
Offset Rapid (10-20 min)2 Slow (2-4 h)2
Metabolism Blood and Tissue Esterase Liver
HR Decreased +/-
SVR 0 Decreased
Cardiac output Decreased +/-
Contraindications Sinus bradycardiaHeart block >1°
Overt heart failureCardiogenic shock
Severe bradycardiaHeart block >1°
Overt heart failureCardiogenic shock
1. Hoffman BB. In: Hardman JG, Limbird LE, eds. Goodman and Gilman’s Pharmacological Basis of Therapeutics. 10th ed.
New York, NY: McGrawHill; 1997:215-268. 2. Varon J, Malik PE. Chest. 2000;118:214-227

Nicardipine Clevidipine
Administration Continuous infusion Continuous infusion
Onset 5-10 min 2-4 min
Offset Hours
Dose Dependent
5-15 min
Non Dose Dependent
Metabolism Liver Blood & Tissue Esterase
HR + +
SVR Decreased Decreased
Cardiac output +++ +++
Contraindications Impaired liver function or portal hypertension; severe
aortic stenosis
Allergy to soy or eggs, defective lipid metabolism, severe aortic
stenosis
DIHYDROPYRIDINE CALCIUM CHANNEL
BLOCKERS
Kenyon KW: Ann Pharmacother 2009; 43: 1258-65; Aronson S: Expert Rev Cardiovasc Ther 2009; 7: 465-72;
Noviawaty IExpert Opin Pharmacother 2008; 9: 2519-29

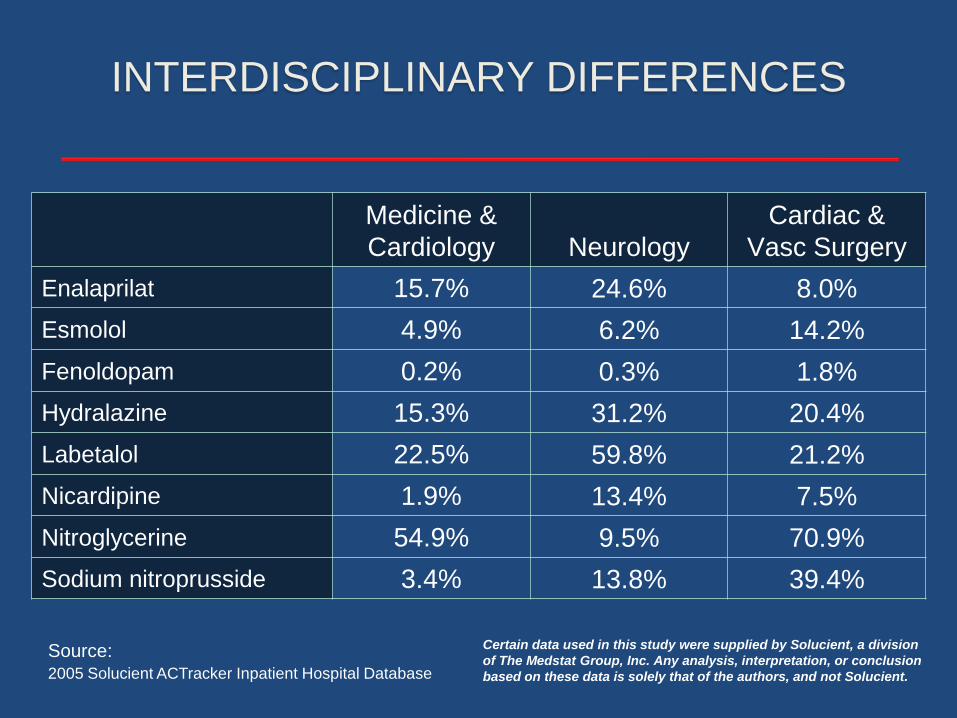
INTERDISCIPLINARY DIFFERENCES
Source: 2005 Solucient ACTracker Inpatient Hospital Database
Medicine &
Cardiology Neurology
Cardiac &
Vasc Surgery
Enalaprilat 15.7% 24.6% 8.0%
Esmolol 4.9% 6.2% 14.2%
Fenoldopam 0.2% 0.3% 1.8%
Hydralazine 15.3% 31.2% 20.4%
Labetalol 22.5% 59.8% 21.2%
Nicardipine 1.9% 13.4% 7.5%
Nitroglycerine 54.9% 9.5% 70.9%
Sodium nitroprusside 3.4% 13.8% 39.4%
Certain data used in this study were supplied by Solucient, a division
of The Medstat Group, Inc. Any analysis, interpretation, or conclusion
based on these data is solely that of the authors, and not Solucient.
COMPARATIVE STUDIES
Blood Pressure Control
and
Clinical Outcomes

Sweet Spot
Blo
od
Pre
ssu
re
Time
Overshoot
Undershoot
Inadequate Control
Rapid Control
Slow Control
Unreliable Control
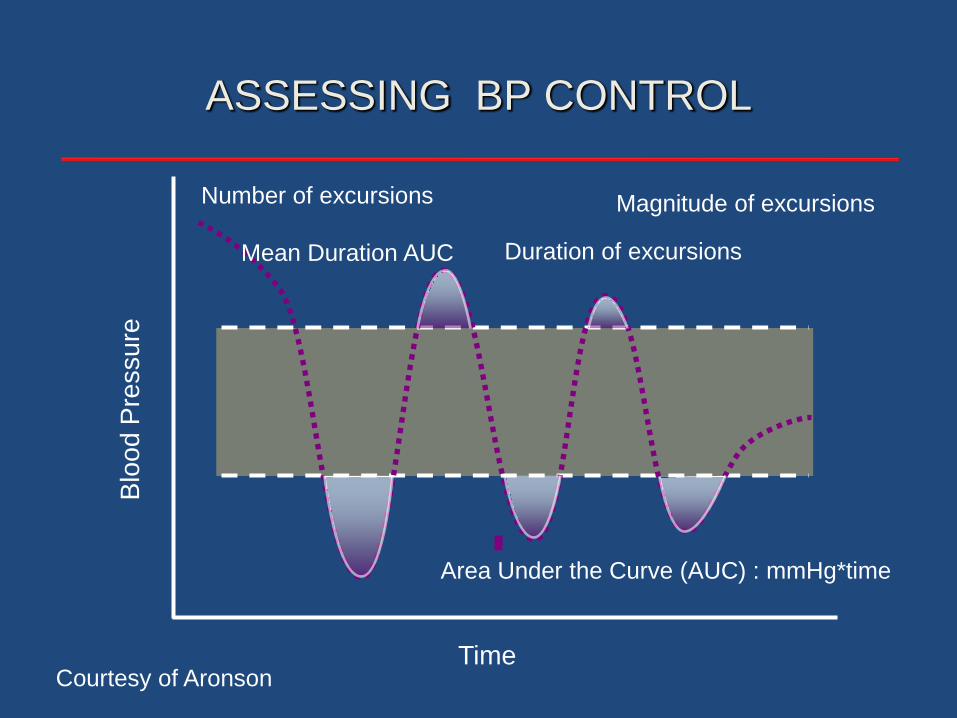
ASSESSING BP CONTROL
Courtesy of Aronson
Blo
od
Pre
ssu
re
Time
ASSESSING BP CONTROL
Courtesy of Aronson
Magnitude of excursions
Duration of excursions
Number of excursions
Area Under the Curve (AUC) : mmHg*time
Mean Duration AUC

Nicardipine vs Nitroprusside for Hypertension
After Carotid Endarterectomy
Nicardipine
(n=29)
Nitroprusside
(n=31)
Time in Minutes
Dorman T, et al. J Clin Anesth. 2001;13:16-19.
83%*
t= 10 min
23%
t= 10 min
* (P < 0.01)
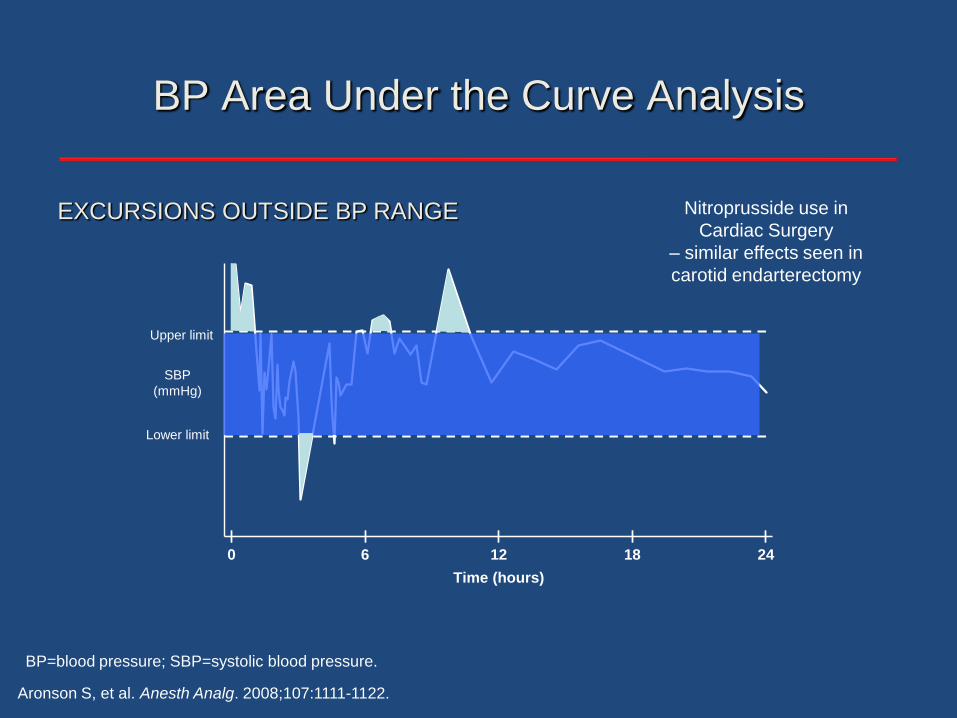
BP Area Under the Curve Analysis
Time (hours)
Lower limit
Upper limit
0 6 12 2418
SBP
(mmHg)
Upper limit
Lower limit
SBP
(mmHg)
Aronson S, et al. Anesth Analg. 2008;107:1111-1122.
BP=blood pressure; SBP=systolic blood pressure.
Nitroprusside use in
Cardiac Surgery
– similar effects seen in
carotid endarterectomy
EXCURSIONS OUTSIDE BP RANGE
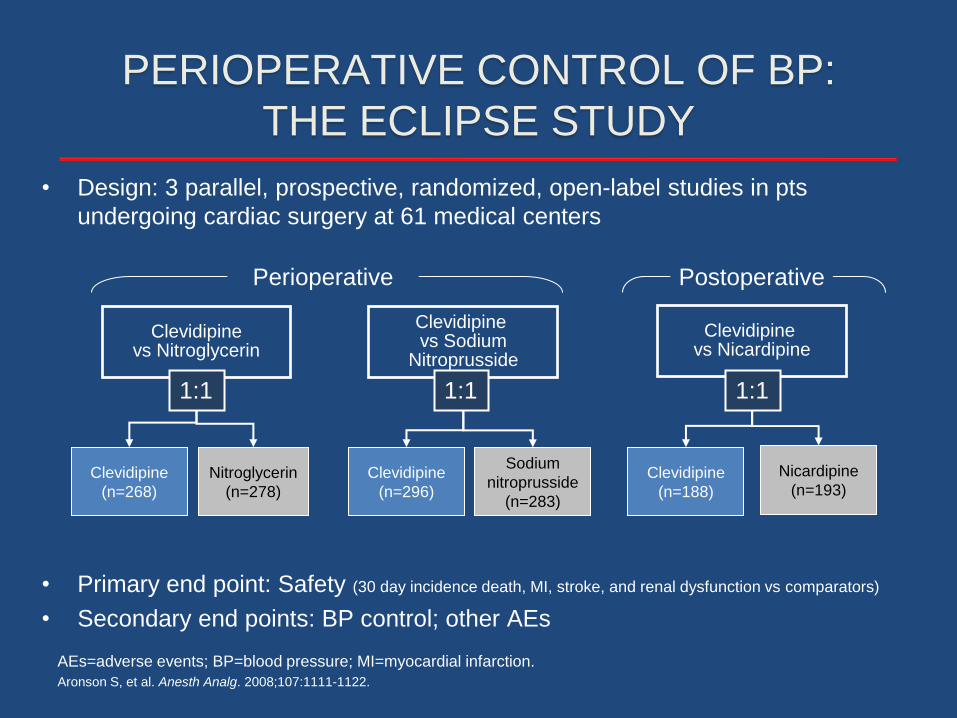
PERIOPERATIVE CONTROL OF BP:
THE ECLIPSE STUDY
• Design: 3 parallel, prospective, randomized, open-label studies in pts
undergoing cardiac surgery at 61 medical centers
• Primary end point: Safety (30 day incidence death, MI, stroke, and renal dysfunction vs comparators)
• Secondary end points: BP control; other AEs
Clevidipinevs Nitroglycerin
Clevidipine vs Sodium
Nitroprusside
Clevidipine vs Nicardipine
Clevidipine
(n=268)
Nitroglycerin
(n=278)
Clevidipine
(n=296)
Sodium
nitroprusside
(n=283)
Clevidipine
(n=188)
Nicardipine
(n=193)
1:1 1:1 1:1
Aronson S, et al. Anesth Analg. 2008;107:1111-1122.
Perioperative Postoperative
AEs=adverse events; BP=blood pressure; MI=myocardial infarction.

2.82.3
1.1
7.9
3.8
2.41.7
7.9
0
2
4
6
8
10Clevidpine Comparators
COMPARATIVE OUTCOMES AT 30 DAYS POST
CARDIAC SURGERY
Death
30-D
ay e
vents
(%
)
(n=729) (n=700) (n=707) (n=700) (n=705) (n=712) (n=710)(n=719)
MI Stroke RenalDysfunction
Aronson S, et al. Anesth Analg. 2008;107:1111-1122.
MI=myocardial infarction.
Comparators = Nitroglycerine, Sodium Nitroprusside, Nicardipine

PRIMARY ENDPOINT BY
TREATMENT COMPARISON
5.9%
1.1%
1.1%
3.2%
NIC
8.3%
0.6%
2.3%
4.4%
Clevidipine
9.1%
1.5%
2.3%
4.7%*
SNP
8.5%
1.1%
1.4%
1.7%
Clevidipine
8.1%
2.3%
3.5%
3.4%
NTG
6.9%
1.6%
3.3%
2.8%
Clevidipine
Renal Dysfunction
Stroke
Death
MI
* p=0.045 Difference in mortality was driven by a reduced rate of CV
mortality with clevidipine
Perioperative Perioperative Postoperative
Only
Aronson S et al. Abstract 1020-169. American College of Cardiology Annual Meeting; March 24-27 2007; New Orleans, LA.
Data of file, The Medicines Company.

16.30
24.33
28.02
22.37
44.48
39.51
35.84
40.40
0
5
10
15
20
25
30
35
40
45
50
4.14 4.37
1.763.79
8.8710.50
1.69
7.79
0
5
10
15
20
25
30
35
40
45
50
AUC BY TREATMENT GROUP
ECLIPSENTG
ECLIPSESNP
ECLIPSENIC
Clevidipinen=269
NTGn=278
Clevidipinen=295
SNPn=284
Clevidipinen=187
NICn=194
Clevidipinen=751
All Comparatorsn=756
ECLIPSENTG/SNP/NIC
Me
an
AU
C (
mm
Hg
x m
in/h
)
Me
dia
n v
alu
e in
Ita
lics
p = 0.0006 p = 0.0027 p = 0.0004p = NS
Aronson S, et al. Anesth Analg. 2008;107:1111-1122.
Data presented based on maintaining
SBP within a 70 mmHg range
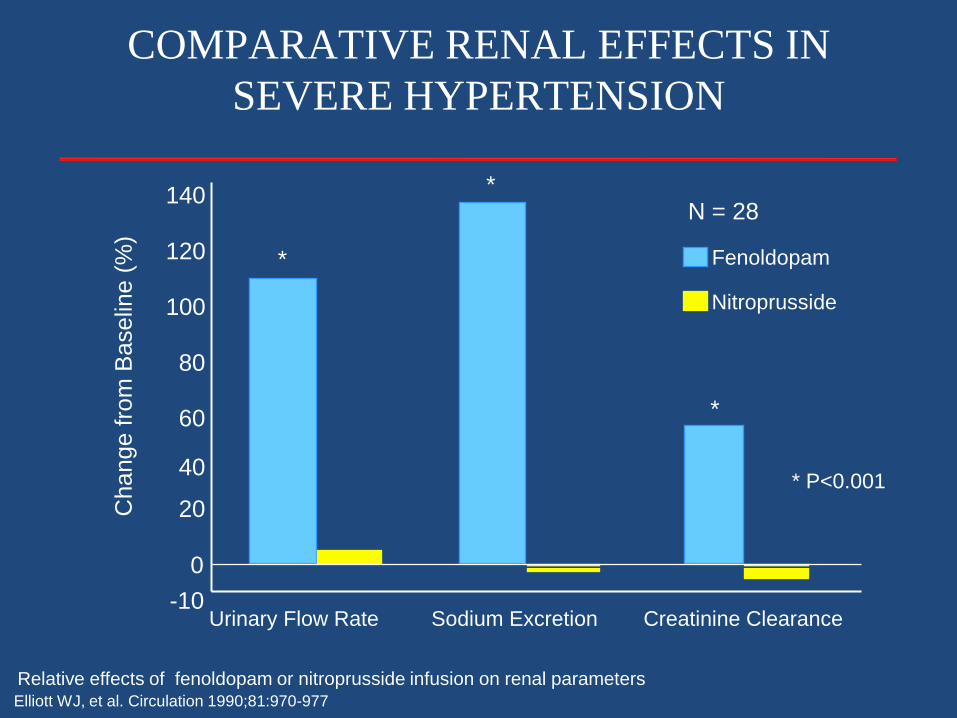
Urinary Flow Rate Sodium Excretion Creatinine Clearance
Fenoldopam
Nitroprusside
Relative effects of fenoldopam or nitroprusside infusion on renal parameters
0
20
40
60
80
100
120
140
-10
Change f
rom
Baselin
e (
%)
Elliott WJ, et al. Circulation 1990;81:970-977
COMPARATIVE RENAL EFFECTS IN
SEVERE HYPERTENSION
*
*
*
* P<0.001
N = 28
CLINICAL OUTCOMES
Linking BP Control to Clinical Outcomes
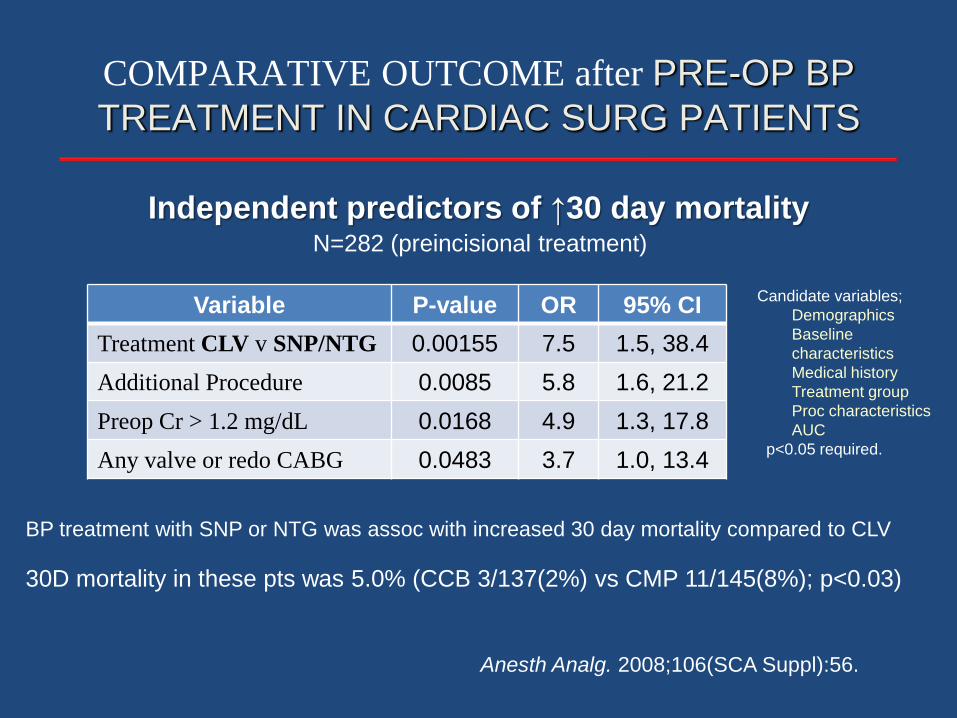
COMPARATIVE OUTCOME after PRE-OP BP
TREATMENT IN CARDIAC SURG PATIENTS
BP treatment with SNP or NTG was assoc with increased 30 day mortality compared to CLV
Anesth Analg. 2008;106(SCA Suppl):56.
Independent predictors of ↑30 day mortalityN=282 (preincisional treatment)
30D mortality in these pts was 5.0% (CCB 3/137(2%) vs CMP 11/145(8%); p<0.03)
Variable P-value OR 95% CI
Treatment CLV v SNP/NTG 0.00155 7.5 1.5, 38.4
Additional Procedure 0.0085 5.8 1.6, 21.2
Preop Cr > 1.2 mg/dL 0.0168 4.9 1.3, 17.8
Any valve or redo CABG 0.0483 3.7 1.0, 13.4
Candidate variables;
Demographics
Baseline
characteristics
Medical history
Treatment group
Proc characteristics
AUC
p<0.05 required.
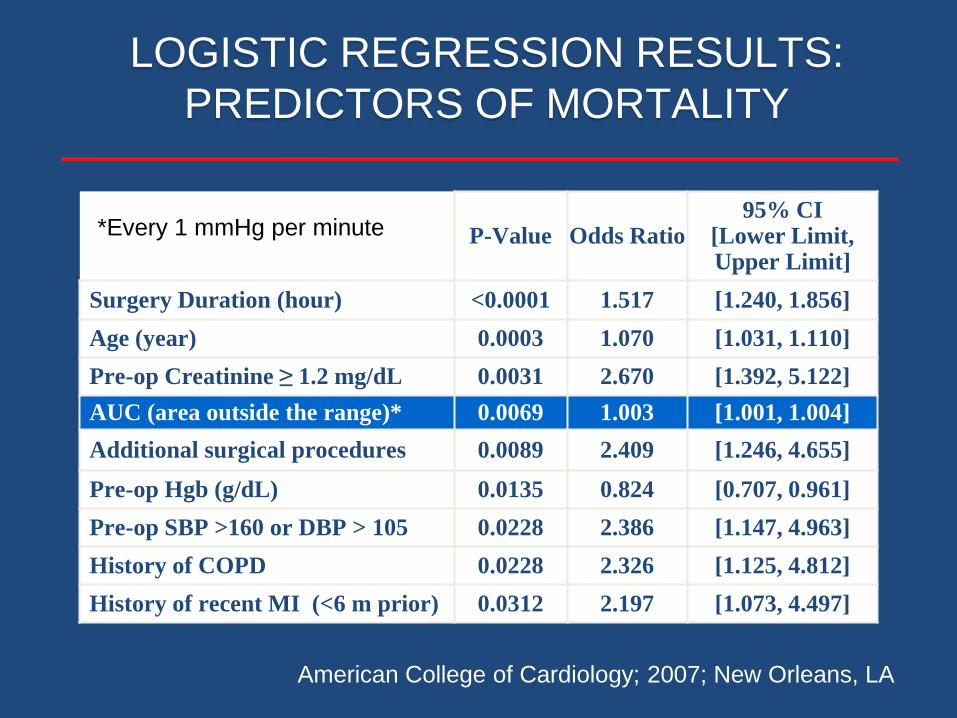
LOGISTIC REGRESSION RESULTS:
PREDICTORS OF MORTALITY
P-Value Odds Ratio95% CI
[Lower Limit, Upper Limit]
Surgery Duration (hour) <0.0001 1.517 [1.240, 1.856]
Age (year) 0.0003 1.070 [1.031, 1.110]
Pre-op Creatinine ≥ 1.2 mg/dL 0.0031 2.670 [1.392, 5.122]
AUC (area outside the range)* 0.0069 1.003 [1.001, 1.004]
Additional surgical procedures 0.0089 2.409 [1.246, 4.655]
Pre-op Hgb (g/dL) 0.0135 0.824 [0.707, 0.961]
Pre-op SBP >160 or DBP > 105 0.0228 2.386 [1.147, 4.963]
History of COPD 0.0228 2.326 [1.125, 4.812]
History of recent MI (<6 m prior) 0.0312 2.197 [1.073, 4.497]
*Every 1 mmHg per minute
American College of Cardiology; 2007; New Orleans, LA
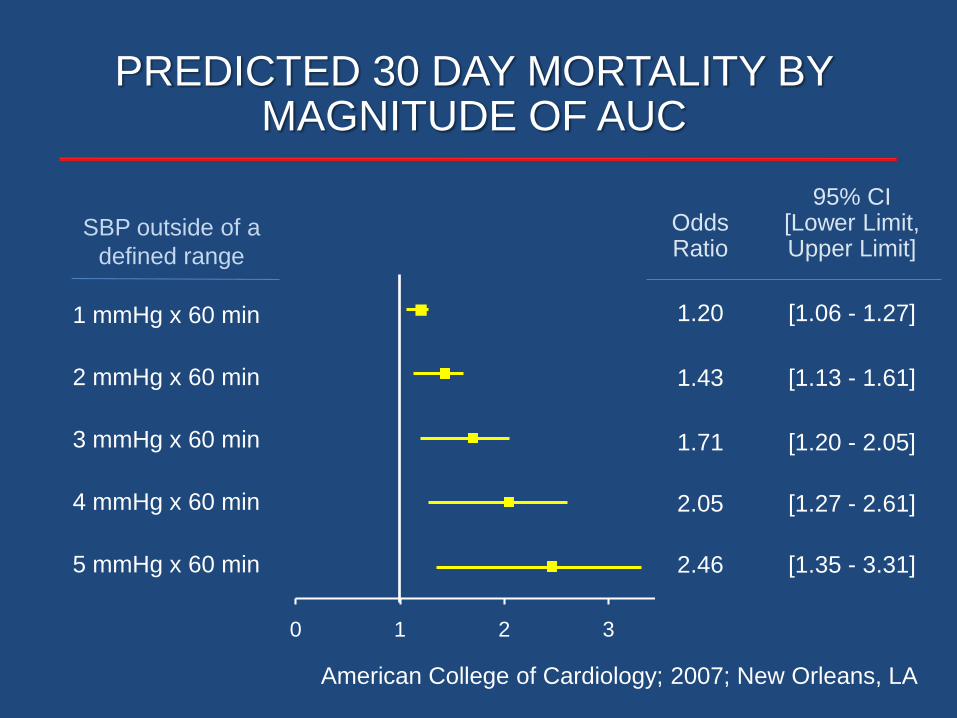
1 mmHg x 60 min
2 mmHg x 60 min
3 mmHg x 60 min
4 mmHg x 60 min
0 1 2 3 4
5 mmHg x 60 min
PREDICTED 30 DAY MORTALITY BY MAGNITUDE OF AUC
Odds Ratio
95% CI [Lower Limit, Upper Limit]
1.20 [1.06 - 1.27]
1.43 [1.13 - 1.61]
1.71 [1.20 - 2.05]
2.05 [1.27 - 2.61]
2.46 [1.35 - 3.31]
SBP outside of a
defined range
American College of Cardiology; 2007; New Orleans, LA
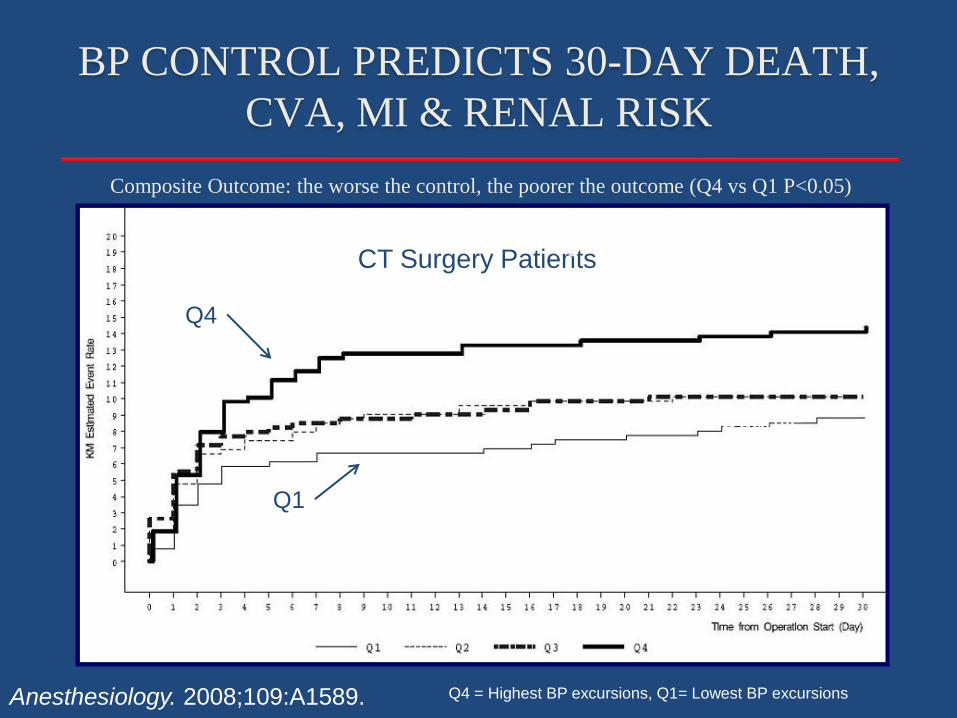
Composite Outcome: the worse the control, the poorer the outcome (Q4 vs Q1 P<0.05)
Anesthesiology. 2008;109:A1589.
CT Surgery PatientsHighest Risk 4th Quartile
Lowest Risk 1st Quartile
BP CONTROL PREDICTS 30-DAY DEATH,
CVA, MI & RENAL RISK
Q4
Q1
Q4 = Highest BP excursions, Q1= Lowest BP excursions
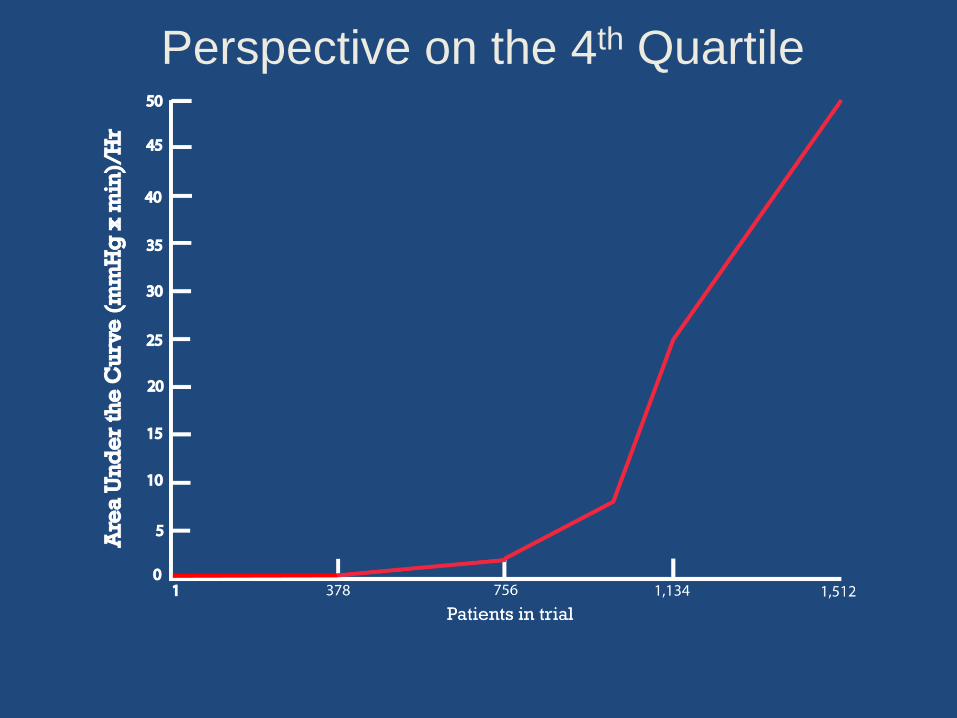
Perspective on the 4th Quartile
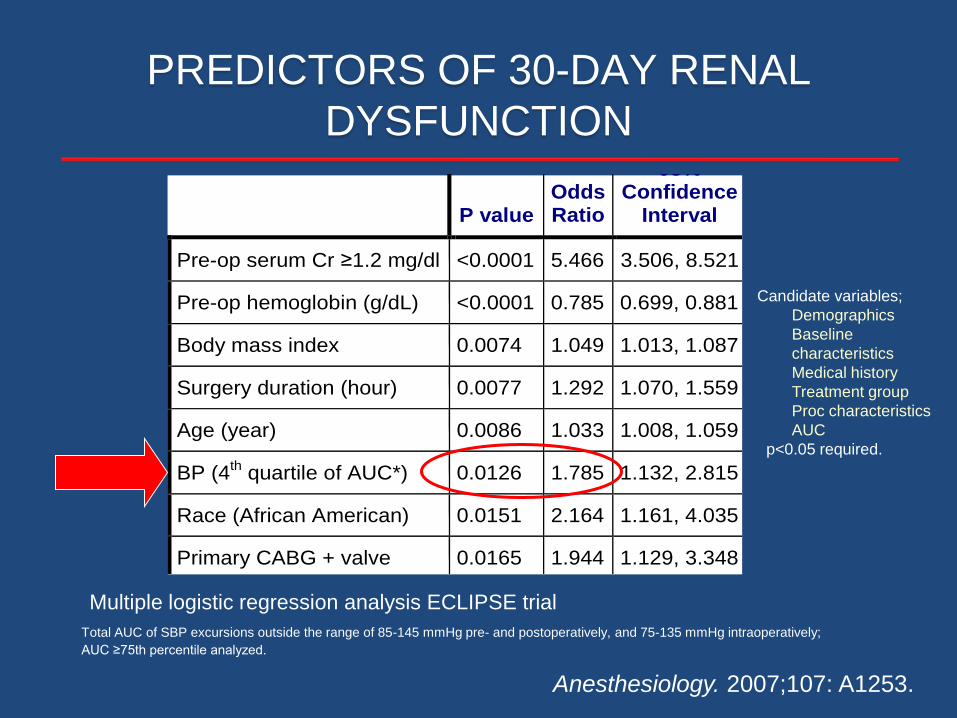
PREDICTORS OF 30-DAY RENAL
DYSFUNCTION
P value Odds Ratio
95% Confidence
Interval
Pre-op serum Cr ≥1.2 mg/dl <0.0001 5.466 3.506, 8.521
Pre-op hemoglobin (g/dL) <0.0001 0.785 0.699, 0.881
Body mass index 0.0074 1.049 1.013, 1.087
Surgery duration (hour) 0.0077 1.292 1.070, 1.559
Age (year) 0.0086 1.033 1.008, 1.059
BP (4th quartile of AUC*) 0.0126 1.785 1.132, 2.815
Race (African American) 0.0151 2.164 1.161, 4.035
Primary CABG + valve 0.0165 1.944 1.129, 3.348
Total AUC of SBP excursions outside the range of 85-145 mmHg pre- and postoperatively, and 75-135 mmHg intraoperatively;
AUC ≥75th percentile analyzed.
Multiple logistic regression analysis ECLIPSE trial
Candidate variables;
Demographics
Baseline
characteristics
Medical history
Treatment group
Proc characteristics
AUC
p<0.05 required.
Anesthesiology. 2007;107: A1253.
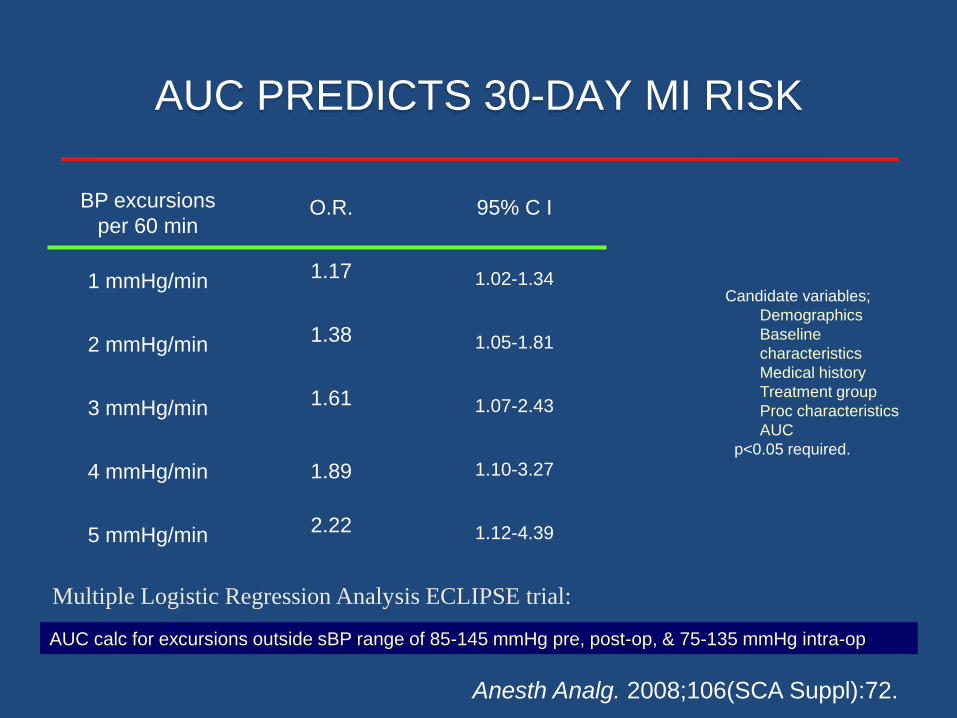
BP excursions
per 60 minO.R. 95% C I
1 mmHg/min 1.17 1.02-1.34
2 mmHg/min 1.38 1.05-1.81
3 mmHg/min 1.61 1.07-2.43
4 mmHg/min 1.89 1.10-3.27
5 mmHg/min 2.22 1.12-4.39
AUC calc for excursions outside sBP range of 85-145 mmHg pre, post-op, & 75-135 mmHg intra-op
Multiple Logistic Regression Analysis ECLIPSE trial:
AUC PREDICTS 30-DAY MI RISK
Anesth Analg. 2008;106(SCA Suppl):72.
Candidate variables;
Demographics
Baseline
characteristics
Medical history
Treatment group
Proc characteristics
AUC
p<0.05 required.

MEAN DURATION OF SBP EXCURSIONS
ASSOC WITH 30 MORTALITYMinutes SBP > 130 or < 105 mmHg per incident
P-Value < 0.0001, O.R.-1.07 (1.04-1.102)Anesthesiology 2010;113:305-12
OR = 1.03 per minute (95% CI 1.02-1.39); P<0.001
*Mean duration of SBP excursion
most predictive of 30D mortality
3.1M BP measured intraop (N=7,504 pts)
Deriviation 5,038; Validation 2,466

SUMMARY
Few data define perioperative BP control guidelines
or targets
Baseline (preop) hypertensive subclass
independently predicts (postop) risk
Intra-operative BP control predicts (postop) risk
Effectiveness of BP treatment depends on the
patient, situation, treatment and condition
Is that this
patient’s real
blood
pressure?
THANK YOU
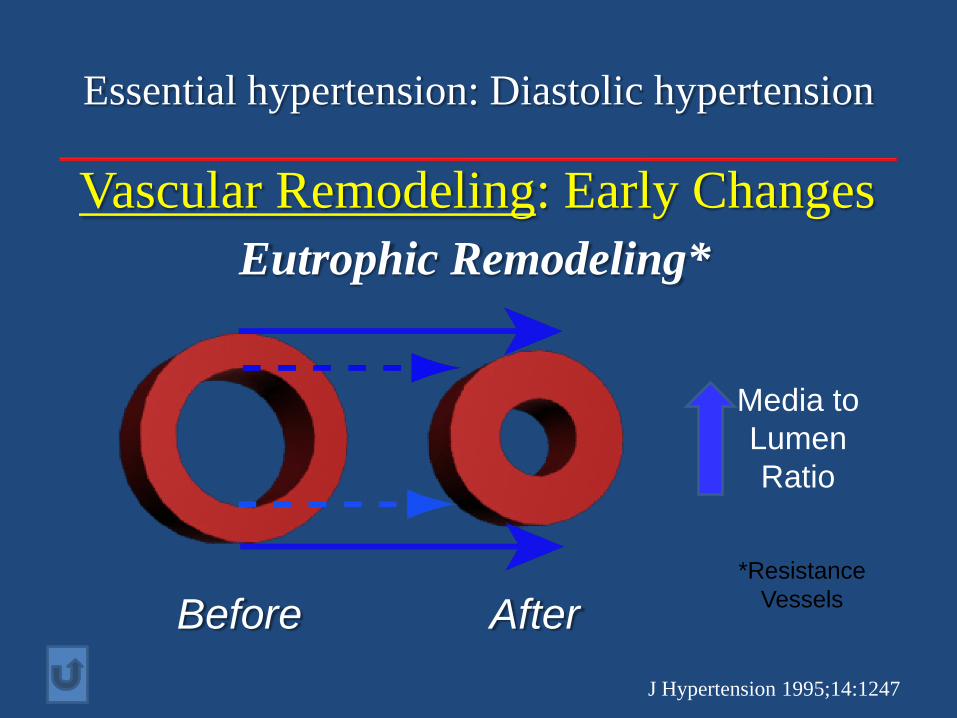
Essential hypertension: Diastolic hypertension
Vascular Remodeling: Early Changes
J Hypertension 1995;14:1247
Eutrophic Remodeling*
Before After
Media to
Lumen
Ratio
*Resistance
Vessels
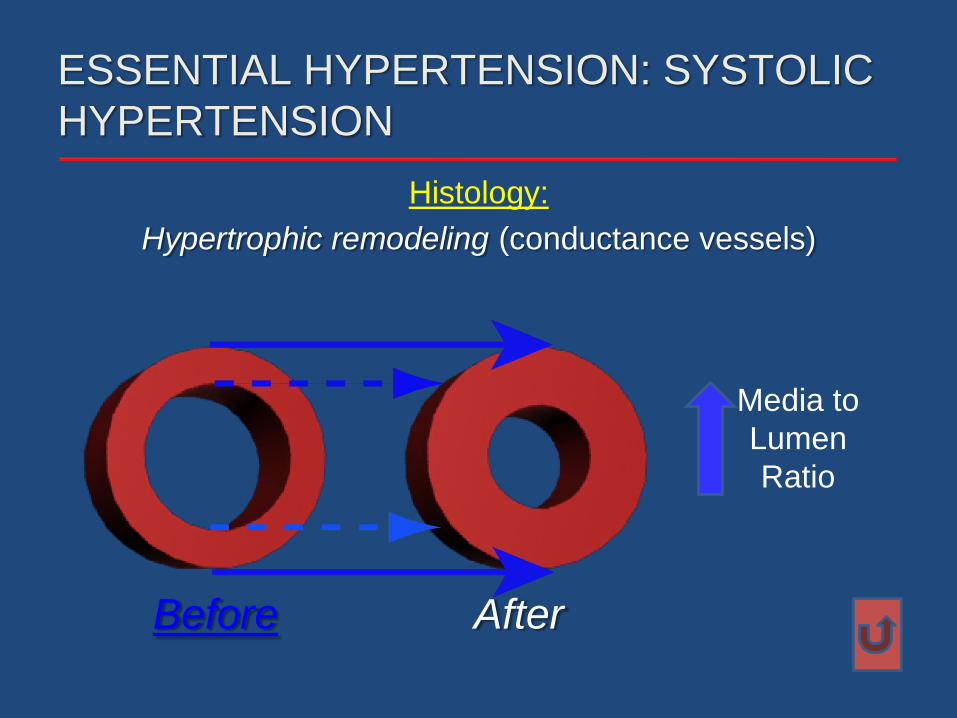
Histology:
Hypertrophic remodeling (conductance vessels)
ESSENTIAL HYPERTENSION: SYSTOLIC
HYPERTENSION
Before After
Media to
Lumen
Ratio