patients interacting with pharmacy staff
TRANSCRIPT
1
Patients interacting with pharmacy staff:
An exploration of encounter-related factors and its relation with professionals’ job satisfaction
Anette Aaland Krokaas
Master thesis in Social Pharmacy School of Pharmacy
Faculty of Mathematics and Natural Sciences
UNIVERSITY OF OSLO October 2012

2
3
Patients interacting with pharmacy staff:
An exploration of encounter-related factors and its relation with professionals’ job satisfaction
Anette Aaland Krokaas
Master thesis in Social Pharmacy
Conducted at:
Department of Social Pharmacy, School of Pharmacy,
Faculty of Mathematics and Natural Sciences, University of Oslo
and
Department of Social Pharmacy, Faculty of Pharmacy, University of Lisbon
Supervisor:
Internal/external supervisor: Associate professor Afonso Miguel Cavaco, Department of Pharmacy,
University of Oslo and Department of Social Pharmacy, University of Lisbon
UNIVERSITY OF OSLO October 2012

4
5
Foreword This master thesis was conducted at the Department of Social Pharmacy, University
of Lisbon, Portugal and at the Department of Pharmacy, University of Oslo, in the
period August 2011 to May 2012.
I would like to direct my gratitude to my supervisor Afonso Cavaco, for the continuous
guidance throughout the thesis period and for teaching me how to work with SPSS.
My eternal gratitude goes to all the people that I have met and been allowed to
observe for my data collection, because without them I would not have a master
thesis to deliver. Also to the owners and heads of the pharmacies I have visited for
welcoming me with open arms and for sharing information about pharmacies in
Portugal. Especially Ema Paulino for helping me with shaping the data collection
procedure.
I also give many thanks to NFS (Norsk Farmasøytisk Selskap) for financial support
received in relation to the thesis work and the pharmacy visits.
Finally, my deepest gratitude goes to JP for being my constant support and
motivator, and also for borrowing me his car whenever I needed it to visit
pharmacies. And to my family for always supporting me and pushing me.
Oslo, 6 May 2012.
Anette Aaland Krokaas

6
7
Summary Background Pharmacy professionals working in community pharmacies play an important role in
advising patients about medicines. One key indicator of the quality of these
encounters is duration. In a community pharmacy setting, longer interactions have
been associated with reports of greater patient satisfaction, more information, larger
patient centeredness and with patients contributing more to the interaction, resulting
in improving the quality of services provided, i.e. better patient health outcomes.
Automation in pharmacies is believed to release the pharmacy professionals from
some of the logistical procedures, thereby giving the professionals more time to
counsel patients during medicines dispensing. Job satisfaction is a key determinant
of professionals’ practice and involvement in professional development. It has been
scarcely measured in pharmacy in Portugal and there are no studies approaching a
potential relation between job satisfaction and encounter characteristics (e.g.
duration), professional and patient backgrounds. There are also no studies on the
automation and its potential impact on the employees’ job satisfaction.
Purpose To analyse the interaction length between pharmacy staff and patients in community
pharmacies, involving all pharmacy staff (both pharmacists and technical assistants),
as well as assess the interaction attributes through a non-verbal communication
component. Also, to investigate whether there are differences in main interaction
variables between community pharmacies with and without stocking and dispensing
automation. The job satisfaction of the pharmacy staff and the interaction variables’
impact on their job satisfaction was also investigated.
Methods The study followed a cross-sectional descriptive design. The study was divided in two
arms: The first was an interaction study that used non-participant, overt observation
of episodes with pharmacy staff interacting with patients; the second arm was a self-
administered questionnaire applied to study job satisfaction of participating pharmacy
staff, using a validated version of the Warr-Cook-Wall scale. Pharmacies in greater
Lisbon with and without automation were purposely selected to cover a cross-section
8
of urban community pharmacies. The pharmacies with and without automation were
loosely matched, therefore paired comparisons were not conducted apart from with
the automation itself. No statistical sampling or sample power procedures were
assumed. In total, observations were carried out in 11 pharmacies. The participants
comprised of consenting pharmacy employees, both pharmacists and technicians.
Results No significant differences between female and male pharmacy staff, neither between
pharmacists and technical assistants was found in terms of duration of interactions.
ANOVA and Post Hoc multiple comparisons found a significant difference in duration
lying between the service provided to young and mature adults (p=0.017). Interaction
duration was not significantly affected by the automation.
With a maximum overall job satisfaction score of 7, the mean overall satisfaction for
all pharmacy professionals observed was 5.52 (SD=0.98), and there were no
significant differences between the professional’s gender, category or whether the
professional was employed in a pharmacy with automation or not, however the
differences were significant between the age groups of the professionals. Overall job
satisfaction was influenced by average number of prescriptions per episode, and
average number of POM packages sold per encounter, but not by automation.
Discussion and conclusion The duration of the interactions was not dependent on characteristics of the
pharmacy staff (e.g. pharmacists vs. technicians), but with increasing age of the
patient and increasing number of packages sold, the interactions lasted longer. To
the contrary of what has been endorsed, the pharmacy work, in terms of duration of
episodes and the satisfaction of the pharmacy professionals, was not much
influenced by implemented automation in the pharmacy. The impact of the interaction
features on the job satisfaction pointed in the direction of when professionals have
more to do based on a greater number of products being dispensed, instead of an
interaction mainly based on pure counselling and communication activities, some
facets of job satisfaction decreased. This might be a result of an increased traditional
workload and less time to develop clinical activities and counsel the patient.
These conclusions need to be better supported in further research.
9
Glossary Assistants and practitioners:
Pharmacy staff with no formal education in pharmaceutical sciences not authorized
to dispense any medicines to the public. Usually they perform a back office role, e.g.
working with stocking (with and without the involvement of a robot) and sometimes
they are involved in non-medicinal product sales (e.g. cosmetics and medical
devices).
Client:
Anyone entering a community pharmacy to use its services, holding or not a sick
condition (i.e. being a patient), buying medicines and/or other products or utilizing the
pharmacy staff for receiving health counselling and advice.
Customer:
Here assumed the same as client or patient.
Encounter:
Any verbal and/or non-verbal exchange happening inside the community pharmacy
between any member of the staff and the client, which could be observed by the field
researcher.
Episode:
Here assumed the same as encounter or interaction.
“Express counter” service:
This service concept was used in one of the observed community pharmacies. This
counter was aimed at serving patients with few prescriptions or those who were
intending to buy OTCs or other products in a faster manner. The pharmacy also
offered regular counter-based service.
10
Eye contact:
When two people look at each other’s eyes at the same time. In this study it was
considered the primary determinant to whether attention and interest was given to
the other person, and was the studied non-verbal communication component.
“Farmadrive” service:
A service that a small number of pharmacies in Portugal offer. It is a drive-through
concept, where the patient seated in his/her car delivers the prescriptions to or tells
the pharmacy professional what he/she needs through the Farmadrive window. The
entire interaction happens through this window, and medicines and other products,
as well as counselling, is delivered through the window.
Field investigation:
A field investigation is conducted by observing the relevant phenomena in its natural
environment. This differs from laboratory investigation, as the laboratory investigation
is conducted by observing the phenomena in a surrounding that is specially set up for
the investigation.1
Interaction:
Here assumed the same as encounter or episode.
Non-participating observation:
During a non-participating observation the researcher is a spectator to what is being
observed. In these observations it is important that the presence of the observer
does not affect the behaviour of those who are being observed.1
Open observation:
The subjects know that the fieldworker, who is usually a stranger to the field, is a
researcher and that they are being observed.1
1 Research methods in Pharmacy Practice, Felicity Smith. 162-168. Pharmaceutical Press. 2002. Cornwall, GB.
11
Patient:
Here assumed the same as client or customer.
Pharmacist:
Healthcare professionals who receive training that consist of five years of university
studies in addition to curricular internships in community and hospital pharmacy. The
duties and rights of pharmacists are governed by professional and their own ethical
codes, which are regulated and enforced by the Ordem dos Farmacêuticos (OF –
Portuguese Pharmaceutical Society) The presence of a pharmacist in community
pharmacies is required at all times by the Portuguese law.2
Pharmacy services:
In this study, the term “pharmacy services” is used for services provided by the
community pharmacy, excluding the preparation and distribution of medicines and
other products found in the pharmacy as well as the advising on minor ailments.
Pharmacy technician:
Healthcare professionals assisting the pharmacists in their job. In Portugal
technicians are comparable to those with the title “bachelor of pharmacy”. The
education is through polytechnic colleges and the duration is 4 years. They can
dispense medicines and perform similar tasks as pharmacists, however under
supervision of a pharmacist.2
Regular counter-based service:
The classical service provision in community pharmacies, where the pharmacy
professional and the patient stands or sits on each side of a counter. This is the most
common service layout in community pharmacies.
2 PHARMINE. Pharmacy education & training in Portugal 2010. Available at: http://enzu.pharmine.org/media/filebook/files/PHARMINE%20WP7%20survey%20Portugal.pdf. (Accessed 14 May 2012)

12
Technical Assistant:
Here assumed the same as pharmacy technician or technician.
Technician:
Here assumed the same as pharmacy technician or technical assistant.
13
Table of Contents Foreword.....................................................................................................................5
Summary.....................................................................................................................7
Glossary......................................................................................................................9
1 Introduction ........................................................................................................15 1.1 Communication between healthcare professionals and patients ......................15
1.1.1 Non-verbal communication in healthcare ............................................................16 1.1.2 Communication in community pharmacy practice...............................................17 1.1.3 Detailing patient-pharmacist interaction ..............................................................17
1.2 Job satisfaction .......................................................................................................19 1.2.1 Job satisfaction amongst pharmacy professionals..............................................20
1.3 Community pharmacy practice in Portugal ..........................................................21 1.3.1 Community pharmacies.......................................................................................21 1.3.2 Stocking and dispensing robots ..........................................................................22
2 Purpose ...............................................................................................................24
3 Material and methods ........................................................................................25 3.1 Study design ............................................................................................................25 3.2 Sample and sampling procedures .........................................................................25 3.3 Material .....................................................................................................................26
3.3.1 Interaction material..............................................................................................26 3.3.2 Job satisfaction material......................................................................................27 3.3.3 Administrative material ........................................................................................29
3.4 Methods....................................................................................................................30 3.4.1 Interaction data....................................................................................................30 3.4.2 Job satisfaction data ...........................................................................................31 3.4.3 Administrative data..............................................................................................31
3.5 Ethical approval.......................................................................................................31 3.6 Data processing.......................................................................................................32
4 Results ................................................................................................................33 4.1 Community pharmacy characterization ................................................................33 4.2 Participants ..............................................................................................................34
4.2.1 Demographics .....................................................................................................34 4.2.2 Interactions characterisation ...............................................................................36
4.3 Observation data from the interactions ................................................................37 4.3.1 Observation periods ............................................................................................37 4.3.2 Episodes and duration ........................................................................................38 4.3.3 Written information provision...............................................................................40 4.3.4 Automation influence...........................................................................................40 4.3.5 Customer service layout......................................................................................41

14
4.3.6 Pharmacy services influence ..............................................................................41 4.3.7 Non-verbal parameter .........................................................................................42
4.4 Job satisfaction .......................................................................................................42
5 Discussion ..........................................................................................................48 5.1 Professionals-patients interactions.......................................................................48
5.1.1 Episodes..............................................................................................................48 5.1.2 Non-verbal communication variable ....................................................................50
5.2 Interaction time and automation/non-automation pharmacies...........................51 5.3 Job satisfaction .......................................................................................................53
5.3.1 Job satisfaction facets/overall scores..................................................................53 5.3.2 Job satisfaction and individual background.........................................................53 5.3.3 Job satisfaction and interaction features .............................................................55 5.3.4 Job satisfaction and automation..........................................................................56
5.4 Study strengths and limitations.............................................................................57 5.4.1 Strengths .............................................................................................................57 5.4.2 Study limitations ..................................................................................................58
5.5 Future research .......................................................................................................58
6 Conclusion..........................................................................................................59
Literature list ............................................................................................................60
Annex 1 .....................................................................................................................68
Annex 2 .....................................................................................................................69
Annex 3 .....................................................................................................................70
Annex 4 .....................................................................................................................73
Annex 5 .....................................................................................................................75
15
1 Introduction
1.1 Communication between healthcare professionals and patients
The importance of communication between healthcare professionals (HCPs) and
patients in achieving positive health and humanistic outcomes is well known (1). Most
HCPs meet and thereby communicate with patients regularly, and hence this
interaction has been a core issue in healthcare teaching and research. In nursing
education for instance, there has been a great focus on communication training as
well as doing research on the professional-patient communication (2). Interaction
studies between physicians and patients have been carried out for more than 30
years, addressing social issues and technicalities of this relationship (3-5).
Having established that healthcare professions are aware of good and effective
communication between HCPs and patients as an essential component in the
encounter between these two groups (6), it is then important to address how it can be
possible to achieve this kind of fruitful interaction.
The patient and the HCP need to understand each other in order for the patient to
receive the best possible care, to eliminate misunderstandings and to make sure the
right message is conveyed, which are all components of good communication (6).
When communication and interaction is carried out well, it can for example help the
patients to feel more satisfied and empowered, and the HCPs to be more effective
and trusted (7). Integrating the patient’s expertise and preferences in therapeutic
decisions has also been shown to lead to significant gains in health (3-5). On the
other hand, ineffective communication has been reported to be a significant cause of
medical errors and patient harm (6). Two-way communication between the HCP and
the patient has been shown to avoid patient dissatisfaction, as well as the use of
unnecessary medicines and non-adherence (7,8). When it comes to pharmacists,
however, their communication pattern has been described as being comprised
predominantly of one-way communication when interacting with patients (9).
16
Through verbal communication (the words that are spoken) the HCP needs to
present and explain the information that is needed for the patient, and as each
patient is different, the HCP needs to know how to best present the necessary
information for that specific patient (10). Listening skills are then important in order to
understand which communication styles are most appropriate, as well as confirming
that the patient has received the wanted message. Listening skills are also crucial for
the HCP to find out what the patient’s needs and concerns are, both those expressed
verbally and those expressed non-verbally (11).
At the same time as understanding the different ways to communicate verbally, the
HCP must understand the importance of non-verbal elements in interpersonal
communication, which contributes to the complete process of increasing patient care
and safety (11).
1.1.1 Non-verbal communication in healthcare
It has been argued that the most influential part of communication is non-verbal, such
as body expressions, tone of voice, eye contact and touch (12). The non-verbal part
of patient counselling was described as early as in the 1970s, underlining that the
non-verbal communication is more important than the verbal communication in order
for patients to recognise empathy, respect and genuineness from HCPs (11).
By using non-verbal communication skills, the HCP can also enhance the expression
of the concepts and information he or she wants the patient to take in, as it is the
non-verbal communication that conveys the most emotional context to the spoken
words (11).
Using non-verbal communication is hence a way to build trust between the patient
and HCP, showing empathy and that the HCP is not judgemental towards the patient.
This requires the use of appropriate body language, facial expressions and
conscious use of voice changes (13,14). Eye contact has been found to be a very
important part of non-verbal communication (11), whereas lack thereof contributes to
patient dissatisfaction (15).
17
1.1.2 Communication in community pharmacy practice
Pharmacy professionals are healthcare professionals readily available for patients to
approach, as community pharmacies are easy accessible and it is not required for
patients to make an appointment to speak with a pharmacy professional (16).
The encounter between the patient and the pharmacy professional is based on the
patient’s demand for medicines or other products, healthcare services that the
pharmacy provides or the need for counselling and advice (13,16). The encounter
happens most commonly face-to-face at the pharmacy counter, or, more rarely,
through phone or e-mail exchange (13).
Community pharmacies play an important role in advising patients about medicines.
This especially counts for when it comes to OTC medicines, where the patient is
unlikely to receive any other professional advice. The pharmacy professionals should
also reinforce information given by other HCPs regarding prescription medicines as
well as giving suitable health information when enquired (17). Research has
established that pharmacist-patient communication is not only important for
improving appropriate medicines use, but also for achieving the desired patient
outcomes. The quality of pharmacy services and pharmaceutical care has been
shown to depend extensively on how pharmacy professionals interact with the
patients they serve (13). This importance has been acknowledged for more than 40
years, both by professional bodies and by researchers in pharmacy practice (18-24).
In terms of how the patients prefer to receive information in community pharmacies,
the patients still prioritize spoken information compared to written information. The
pharmacy professional therefore needs to ensure that the encounter gives the patient
reliable and valid information, and at the same time that the information is
understandable and objective (25). Hence, pharmacy professionals should possess
and properly use interpersonal communication skills as a requirement in order to
achieve the desired outcomes.
1.1.3 Detailing patient-pharmacist interaction
In a broader medical context, longer patient-provider interactions have shown to give
greater participation, larger information giving and relationship building, and this has
18
been shown to improve health outcomes (26). The interaction time is also positively
associated with more lifestyle advice, recognition of long-term problems and with
patient enablement, which are important elements of healthcare (27). The patients’
perceived duration of the meeting with general practitioners is shown to be a
determinant of patient satisfaction (28). The effects of altering the length of
consultations in primary care has been an issue for research, and although there are
not many references addressing this area it has been considered sufficiently
important for meta-revision (29).
Duration as an interaction element
As mentioned in chapter 1.1.2, it has been found that achieving the desired patient
outcomes and appropriate medicines use depends greatly on the interaction between
the pharmacy professional and the patient itself (13). One of the key indicators of the
quality of these encounters in community pharmacies is determined to be their
duration (30).
During the encounter the pharmacy professionals need to dispense the correct
medicines, in addition to provide the patient with sufficient information about the use
of the medicines in a way that concordance is ensured. Time is a main factor for
these activities to be completed successfully, as each part of the process needs a
certain amount of time to achieve the satisfactory outcome (31,32). It can be
assumed that automation of the dispensing process allows for changes in the
interaction with patients (33).
Studies show that in a community pharmacy setting, longer interactions are
associated with reports of greater patient satisfaction, more information (34), larger
patient-centeredness and with the patients contributing more to the interaction (35).
The average dispensing time of a prescription takes around two minutes in the US
(36,37) and a little more than one minute in the UK (36).
The duration of the interaction is found to be significantly influenced by whether the
pharmacist had a participatory approach towards the patient and whether the
pharmacist gave more medicine information to the patient (37). In terms of patient
19
characteristics influencing the length of the encounter, it has been found that older
people and women are more likely to have longer visits (38-40).
Little research has been done to describe the interaction between the pharmacy
professionals and patients, in particular the important two-way communication, as
focus has been on the one-way communication from pharmacy professionals to
patients (41). As far as it is known, there have not been studies investigating
interaction duration between the pharmacy professionals and patients in Portuguese
pharmacies.
1.2 Job satisfaction
One of the most common research definition of job satisfaction defines it as “.. a
pleasurable or positive emotional state resulting from the appraisal of one’s job or job
experiences” (42). Job satisfaction has also been defined as an emotional response
to a job situation, and as such it cannot be seen, it can only be inferred. It is often
determined by how well work outcome meet or exceeds the worker’s expectations.
For instance, if employees feel that they are working much harder than others in the
company but are receiving fewer rewards they will probably have a negative attitude
towards the work, the employer and/or colleagues. On the other hand, if they feel
they are being treated very well and are being paid equitably, they are likely to have
positive attitudes towards the job (43,44).
Job satisfaction represents several related attitudes, which are the most important
characteristics of a job about which people have an effective response. These
characteristics comprise of e.g. the work itself, salary, promotion opportunities,
supervision, colleagues, recognition of the work and autonomy (43,44). These
characteristics have been placed under two main factors affecting job satisfaction:
Intrinsic and extrinsic. The intrinsic factors are those who lead to satisfaction and the
extrinsic factors are those who prevent dissatisfaction. Through research, the intrinsic
and extrinsic factors have been found to correlate to each other as well as to overall
job satisfaction (45).
20
1.2.1 Job satisfaction amongst pharmacy professionals
Different instruments have been developed to address job satisfaction research
amongst pharmacy staff within different professional settings, both in hospital
pharmacy and community pharmacy (46). A number of studies for both pharmacists
and technicians, for instance at the hospital level, have been produced along the last
30 years, in particular during the 80s and early 90s (47-51).
Consequences of job satisfaction on job performance are known, with an existing
correlation between self-assessed job performance rating and job satisfaction (52).
Studies have shown that pharmacists’ and other healthcare professionals’ job
satisfaction is influenced by various factors, including workload and role conflicts
(53). Other factors shown to affect the performance of pharmacists are personal
characteristics and factors associated with the workplace. Factors relating to
pharmacists’ workload and work environment were associated with performance
problems, especially in relation to errors. However, the gaps in the literature show
that the pharmacist performance is an area that needs further research (54).
Studies have shown that job stress and job-stress dimensions such as lack of job
control with various negative outcomes for pharmacists, including job satisfaction, are
linked (55,56). It has been shown that pharmacists are generally satisfied with their
jobs, however compared to two other healthcare professions (physicians and
surgeons) pharmacists are significantly less satisfied (57).
Pharmacy professionals need time to execute their role, and in community
pharmacies a main part of that role is talking with the patients. The outcome of the
interaction between HCPs and patients seems to be influenced by the HCP’s job
satisfaction (58). A literature review revealed that the community pharmacists are
experiencing increasing workload (although dispensing rates were not identified),
which in turn has increased job-related stress and reduced job satisfaction (59). As
interaction duration is related to the outcome of the interaction between the HCP and
patient, it is likely that interaction duration is related to job satisfaction as well.
21
1.3 Community pharmacy practice in Portugal
1.3.1 Community pharmacies
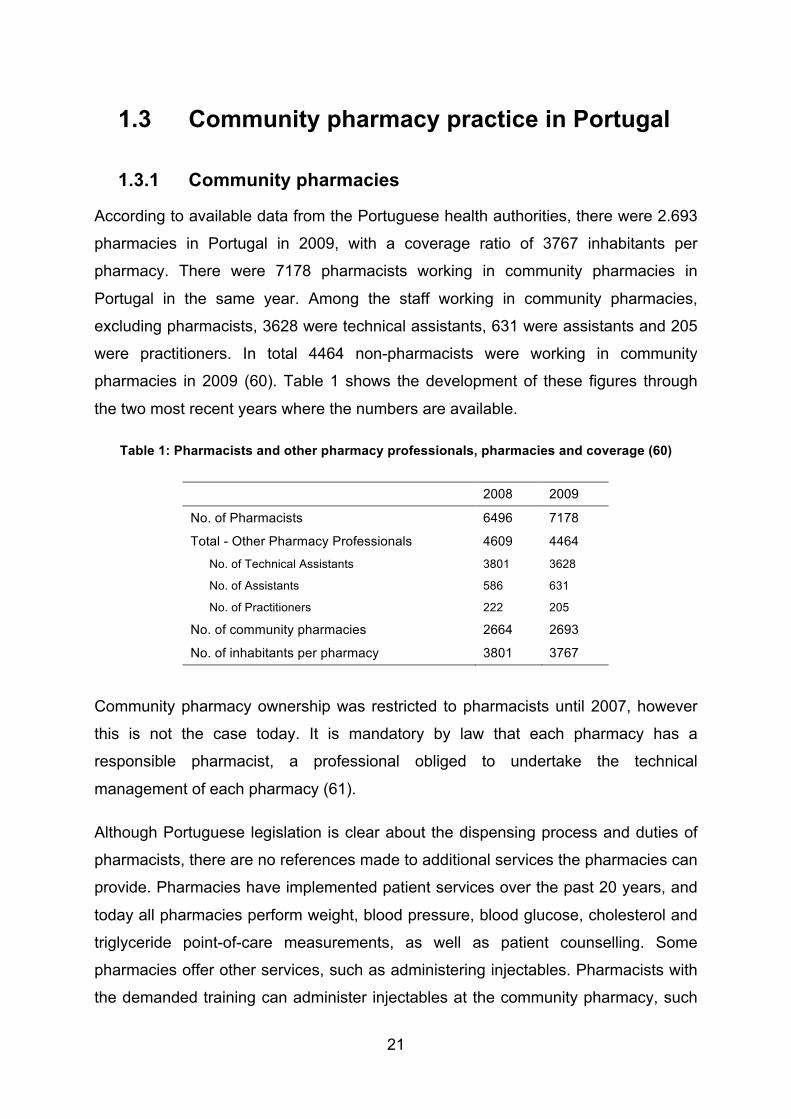
According to available data from the Portuguese health authorities, there were 2.693
pharmacies in Portugal in 2009, with a coverage ratio of 3767 inhabitants per
pharmacy. There were 7178 pharmacists working in community pharmacies in
Portugal in the same year. Among the staff working in community pharmacies,
excluding pharmacists, 3628 were technical assistants, 631 were assistants and 205
were practitioners. In total 4464 non-pharmacists were working in community
pharmacies in 2009 (60). Table 1 shows the development of these figures through
the two most recent years where the numbers are available.
Table 1: Pharmacists and other pharmacy professionals, pharmacies and coverage (60)
2008 2009
No. of Pharmacists 6496 7178
Total - Other Pharmacy Professionals 4609 4464
No. of Technical Assistants 3801 3628
No. of Assistants 586 631
No. of Practitioners 222 205
No. of community pharmacies 2664 2693
No. of inhabitants per pharmacy 3801 3767
Community pharmacy ownership was restricted to pharmacists until 2007, however
this is not the case today. It is mandatory by law that each pharmacy has a
responsible pharmacist, a professional obliged to undertake the technical
management of each pharmacy (61).
Although Portuguese legislation is clear about the dispensing process and duties of
pharmacists, there are no references made to additional services the pharmacies can
provide. Pharmacies have implemented patient services over the past 20 years, and
today all pharmacies perform weight, blood pressure, blood glucose, cholesterol and
triglyceride point-of-care measurements, as well as patient counselling. Some
pharmacies offer other services, such as administering injectables. Pharmacists with
the demanded training can administer injectables at the community pharmacy, such
22
as vaccines and vitamin injections, relieving patients of additional trips to doctors’
offices or nursing centres (62).
From all of the providers in the Portuguese healthcare system, pharmacies are linked
closest to the public (61). The Portuguese population believes that pharmacies are of
“easy” usage (63), and it would expect pharmacists to take an active role in their
treatment decisions, with older people less in favour. This opinion seems to derive
from the patients’ perceptions of pharmacy professionals’ competencies, which in
turn should result from pharmacist-patient interactions, and in particular from
interpersonal communication processes (64). As far as known, these interpersonal
communication processes, more specifically non-verbal communication, has not
been investigated in a Portuguese context.
1.3.2 Stocking and dispensing robots
Stocking and dispensing robots for pharmacies have been available for more than 10
years and provide an alternative storage system in community pharmacies to the
drawer storage system. The robot is electronically controlled and can store a larger
medicine stock in a small space, in addition to ensure proper rotation of medicines
(65,66). The robot dispenses the medicines directly to the pharmacy staff at the
counter, which saves them from the additional trips to pick medicines (67).
There are various systems available from different producers. When advertised, the
main focus is that the automation will provide the pharmacies with a space-saving,
timesaving and safer option compared to the conventional manual picking and
placing of medicines, as well as increased sales due to improved patient counselling
(65,66,68).
It has been seen that after the introduction of this kind of automation, the number of
dispensing errors decreased significantly. The dispensing time was also shorter and
staff satisfaction increased. These effects appear to be independent of the brand of
stocking and dispensing robots (69). One can then think that the robot will have an
impact on the quality of the encounter, as hypothetically there will be more time for
patient counselling during the encounter in addition to the raised staff satisfaction. If
this is true, this will again improve the healthcare offered by community pharmacies.

23
Acquisition costs of a stocking and dispensing robot are high (mostly exceeding of
100.000 Euros), but has been shown that the annual costs of the robot, comprising of
maintenance and electricity costs, can be covered by for example reducing the
staffing level by one technical assistant, while savings in personnel costs after
installation are rather modest (65).
24
2 Purpose The main purpose of this study was to analyze the interaction length between
pharmacy staff and patients in community pharmacies, involving all pharmacy staff
(both pharmacists and technical assistants).
This study also aimed to investigate whether there are differences in main interaction
variables between community pharmacies with and without stocking and dispensing
automation. Since patient interaction is a major component of pharmacy
professionals’ duties, the impact of these variables on the job satisfaction of the
pharmacy staff was also investigated.
More specifically, it is desired to answer the following objectives:
1. To determine the professional-patient interaction length for a sample of urban
Portuguese community pharmacies.
2. To assess professional-patient interaction attributes through a non-verbal
communication component.
3. To determine if there are differences in the interaction length between different
categories of pharmacy professionals.
4. To determine if there are differences in interaction length related to the
patients’ demographics.
5. To determine if there are differences in the overall interaction length between
pharmacies with automation and without automation.
6. To determine the level of job satisfaction for a sample of professionals working
at urban Portuguese community pharmacies.
7. To determine if levels of job satisfaction are related to the interaction length.
8. To determine if levels of job satisfaction are related to automation in
pharmacies and other dispensing-related variables.
The content of the conversation between the pharmacy staff and patient was not
studied.
25
3 Material and methods
3.1 Study design The study followed a cross-sectional descriptive design. The study was divided in two
arms: An interaction study that used non-participant, overt observation while in the
second arm a self-administered questionnaire was applied to study job satisfaction.
3.2 Sample and sampling procedures The pharmacies were purposively selected to cover a cross-section of urban
community pharmacies with and without stocking and dispensing automation in
greater Lisbon.
First, pharmacies with stocking and dispensing robots were targeted. To overcome
the challenge of gaining access to fieldwork observations (70) the identification of
pharmacies and their owners was therefore done through a contact person that was
involved with robots installation. The owners and heads of the pharmacies were then
approached in order to present them with the study, its objectives and methods, and
to gain authorisation to visit the pharmacy and collect data. After the first contact
some basic characteristics were collected (e.g. number of pharmacists and technical
assistants, average of costumers per day) with the purpose of being able to find
“loosely” matching community pharmacies without automation. This was done
without aiming to conduct paired comparisons, except for the automation itself. There
were no aims in trying to have a representative sample, therefore no statistical
sampling or sample power procedures were assumed.
The data sampling and collection was done at different times of the day and week in
the pharmacies, in order to catch the cross-section of potential variation as much as
possible.
The sampling units were pharmacies and their staff. However, the units under
analysis were the interaction elements produced by each pharmacy professional
26
together with their patients. This would allow for addressing the comparisons aimed
for in the study objectives, mainly based on the interactions’ duration.
3.3 Material
3.3.1 Interaction material
The data was collected during visits of the community pharmacies, and comprised of
observations of pharmacy professionals serving patients. The data collection material
used for each participant was a filled-in observation formulary, which describes the
interactions between each community pharmacy worker and their patients (Annex 1).
The development of the formulary used to register the observations involved
consulting a head of pharmacy and considering the main activities that go on during
an encounter between the pharmacy professionals and the patients.
The functionality of the formulary was tested by doing two days of pilot observations
in a community pharmacy in Almada, Portugal. In this pilot observation three
pharmacists and two technical assistants were observed for 30 minutes each, for a
total of two times per professional during two different days. After the pilot, the form
was adapted to be more functional and also included other parameters that were not
initially considered. In addition to the standard parameters, relevant notes about the
encounters were made during the episodes in the “Notes” field. Such notes could
include e.g. whether there was no sale and just a question from the patient, or if a
POM medication was dispensed without a prescription as so-called “continuous
treatment”.
The final observation formulary included the following parameters to be filled in
during the observation of each encounter (see also Annex 1 for the form):
- Total interaction duration
- Patient information: Age group (divided in young adult (<35)/adult (35-65)/mature
adult (>65)), gender (female/male) and ethnicity (Caucasian/non-Caucasian)
27
- Number of prescriptions, and whether they were single use prescriptions or
repetitive use prescriptions
- Number of packages of POM dispensed
- Number of packages of OTC medicines dispensed
- Number of other products sold (those not classified as medicines)
- Whether the patient was given oral counselling by the observed staff
- Whether personalised written information was given (mainly handwritten)
- Whether there was eye contact during the counselling
- Whether pharmacy services were provided, and which kind (such as blood pressure
measurement, cholesterol measurement, vaccine administration)
Some of these variables are related to pharmacy dispensing procedures, such as
number of prescriptions and packages.
The patient characteristic “ethnicity” was included in the observation form in order to
investigate whether the duration of the encounters varied with ethnicity. No distinction
was made between non-Caucasians.
3.3.2 Job satisfaction material
In order to assess the community pharmacy professionals’ job satisfaction, the
materials used comprised of a self-administered Job Satisfaction questionnaire,
which was distributed to the individuals that were observed (Annex 2).
The questionnaire was based on the Overall Job Satisfaction Scale developed by
Warr, Cook and Wall in 1979 (71). The scale collects the affective response to the
content of the work itself and reflects the job satisfaction of staff in paid employment.
It is considered short and robust, and employees are able to complete it
independently from their background or area of work (72).
This questionnaire type was chosen for this study not only because it is a commonly
used job satisfaction questionnaire, but also since it has already been used for
28
pharmacists (58). It is a fast and easy-to-use questionnaire, which was very
important in this study due to being used in a practicing environment. Since it deals
with job satisfaction for any profession, it was more appropriate to work with this
questionnaire in this study rather than other larger, pharmacist-specific instruments
(73), in addition to this study’s aims of comparison between the different
professionals working in community pharmacies. This questionnaire was already
translated into Portuguese, so it was not necessary to do cultural and linguistic
validations (74).
The questionnaire consisted of questions concerning the professionals’ job
satisfaction, each question having a Likert scale anchored at 1-“Very dissatisfied” to
7-“Very satisfied”, according to the professionals’ degree of satisfaction with different
aspects of their job.
The different questions to rate the community pharmacy professionals’ job
satisfaction were:
1. Physical conditions of the workplace
2. Freedom to choose your own method of work
3. Colleagues
4. Recognition obtained for well done work
5. Supervisor
6. Responsibility assigned
7. Salary received
8. Possibility to use your skills
9. Relationship between management and employees in your company
10. Possibility for promotion of your career
11. Organization and management of the company
12. Attention paid to suggestions made by you
13. Work hours
14. Variety of tasks performed
29
15. Stability in employment
16. Overall satisfaction
The questionnaire addresses both intrinsic and extrinsic aspects of the working
conditions. The intrinsic subpart of the scale deals with questions such as the
recognition gained through the work, responsibility, promotion and aspects of task
content (question number 2, 4, 6, 8, 10, 12 and 14). The extrinsic subpart addresses
the employee’s satisfaction with aspects of the organisation of the work, such as
salary, work hours and physical conditions of the workplace (question number 1, 3, 5,
7, 9, 11, 13, 15).
The variables that were included in the questionnaire and have relevance for this
assignment can be found in Annex 4. These variables have already been published
in the literature (72).
3.3.3 Administrative material
Administrative data regarding each community pharmacy was also registered. This
collected data consisted of the following information:
- Name of the pharmacy
- Number of staff (pharmacists/technical assistants/other personnel)
- Opening hours
- Location (urban/suburban, street pharmacy/shopping mall)
- Area of the pharmacy (m2, approximate)
- Volume (average number of registered sales per day during one month)
- Robot (yes/no, type of dispensing robot)
- Consultation room (yes/no)
- Type of pharmacy services that the pharmacy offers
30
3.4 Methods
3.4.1 Interaction data
The interaction data was collected through non-participant, overt fieldwork
observation. Data collected through observations were recorded in the pre-
determined formulary (Annex 1) during the observation period, where the possibility
of writing more detailed notes was included.
Each observation period consisted of 30 minutes per professional, and in case the
last interaction went past the 30 minutes, the observation continued until the end of
that interaction. Therefore, both the initiation time and end time was noted down in
order to record the total observation duration. It was assumed that this interval was
enough to register professionals’ main activities at the pharmacy, however each
pharmacy professional was observed for two periods of 30 minutes over two days.
This was done not to compare the first period with the second, but in order to ensure
a better representativeness from the work of the pharmacy professionals. When
possible, the first period and the second period were observed during different times
of the opening hours of the pharmacy, preferably in the morning and in the afternoon.
The pharmacy professionals that participated in the study were informed individually
on beforehand regarding what was going to happen during the 30 minutes of
observation. All questions were answered in order to have the participants’ informed
consent (described in section 3.5). In order to avoid any Hawthorne effects (75) in the
overt observation, extra care was taken with the assumed position while collecting
the data, with the most discrete position for both professionals and patients, not
interfering with the consultations or the dispensing process.
After the observation period of 30 minutes, the computer records were consulted in
order to double check the registered amounts of prescriptions, and the number of
POMs, OTCs and other products that were dispensed per encounter.
As required by the study protocol (Annex 3), the pharmacy professionals were asked
to inform the patients about the study. Although some bias might have been
31
introduced in the patients’ behaviour, the focus of analysis here were the
professionals.
The observations included were only those where it was possible to identify one-to-
one communication between the pharmacy staff and the patient, being excluded any
interactions with couples and over the phone as well as interactions between the
pharmacy staff.
The interaction data was collected in order to answer to the objectives 1-5, 7 and 8 of
this study.
3.4.2 Job satisfaction data
The job satisfaction questionnaire was distributed to the pharmacy professionals that
were included in the study in an envelope during the first day of observations, and
the closed envelope with the questionnaire replies was collected latest on the second
day. To avoid any bias related to supervisor/owner or colleague influence at the
pharmacy, the professionals were asked to fill it in when they had privacy.
The questionnaire was distributed to the observed pharmacy professionals in order to
answer objectives 6-8 in this study.
3.4.3 Administrative data
The administrative data was collected by interview of the pharmacy owner or
manager. This took place during the first visit for interaction data collection.
3.5 Ethical approval The study has been approved through IRB (Institutional Review Board approval) at
the Faculty of Pharmacy, University of Lisbon, Portugal, and the study purpose and
methods were made available for the Portuguese Pharmaceutical Society. All data
are stored and processed strictly confidential and made anonymous and will be
eliminated 6 months after paper publication.
32
Each professional was presented with an information letter written in Portuguese
describing the purpose and content of the research that was to be done in advance
of the observation start. It was signed and dated showing their consent to participate
in the study.
3.6 Data processing The data was entered manually into an Excel spread sheet and tested for data entry
quality by a simple random sampling. Once confirmed, this was imported to a PASW
database.
The data processing has been conducted through use of PASW Statistics version
19.0 (Chicago, IL, 2011), previously Statistical Package for Social Sciences (SPSS).
The significance level for all statistical tests was set to p<0.05.
While the focus of analysis was each interaction from individual pharmacy
professionals, the participants’ features were also analysed. Besides descriptive
statistics (e.g. frequencies, median, min/max values), bivariate tests have been used
such as the Student t-Test, One-Way Analysis of Variance (ANOVA) as well as
measures of statistical association e.g. non-parametric correlations (Spearman’s
rho).
33
4 Results
4.1 Community pharmacy characterization
Eleven community pharmacies participated in this study. At the beginning, six
pharmacies with automation were identified, with the same category of automation
(both dispensing and storage), together with six “loosely” paired pharmacies without
automation. In the end, five out of the six pharmacies without automation were visited
for data collection, with one drop-out related to last minute refusal to participate. Time
constraints and other lack of resources did not allow for replacement with an
equivalent pharmacy. However, all pharmacies with non-automation matched at least
one automation pharmacy.
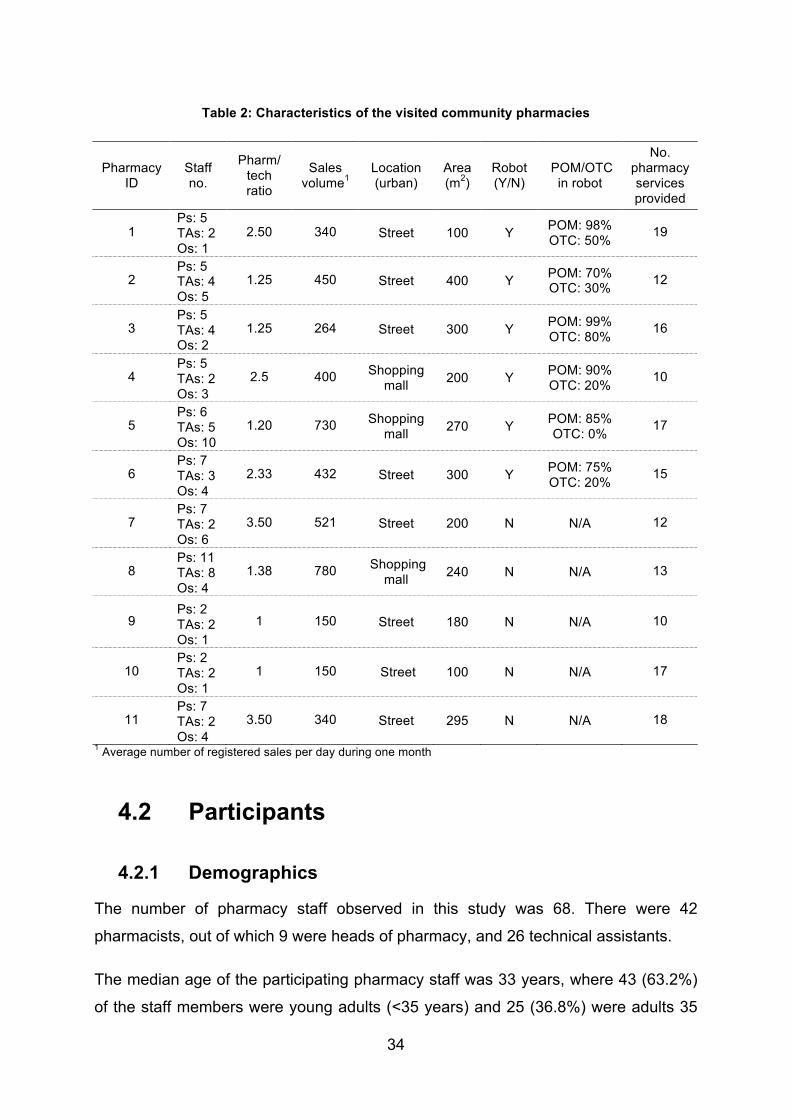
Table 2 shows the administrative data that was collected from each community
pharmacy. It shows the amount of staff in each pharmacy, where “Other staff” (Os)
represents those who are neither pharmacists (Ps) nor technical assistants (TAs)
(e.g. cleaning personnel or beauty therapists).
In Annex 5, the total overview of pharmacy services provided by each pharmacy can
be found. Considered all services identified, in total 35, this sample represented a
minimum of 10 different services and a maximum of 19. The pharmacy services most
commonly provided were measuring of blood glucose, cholesterol (including HDL, or
High-density lipoprotein), triglycerides, uric acid, blood pressure and BMI (Body Mass
Index), immunizations, vaccines and injectable medicines administration, as well as
nutrition consultations.
Eight of the community pharmacies were high street pharmacies (four with
automation), and three of them were located in shopping malls (two with automation).
The “loose” match between pharmacies with and without automation was based on a
combination of the pharmacy staff and the sales volume.
34
Table 2: Characteristics of the visited community pharmacies
Pharmacy ID
Staff no.
Pharm/ tech ratio
Sales volume1
Location (urban)
Area (m2)
Robot (Y/N)
POM/OTC in robot
No. pharmacy services provided
1 Ps: 5 TAs: 2 Os: 1
2.50 340 Street 100 Y POM: 98% OTC: 50% 19
2 Ps: 5 TAs: 4 Os: 5
1.25 450 Street 400 Y POM: 70% OTC: 30% 12
3 Ps: 5 TAs: 4 Os: 2
1.25 264 Street 300 Y POM: 99% OTC: 80% 16
4 Ps: 5 TAs: 2 Os: 3
2.5 400 Shopping mall 200 Y POM: 90%
OTC: 20% 10
5 Ps: 6 TAs: 5 Os: 10
1.20 730 Shopping mall 270 Y POM: 85%
OTC: 0% 17
6 Ps: 7 TAs: 3 Os: 4
2.33 432 Street 300 Y POM: 75% OTC: 20% 15
7 Ps: 7 TAs: 2 Os: 6
3.50 521 Street 200 N N/A 12
8 Ps: 11 TAs: 8 Os: 4
1.38 780 Shopping mall 240 N N/A 13
9 Ps: 2 TAs: 2 Os: 1
1 150 Street 180 N N/A 10
10 Ps: 2 TAs: 2 Os: 1
1 150 Street 100 N N/A 17
11 Ps: 7 TAs: 2 Os: 4
3.50 340 Street 295 N N/A 18
1 Average number of registered sales per day during one month
4.2 Participants
4.2.1 Demographics
The number of pharmacy staff observed in this study was 68. There were 42
pharmacists, out of which 9 were heads of pharmacy, and 26 technical assistants.
The median age of the participating pharmacy staff was 33 years, where 43 (63.2%)
of the staff members were young adults (<35 years) and 25 (36.8%) were adults 35
35
to 65 years old. The minimum age was 24 years, and the maximum was 54 years.
The professional sub-group with the lowest average age was the pharmacists
(median=28 years), followed by the heads of pharmacy (median=34 years) while the
technical staff comprised of the group with the highest average age (median=38
years).
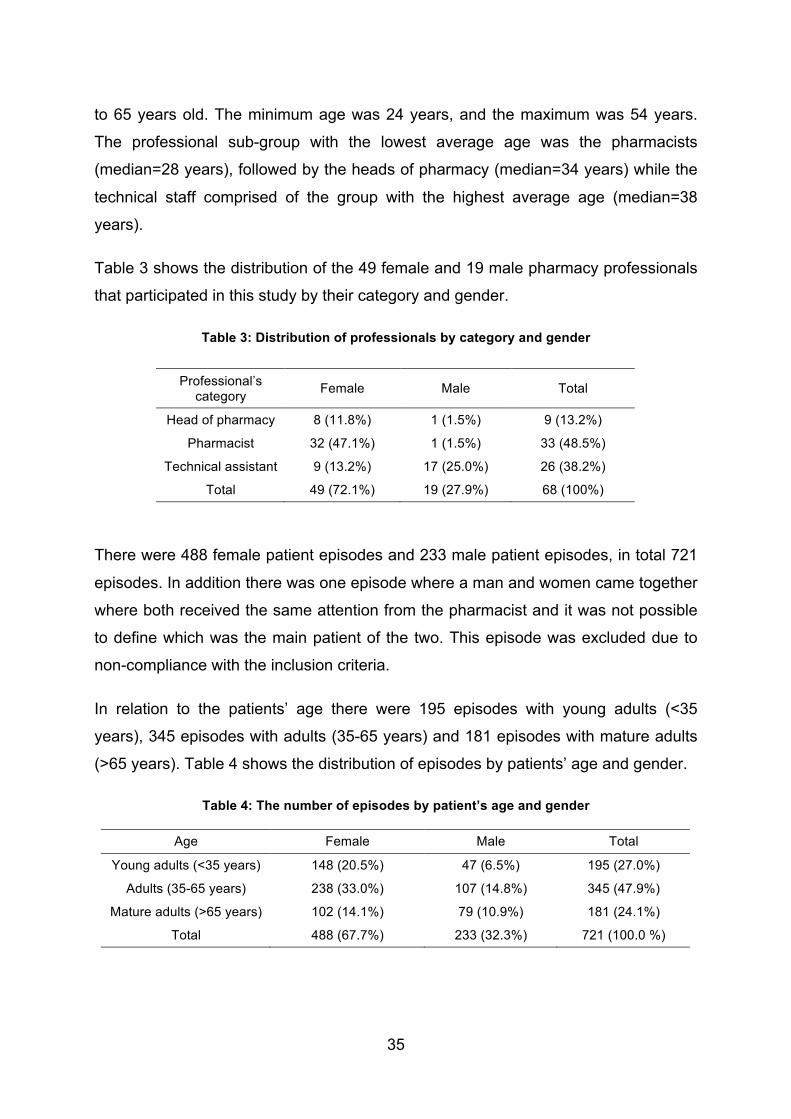
Table 3 shows the distribution of the 49 female and 19 male pharmacy professionals
that participated in this study by their category and gender.
Table 3: Distribution of professionals by category and gender
Professional’s category Female Male Total
Head of pharmacy 8 (11.8%) 1 (1.5%) 9 (13.2%)
Pharmacist 32 (47.1%) 1 (1.5%) 33 (48.5%)
Technical assistant 9 (13.2%) 17 (25.0%) 26 (38.2%)
Total 49 (72.1%) 19 (27.9%) 68 (100%)
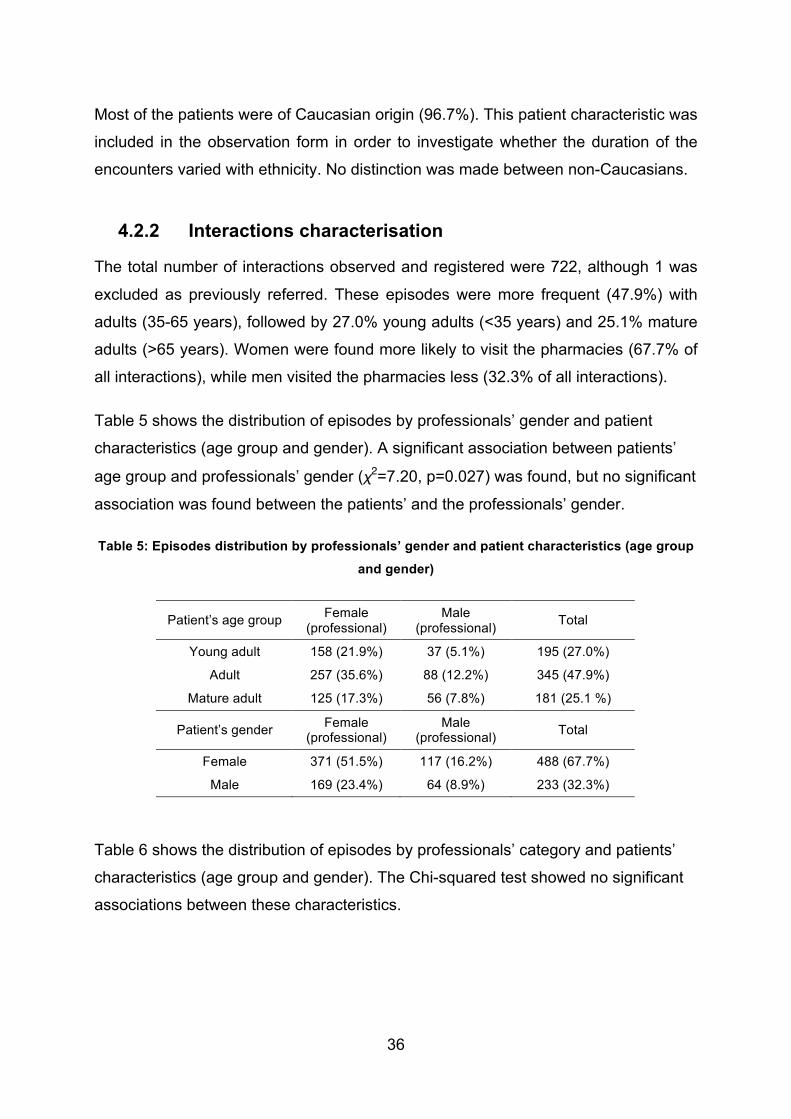
There were 488 female patient episodes and 233 male patient episodes, in total 721
episodes. In addition there was one episode where a man and women came together
where both received the same attention from the pharmacist and it was not possible
to define which was the main patient of the two. This episode was excluded due to
non-compliance with the inclusion criteria.
In relation to the patients’ age there were 195 episodes with young adults (<35
years), 345 episodes with adults (35-65 years) and 181 episodes with mature adults
(>65 years). Table 4 shows the distribution of episodes by patients’ age and gender.
Table 4: The number of episodes by patient’s age and gender
Age Female Male Total
Young adults (<35 years) 148 (20.5%) 47 (6.5%) 195 (27.0%)
Adults (35-65 years) 238 (33.0%) 107 (14.8%) 345 (47.9%)
Mature adults (>65 years) 102 (14.1%) 79 (10.9%) 181 (24.1%)
Total 488 (67.7%) 233 (32.3%) 721 (100.0 %)
36
Most of the patients were of Caucasian origin (96.7%). This patient characteristic was
included in the observation form in order to investigate whether the duration of the
encounters varied with ethnicity. No distinction was made between non-Caucasians.
4.2.2 Interactions characterisation
The total number of interactions observed and registered were 722, although 1 was
excluded as previously referred. These episodes were more frequent (47.9%) with
adults (35-65 years), followed by 27.0% young adults (<35 years) and 25.1% mature
adults (>65 years). Women were found more likely to visit the pharmacies (67.7% of
all interactions), while men visited the pharmacies less (32.3% of all interactions).
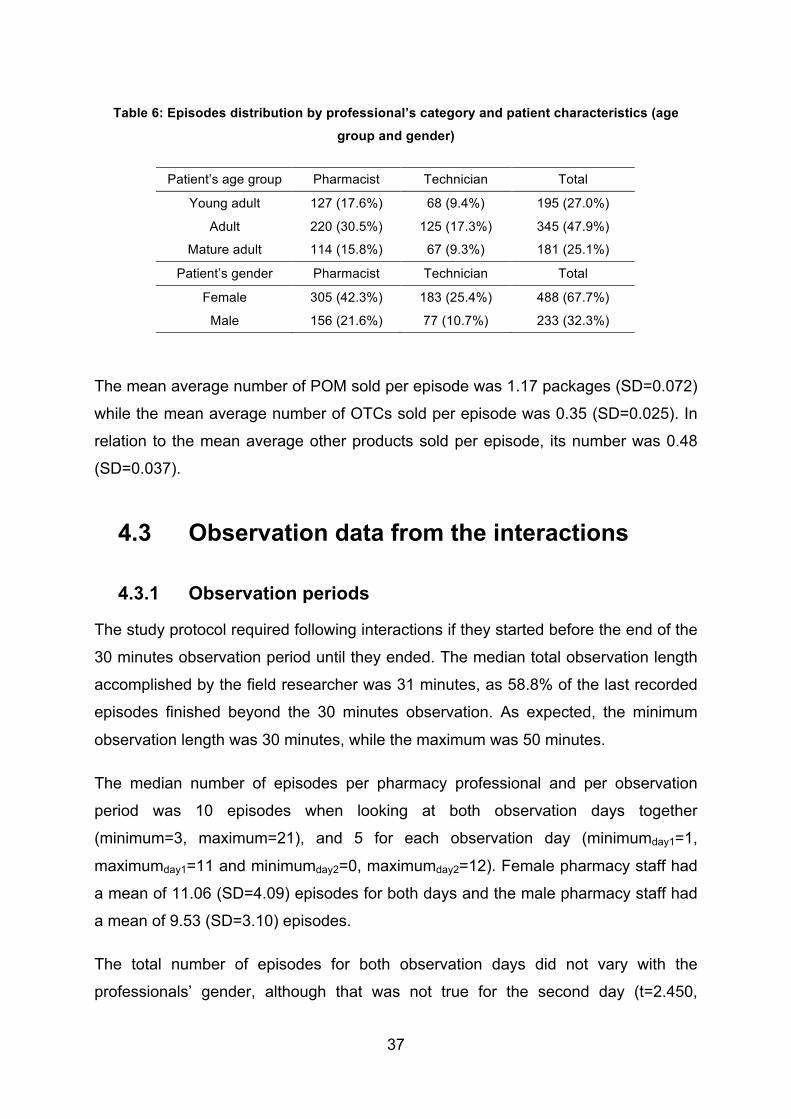
Table 5 shows the distribution of episodes by professionals’ gender and patient
characteristics (age group and gender). A significant association between patients’
age group and professionals’ gender (χ2=7.20, p=0.027) was found, but no significant
association was found between the patients’ and the professionals’ gender.
Table 5: Episodes distribution by professionals’ gender and patient characteristics (age group
and gender)
Patient’s age group Female (professional)
Male (professional) Total
Young adult 158 (21.9%) 37 (5.1%) 195 (27.0%)
Adult 257 (35.6%) 88 (12.2%) 345 (47.9%)
Mature adult 125 (17.3%) 56 (7.8%) 181 (25.1 %)
Patient’s gender Female (professional)
Male (professional) Total
Female 371 (51.5%) 117 (16.2%) 488 (67.7%)
Male 169 (23.4%) 64 (8.9%) 233 (32.3%)
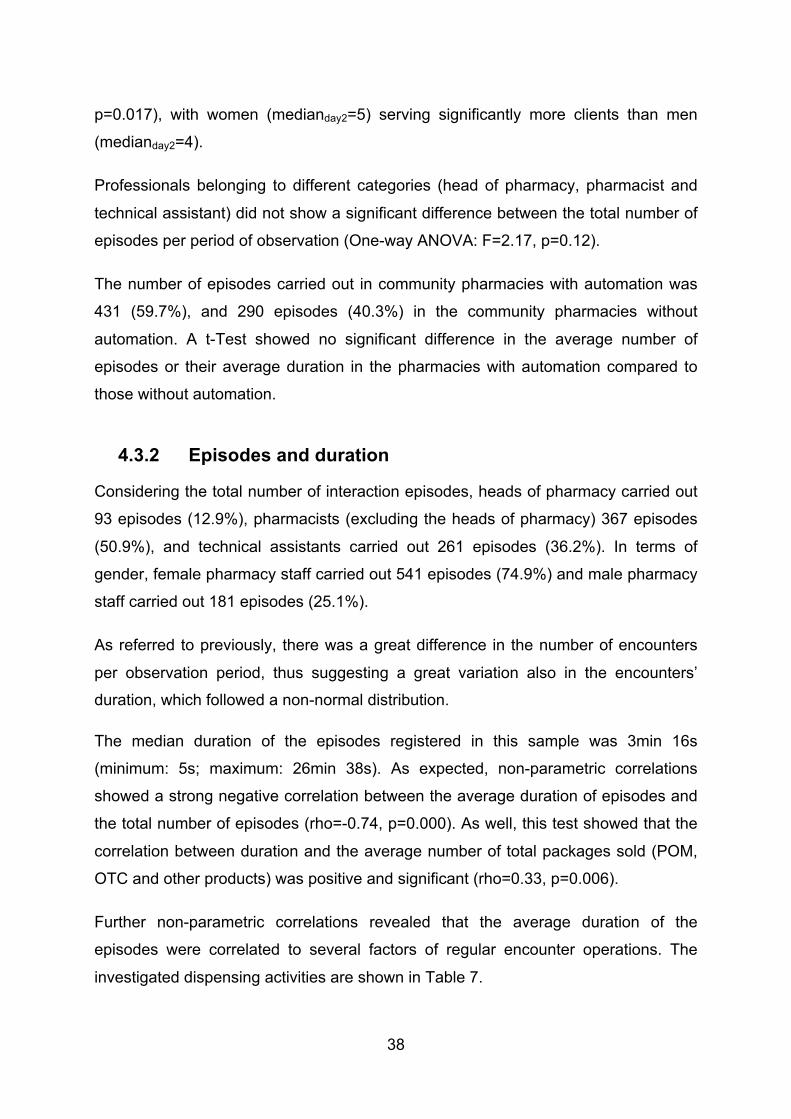
Table 6 shows the distribution of episodes by professionals’ category and patients’
characteristics (age group and gender). The Chi-squared test showed no significant
associations between these characteristics.
37
Table 6: Episodes distribution by professional’s category and patient characteristics (age
group and gender)
Patient’s age group Pharmacist Technician Total
Young adult 127 (17.6%) 68 (9.4%) 195 (27.0%)
Adult 220 (30.5%) 125 (17.3%) 345 (47.9%)
Mature adult 114 (15.8%) 67 (9.3%) 181 (25.1%)
Patient’s gender Pharmacist Technician Total
Female 305 (42.3%) 183 (25.4%) 488 (67.7%)
Male 156 (21.6%) 77 (10.7%) 233 (32.3%)
The mean average number of POM sold per episode was 1.17 packages (SD=0.072)
while the mean average number of OTCs sold per episode was 0.35 (SD=0.025). In
relation to the mean average other products sold per episode, its number was 0.48
(SD=0.037).
4.3 Observation data from the interactions
4.3.1 Observation periods
The study protocol required following interactions if they started before the end of the
30 minutes observation period until they ended. The median total observation length
accomplished by the field researcher was 31 minutes, as 58.8% of the last recorded
episodes finished beyond the 30 minutes observation. As expected, the minimum
observation length was 30 minutes, while the maximum was 50 minutes.
The median number of episodes per pharmacy professional and per observation
period was 10 episodes when looking at both observation days together
(minimum=3, maximum=21), and 5 for each observation day (minimumday1=1,
maximumday1=11 and minimumday2=0, maximumday2=12). Female pharmacy staff had
a mean of 11.06 (SD=4.09) episodes for both days and the male pharmacy staff had
a mean of 9.53 (SD=3.10) episodes.
The total number of episodes for both observation days did not vary with the
professionals’ gender, although that was not true for the second day (t=2.450,
38
p=0.017), with women (medianday2=5) serving significantly more clients than men
(medianday2=4).
Professionals belonging to different categories (head of pharmacy, pharmacist and
technical assistant) did not show a significant difference between the total number of
episodes per period of observation (One-way ANOVA: F=2.17, p=0.12).
The number of episodes carried out in community pharmacies with automation was
431 (59.7%), and 290 episodes (40.3%) in the community pharmacies without
automation. A t-Test showed no significant difference in the average number of
episodes or their average duration in the pharmacies with automation compared to
those without automation.
4.3.2 Episodes and duration
Considering the total number of interaction episodes, heads of pharmacy carried out
93 episodes (12.9%), pharmacists (excluding the heads of pharmacy) 367 episodes
(50.9%), and technical assistants carried out 261 episodes (36.2%). In terms of
gender, female pharmacy staff carried out 541 episodes (74.9%) and male pharmacy
staff carried out 181 episodes (25.1%).
As referred to previously, there was a great difference in the number of encounters
per observation period, thus suggesting a great variation also in the encounters’
duration, which followed a non-normal distribution.
The median duration of the episodes registered in this sample was 3min 16s
(minimum: 5s; maximum: 26min 38s). As expected, non-parametric correlations
showed a strong negative correlation between the average duration of episodes and
the total number of episodes (rho=-0.74, p=0.000). As well, this test showed that the
correlation between duration and the average number of total packages sold (POM,
OTC and other products) was positive and significant (rho=0.33, p=0.006).
Further non-parametric correlations revealed that the average duration of the
episodes were correlated to several factors of regular encounter operations. The
investigated dispensing activities are shown in Table 7.
39
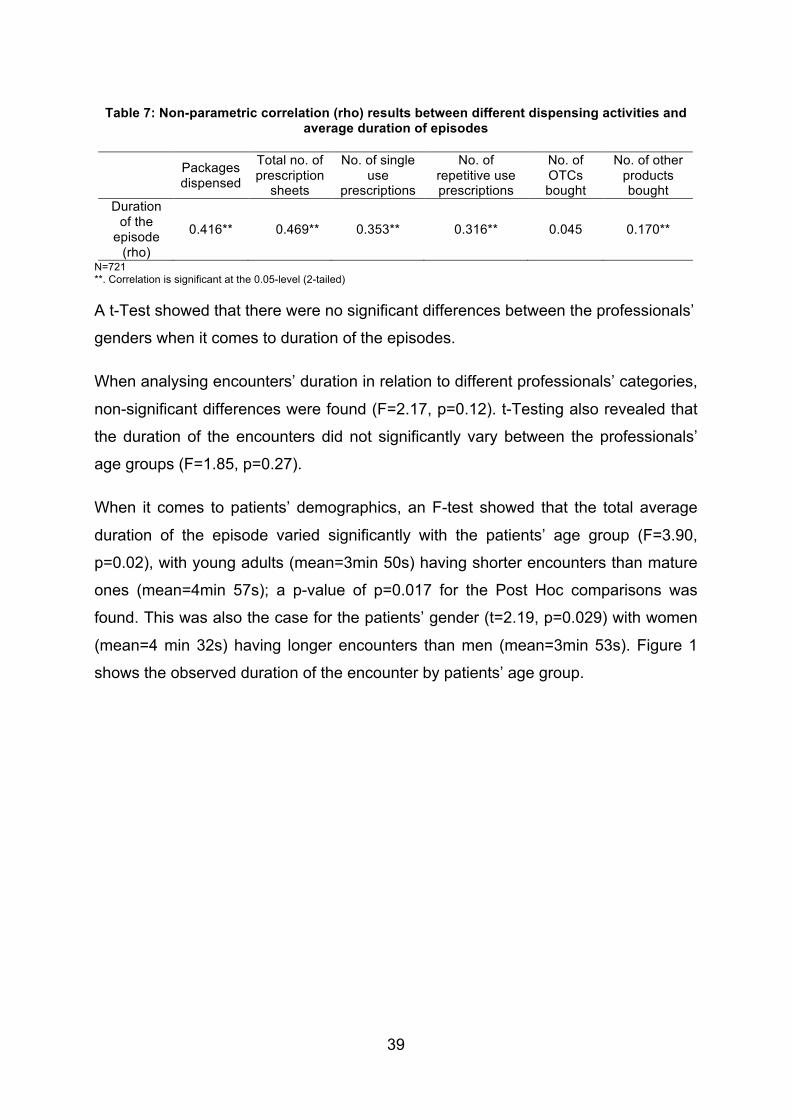
Table 7: Non-parametric correlation (rho) results between different dispensing activities and average duration of episodes
Packages dispensed
Total no. of prescription
sheets
No. of single use
prescriptions
No. of repetitive use prescriptions
No. of OTCs bought
No. of other products bought
Duration of the
episode (rho)
0.416** 0.469** 0.353** 0.316** 0.045 0.170**
N=721 **. Correlation is significant at the 0.05-level (2-tailed)
A t-Test showed that there were no significant differences between the professionals’
genders when it comes to duration of the episodes.
When analysing encounters’ duration in relation to different professionals’ categories,
non-significant differences were found (F=2.17, p=0.12). t-Testing also revealed that
the duration of the encounters did not significantly vary between the professionals’
age groups (F=1.85, p=0.27).
When it comes to patients’ demographics, an F-test showed that the total average
duration of the episode varied significantly with the patients’ age group (F=3.90,
p=0.02), with young adults (mean=3min 50s) having shorter encounters than mature
ones (mean=4min 57s); a p-value of p=0.017 for the Post Hoc comparisons was
found. This was also the case for the patients’ gender (t=2.19, p=0.029) with women
(mean=4 min 32s) having longer encounters than men (mean=3min 53s). Figure 1
shows the observed duration of the encounter by patients’ age group.
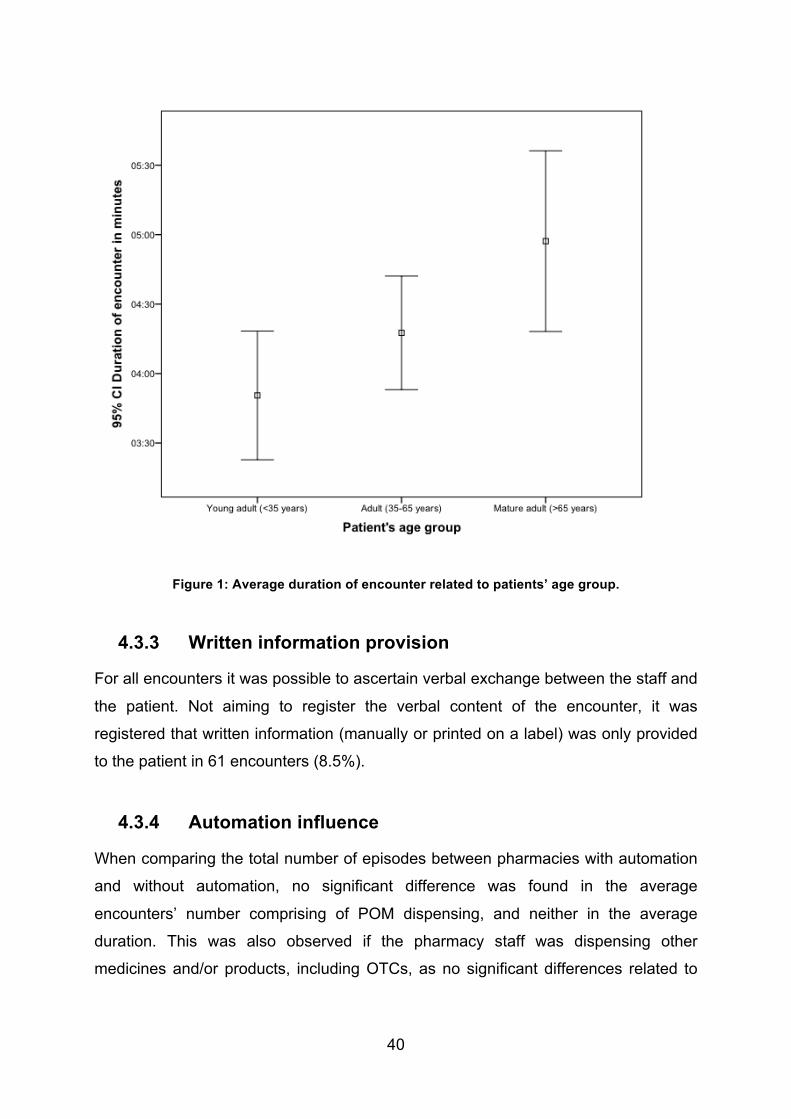
40
Figure 1: Average duration of encounter related to patients’ age group.
4.3.3 Written information provision
For all encounters it was possible to ascertain verbal exchange between the staff and
the patient. Not aiming to register the verbal content of the encounter, it was
registered that written information (manually or printed on a label) was only provided
to the patient in 61 encounters (8.5%).
4.3.4 Automation influence
When comparing the total number of episodes between pharmacies with automation
and without automation, no significant difference was found in the average
encounters’ number comprising of POM dispensing, and neither in the average
duration. This was also observed if the pharmacy staff was dispensing other
medicines and/or products, including OTCs, as no significant differences related to
41
the average duration of the episodes or their total number was found between
pharmacies with and without automation.
A t-Test showed that there was a significant difference (t=-2.211, p=0.031) between
the average number of packages sold in each episode at the pharmacies with a robot
(mean=2.19) and those without a robot (mean=1.78). There was however no
significant difference between the average duration of episodes in pharmacies with
and without a robot.
As expected, the average total packages sold per episode in the non-robot
pharmacies was significantly correlated to the average duration of episodes
(rho=0.48, p<0.01). By the contrary, in the robot pharmacies there was no significant
correlation between the average total packages sold per episode and the average
duration of episodes.
4.3.5 Customer service layout
The regular counter-based service was used during the encounter in 659 episodes
(91.4%), of which the customer and staff were seated during 36 episodes. There
were 41 episodes (5.7%) at an express counter, which was used in one of the
pharmacies. Three of the sampled pharmacies offered a service called FarmaDrive,
resulting in 20 observations (2.8%) of this type of encounter. Finally, 1 episode
(0,1%) was carried out through the mail slot of a pharmacy.
When considering the different types of service layouts and their average episode
duration, no significant difference could be found (F=1.37 p=0.24).
4.3.6 Pharmacy services influence
There were 16 episodes (2.2%) including a pharmacy service. Of these, 12 included
blood pressure measuring, with the professional using either a digital or manual
sphygmomanometer. There were 3 blood glucose measures, 1 cholesterol measure,
1 BMI measure by machine and 1 weighing of a baby. Some of these occurred
simultaneously (during the same episode). Table 8 shows the distribution of services,
individually and combined, provided during the encounters.
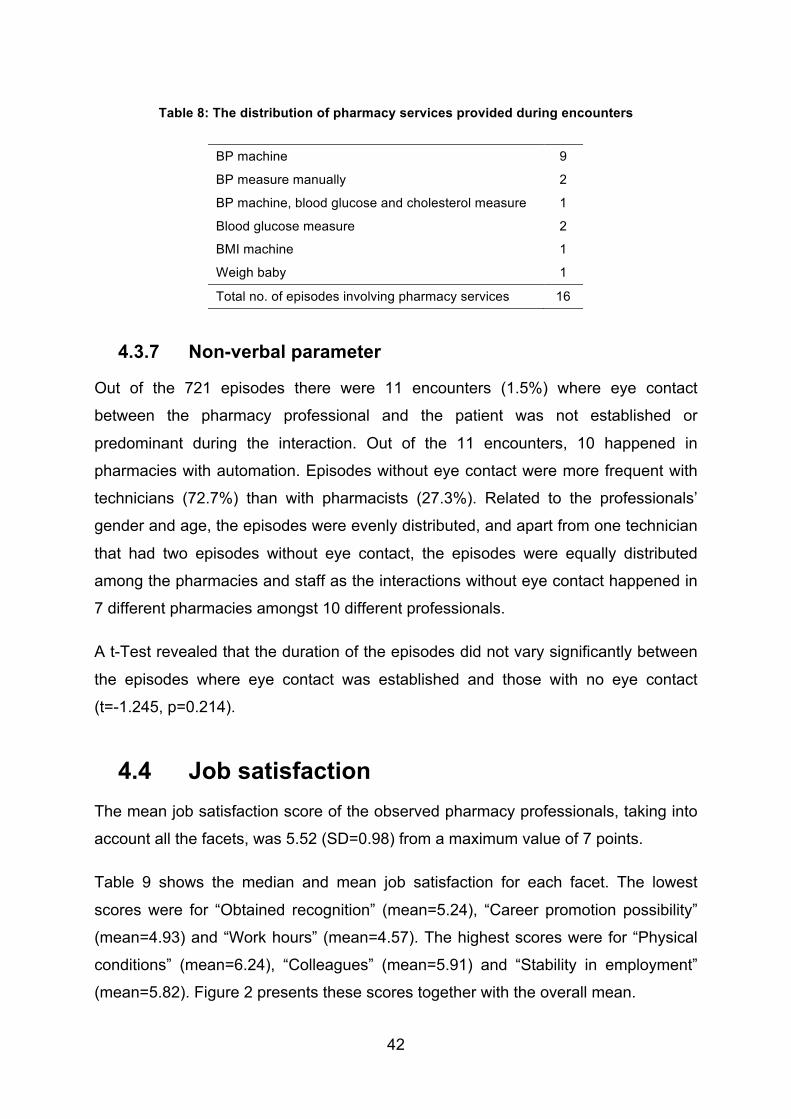
42
Table 8: The distribution of pharmacy services provided during encounters
BP machine 9
BP measure manually 2
BP machine, blood glucose and cholesterol measure 1
Blood glucose measure 2
BMI machine 1
Weigh baby 1
Total no. of episodes involving pharmacy services 16
4.3.7 Non-verbal parameter
Out of the 721 episodes there were 11 encounters (1.5%) where eye contact
between the pharmacy professional and the patient was not established or
predominant during the interaction. Out of the 11 encounters, 10 happened in
pharmacies with automation. Episodes without eye contact were more frequent with
technicians (72.7%) than with pharmacists (27.3%). Related to the professionals’
gender and age, the episodes were evenly distributed, and apart from one technician
that had two episodes without eye contact, the episodes were equally distributed
among the pharmacies and staff as the interactions without eye contact happened in
7 different pharmacies amongst 10 different professionals.
A t-Test revealed that the duration of the episodes did not vary significantly between
the episodes where eye contact was established and those with no eye contact
(t=-1.245, p=0.214).
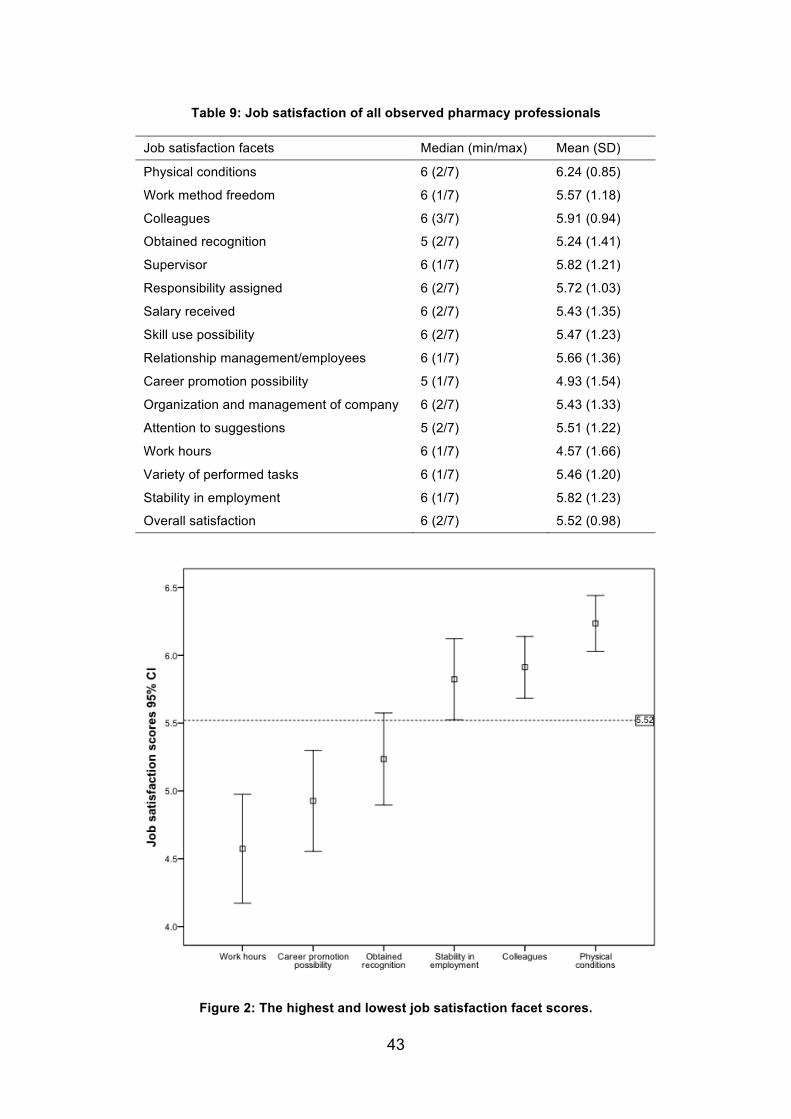
4.4 Job satisfaction The mean job satisfaction score of the observed pharmacy professionals, taking into
account all the facets, was 5.52 (SD=0.98) from a maximum value of 7 points.
Table 9 shows the median and mean job satisfaction for each facet. The lowest
scores were for “Obtained recognition” (mean=5.24), “Career promotion possibility”
(mean=4.93) and “Work hours” (mean=4.57). The highest scores were for “Physical
conditions” (mean=6.24), “Colleagues” (mean=5.91) and “Stability in employment”
(mean=5.82). Figure 2 presents these scores together with the overall mean.
43
Table 9: Job satisfaction of all observed pharmacy professionals
Job satisfaction facets Median (min/max) Mean (SD)
Physical conditions 6 (2/7) 6.24 (0.85)
Work method freedom 6 (1/7) 5.57 (1.18)
Colleagues 6 (3/7) 5.91 (0.94)
Obtained recognition 5 (2/7) 5.24 (1.41)
Supervisor 6 (1/7) 5.82 (1.21)
Responsibility assigned 6 (2/7) 5.72 (1.03)
Salary received 6 (2/7) 5.43 (1.35)
Skill use possibility 6 (2/7) 5.47 (1.23)
Relationship management/employees 6 (1/7) 5.66 (1.36)
Career promotion possibility 5 (1/7) 4.93 (1.54)
Organization and management of company 6 (2/7) 5.43 (1.33)
Attention to suggestions 5 (2/7) 5.51 (1.22)
Work hours 6 (1/7) 4.57 (1.66)
Variety of performed tasks 6 (1/7) 5.46 (1.20)
Stability in employment 6 (1/7) 5.82 (1.23)
Overall satisfaction 6 (2/7) 5.52 (0.98)
Figure 2: The highest and lowest job satisfaction facet scores.
44
Through t-Tests it was shown that there was no significant differences in the overall
job satisfaction between the professionals’ genders (t=-1.494, p=0.140) and between
the professionals’ category (t=-1.904, p=0.610). A t-Test checking the facets
separately revealed significant differences between female and male professionals
on “Work method freedom” (t=-2.403, p=0.019) and “Relationship
management/employees” (t=-2.132, p=0.037), where the men rated their satisfaction
higher.
The facets that showed significant differences in the mean scores between
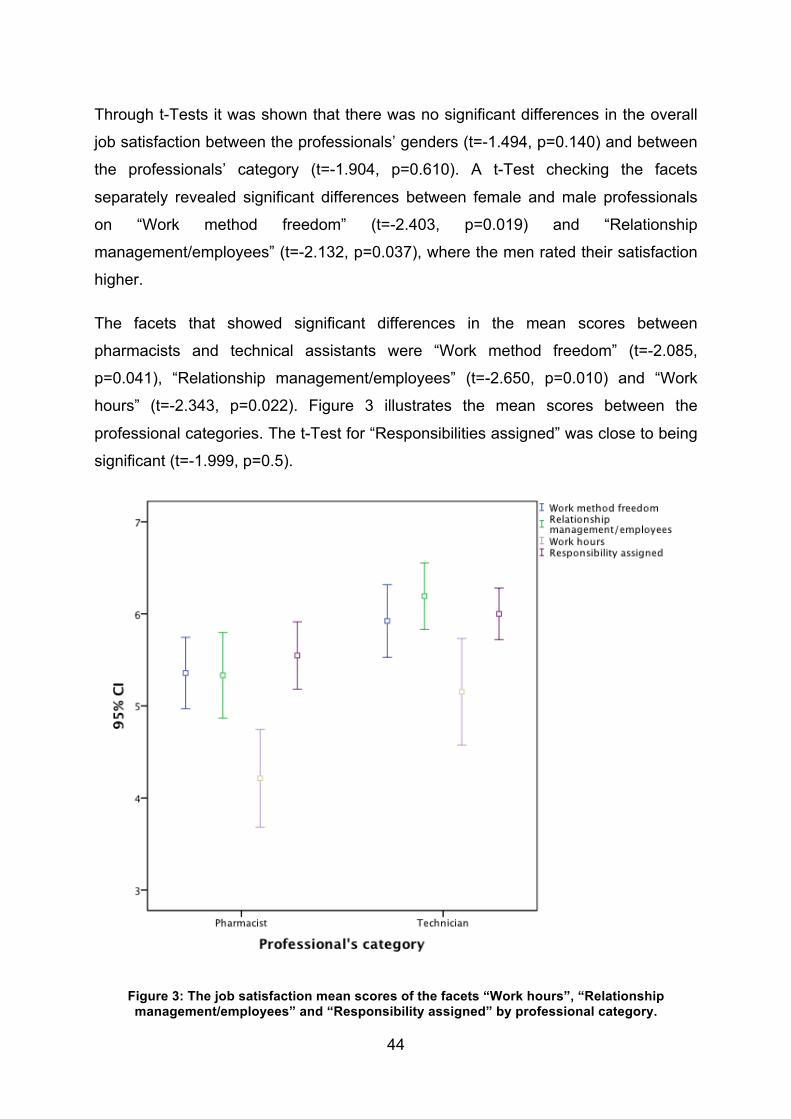
pharmacists and technical assistants were “Work method freedom” (t=-2.085,
p=0.041), “Relationship management/employees” (t=-2.650, p=0.010) and “Work
hours” (t=-2.343, p=0.022). Figure 3 illustrates the mean scores between the
professional categories. The t-Test for “Responsibilities assigned” was close to being
significant (t=-1.999, p=0.5).
Figure 3: The job satisfaction mean scores of the facets “Work hours”, “Relationship management/employees” and “Responsibility assigned” by professional category.
45
Further t-Tests showed that there was a significant difference (t=-2.730, p=0.010) in
overall satisfaction when looking to the age group of the professionals, where the
young adults (mean=5.21, SD=1.02) were significantly less satisfied than the adults
(mean=5.06, SD=0.82).
Job satisfaction facets were studied in relation to being employed in a pharmacy with
or without automation. A significant difference was found for the “Organization and
management of company” facet (t=2.250, p=0.028), where the professionals in the
non-automation pharmacies rated the facet higher.
Spearman’s non-parametric correlation revealed non-significant correlations between
the pharmacy staffs’ average duration of episodes and any of the satisfaction
parameters (neither faceted nor overall).
There was a significant correlation between the pharmacy staffs’ total number of
episodes and some of the facets of job satisfaction; “Relationship
management/employees” (rho=-0.281, p=0.020), “Work hours” (rho=-0.316, p=0.009)
and “Variety of performed tasks” (rho=-0.301, p=0.013).
Table 10 lists correlation results between the different facets of job satisfaction and
the average number of prescriptions, the average number of POM packages sold,
the average number of OTC packages sold and the average number of other
products sold. The significant values are put in bold type.
46
Table 10: Non-parametric results for correlation between different facets of job satisfaction and different observed parameters
Job satisfaction facet
Average no. of
prescriptions
Average no. of POM packages
Average no. of OTC
Average no. of other
products sold Sig (p) 0.112 0.012 0.623 0.268
Physical conditions Correlation Coefficient (rho) -0.195 -0.302 -0.623 -0.136
Sig (p) 0.026 0.001 0.156 0.134 Work method freedom Correlation
Coefficient (rho) -0.270 -0.391 -0.174 -0.183
Sig (p) 0.008 0.006 0.531 0.550 Colleagues Correlation
Coefficient (rho) -0.321 -0.333 -0.077 0.074
Sig (p) 0.015 0.000 0.215 0.162 Obtained recognition Correlation
Coefficient (rho) -0.293 -0.466 0.152 -0.172
Sig (p) 0.005 0.000 0.937 0.075 Supervisor Correlation
Coefficient (rho) -0.338 -0.429 0.010 -0.219
Sig (p) 0.001 0.001 0.771 0.733 Responsibility assigned Correlation
Coefficient (rho) -0.383 -0.387 0.036 -0.042
Sig (p) 0.104 0.007 0.447 0.091 Salary received Correlation
Coefficient (rho) -0.199 -0.324 -0.094 -0.207
Sig (p) 0.063 0.010 0.302 0.010 Skill use possibility Correlation
Coefficient (rho) -0.226 -0.310 0.127 -0.310
Sig (p) 0.034 0.001 0.920 0.330 Relationship management/employees Correlation
Coefficient (rho) -0.257 -0.385 -0.012 -0.120
Sig (p) 0.054 0.004 0.327 0.216 Career promotion possibility Correlation
Coefficient (rho) -0.235 -0.345 0.121 -0.152
Sig (p) 0.356 0.054 0.861 0.265 Organization and management of company Correlation
Coefficient (rho) -0.114 -0.234 -0.022 -0.137
Sig (p) 0.143 0.007 0.141 0.289 Attention to suggestions Correlation
Coefficient (rho) -0.180 -0.327 0.180 -0.130
Sig (p) 0.185 0.017 0.781 0.490 Work hours Correlation
Coefficient (rho) -0.163 -0.289 0.034 -0.085
Sig (p) 0.125 0.035 0.994 0.447 Variety of performed tasks Correlation
Coefficient (rho) -0.188 -0.257 0.001 -0.094
Sig (p) 0.351 0.114 0.807 0.034 Stability in employment Correlation
Coefficient (rho) -0.115 -0.194 -0.030 -0.258
Sig (p) 0.016 0.000 0.854 0.090 Overall satisfaction Correlation
Coefficient (rho) -0.293 -0.430 0.023 -0.209
47
Significant negative correlation results were obtained between overall satisfaction
and the average number of prescriptions per encounter (rho=-0.293, p=0.016). This
was also the case between the overall satisfaction and the average number of POM
packages dispensed per encounter (rho=-0.430, p<0.01). There was no significant
correlation between overall satisfaction and the average number of OTCs sold per
encounter (rho=0.023, p=0.854), and the overall satisfaction and the average number
of other products sold (rho=-0.209, p=0.090).
Following the trend observed in Table 10, where all significant correlations were of
negative value, the correlation between the overall job satisfaction and the number of
pharmacy services the community pharmacies provide was also negative
(rho=-0.292, p=0.016).
There was no significant correlation found between the registered sales volume per
day and the overall satisfaction.
Demographics of the patient group (average age and gender) did not show any
correlation with the overall job satisfaction.
48
5 Discussion Community pharmacies with automation are pharmacies where a substantial
investment has been done technology-wise in order to increase the standard of the
pharmacy. If assuming that the community pharmacies with automation are more
technically developed than the pharmacies without automation, one could also think
that the pharmacy services provided in the pharmacies with automation would be
more advanced, as each pharmacy is free to decide which kind of pharmacy services
they would like to provide. As seen in Table 2, the pharmacies with automation did
not have a greater variety of offered pharmacy services in general.
5.1 Professionals-patients interactions
5.1.1 Episodes
The number of episodes in both observation periods, i.e. their density, was similar on
average. This might suggest a constant influx of patients and a stable work rate. If
the patient influx is not constant, for instance following daily cycles (e.g. the patients’
working and break hours, periods to commute from workplace to home and vice-
versa), then it might be suggested that pharmacies have a constant work rate, thus
implying some waiting time before the patients are served. These are moments in
which the patient is not interacting with pharmacy professionals, but already exposed
to the pharmacy environment. These occasions can be used for conveying public
health messages and other healthcare related information. In all pharmacies visited
there was a TV flat screen, from which the patients would receive these messages
while waiting to be served. Health messages through such media can aid in
achieving positive health outcomes, as seen in Australia through positive changes in
consumer attitudes, beliefs and behaviours to the appropriate use of antibiotics for
Upper Respiratory Tract Infections (76).
This study was, however, looking at moments where patients interact with the
pharmacy professionals. These professional-patient encounters are the essence of
49
the pharmacy profession, since medication preparation is no longer the main role of
today’s pharmacists (77).
This study has shown that heads of pharmacy, pharmacists and technical assistants
have the same average duration when encountering with patients. This brings up
questions, not only related to whether sufficient counselling is provided, but also if
pharmacists are providing patients with more than just medication use information.
Pharmacists have a more extensive education than the technical assistants, and
should engage in counselling patients, not only in dispensing medication and one-
way information (9,61).
As seen from previous studies evaluating patients’ perception of time spent with
Primary Care Physicians (PCPs) in ambulatory practice, the PCPs estimated patient
satisfaction was significantly lower when they felt rushed. However, when looking at
the patients’ perspective, the patient satisfaction was identical for when the PCPs did
or did not feel rushed. The patients indicated that PCPs appeared rushed in 3% of
the encounters, but this perception did not affect their satisfaction (28). The question
is whether this is applicable to the patients’ perception of shorter episodes in a
community pharmacy setting, but as this study did not investigate the patients’
satisfaction with the episodes, this could be looked at in later studies.
Common knowledge about clients of community pharmacies says that chronic and
poly-medicated patients are those who visit pharmacies the most. Usually these are
aged patients and results from this study confirm a significant difference of episode
duration between age groups. Pharmacy professionals spend significantly more time
on encounters with older patients than younger patients. In this sense, our study
patient population was not biased. The longer interactions with elderly patients than
younger patients can result not only from a higher number of dispensed medicines,
but also from the time pharmacy professionals spend on counselling these older
patients, in order to ensure that the patient is concordant, i.e. that the patient has
understood and accepted treatment directions. Additionally, some cognitive
impairment may play a role in extending encounters with senior patients. This is in
accordance with results found in previous studies (38). In addition, greater encounter
duration was found for female patients, which also confirms results from previous
studies of interaction duration (38-40).
50
What has been referred to in the previous paragraph was confirmed by the positive
correlation between duration of the episodes and the number of packages sold.
Although these results were expected, as a higher number of packages would
suggest more time needed for both dispensing and counselling of the patient, it
would have been interesting if such correlation would be weaker, particularly for
pharmacists. This would indicate that the interaction time could be influenced by
other factors, such as patient counselling only, i.e. pharmacists’ provision of cognitive
services beyond the actual medicines being dispensed.
5.1.2 Non-verbal communication variable
The content of the verbal communication between the healthcare professionals and
patients has not been investigated in this study. Although the content of the
exchange is a major component when analyzing professional-patient communication,
there are several reasons not to have investigated the content of the conversations
between the HCPs and the patients in this study context.
First, it is believed that higher education in pharmacy in Portugal is providing
students (the future professionals) with knowledge about what the actual content of
the communication with patients should be (61). Secondly, it is known that non-verbal
communication is not taught to a great extent through pharmacy higher education, as
the effort given to teach the students the content is much bigger than the effort given
to the issue of how the content should be presented to the patients (i.e. the use of
communication skills). As training students in communication skills is not developed
in most universities, and as there are not many communication skills courses that
train pharmacy professionals in non-verbal communication, this seemed an
interesting subject to look at in the encounter between the community pharmacy
professionals and the patients (61).
A third reason is related to the data collection methods. If wanting to examine the
content of the verbal communication, the encounters would have to be videotaped, or
at least tape-recorded, and this requires additional ethical approval. Registering the
exchange content by observation in real-time situations is difficult due to the non-
interfering limitation and the impossibility to “go back” in case part of the content is
lost. Data analysis is also easier when non-verbal factors are separate from the
51
verbal factors (78), and someone that does not know the language is in a better
position to study the non-verbal factors.
Eye contact was chosen as a quality indicator for the counselling by the pharmacy
professional, and was looked upon as a proxy indicator for proper counselling (11,
15). In this study, the average time of the episodes is smaller without eye contact
than with eye contact, although not significant. Eye contact is an important part of the
interaction between pharmacy professionals and patients, as it is an important part of
well-established communication between any two persons (11), and it was expected
to see a significant difference.
5.2 Interaction time and automation/non-automation pharmacies
The producers of stocking and dispensing robots for pharmacies usually claim that
automation in pharmacies through these robots allows for reducing the overall time
spent with a pharmacy customer, or at least to save and make use of time needed to
manually collect medicines from the stocking area, usually located away from the
pharmacy counter. They promote that this saved time can be used to communicate
with the patient on a larger scale and to provide more information and counselling.
However, our study did not produce results that can support these statements fully.
The statistical results in this study showed that there were no significant differences
in the total number of episodes per observation period or in the average duration of
the episodes from pharmacies with automation compared to pharmacies without
automation. The automation did therefore not seem to increase patient rate efficiency
or decrease the interaction duration, as usually advertised by robots’ manufacturers
(66,67). If the encounter duration is the same, as well as patient turnover, how
professionals in pharmacies with automation use the available time, is an interesting
question. Assuming that patient counselling on how to use their medication is the
most important part of the encounter, automation seems not the best resource to
improve professionals’ work. Keeping in mind that robots in Portuguese community
pharmacies are mainly used to stock and dispense POM, episodes not including
POM and those including POM did not show a significant difference for neither
52
average duration nor total number of episodes between the automation and non-
automation pharmacies. This reinforces the assumption of no impact in the time
saving claims.
Nevertheless, there were on average more packages sold per patient in pharmacies
with automation than in those without automation, even if there was no significant
difference in average duration. This is somewhat unexpected; if professionals provide
a minimum level of information for each product, then it would be likely to see an
increase in the encounter duration with each package sold.
In fact, the average duration and the average number of packages were correlated
factors, being found in general that there was a positive correlation between the
average number of packages sold and the duration of the episode. However, when
separating the pharmacies with and without automation, it was found that this
correlation only existed in the pharmacies without automation. This result was
expected, as the personnel in the pharmacies without automation needs to physically
move to get the packages the patient wants to buy, while in the pharmacies with
automation the robot will bring the packages directly to the professional. As there
was no significant difference in the duration of the episodes, it is possible that the
pharmacy professionals use extra time for something else, such as consulting,
advising, talking with and/or counselling the patient, perhaps in other matters beyond
the medicines being dispensed.
When looking at these results, it confirms why pharmacy owners would buy the
dispensing robots, as the number of packages sold is higher, thereby increasing
sales and profit, hence justifying the investment. These results confirm previous
findings when it comes to covering the costs of the automation (65, 79). However, it
is not known whether this extra time saved contained comprehensive oral counselling
or whether it was mainly based on social chat unrelated to medicines or the patient’s
health situation. A previous study that addressed the impact of community pharmacy
automation and its impact on patient interaction found that counselling rates were no
higher in pharmacies with dispensing automation compared to those without (79).
There was no significant difference in the duration or number of episodes between
the two pharmacy types when the episode did not include POM, somewhat
53
confirming that most non-prescription medicines and other activities in the pharmacy
are not directly linked to the robot. The impact of automation is therefore not
significant on the overall community pharmacy function in terms of the duration of the
interaction between the pharmacy professionals and the patients, neither seems to
benefit the professionals’ role.
5.3 Job satisfaction
5.3.1 Job satisfaction facets/overall scores
None of the job satisfaction variables ended at the highest score, which was 7. The
lowest scores found were for “Obtained recognition”, “Career promotion possibility”
and “Work hours”. These variables were found around the score 5, which is close to
the “Neither dissatisfied neither satisfied” option (score 4), meaning that the
pharmacy professionals were not dissatisfied with these facets, but they were not
truly satisfied either. “Obtained recognition” and “Career promotion possibility” belong
to the intrinsic satisfaction factors, and these are factors that are meant to lead to
satisfaction. “Work hours” is an extrinsic factor, and are part of the factors that
prevent dissatisfaction.
The highest scores found were for “Physical conditions”, “Colleagues” and “Stability
in employment”, which are all extrinsic factors. As the financial situation in Portugal is
unstable at the moment, the “Stability in employment” is likely to be an important
factor in the professionals’ lives.
5.3.2 Job satisfaction and individual background
The results showed that there were no significant differences in the overall job
satisfaction between the professionals’ genders and categories. However, when
separating the facets, it was revealed that there was in fact a significant difference in
the satisfaction scores between male and female pharmacy professionals for the
facets “Work method freedom” and “Relationship management/employees”, with
males answering that they were more satisfied. The context of a work environment
consisting of a majority of female workers, and taking into account that the majority of
54
heads of pharmacy are females, this seems to affect these variables. Knowing that
pharmacies have a predominance of females in their work teams, a possible
explanation for the difference in how genders cope with management decisions can
be based on personal traits related to gender, which are affecting the relationship
between the managers and employees. Personal relationships have been described
as important in job satisfaction (43,44), so a high level of female heads of pharmacy
seem to have an important impact on employees job satisfaction.
The facets that showed significant differences between pharmacists and technical
assistants were “Work method freedom”, “Relationship management/employees”,
“Work hours” and “Responsibility assigned”. The technical assistants rated their
satisfaction higher than the pharmacists. It is interesting that the pharmacists are less
satisfied with the management/employee relationship than the technical assistants.
This can be related to the fact that there is a significantly higher number of females in
pharmacist positions than male, which are significantly more represented in the
technical assistant position. This can also imply that the pharmacists are more
demanding in these relationships than technical assistants, as pharmacists are
professional colleagues with the managers, often with the same educational level,
and both are registered within the Pharmaceutical Society.
The previous observation is closely linked with the results for the facet “Assigned
responsibilities”. On one hand, it was expected that there would be a stronger
difference between pharmacists and technical assistants, and on the other hand
pharmacists should be more satisfied with their duties than the technical assistants,
due to the fact that pharmacists, according to their professional code, should be more
autonomous in their work than the technical assistants. Autonomy is an important
part of job satisfaction (43,44). As the assigned responsibilities are the tasks and
duties that the professionals should perform during their everyday work, it seems that
pharmacists feel their competencies and skills are not well used in the benefit of the
patients (80).
55
5.3.3 Job satisfaction and interaction features
It was expected to be found that the duration of the episodes would influence the
overall job satisfaction of the pharmacy professionals due to e.g. increased workload
(44,59,80), but there was no significant correlation found between satisfaction and
time. It seems that with this satisfaction instrument, the time the pharmacy
professionals spend with the patients is not associated with their job satisfaction.
All the possible bivariate correlations were investigated in relation to overall job
satisfaction and facet job satisfaction (see Table 10). The significant correlations with
a correlation coefficient near or above 0.3 were interesting to look closer at. Although
not very strong correlations, what is peculiar is that all of the correlations are
negative. When variables related to work load (e.g. number of prescriptions, number
of packages sold) increase, different aspects of job satisfaction decreases. These
results are quite expected.
There was a positive correlation between the average duration of the episode and
the average number of products dispensed (prescription only medicines, OTC and
other products). This means that, as expected, if more products are dispensed, the
pharmacy professional will have an increase of the episode duration, meaning more
time with the patient. When looking at how job satisfaction correlated to the average
episode duration, there is no correlation between job satisfaction and episodes
duration, as mentioned in the previous paragraph. Also, there was no significant
correlation found between the registered sales volume per day and the overall
satisfaction. However, there is a negative correlation between the average number of
POM, OTC, other products and the professionals’ job satisfaction. Considering the
average number of episodes and their duration as stable job satisfaction factors, an
increase in the number of procedural tasks seems to influence professionals’
satisfaction. This is related to the workload and associated job stress, as it has
previously been described to negatively affect job satisfaction (47,59).
Although the duration of the episodes did not show an impact on the job satisfaction
of the pharmacy staff, what is seen is that the number of packages and the number
of prescriptions did correlate to job satisfaction. It seems to not be a question about
how much time the professional spends with each patient in order to influence job
56
satisfaction, but it rather seems that the job satisfaction is more dependent on the
physical work, e.g. having to dispense a certain number of packages. This suggests
that the professionals’ job is still very much based on the traditional medicine supply
roles. If based on patient counselling needs, duration would probably correlate with
job satisfaction.
There were also significant correlations between the pharmacy staffs’ total number of
episodes and some of the facets of job satisfaction: “Relationship
management/employees”, “Work hours” and “Variety of performed tasks”. Although
not strong, as well as with the previously mentioned results (e.g. amounts of
packages sold), the signal is negative, meaning that an increment of patients is
correlated to a decrease of satisfaction when it comes to these parameters. These
results do correspond with previously published studies (43,44). This data is again
suggesting that the work and the job satisfaction attached to the work is somehow
associated with the actual dispensing and selling of packages and the amount of
patients, and probably not so much with counselling and the actual talk with the
patient. It seems like the pharmacy professionals are less satisfied when they have a
lot of work to do, and what they really would like to do is to be able to engage in
talking with the patients (56).
There was no significant correlation found between the registered sales volume per
day and the overall satisfaction, which suggests that the pharmacies are well
adjusted in terms of amount of staff related to the sales volume (Table 2).
Characteristics of the patient group (average age and gender) did not have any
correlation with the overall job satisfaction. This seems to imply that the job
satisfaction of the pharmacy professionals is not affected by any of the general
characteristics of the patients.
5.3.4 Job satisfaction and automation
When it comes to being employed in a community pharmacy with automation related
to being employed in a pharmacy without automation, the statistics showed a
significant difference in the facet “Organization and management of company”, where
the professionals in the non-automation pharmacies rated the facet higher. Good
stock control is very important in community pharmacies and therefore this result is
57
unexpected. Pharmacy professionals working in pharmacies that theoretically,
through the robot stocking, have better stock control were less satisfied with this job
satisfaction facet. This may reflect the importance of personal involvement in
stocking activities, one of the traditional roles of a pharmacy professional, even if
machines such as computers have been involved in stock control for a while. On the
other hand, this can also be related to the introduction of automation in pharmacies
being rather recent (65).
There was a significant correlation between the overall job satisfaction and the
number of pharmacy services the community pharmacies provide, although weak.
While an increase in the professional activities and extended roles would suggest an
increase in job satisfaction, the correlation registered here was negative. This means
that the more services the community pharmacy offers to the patients, the less
satisfied the pharmacy professional would be. This can again be related to the
question about workload and its importance in affecting job satisfaction (56,58,80).
However, additional time for interaction would benefit the professionals’ satisfaction,
at least through an alleviation of the workload.
5.4 Study strengths and limitations
5.4.1 Strengths
This is one of the first studies comparing encounter durations in community
pharmacies with and without dispensing and stocking robots. These robots constitute
a great technological investment, and therefore this study is an innovative study in its
area.
A main strength of this study was that there was only one person collecting the data,
meaning that there was no danger of interpersonal variation in data collection and
associated bias.
The study was based on collecting primary data, so there was no secondary analysis
of previously registered data. The researcher was in direct contact with the objects
that were studied and the observation situations.
58
5.4.2 Study limitations
As the researcher did not fully understand the Portuguese language, some details in
the interaction could have been lost, as in case of doubt of what was actually going
on, the researcher could not confirm the content from the verbal content.
The study should have included the time period that each observed professional had
worked with the automation, however this information was not collected.
With a bigger sample, leading to a higher number of episodes, there is a possibility
that stronger results would have been seen.
5.5 Future research As this study has an exploratory nature, it would be interesting to collect further data
having a greater sample as well as to collect more detailed data in relation to the
activities performed by each pharmacy worker and non-verbal communication
factors.
With a follow-up study of the employees it would be interesting to look at questions
such as whether the employees have remained at the workplace and whether there
have been changes in their job satisfaction over time related to for example whether
there have become changes in the workload or improvements in the use of
automation.
Also, it would be beneficial to develop the same observational study in Norway in
order to make comparisons with the aim to assess whether e.g. structural and
organisational differences of community pharmacies could affect outcomes such as
interaction features and job satisfaction. As of today few Norwegian community
pharmacies use this kind of stocking and dispensing robots and therefore the main
focus areas should be the job satisfaction among community pharmacy professionals
and the interaction features instead of the automation.
59
6 Conclusion The pharmacy work, in terms of duration of episodes and the satisfaction of the
pharmacy professionals, was not, as it was expected, influenced by the greater
technological sophistication that the stocking and dispensing robots represent. The
automation appears to only be a part of the service provided and to facilitate logistics.
The duration of the interactions was not dependent on characteristics of the
pharmacy staff (e.g. pharmacists vs. technicians), but with increasing age of the
patient, the interactions lasted longer, which is in accordance with previous studies.
The interactions also lasted longer with increasing number of packages sold.
The impact of the interaction features on the job satisfaction of pharmacy
professionals pointed in the direction of when having more traditional tasks to
perform (such as a greater number of products being dispensed), some facets of job
satisfaction decreases due to increased work load and less time to counsel the
patient. This was also observed in pharmacies with stocking and dispensing robots.
The average duration of the interactions were shorter when eye contact was not
established, however there was no significant difference.
These conclusions need to be better supported in further research.
60
Literature list 1. Stewart MA. Effective physician-patient communication and health outcomes: A
review. Can Med Assoc J 1995;152(9):1423-33.
2. Moore PM, Wilkinson SSM, Rivera Mercado S. Communication skills training for
health care professionals working with cancer patients, their families and/or carers. Cochrane review 2009.
3. Ong LML, de Haes JCJM, Hoos AM, Lammes FB. Doctor-patient communication:
a review of the literature. Social Science and Medicine, 1995;40(7):903-18.
4. Duggan A. Understanding interpersonal communication process across health
context: advances in the last decade and challenges for the next decade. Journal of
Health Communication, 2006;11:93-108.
5. Heritage J, Maynard DW. Problems and prospects in the study of physician-patient
interaction: 30 years of research. Annual Review of Sociology, 2006;32:351-74.
6. Promoting effective communication among healthcare professionals to improve
patient safety and quality of care. Hospital and Health Service Performance Division,
Victorian Government Department of Health, Melbourne, Victoria. July 2010.
7. Stevenson FA, Cox K, Britten N, Dundar Y. A systematic review of the research on
communication between patients and health care professionals about medicines: the
consequences for concordance. Health Expect. 2004 7(3): 235–245.
8. Stevenson FA, Cox K, Britten N, Dundar Y. A systematic review of the research on
communication between patients and health care professionals about medicines: the
consequences for concordance. Health Expectations 2004;7:235-245.
9. Shah B, Chewning B. Conceptualizing and measuring pharmacist-patient
communication: a review of published studies. Res Social Adm Pharm, 2006
Jun;2(2):153-85.
10. Mira JJ, Orozco-Beltrán D, Pérez-Jover V, Martínez-Jimeno L, Gil-Guillén VF,
Carratala-Munuera C, Sánches-Molla M, Pertusa-Martínez S, Asencio-Aznar A.
61
Physician patient communication failure facilitates medication errors in older
polymedicated patients with multiple comorbidities. Fam Pract, 2012 Aug 17. (Epub
ahead of print)
11. Tepper DT, Haase RF. Verbal and Nonverbal Communication of Facilitative
Conditions. Journal of Counselling Psychology 1978;25(1):35-44.
12. Hogan K, Stubbs R. (2003). Can’t get Through: 8 Barriers to Communication.
Gretna, Los Angeles: Pelican Publishing Company.
13. Roter DL, Frankel RM, Hall JA, Sluyter D. The expression of emotion through
nonverbal behavior in medical visits. Mechanisms and outcomes. J Gen Intern Med
2006;21(Suppl 1):S28-34.
14. Griffith CH 3rd, Wilson JF, Langer S, Haist SA. House staff nonverbal
communication skills and standardized patient satisfaction. J Gen Intern Med
2003;18(3):170-4.
15. Abdulhadi N, Al Shafaee M, Fredenthal S, Ostenson CG, Wahlström R. Patient-
provider interaction from the perspectives of type 2 diabetes patients in Muscat,
Oman: a qualitative study. BMC Health Serv Res 2007;9(7):162.
16. Eades CE, Ferguson JS, O’Carroll RE. Public health in community pharmacy: A
systematic review of pharmacist and consumer views. BMC Public Health
2011;11:582.
17. Green JA, Brown C, Burgess J, Chong D, Pewhairangi K. Indigenous and
Immigrant Populations’ Use and Experience of Community Pharmacies in New
Zealand. J Immigrant Minority Health 2012 (published online 18 January 2012).
18. Bellingham C. What makes pharmacists competent? The Pharmaceutical Journal
2004;273:779-780.
19. The Royal Pharmaceutical Society of Great Britain (2007). Clinical governance
framework for pharmacist prescribers and organisations commissioning or
participating in pharmacist prescribing.
62
20. Shooter B. If pharmacists have no communication skills, knowledge is wasted.
The Pharmaceutical Journal 2004;273:7302.
21. Dickson M, Rodowskas C. Verbal communications of community pharmacists.
Medical Care 1975;13(6):486-98.
22. Morrow NC, Hargie OD. Communication as a focus in the continuing education of
pharmacists. Studies in Higher Education 1986;11(3):279-88.
23. Pronk M, Blom L. Community pharmacy and patient-oriented activities: the Duch
case. Patient Education and Counselling 2002;46:39-45.
24. Lyra Jr DP, Rocha CE. Influence of Pharmaceutical Care intervention and
communication skills on the improvement of pharmacotherapeutic outcomes with
elderly Brazilian outpatients. Patient Education and Counselling 2007;68(2):186-192.
25. FIP Statement of Policy. Medicines Information for Patients. September 2008.
Available from: http://www.fip.org/www/uploads/database_file.php?id=290&table_id=
(accessed 25 April 2012).
26. Cox ED, Smith MA, Brown RL, Fitzpatrick MA. Effect of gender and visit length
on participation in paediatric visits. Patient Educ Couns 2007;65:320-8.
27. Wilson A, Childs S. The relationship between consultation length, process and
outcomes in general practice: a systematic review. Br J Gen Pract 2002;52:1012-20.
28. Lin CT, Albertson GA, Schilling LM, Cyran EM, Anderson SN, Ware L, Anderson
RJ. Is Patients’ Perception of Time Spent With the Physician a Determinant of
Ambulatory Patient Satisfaction? Arch Intern Med 2001;161:1437-42.
29. Wilson AD, Childs S. Effects of interventions aimed at changing the length of
primary care physicians’ consultation (Review). Cochrane Database of Systematic
Reviews 2006, Issue 1.
30. Action Programme on Essential Drugs. WHO/DAP/93.1 How to Investigate Drug
Use in Health Facilities: Selected Drug Use Indicators. Geneva: World Health
63
Organisation; 1993. Available from: http://apps.who.int/medicinedocs/en/d/Js2289e/
(accessed 28 April 2012).
31. Schommer JC. Higher levels of consultation services increase patient
satisfaction. Am Pharm 1995;NS35:33-9.
32. Doucette W, Andersen T. Practitioner activities in patient education and drug
therapy monitoring for community dwelling elderly patients. Patient Education and
Counselling 2005;57:204-210.
33. Brouard A, Fagon JY, Daniels CE. Analysis of the medication-use process in
North Americal hospital systems: underlining key points for adoption to improve
patient safety in French hospitals. Stud Health Technol Inform 2011;166:148-55.
34. Schommer JC. Higher levels of consultation services increase patient
satisfaction. Am Pharm 1995;NS35:33-9.
35. Cavaco AM, Romano J. Exploring pharmacists' communication with customers
through screening services. Patient Educ Couns 2010;80:377-83.
36. Evans SW, John DN. A preliminary investigation of the interactions between UK
and US community pharmacists and their prescription clients. Int J Pharm Pract
1995;3:157-62.
37. Sleath B. Pharmacist-patient relationships: Authoritarian, participatory, or default?
Patient Educ Couns 1996;28:253-63.
38. Deveugele M, Derese A, van den Brink-Muinen A, Bensing J, De Maeseneer J.
Consultation length in general practice: cross sectional study in six European
countries. Brit Med J 2002;325:472-4.
39. Carr-Hill R, Jenkins Clarke S, Dixon P, Pringle M. Do minutes count?
Consultation lengths in general practice. J Health Serv Res Policy 1998;207-13.
40. Andersson SO, Ferry S, Matsson B. Factors associated with consultation length
and characteristics of short and long consultations. Scand J Prim Health Care
1993;11:61-7.
64
41. Shah B, Chewning B. Conceptualizing and measuring pharmacist-patient
communication: a review of published studies. Res Social Adm Pharm.
2006;2(2);153-85.
42. Locke EA. (1976). The nature and causes of job satisfaction. In M. D. Dunnette
(Ed.), Handbook of industrial and organizational psychology (pp. 1297–1349).
Chicago: Rand McNally.
43. Luthans, F. (1998). Organisational Behaviour. 8th ed. Boston: Irwin McGraw-Hill.
44. Rama-Maceiras P, Parente S, Kranke P. Job satisfaction, stress and burnout in
anaesthesia: relevant topics for anaesthesiologists and healthcare managers? Eur J
Anaesthesiol. 2012 Apr 2. (Epub ahead of print)
45. Sansgiry SS, Ngo C. Factors Affecting Job Satisfaction Among Hospital
Pharmacists. Hosp Pharm 2001;36:1037-1046.
46. Barnett CW, Kimberlin CL. Development and validation of an instrument to
measure pharmacists’ satisfaction with their jobs and careers. Am J Pharm Educ
1986;50(1):5-14.
47. Sanford ME, Facchinetti NJ, Broadhead RS. Observational study of job
satisfaction in hospital pharmacy technicians. Am J Hosp Pharm 1984;41(12):2599-
606.
48. Cortese LM, Greenberger DW, Schneider PJ, Bourret JA. Job characteristics and
satisfaction of pharmacy technicians. Am J Hosp Pharm 1987;44(11):2514-8.
49. Spooner SH, Britton ME, Erskine LM, Verschoor BA, Williams PA. Improving job
satisfaction and enlarging the role of technicians. J Pharm Technol 1991;7(3):93-9.
50. Lapane KL, Hughes CM. Job satisfaction and stress among pharmacists in the
long-term care sector. Consult Pharm 2006;21(4):287-92.
51. Rauch TM. Job Satisfaction in the Practice of Clinical Pharmacy. Am J Public
Health 1981;71:527-29.
65
52. Amirjahed AK, Bonser WD. Staff pharmacists’ job attitudes and job performance.
Am J Hosp Pharm 1983;40(7):1198-202.
53. Hansen N, Sverke M, Näswall K. Predicting nurse burnout from demands and
resources in three acute care hospitals under different forms of ownership: a cross-
sectional questionnaire survey. Int J Nurs Stud 2009;46:95-106.
54. Schafheutle EI, Seston EM, Hassel K. Factors influencing pharmacist
performance: a review of the peer-reviewed literature. Health Policy 2011;102(2-
3):178-92. Epub 2011 Aug 10.
55. Ortmeier BG, Wolfgang AP. Job related stress: perceptions of employee
pharmacists. AM Pharm 1991;NS31:27-31.
56. Gaither CA, Nadkarni A. Interpersonal interactions, job demands and work-
related outcomes in pharmacy. Int J Pharm Pract. 2012;20(2):80-89.
57. Dowell AC, Westcott T, McLeod DK, Hamilton S. A survey of job satisfaction,
sources of stress and psychological symptoms among New Zealand health
professionals. N Z Med J. 2001;114(1145):540-3.
58. Seston E, Hassell K, Ferguson J, Mark Hann M. Exploring the relationship
between pharmacists’ job satisfaction, intention to quit the profession, and actual
quitting. Res Social Adm Pharm 2009;5:121-132.
59. Lea VM, Corlett SA, Rodgers RM. Workload and its impact on community
pharmacists’ job satisfaction and stress: a review of the literature. Int J Pharm Pract
2012;20:259-271.
60. Estatística do medicamento 2009, Infarmed. Published September 2010.
61. PHARMINE. Pharmacy education & training in Portugal 2010. Available at:
http://enzu.pharmine.org/media/filebook/files/PHARMINE%20WP7%20survey%20Po
rtugal.pdf. (Accessed 14 May 2012)
62. Costa S, Santos C, Silveira J. Community Pharmacy Services in Portugal. Ann
Pharmacother 2006;40(12):2228-2234.
66
63. Cavaco AM, Dias JPS, Bates IP. Consumers’ perceptions of community
pharmacy in Portugal: a qualitative exploratory study. Pharm World Sci 2005;27;54-
60.
64. Cavaco AM, Bates IP. Gauging Portuguese community pharmacy users’
perceptions. Prim Health Care Res Dev 2007;8:315-325.
65. Ruhle F, Braun R, Ostermann H. Impact of Robotic Dispensing Machines in
German Pharmacies on Business Performance Indicators. Libyan J Med. 2009;
4(4):146-151.
66. Apostore (online) 2012. Available at:
http://www.apostore.de/en/automatisierung.html (Accessed 13 May 2012)
67. ROWA (online) 2012. Available at: http://www.rowa.de/Benefits.550.0.html?&L=1
(Accessed 13 May 2012)
68. Apostore (online) 2012. Available at: http://www.apostore.de/en/produkte.html
(Accessed 13 May 2012)
69. Franklin B, O ́Grady K, Voncina L, Popoola J, Jacklin A. An evaluation of two
automated dispensing machines in UK hospital pharmacy. Int J Pharm Pract 2008
Feb;16(1):47-53.
70. Larsen AK. (2007). En enklere metode. Veiledning i samfunnsvitenskapelig
forskningsmetode. Bergen: Fagbokforlaget. S 93-94.
71. Warr P, Cook J, Wall T. Scales for the measurement of some work attitudes and
aspects of psychological well-being. J Occup Psychol, 1979;52:129-148.
72. Izquierdo FM, Micó JCG, Merino CG, Gozalo AC. Influencia de la insatisfacción
laboral en las demandas de cambio de puesto de trabajo por motivos de salud. Med
Segur Trab 2010;56(219):147-157.
73. Barnett CW, Kimberlin CL. Development and validation of an instrument to
measure pharmacists’ satisfaction with their jobs and careers. Am J Pharm Educ
1986;50(1):5-14.
67
74. Viterbo MC. Gestão do Conhecimento e Satisfação no Trabalho: Que relação?
[Unpublished]. Porto: Universidad de Cadiz; 2008.
75. French JRP jr. (1950). Field Experiments; Changing Group Productivity. In Miller
JG (Ed.), Experiments in Social Process: A Symposium on Social Psychology. New
York: McGraw-Hill. P. 82.
76. Wutzke SE, Artist MA, Kehoe LA, Fletcher M, Mackson JM, Weekes LM.
Evaluation of a national programme to reduce inappropriate use of antibiotics for
upper respiratory tract infections: effects on consumer awareness, beliefs, attitudes
and behaviour in Australia. Health Promot Int 2007;22(1):53-64.
77. Ordem dos Farmacêuticos (March 2001). Patient oriented health promotion in
Community Pharmacy in Portugal – Country Report.
78. Jones SE, LeBaron CD. Research on the Relationship Between Verbal and
Nonverbal Communication: Emerging Integrations. Journal of Communication
2002;52(3):499-521.
79. Angelo LB, Christensen DB, Ferreri SP. Impact of community pharmacy
automation on workflow, workload, and patient interaction. J Am Pharm Assoc
2005;45(2):138-44.
80. Eden M, Schafheutle EI, Hassell K. Workload pressure among recently qualified
pharmacists: an exploratory study of intentions to leave the profession. Int J Pharm
Pract 2009;17(3):181-7.
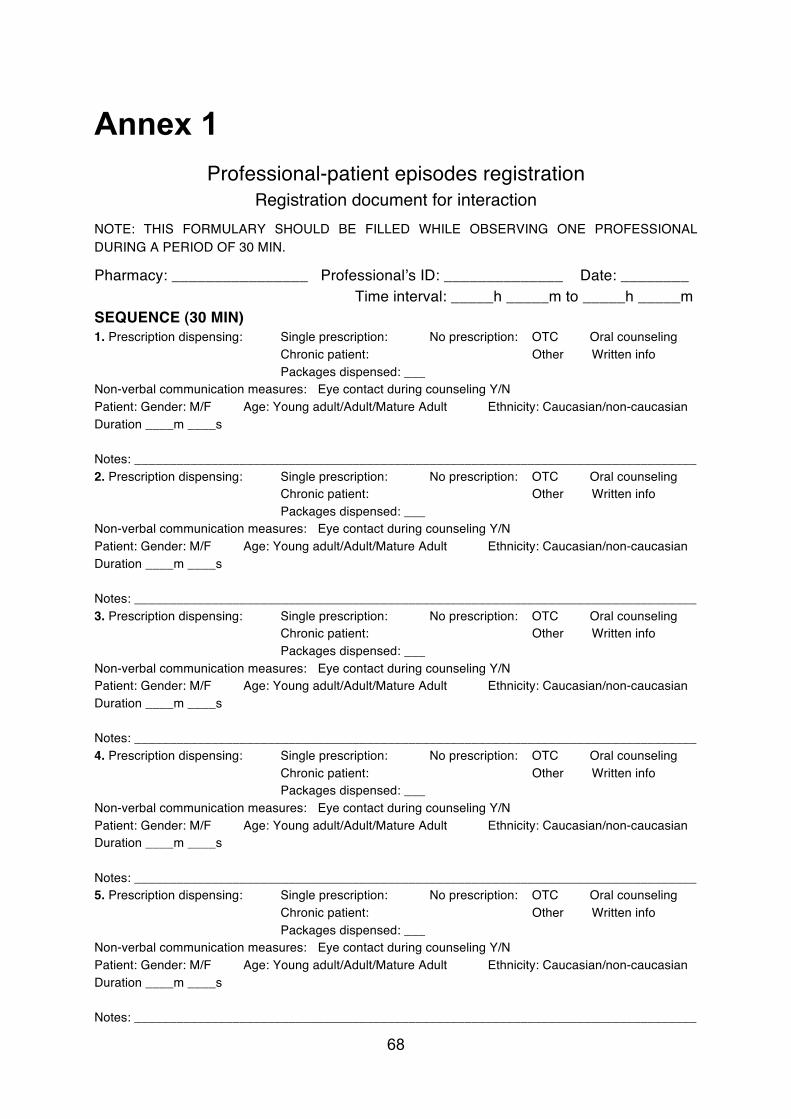
68
Annex 1 Professional-patient episodes registration
Registration document for interaction NOTE: THIS FORMULARY SHOULD BE FILLED WHILE OBSERVING ONE PROFESSIONAL DURING A PERIOD OF 30 MIN.
Pharmacy: ________________ Professionalʼs ID: ______________ Date: ________ Time interval: _____h _____m to _____h _____m SEQUENCE (30 MIN) 1. Prescription dispensing: Single prescription: No prescription: OTC Oral counseling Chronic patient: Other Written info Packages dispensed: ___ Non-verbal communication measures: Eye contact during counseling Y/N Patient: Gender: M/F Age: Young adult/Adult/Mature Adult Ethnicity: Caucasian/non-caucasian Duration ____m ____s Notes: ________________________________________________________________________________ 2. Prescription dispensing: Single prescription: No prescription: OTC Oral counseling Chronic patient: Other Written info Packages dispensed: ___ Non-verbal communication measures: Eye contact during counseling Y/N Patient: Gender: M/F Age: Young adult/Adult/Mature Adult Ethnicity: Caucasian/non-caucasian Duration ____m ____s Notes: ________________________________________________________________________________ 3. Prescription dispensing: Single prescription: No prescription: OTC Oral counseling Chronic patient: Other Written info Packages dispensed: ___ Non-verbal communication measures: Eye contact during counseling Y/N Patient: Gender: M/F Age: Young adult/Adult/Mature Adult Ethnicity: Caucasian/non-caucasian Duration ____m ____s Notes: ________________________________________________________________________________ 4. Prescription dispensing: Single prescription: No prescription: OTC Oral counseling Chronic patient: Other Written info Packages dispensed: ___ Non-verbal communication measures: Eye contact during counseling Y/N Patient: Gender: M/F Age: Young adult/Adult/Mature Adult Ethnicity: Caucasian/non-caucasian Duration ____m ____s Notes: ________________________________________________________________________________ 5. Prescription dispensing: Single prescription: No prescription: OTC Oral counseling Chronic patient: Other Written info Packages dispensed: ___ Non-verbal communication measures: Eye contact during counseling Y/N Patient: Gender: M/F Age: Young adult/Adult/Mature Adult Ethnicity: Caucasian/non-caucasian Duration ____m ____s Notes: ________________________________________________________________________________
69
Annex 2 Overall Job Satisfaction Scale
Number ………………………………………………………………
Workplace ...........…………………………………………………...
According to your degree of satisfaction with different aspects of your workplace, we present several options (between very dissatisfied to very satisfied), among which you can position your opinion, marking with an (X) the box that best represents your opinion.
Very dissatisfied
Dissatisfied Moderately dissatisfied
Neither satisfied/ Neither
dissatisfied
Moderately satisfied
Satisfied Very
satisfied
1. Physical conditions of the
workplace
2. Freedom to choose your
own method of work
3. Colleagues
4. Recognition obtained for
well done work
5. Supervisor
6. Responsibility assigned
7. Salary received
8. Possibility to use your
skills
9.
Relationship between management and
employees in your company
10. Possibility for promotion of
your career
11. Organization and
management of the company
12. Attention paid to
suggestions made by you
13. Work hours
14. Variety of tasks performed
15. Stability in employment
16. Overall satisfaction
70
Annex 3 Study procedure for information gathering from community pharmacies and observation of pharmacy professionals
This document describes the procedure that should be followed when gathering information in community pharmacies (observation study).
Procedure:
Before starting the observations it is important to confirm that both the community
pharmacy professionals and also the employer (head of pharmacy, owner)
understands why the researcher is present and what will happen. Therefore,
immediately upon arrival at the pharmacy, explain the aim of the study and how the
observation will be done. The impact of this is that the total time spent in the
community pharmacy Day 1 of observing will take more time than Day 2. It is
recommended that there is a small meeting between the researcher and the head of
pharmacy/owner of the pharmacy in the beginning of Day 1. During this meeting, the
Pharmacy Characteristics form should be given to the head of pharmacy/owner in
order to be filled in. Explain that the information asked for in the form is needed when
the pharmacies are to be compared. When filling in the form extra care should be
taken to explain exactly what is meant by volume (average sales per day during one
month), and also make sure that the IT program used to determine it is noted down
as it might vary among the pharmacies. The area of the pharmacy is comprised of both public area and back office space.
On the beginning of Day 1 it is highly recommended to speak with the employer or
someone that has the general overview of the pharmacy staff, in order to note down
which employee has which kind of tasks at what time during the two planned days of
observation. This main reason for this is because the employees that are to be
observed should be working in the pharmacy both observation days. The workers
that are going to be in the pharmacy only one of the days should be excluded from
being observed from the beginning. Ask for a list with the names of the employees
that fills the criteria for observation, their professional category, what time their shifts
71
are and if applicable, their lunch hour for both days. This is going to help make the
observation process more effective, as a strategy of observation times should be
created for each day, in order to not “loose” anyone because they go home earlier
than others. This will also prevent long waiting time during lunch. When the
observation strategy plan for Day 1 has been developed, the observation process can begin.
If the pharmacy is very busy, it is beneficial to take one employee aside at a time in
order not to disrupt the normal flow of the pharmacy and the attending to the patients.
If the pharmacy is quiet when you arrive, they can normally afford to let more than
one person aside at a time. Whether one or more employees are taken aside at a time, follow this procedure:
-‐ Introduce yourself and the study
-‐ Take questions
-‐ Give them the declaration sheet to read and sign
-‐ Explain that the observation should not affect their normal work procedure and
that the aim is not to be fast/slow or to attend to as many patients as possible.
The researcher is there merely to observe the actual situation. Emphasize that
no part of the observation will be recorded in any way.
-‐ Then show them the Job Satisfaction Questionnaire and explain that the
replies will be treated strictly anonymously and that they should fill it in when
having privacy. Therefore put the form into an envelope that can be sealed
and tell them about the possibility of filling it in at home and giving it back on
Day 2 in case the opportunity does not arise during Day 1. Tell them which
day that Day 2 will be. Some people will fill it in during work hours, so
emphasize that they should try to find some privacy and not get interrupted.
-‐ Then ask whether it is ok to observe them after this and that it will take 30
minutes. Explain that there might be some questions after the observation or a
double check with the computer history as it is not always clear and
understandable for the observer whether what is sold is an OTC, continuous
treatment etc. -‐ Tell them that they should inform the patients about the study.
72
When the observations begin it is important to start with a new patient encounter and not start in the middle of an encounter.
When filling in the form and during the observation:
On beforehand fill in the pharmacy name, date, number of employee and Day 1/Day
2 should be filled in. When the observation begins, the time the observation begins is noted down.
During the observations the other fields of the form should be filled in according to
what is observed. Take care not to interrupt or impact the interaction between the
pharmacy professional and the patient.
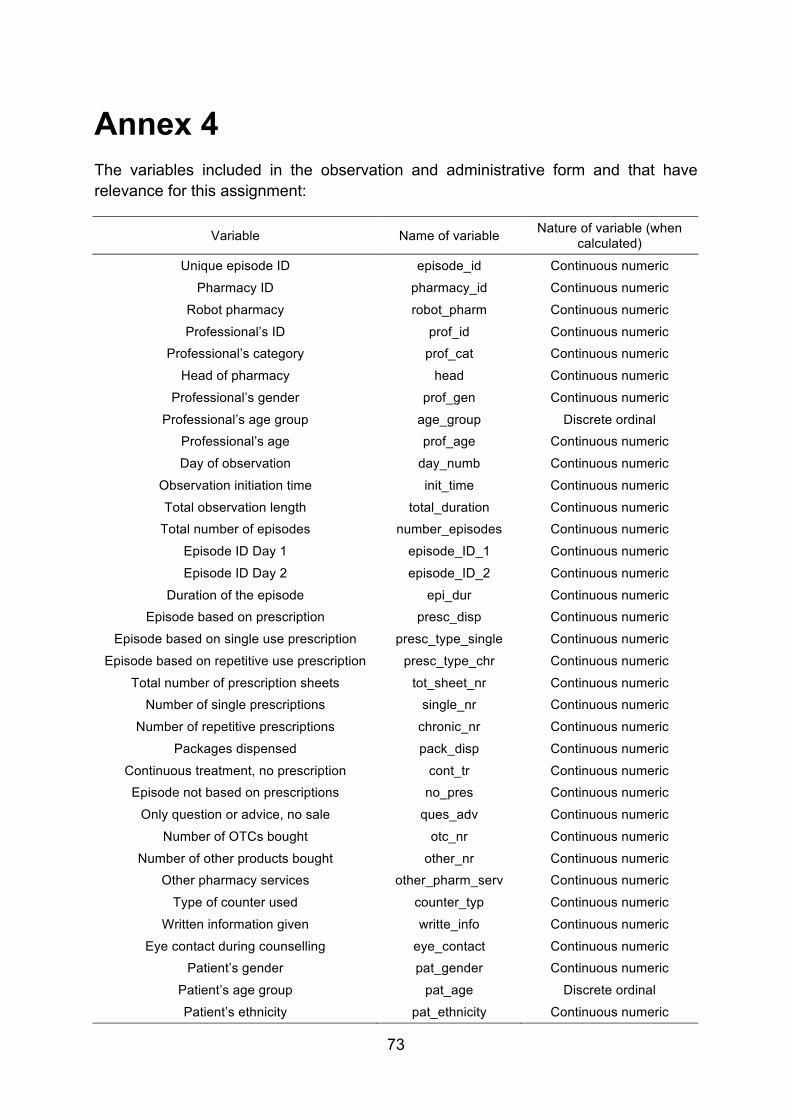
73
Annex 4 The variables included in the observation and administrative form and that have relevance for this assignment:
Variable Name of variable Nature of variable (when calculated)
Unique episode ID episode_id Continuous numeric
Pharmacy ID pharmacy_id Continuous numeric
Robot pharmacy robot_pharm Continuous numeric
Professional’s ID prof_id Continuous numeric Professional’s category prof_cat Continuous numeric
Head of pharmacy head Continuous numeric
Professional’s gender prof_gen Continuous numeric
Professional’s age group age_group Discrete ordinal Professional’s age prof_age Continuous numeric
Day of observation day_numb Continuous numeric
Observation initiation time init_time Continuous numeric
Total observation length total_duration Continuous numeric Total number of episodes number_episodes Continuous numeric
Episode ID Day 1 episode_ID_1 Continuous numeric
Episode ID Day 2 episode_ID_2 Continuous numeric
Duration of the episode epi_dur Continuous numeric Episode based on prescription presc_disp Continuous numeric
Episode based on single use prescription presc_type_single Continuous numeric
Episode based on repetitive use prescription presc_type_chr Continuous numeric
Total number of prescription sheets tot_sheet_nr Continuous numeric Number of single prescriptions single_nr Continuous numeric
Number of repetitive prescriptions chronic_nr Continuous numeric
Packages dispensed pack_disp Continuous numeric
Continuous treatment, no prescription cont_tr Continuous numeric Episode not based on prescriptions no_pres Continuous numeric
Only question or advice, no sale ques_adv Continuous numeric
Number of OTCs bought otc_nr Continuous numeric
Number of other products bought other_nr Continuous numeric Other pharmacy services other_pharm_serv Continuous numeric
Type of counter used counter_typ Continuous numeric
Written information given writte_info Continuous numeric
Eye contact during counselling eye_contact Continuous numeric Patient’s gender pat_gender Continuous numeric
Patient’s age group pat_age Discrete ordinal
Patient’s ethnicity pat_ethnicity Continuous numeric
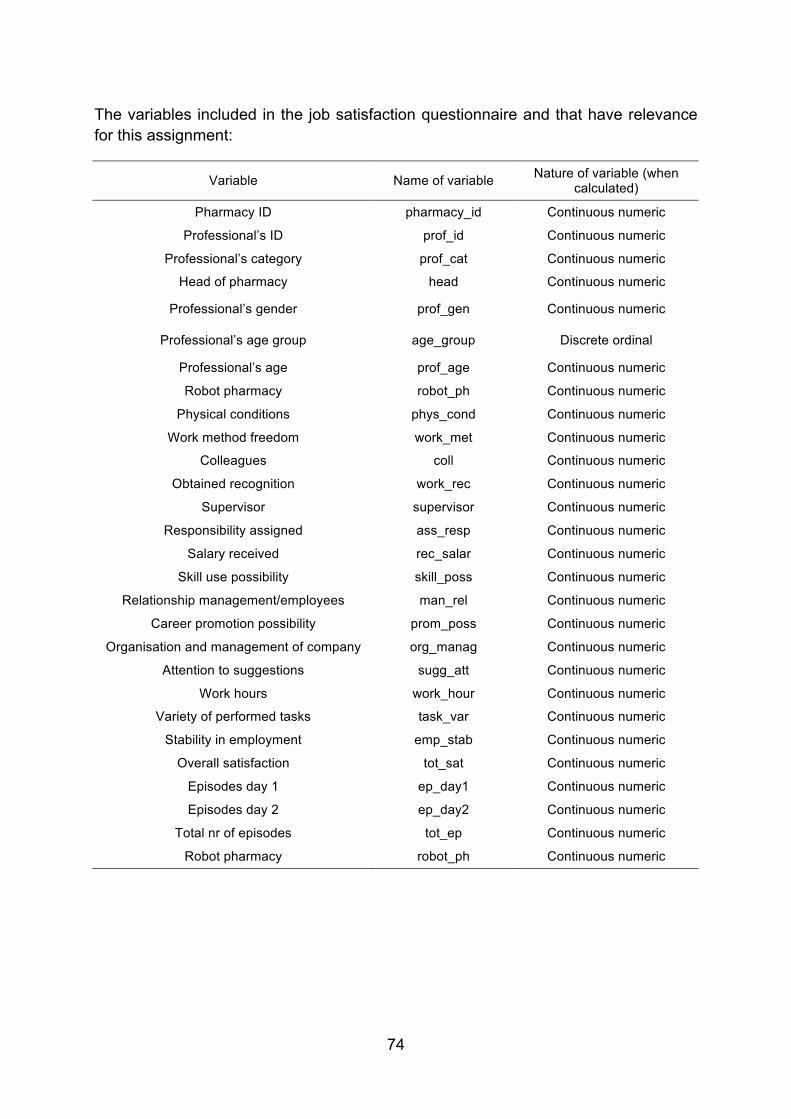
74
The variables included in the job satisfaction questionnaire and that have relevance for this assignment:
Variable Name of variable Nature of variable (when calculated)
Pharmacy ID pharmacy_id Continuous numeric
Professional’s ID prof_id Continuous numeric
Professional’s category prof_cat Continuous numeric
Head of pharmacy head Continuous numeric
Professional’s gender prof_gen Continuous numeric
Professional’s age group age_group Discrete ordinal
Professional’s age prof_age Continuous numeric
Robot pharmacy robot_ph Continuous numeric
Physical conditions phys_cond Continuous numeric
Work method freedom work_met Continuous numeric
Colleagues coll Continuous numeric
Obtained recognition work_rec Continuous numeric
Supervisor supervisor Continuous numeric
Responsibility assigned ass_resp Continuous numeric
Salary received rec_salar Continuous numeric
Skill use possibility skill_poss Continuous numeric
Relationship management/employees man_rel Continuous numeric
Career promotion possibility prom_poss Continuous numeric
Organisation and management of company org_manag Continuous numeric
Attention to suggestions sugg_att Continuous numeric
Work hours work_hour Continuous numeric
Variety of performed tasks task_var Continuous numeric
Stability in employment emp_stab Continuous numeric
Overall satisfaction tot_sat Continuous numeric
Episodes day 1 ep_day1 Continuous numeric
Episodes day 2 ep_day2 Continuous numeric
Total nr of episodes tot_ep Continuous numeric
Robot pharmacy robot_ph Continuous numeric
75
Annex 5 All pharmacy services offered by the different community pharmacies visited.
Table 1: The pharmacy services provided in each individual community pharmacy.
Pharmacy ID Pharmacy services provided Total number of
services per pharmacy
1 BloG, BPM, BMI, DiaF, HbA, HDL, HTC, HemM, ImmA, InjA, MedR, NutC, PatF, PodC, PSA, SubT, TotC, TriM, UriM 19
2 BloG, BPM, BMI, DiaF, HDL, MedR, NutC, PatF, PodC, TotC, TriM, UriM 12
3 BloG, BPM, DiaF, FemM, HDL, HTC, HemM, ImmA, INR, NutC, OstS, PodC, PreT, TotC, TriM, UriM 16
4 BloG, BPM, BMI, HDL, ImmA, NutC, PreT, TotC, TriM, UriM 10
5 BabW, BloG, BPM, BMI, FemM, HDL, HemM, ImmA, InjA, INR, NutC, OstC, PreT, ThyM, TotC, TriM, UriM 17
6 BloG, BPM, BMI, CreM, FarD, HDL, ImmA, InjA, NutC, MedR, PodC, SmoC, TotC, TriM, UriM 15
7 BloG, BPM, BMI, FarD, HDL, ImmA, MedC, NutC, PreT, TotC, TriM, UriM 12
8 BloG, BPM, BMI, HDL, ImmA, InjA, NutC, OstC, PodC, PreT, SmoC, TotC, TriM, 13
9 BloG, BPM, CliA, HDL, HeaS, ImmA, NutC, PodC, TotC, TriM 10
10 BloG, BPM, BMI, DiaF, HbA, HDL, HTC, HemM, ImmA, InjA, MedC, NutC, PodC, PSA, TotC, TriM, UriM 17
11 AesS, BabW, BloG, BPM, BMI, FarD, HDL, HeaS, ImmA, InjA, MedC, NutC, OstS, PreT, PreC, PriS, TotC, TriM 18
76
Table 2: Overview of all pharmacy services provided in the visited community pharmacies.
Abbreviation Pharmacy service
AesS Aesthetic service
BabW Baby weighing
BloG Blood glucose measurement
BPM Blood pressure measurement
BMI BMI measurement
CliA Clinical analysis (blood tests)
CreM Creatinine measurement
DiaF Diabetic foot consultation
FarD Farmadrive
FemM Female hormones measurement
HbA HbA1c measurement
HDL HDL measurement
HeaS Hearing aid screening
HTC Hematocrit measurement
HemM Hemoglobin measurement
ImmA Immunisation/vaccines administration
InjA Injectable medicines administration
INR INR (International normalized ratio) measurement
MedC Medicine compounding
MedR Medicines use review
SubT Methadone/buprenorphine substitution therapy
NutC Nutrition consultation
OstC Osteopath consultation
OstS Osteoporosis screening
PatF Patient follow-up (Sifarma 2020)
PodC Podiatrist consultation
PreC Pregnancy consultation
PreT Pregnancy testing
PriS Primary schools presentations
PSA PSA (Prostate-Specific Antigen) measurement
SmoC Smoking cessation consultation
ThyM Thyroid hormones measurement
TotC Total cholesterol measurement
TriM Triglycerides measurement
UriM Uric acid measurement