patients with allogeneic hematopoietic stem cell drg and
TRANSCRIPT

Page 1/20
Prognostic Prediction of Novel Risk Scores (AML-DRG and AML-HCT-CR) in Acute Myeloid LeukemiaPatients with Allogeneic Hematopoietic Stem CellTransplantationWeijie Cao
First A�liated Hospital of Zhengzhou UniversityXiaoning Li
First A�liated Hospital of Zhengzhou UniversityRan Zhang
First A�liated Hospital of Zhengzhou UniversityZhilei Bian
First A�liated Hospital of Zhengzhou UniversitySuping Zhang
First A�liated Hospital of Zhengzhou UniversityLi Li
First A�liated Hospital of Zhengzhou UniversityHaizhou Xing
First A�liated Hospital of Zhengzhou UniversityChangfeng Liu
First A�liated Hospital of Zhengzhou UniversityXinsheng Xie
First A�liated Hospital of Zhengzhou UniversityZhongxing Jiang
First A�liated Hospital of Zhengzhou UniversityJifeng Yu ( [email protected] )
First A�liated Hospital of Zhengzhou UniversityDingming Wan
First A�liated Hospital of Zhengzhou University
Research Article
Keywords: Acute myeloid leukemia, allogeneic hematopoietic stem cell transplantation, risk score models,prognostic prediction
Posted Date: November 18th, 2021

Page 2/20
DOI: https://doi.org/10.21203/rs.3.rs-1045274/v1
License: This work is licensed under a Creative Commons Attribution 4.0 International License. ReadFull License

Page 3/20
Abstract
PurposeWe aimed to validate and prove the novel risk score models of acute myeloid leukemia (AML)-speci�cdisease risk group (AML-DRG) and AML-Hematopoietic Cell Transplant-composite risk (AML-HCT-CR) inpatients with acute myeloid leukemia (AML) after allogeneic hematopoietic stem cell transplantation(AHCT).
MethodsOne hundred twenty-three AML (non-APL) patients underwent AHCT was enrolled in this study. Patients werestrati�ed into 3 AML-DRG and 4 AML-HCT-CR risk groups. Of the 123 patients, 57 (46.3%) were females, andthe median age was 31 years (range 12 to 62 years). All patients received myeloablative conditioning.Median follow-up was 46 months (range 1 to 94 months). AML-DRG and AML-HCT-CR score models wereapplied with the overall survival (OS) and progression-free survival (PFS) analysis after the clinical follow-up.
ResultsFor the AML-DRG model, the 3-year OS in the low, intermediate and high-risk groups were 65.4%, 34.9% and8.3%, respectively (p<0.001). The corresponding 3-year PFS were 64.0%, 34.9% and 8.3% (p<0.001). The OSpredictive accuracy measured by C-index was 0.680. In the AML-HCT-CR model, the 3-year OS in the low,intermediate, high and very high-risk groups were 65.4%, 52.0%, 11.1% and 8.3%, respectively (p<0.001). Thecorresponding 3-year PFS were 64.0%, 52.0%, 11.1% and 8.3% (p<0.001). The OS predictive accuracymeasured by C-index was 0.705. The AML-DRG and AML-HCT-CR models signi�cantly predicted cumulativeincidence of relapse (p=0.002; p=0.005). But both scores were not associated with NRM (p=0.314; p=0.095).Univariate analysis showed that the AML-DRG model could better stratify AML patients into different riskgroups compared to the AML-HCT-CR model. Multivariate analysis con�rmed that prognostic impact ofAML-DRG and AML-HCT-CR models on post-transplant OS was independent to age, sex, conditioning type,transplant modality, and stem cell source (p<0.001; p<0.001).
ConclusionsThe AML-DRG and AML-HCT-CR models can be used to effectively predict post-transplant survival inpatients with AML receiving AHCT in our center. Compared to AML-HCT-CR score, the AML-DRG score allowsbetter strati�cation and improved survival prediction of AML patients post-transplant.
Introduction

Page 4/20
Acute myeloid leukemia (AML) is a clonal malignancy characterized by genetic heterogeneity due torecurrent gene mutations. Long term overall survival has stagnated in the past few decades. Even with anarray of new gene mutation-targeted agents available for AML treatment [1], the complete cure of leukemiastill faces great challenges. Allogeneic hematopoietic stem cell transplantation (AHCT) is a curativetreatment for AML patients [2, 3]. Disease relapse and transplant-related mortality (TRM) are important forlong-term survival of AML patients, especially the disease relapse [4, 5]. How to identify the high-risk patientsand prevent post-AHCT relapse on the basis of controlling the toxicities of conditioning regimen wasimportant to improve the outcomes of AML patients [6, 7]. Survival of patients after AHCT is largelydependent on disease- and patient-related factors [8-12]. Pre-transplant risk and survival assessments arethe keys to optimize the results of transplant.
Several prognostic models have been developed in recent years. The disease risk index (DRI) [13, 14],representing disease-related factors, can predict overall survival (OS) but can’t integrate patient’scomorbidities and overall conditions. The hematopoietic cell transplantation-speci�c comorbidity index(HCT-CI) is also predictive of outcome but only includes comorbidities [15, 16]. The disease risk comorbidityindex (DRCI) and haplo-DRCI, integrating the DRI and HCT-CI, can effectively predict outcomes after AHCT[17]. Although previous studies have proved that minimal residual disease (MRD) is an independentpredictor of survival in patients with AML [18-20], MRD is excluded from most models. Therefore, twocomprehensive new prognostic scores, AML-speci�c disease risk group (AML-DRG) and AML-HematopoieticCell Transplant-Composite Risk (AML-HCT-CR), have been shown to be predictive of OS and PFS in patientswith AML received AHCT [21]. However, there are no published reports of the AML-DRG and AML-HCT-CRmodels in China. In this retrospective study, we aimed to verify the clinical effectiveness and generalizabilityof the AML-DRG and AML-HCT-CR models in a cohort of patients with AML receiving AHCT.
Materials And MethodsData source
A total of 123 adult patients diagnosed with non-M3 acute myeloid leukemia who underwent the �rst AHCTfrom January 1, 2013 to December 30, 2018 in the First A�liated Hospital of Zhengzhou University wereenrolled in this study. Secondary AML was de�ned as AML developed after treatment with systemicchemotherapy and/or radiation therapy. All enrolled subjects in this study provided written informedconsent. The study was conducted in accordance with the Declaration of Helsinki. All patients were followedup through our outpatient clinic, medical records in hospital, or by telephone cells. The follow-up endpointwas December 30, 2020.
Rating scales
AML-DRG score assignment: 1 for secondary AML, 1 for adverse European Leukemia 2017 genetic risk(ELN2017 genetic risk), 2 for CR with MRD positive or unknown MRD status, 4 for active disease [21]. TheAML-HCT-CR score assignment: AML-DRG score with the addition of 1 score for age ≥60 and 1 score forHCT-CI ≥3 [21]. DRI was applied as described by Armand et al [13]. HCT-CI and HCT-CI/Age were applied as

Page 5/20
published by Sorror et al [15, 16]. ELN2017 genetic risk group was applied as described by Döhner, et al [22].MRD was assessed pre-HSCT by �ow cytometry. MRD<0.1% was judged to be negative [23].
Transplant protocol
All patients received myeloablative conditioning. The major conditioning regimen for the identical siblingdonor (ISD) group as follows: hydroxyurea (40mg/kg/12h, day -10), cytarabine (1~1.5g/m-2/d, day -9),busulfan (0.8g/kg/6h, days -8~-6), cyclophosphamide (1.8g/ m-2/d, days -5 and -4). For HLA-haploidenticaland HLA-matched unrelated donor transplants, the major conditioning regimen as follows: cytarabine (4g/m-2/d, days -10 and -9), busulfan (0.8g/kg/6h, days -8 to -6), cyclophosphamide (1.8g/ m-2/d, days -5 and-4), anti-thymocyte globulin (ATG) (2.5mg/kg/d, days -5 to -2). Four patients received total body irradiation(TBI)-based regimen: cyclophosphamide(60mg/kg/d, day -6 and -5), total body irradiation (12 to 14 Gy, day-3~-1). The GVHD prevention scheme used cyclosporine combined with mycophenolate mofetil andmethotrexate.
Outcomes
The primary endpoint was overall survival (OS) at 3 years after transplantation. The secondary endpointswere progression-free survival (PFS) at 3 years, non-relapse mortality (NRM) at 3 years, and cumulativeincidence of relapse at 3 years. OS was de�ned as time from transplantation until death from any cause.PFS was de�ned as time from randomization to disease progression. Non-relapse mortality was de�ned asdeath from any cause not subsequent to relapse. Relapse was de�ned as either reappearance of leukemicblasts in the peripheral blood or at least 5% blasts in the bone marrow aspirate or biopsy specimen notattributable to any other cause, or reappearance or new appearance of extramedullary leukemia. AcuteGVHD and chronic GVHD were diagnosed and graded according to the standard international criteria [24,25].
Statistical analysis
OS, PFS were estimated using the Kaplan-Meier method and compared using the Log-rank test. Cumulativeincidences of relapse, non-relapse mortality, and GVHD were calculated by accounting for competing risks.Competing risks for GVHD included death without GVHD and relapse. Relapse was a competing risk for non-relapse mortality, and non-relapse mortality was a competing risk for relapse. The comparison of thecumulative incidence in the presence of a competing risk was done using the Fine and Gray model. Theimpact of the AML-DRG and AML-HCT-CR models on survival outcomes were determined using univariableand multivariable Cox proportional hazards regression models. The discriminative ability of the models wasassessed by Harrell’s C-statistics. p < 0.05 was considered signi�cant. SPSS version 23.0 and R version 3.6.2were used for data analysis.
ResultsPatient characteristics

Page 6/20
Among the 123 AML patients analyzed, 46.3% (n=57) were females. Median age was 31 years (range 12 to62 years), one patient was more than 60 years old (0.81%). Median follow-up was 46 months (range 1 to 94months). According to the AML-DRG model, 68, 43 and 12 patients were in low-, intermediate- and high-riskgroup, respectively. According to the AML-HCT-CR model, 68, 25, 18 and 12 patients were in low-,intermediate-, high- and very high-risk group, respectively. The basic clinical data of the patients were shownin Table 1.
GVHD
For the entire cohort, the cumulative incidence of grade II to IV acute GVHD at day 100 was 18.7% (95% CI15.4-22), the cumulative incidence of all-grade chronic GVHD at 2 years was 25.4% (95% CI 21.9-28.9). Thecumulative 100-day incidence of grade II to IV acute GVHD for the low-, intermediate- and high-risk AML-DRGgroups was 19.1% (95% CI 16.6-21.7), 18.6% (95% CI 11.3-25.9) and 16.7% (95% CI 0-36.0), differences arenot statistically signi�cant (P=0.980). The incidence for all-grade chronic GVHD at 2 years was 31.3% (95%CI 25.6-37.0), 20.9% (95% CI 13.4-28.4) and 8.3% (95% CI 0-25.8), respectively (p=0.211) (Table 2) .
For the AML-HCT-CR model, the cumulative 100-day incidence of grade II to IV acute GVHD for the low-,intermediate-, high- and very high-risk groups was 19.1% (95% CI 13.9-24.3), 12.0% (95% CI 1.9-22.1), 27.8%(95% CI 12.6-43.0) and 16.7% (95% CI 0.0-36.2), respectively (p=0.610). The incidence for all-grade chronicGVHD at 2 years was 31.3% (95% CI 25.6-37.0), 28.0% (95% CI 16.1-39.9), 11.1% (95% CI 0-24.1) and 8.3%(95% CI 0-26.5), respectively (p=0.252) (Table 2).
Relapse and NRM
For the entire cohort, the 3-year cumulative incidences of relapse and NRM were 23.0% (95% CI 19.6-26.4)and 28.6% (95% CI 25.0-32.2), respectively. Reasons for relapse were hematological in 20 patients,extramedullary in 3 patients, and hematological plus extramedullary in 5 patients. Reasons for NRM wereinfection in 22 patients, acute GVHD in 11 patients, and hemorrhage in 5 patients.
The 3-year cumulative incidence of relapse for the low-, intermediate- and high-risk AML-DRG groups was13.6% (95% CI 8.7-18.5), 30.2% (95%CI 22.3-38.2) and 50.0% (95% CI 27.6-72.4), respectively (p=0.002)(Figure 1B), with the corresponding 3-year NRM was 22.3% (95% CI 17.0-27.7), 34.9% (95% CI 26.8-43.0) and41.7% (95% CI 19.0-64.4), differences are not statistically (p=0.314) (Figure 1C). The 3-year cumulativeincidence of relapse for the low-, intermediate-, high- and very high-risk AML-HCT-CR groups was13.6% (95%CI 8.7-18.5), 24.0% (95% CI 12.4-35.6), 44.4% (95% CI 28.3-60.6) and 41.7% (95% CI 19.7-63.6), respectively(p=0.005) (Figure 2B), with the corresponding 3-year NRM was 22.3% (95% CI 17.0-27.7), 24.0% (95% CI12.4-35.6), 44.4% (95% CI 28.2-60.7) and 50.0% (95% CI 27.3-72.7), differences are not statisticallysigni�cant (p=0.095) (Figure 2C, Table 2).
OS and PFS
The 3-year OS and PFS of the entire cohort were 49.1% (95% CI 41.0-58.9) and 48.4% (95% CI 40.3-58.1).Patients in low-, intermediate- and high-risk AML-DRG groups had median OS of 33.5 (1~94), 10 (1~60) and4 (1~69) months, respectively (p<0.001), with the corresponding 3-year OS of 65.4% (95% CI 54.9-78.0),

Page 7/20
34.9% (95% CI 23.2-52.5) and 8.3% (95% CI 1.3-54.4), respectively (p<0.001). The 3-year PFS were 64.0%(95% CI 53.5-76.7), 34.9% (95% CI 23.2-52.5) and 8.3% (95% CI 1.3-54.4), respectively (p<0.001) (Figure 1A).The median OS for the low-, intermediate-, high- and very high-risk AML-HCT-CR groups were 33.5 (1~94), 28(2~60), 6.5 (1~43) and 3.5 (1~69) months, respectively (p<0.001), with the corresponding 3-year OS of65.4% (95% CI 54.9-78.0), 52.0% (95% CI 35.7-75.8), 11.1% (95% CI 3.0-41.0) and 8.3% (95% CI 1.3-54.4),respectively (p<0.001) (Figure 2A). The 3-year PFS were 64.0% (95% CI 53.5-76.7), 52.0% (95% CI 35.7-75.8),11.1% (95% CI 3.0-41.0) and 8.3% (95% CI 1.3-54.4), respectively (p<0.001) (Table 2).
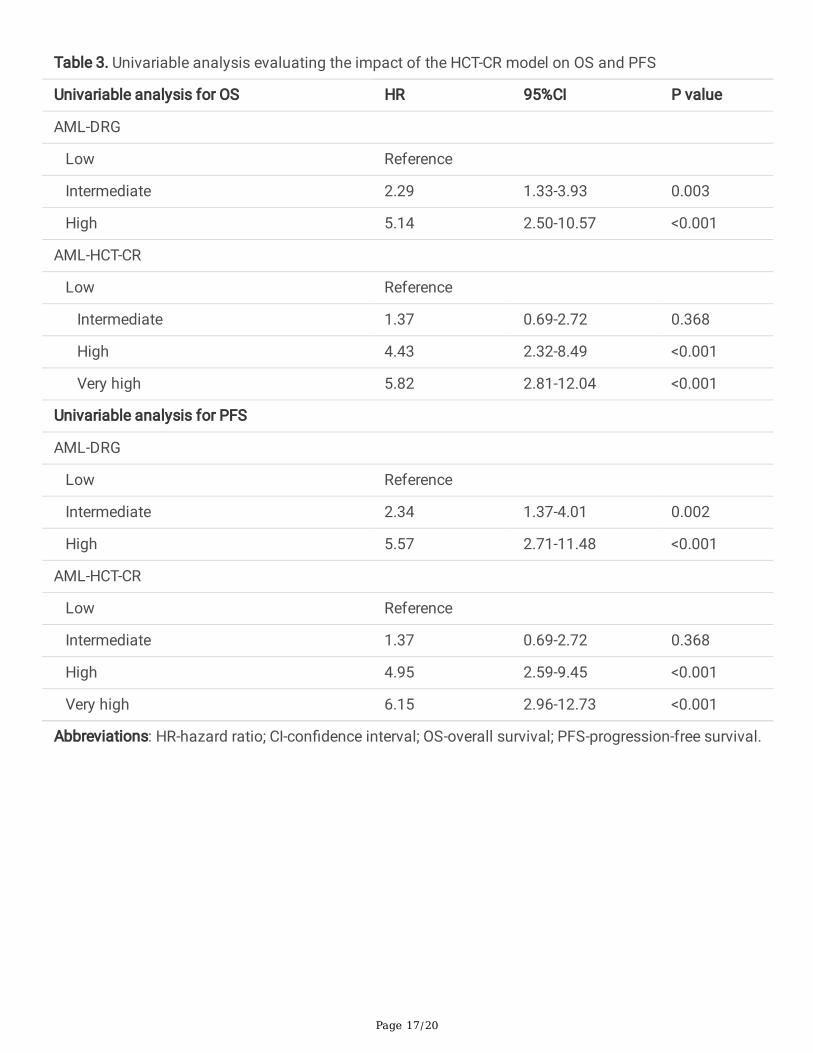
In univariable analysis for OS, patients with intermediate and high-risk AML-DRG groups had a signi�cantlyincreased risk of death with hazard ratio (HR) of 2.29 (95% CI 1.3-3.9; p=0.003) and 5.14 (95% CI 2.5-10.6;p<0.001), respectively when compared with the low-risk group. Also, the risk of death was higher in high-riskgroup compared with the intermediate-risk group (HR 2.26, 95% CI 1.1-4.6; p=0.023), con�rming the ability ofthe AML-DRG model in post-transplant survival prediction. For AML-HCT-CR groups, patients with high (HR4.43, 95% CI 2.3-8.5; p<0.001) and very high-risk groups (HR 5.82, 95% CI 2.8-12.0; p<0.001) had signi�cantlyincreased risk of death than low-risk group, while there was no difference between low and intermediate-risk(HR 1.37, 95% CI 0.7-2.7; p=0.365) and between high and very high group (HR 1.47,95% CI 0.7-3.2; p=0.329).Similar results were found in a univariable analysis for PFS as summarized in Table 3.
Multivariate analysis
Multivariable analysis con�rmed that the HCT-CR and AML-HCT-CR models could be used to predict the OSof patients in different risk groups after adjusted for other variables including age, sex, conditioning type,transplant modality, and stem cell source. See Table 4 for details.
Comparison of prognostic strati�cation:
The C-indexes of the AML-DRG, AML-HCT-CR, DRI, ELN2017 genetic risk, and HCT-CI/Age model were 0.680(95% CI 0.586-0.774), 0.705 (95% CI 0.613-0.797), 0.605 (95% CI 0.506-0.705), 0.519 (95% CI 0.416-0.621)and 0.601 (95% CI 0.501-0.700), respectively. Compared with the DRI model and the HCT-CI/Age, the AML-DRG and AML-HCT-CR models had signi�cantly better discrimination ability on OS prediction with C-index.The risk assessment ability of AML-DRG and AML-HCT-CR may be better than that of ELN2017 genetic risk,DRI and HCT-CI/Age models.
DiscussionRisk strati�cation is essential to predict the prognosis of patients with AML receiving AHCT. Recently, theAML-DRG and AML-HCT-CR models, which combines DRI, HCT-CI, ELN2017 risk classi�cation, MRD andother important prognostic factors, was published and has demonstrated a signi�cant impact in terms ofOS and PFS [21]. In this study, we examined the effect of the AML-DRG and AML-HCT-CR models on clinicaloutcomes of AHCT. The results demonstrated that both AML-DRG and AML-HCT-CR models couldsigni�cantly predict the OS, PFS and relapse. While the NRM and GVHD did not reach statisticalsigni�cance.

Page 8/20
In our monocenter retrospective study including 123 patients with AML, we con�rmed that the AML-DRG andAML-HCT-CR models have a prognostic prediction on OS and PFS (all p<0.001). This is consistent with thereference publication. Kongtim et al [21] reported that the OS at 5 years for low-, intermediate- and high-riskAML-DRG risk groups were 62.8%, 33.1% and 12.6%, respectively, and 5-year PFS were 60.4%, 31.1%, and7.9%, respectively. The OS at 5 years for low-, intermediate-, high- and very high-risk AML-HCT-CR risk groupswere 71.1%, 53.6%, 37.4%, and 12.7%, respectively, the corresponding PFS at 5 years were 67.4%, 51.7%,36.2%, and 9.6%, respectively. We also performed pairwise comparisons in survival analysis among differentgroups. The results showed that for AML-DRG, all pairwise comparisons were statistically signi�cant.However, unlike the reference publication, we did not �nd the difference of OS between AML-HCT-CR low-riskand intermediate-risk group (65.4% vs 52.0%, p=0.365), high-risk and very high-risk group (11.1% vs 8.3%,p=0.329). Fist, this is a single-centre study, the sample of high- and very high-risk AML-HCT-CR patients wasrelatively small. Second, in our study, the conditioning regimens included busulfan (Bu)- and total bodyirradiation (TBI)-based regimens in patients, while the reference publication included busulfan (Bu)- andMelphalan-based regimens. Third, unlike the reference publication, only one patient in our sample was olderthan 60 years. Perhaps these reasons caused our results to be different from the reference publication.Therefore, a multi-center clinical trial is required to con�rm the �ndings from the reference publication. Themultivariable analyses have shown that prognostic prediction of the AML-DRG and AML-HCT-CR models onpost-transplant survival was independent to age, sex, conditioning type, transplant modality, and stem cellsource (p<0.001; p<0.001). This means that the model can be applied in patients transplanted using bothHLA-matched and unmatched donors.
Since the AML-DRG and AML-HCT-CR models have been developed and validated their utility in mortalityprediction, we further identi�ed the speci�c cause of mortality. Our study found that the AML-DRG and AML-HCT-CR models were associated with the 3-year OS, mainly due to relapse. The AML-DRG model categorizedpatients into 3 distinct relapse risk groups, with 3-year cumulative incidence of relapse ranging between13.6% for the low-risk group to 50.0% for the high-risk group. Similar results were found for the AML-HCT-CRmodel (13.6% for the low-risk group and 41.7% for the very high-risk group). The results suggest that for thepatients in the intermediate and high-risk groups of AML-DRG and AML-HCT-CR models, MRD and otherrelated indexes should be closely monitored after transplantation, and maintenance treatment or pre-emptive treatment should be given, so as to reduce the risk of recurrence and improve the e�cacy of thetransplantation. Patients in the very high-risk AML-HCT-CR group had higher recurrence and NRM rates,especially high NRM rates (41.7% for relapse rate and 50.0% for NRM rate). These patients usually hadadvanced-stage disease and/or high comorbidities burden before AHCT, which suggested that they had ahigher risk of disease relapse and may be vulnerable to drug toxicities and transplant complications. A lowerintensity conditioning regimen may help to prevent the transplant-related toxicity and mortality. However,this may lead to high relapse rates after AHCT, particularly for those with relapse/refractory leukemia [6, 7].Therefore, how to prevent relapse after AHCT on the basis of controlling the toxicity of the conditioningregimen is important to improve the clinical outcome of patients with very high-risk AML-HCT-CR group.
Our study found that the AML-DRG and AML-HCT-CR models had a signi�cantly better discrimination abilityon OS prediction with Harrell C-index of 0.680 and 0.705, respectively, when compared with the DRI model(C-index 0.593), HCT-CI/Age (C-index 0.580) and ELN2017 risk classi�cation (C-index 0.519). This was

Page 9/20
partially in accordance with the reference study in which the AML-DRG and AML-HCT-CR modelssigni�cantly better predicted risk of death after transplant with C-indices of 0.672 and 0.715, respectively[21]. It demonstrated that AML-DRG and AML-HCT-CR models provide better tools for risk strati�cation ofpatients.
In addition, both AML-DRG and AML-HCT-CR models were not prognostic for NRM and GVHD, those data arealso very important for HSCT choice. Further incorporation of NRM- and GVHD- related speci�city indicatorsmay help to achieve a more comprehensive scoring system. Although HCT-CI had been considered beprognostic of NRM and GVHD [16, 26, 27], we did not �nd AML-HCT-CR be prognostic for NRM and GVHD. Apossible explanation for our results is that combining AML-DRG and HCT-CI probably weakens the weight ofHCT-CI in NRM and GVHD prognostication.
ConclusionIn conclusion, our data con�rm results similar to the reference publication and provide useful information onOS, PFS, relapse, and NRM prediction. The AML-DRG and AML-HCT-CR models allow better strati�cation andimproved survival estimates of AML patients post-transplant. Considering the absence of prognosis forNRM and GVHD, we recommend using the AML-DRG and HCT-CI separately to obtain more accurate andrelevant information to guide transplant choice.
AbbreviationsaGVHD acute GVHD
AHCT allogeneic hematopoietic stem cell transplantation
AML acute myeloid leukemia
AML-DRG AML-speci�c disease risk group
AML-HCT-CR AML-Hematopoietic Cell Transplant-composite risk
ATG anti-thymocyte globulin
BMSC bone marrow stem cell
Bu busulfan
cGVHD chronic GVHD
CI con�dence interval
CR complete remission
DRCI disease risk comorbidity index

Page 10/20
DRI disease risk index
ELN2017 genetic risk European Leukemia Net 2017 genetic risk
HCT-CI hematopoietic cell transplantation-speci�c comorbidity index
HR hazard ratio
ISD identical sibling donor
MRD minimal residual disease
NRM non-relapse mortality
OS overall survival
PBSC peripheral blood stem cell
PFS progression-free survival
TBI total body irradiation
TRM transplant-related mortality
Declarations
Availability of data and materialsData and material will be available upon corresponding author approval. All data sets generated/analysedfor this study are included in the manuscript and the additional �les.
AcknowledgmentsThis work was supported by the Project of Henan Provincial Education Department, China (20A320062,recipient JY), Project of Science and Technology Department of Henan Province, China (LHGJ20190039,recipient JY), Project of Science and Technology Department of Henan Province, China (SBGJ20202076,recipient JY), Talent Research Fund of the First A�liated Hospital of Zhengzhou University, Zhengzhou,China (recipient JY), and Key scienti�c research projects of colleges and universities in Henan Province,China (recipient WC),
Ethics approval and consent to participateInformed consent was obtained for study participation from all patients, parent and/or legal guardian forminors and the protocol was approved by the Ethics Committee of the First A�liated Hospital of Zhengzhou
Page 11/20
University
Consent for publicationAll authors critically reviewed and approved the �nal manuscript.
Competing interests
The authors declare no con�ict of interest.
Author contributionsJ.Y. and D.W. designed and directed the study. W. C. and X.L. wrote the manuscript.
R.Z., Z.B., S.Z., L.L., H.X., C.L., X.X., Z.J. and D.W. contributed for the clinical data and patients’ treatment. Allauthors critically reviewed and approved the �nal manuscript.
Authors informationThe First A�liated Hospital of Zhengzhou University, Zhengzhou, 450052, Henan, China.
Weijie Cao, Xiaoning Li, Ran Zhang, Zhilei Bian, Suping Zhang, Li Li, Haizhou Xing, Changfeng Liu, XinshengXie, Zhongxing Jiang, Jifeng Yu and Dingming Wan.
Henan International Joint Laboratory of Nuclear Protein Gene Regulation, Henan University College ofMedicine, Kaifeng, 475004 Henan, China.
Jifeng Yu
References1. Yu J, Jiang PYZ, Sun H, Zhang X, Jiang Z, Li Y, et al. Advances in targeted therapy for acute myeloid
leukemia. Biomarker research. 2020;8:17.
2. Copelan EA. Hematopoietic stem-cell transplantation. The New England journal of medicine.2006;354(17):1813-26.
3. Yang X, Wang J. Precision therapy for acute myeloid leukemia. Journal of hematology & oncology.2018;11(1):3.
4. Tsirigotis P, Byrne M, Schmid C, Baron F, Ciceri F, Esteve J, et al. Relapse of AML after hematopoieticstem cell transplantation: methods of monitoring and preventive strategies. A review from the ALWP ofthe EBMT. Bone marrow transplantation. 2016;51(11):1431-8.
5. Bejanyan N, Weisdorf DJ, Logan BR, Wang HL, Devine SM, de Lima M, et al. Survival of patients withacute myeloid leukemia relapsing after allogeneic hematopoietic cell transplantation: a center for

Page 12/20
international blood and marrow transplant research study. Biology of blood and marrow transplantation: journal of the American Society for Blood and Marrow Transplantation. 2015;21(3):454-9.
�. Abdul Wahid SF, Ismail NA, Mohd-Idris MR, Jamaluddin FW, Tumian N, Sze-Wei EY, et al. Comparison ofreduced-intensity and myeloablative conditioning regimens for allogeneic hematopoietic stem celltransplantation in patients with acute myeloid leukemia and acute lymphoblastic leukemia: a meta-analysis. Stem cells and development. 2014;23(21):2535-52.
7. Rubio MT, Savani BN, Labopin M, Piemontese S, Polge E, Ciceri F, et al. Impact of conditioning intensityin T-replete haplo-identical stem cell transplantation for acute leukemia: a report from the acuteleukemia working party of the EBMT. Journal of hematology & oncology. 2016;9:25.
�. Terwijn M, van Putten WL, Kelder A, van der Velden VH, Brooimans RA, Pabst T, et al. High prognosticimpact of �ow cytometric minimal residual disease detection in acute myeloid leukemia: data from theHOVON/SAKK AML 42A study. Journal of clinical oncology : o�cial journal of the American Society ofClinical Oncology. 2013;31(31):3889-97.
9. Grimm J, Jentzsch M, Bill M, Goldmann K, Schulz J, Niederwieser D, et al. Prognostic impact of theELN2017 risk classi�cation in patients with AML receiving allogeneic transplantation. Blood advances.2020;4(16):3864-74.
10. Vicente D, Lamparelli T, Gualandi F, Occhini D, Raiola AM, Ibatici A, et al. Improved outcome in youngadults with de novo acute myeloid leukemia in �rst remission, undergoing an allogeneic bone marrowtransplant. Bone marrow transplantation. 2007;40(4):349-54.
11. Saber W, Opie S, Rizzo JD, Zhang MJ, Horowitz MM, Schriber J. Outcomes after matched unrelateddonor versus identical sibling hematopoietic cell transplantation in adults with acute myelogenousleukemia. Blood. 2012;119(17):3908-16.
12. Sengsayadeth S, Labopin M, Boumendil A, Finke J, Ganser A, Stelljes M, et al. Transplant Outcomes forSecondary Acute Myeloid Leukemia: Acute Leukemia Working Party of the European Society for Bloodand Bone Marrow Transplantation Study. Biology of blood and marrow transplantation : journal of theAmerican Society for Blood and Marrow Transplantation. 2018;24(7):1406-14.
13. Armand P, Gibson CJ, Cutler C, Ho VT, Koreth J, Alyea EP, et al. A disease risk index for patientsundergoing allogeneic stem cell transplantation. Blood. 2012;120(4):905-13.
14. Armand P, Kim HT, Logan BR, Wang Z, Alyea EP, Kalaycio ME, et al. Validation and re�nement of theDisease Risk Index for allogeneic stem cell transplantation. Blood. 2014;123(23):3664-71.
15. Sorror ML, Maris MB, Storb R, Baron F, Sandmaier BM, Maloney DG, et al. Hematopoietic celltransplantation (HCT)-speci�c comorbidity index: a new tool for risk assessment before allogeneic HCT.Blood. 2005;106(8):2912-9.
1�. Sorror ML, Storb RF, Sandmaier BM, Maziarz RT, Pulsipher MA, Maris MB, et al. Comorbidity-age index: aclinical measure of biologic age before allogeneic hematopoietic cell transplantation. Journal of clinicaloncology : o�cial journal of the American Society of Clinical Oncology. 2014;32(29):3249-56.
17. Bejanyan N, Brunstein CG, Cao Q, Lazaryan A, Ustun C, Warlick ED, et al. Predictive value of disease riskcomorbidity index for overall survival after allogeneic hematopoietic transplantation. Blood advances.2019;3(3):230-6.

Page 13/20
1�. Walter RB, Gooley TA, Wood BL, Milano F, Fang M, Sorror ML, et al. Impact of pretransplantationminimal residual disease, as detected by multiparametric �ow cytometry, on outcome of myeloablativehematopoietic cell transplantation for acute myeloid leukemia. Journal of clinical oncology : o�cialjournal of the American Society of Clinical Oncology. 2011;29(9):1190-7.
19. Walter RB, Buckley SA, Pagel JM, Wood BL, Storer BE, Sandmaier BM, et al. Signi�cance of minimalresidual disease before myeloablative allogeneic hematopoietic cell transplantation for AML in �rst andsecond complete remission. Blood. 2013;122(10):1813-21.
20. Liu J, Ma R, Liu YR, Xu LP, Zhang XH, Chen H, et al. The signi�cance of peri-transplantation minimalresidual disease assessed by multiparameter �ow cytometry on outcomes for adult AML patientsreceiving haploidentical allografts. Bone marrow transplantation. 2019;54(4):567-77.
21. Kongtim P, Hasan O, Perez JMR, Varma A, Wang SA, Patel KP, et al. Novel Disease Risk Model forPatients with Acute Myeloid Leukemia Receiving Allogeneic Hematopoietic Cell Transplantation.Biology of blood and marrow transplantation : journal of the American Society for Blood and MarrowTransplantation. 2020;26(1):197-203.
22. Döhner H, Estey E, Grimwade D, Amadori S, Appelbaum FR, Büchner T, et al. Diagnosis andmanagement of AML in adults: 2017 ELN recommendations from an international expert panel. Blood.2017;129(4):424-47.
23. Schuurhuis GJ, Heuser M, Freeman S, Béné MC, Buccisano F, Cloos J, et al. Minimal/measurableresidual disease in AML: a consensus document from the European LeukemiaNet MRD Working Party.Blood. 2018;131(12):1275-91.
24. Przepiorka D, Weisdorf D, Martin P, Klingemann HG, Beatty P, Hows J, et al. 1994 Consensus Conferenceon Acute GVHD Grading. Bone marrow transplantation. 1995;15(6):825-8.
25. Filipovich AH, Weisdorf D, Pavletic S, Socie G, Wingard JR, Lee SJ, et al. National Institutes of Healthconsensus development project on criteria for clinical trials in chronic graft-versus-host disease: I.Diagnosis and staging working group report. Biology of blood and marrow transplantation : journal ofthe American Society for Blood and Marrow Transplantation. 2005;11(12):945-56.
2�. Sorror ML, Martin PJ, Storb RF, Bhatia S, Maziarz RT, Pulsipher MA, et al. Pretransplant comorbiditiespredict severity of acute graft-versus-host disease and subsequent mortality. Blood. 2014;124(2):287-95.
27. Sorror ML, Giralt S, Sandmaier BM, De Lima M, Shahjahan M, Maloney DG, et al. Hematopoietic celltransplantation speci�c comorbidity index as an outcome predictor for patients with acute myeloidleukemia in �rst remission: combined FHCRC and MDACC experiences. Blood. 2007;110(13):4606-13.
Tables

Page 14/20
Table 1. Patient characteristics
AML-DRG AML-HCT-CR
Low Intermediate High Low Intermediate(n=25) High Veryhigh
(n=68) (n=43) (n=12) (n=68) (n=18) (n=12)
Gender,female (%)
28(41%)
23 (53%) 6(50%)
28(41%)
12 (48%) 11(61%)
6(50%)
Median age,years
32 (12-62)
30 (16-56) 28 (15-45)
32 (12-62)
27 (16-50) 32(16-56)
28 (15-51)
White bloodcells atdiagnosis,
23 (1-259)
27 (1-360) 27 (5-203)
23 (1-259)
18 (1-360) 32 (2-333)
28 (5-203)
×109 per L
AML type (%)
De novo 68(100%)
40 (93%) 9(75%)
68(100%)
24 (96%) 16(89%)
9(75%)
Secondary 0 (0%) 3 (7%) 3(25%)
0 (0%) 1 (4%) 2(11%)
3(25%)
ELN2017genetic riskgroup
Favorable 12(18%)
2 (5%) 0 (0%) 12(18%)
0 (0%) 2(11%)
0 (0%)
Intermediate 45(66%)
12 (28%) 1 (8%) 45(66%)
1 (4%) 11(61%)
1 (8%)
Adverse 11(16%)
29 (67%) 11(92%)
11(16%)
24 (96%) 5(28%)
11(92%)
MRD statusat transplant
CR with MRDnegative
23(34%)
1 (2%) 0 (0%) 23(34%)
0 (0%) 1 (6%) 0 (0%)
CR with MRDpositive
45(66%)
33 (77%) 1 (8%) 45(66%)
25 (100%) 8(44%)
0 (0%)
Activedisease
0 (0%) 9 (21%) 11(92%)
0 (0%) 0 (0%0 9 (5%) 12(100%)
Median HCT-CI
1 (0-2) 1 (0-4) 1 (0-1) 1 (0-2) 1 (0-1) 1 (1-4) 1 (0-3)
Median HCT-CI/Age
1 (0-3) 1 (0-5) 1 (0-2) 1 (0-3) 1 (0-2) 1 (1-5) 1 (0-4)

Page 15/20
DRI (%)
Low 4 (6%) 0 (0%) 0 (0%) 4 (6%) 0 (0%) 0 (0%) 0 (0%)
Intermediate 58(85%)
21 (49%) 1 (8%) 58(85%)
12 (48%) 9(50%)
1 (8%)
High 6 (9%) 22 (51%) 9(75%)
6 (9%) 13 (52%) 9(50%)
9(75%)
Very high 0 (0%) 0 (0%) 2(17%)
0 (0%) 0 (0%) 0 (0%) 2(17%)
Conditioningtype (%)
Busulfan-based
66(97%)
41 (95%) 12(100%)
66(97%)
25 (100%) 16(89%)
12(100%)
TBI-based 2 (3%) 2 (5%) 0 (0%) 2 (3%) 0 (0%) 2(11%)
0 (0%)
Donor type(%)
HLA-matchedsibling donor
37(54%)
21 (49%) 7(58%)
37(54%)
15 (60%) 5(28%0
8(67%)
HLA-matchedunrelateddonor
14(21%)
5 (12%) 0 (0%) 14(21%)
5 (20%) 0 (0%) 0 (0%)
HLA-haploidenticaldonor
17(25%)
17 (39%) 5(42%)
17(25%)
5 (20%) 13(72%)
4(33%)
Stem cellsource (%)
PBSC 64(94%)
39 (91%) 12(100%)
64(94%)
24 (96%) 15(83%)
12(100%)
PBSC +BMSC
4 (6%) 4 (9%) 0 (0%) 4 (6%) 1 (4%) 3(17%)
0 (0%)
Abbreviations: AML-acute myeloid leukemia; CR-complete remission; HC-CI/Age-comorbidity-age index;DRI-disease risk index; BMSC-bone marrow stem cell; PBSC-peripheral blood stem cell; TBI: total bodyirradiation

Page 16/20
Table 2. Outcomes of AHCT according to the AML-DRG and AML-HCT-CR models
3-yearOS,
3-yearPFS,
3-yearrelapse,
3-yearNRM,
Grade ~ aGVHD,%
ALL-gradecGVHD,%
%(95%CI)
%(95%CI)
%(95%CI)
%(95%CI)
(95%CI) (95%CI)
AML-DRG p<0.001 p<0.001 P=0.002 P=0.314 P=0.980 P=0.211
Low(n=68) 65.4(54.9-78.0)
64.0(53.5-76.7)
13.6 (8.7-18.5)
22.3(17.0-27.7)
19.1 (16.6-21.7) 31.3(25.6-37.0)
Intermediate(n=43)
34.9(23.2-52.5)
34.9(23.2-52.5)
30.2(22.3-38.2)
34.9(26.8-43.0)
18.6 (11.3-25.9) 20.9(13.4-28.4)
High(n=12) 8.3 (1.3-54.4)
8.3 (1.3-54.4)
50 (27.6-72.4)
41.7(19.0-64.4)
16.7 (0-36.0) 8.3 (0-25.8)
AML-HCT-CR p<0.001 p<0.001 P=0.005 P=0.095 P=0.610 P=0.252
Low(n=68) 65.4(54.9-78.0)
64.0(53.5-76.7)
13.6 (8.7-18.5)
22.3(17.0-27.7)
19.1 (13.9-24.3) 31.3(25.6-37.0)
Intermediate(n=25)
52.0(35.7-75.8)
52.0(35.7-75.8)
24.0(12.4-35.6)
24.0(12.4-35.6)
12.0 (1.9-22.1) 28.0(16.1-39.9)
High(n=18) 11.1 (3.0-41.0)
11.1 (3.0-41.0)
44.4(28.3-60.6)
44.4(28.2-60.7)
27.8 (12.6-43.0) 11.1 (0-24.1)
Very high(n=12) 8.3 (1.3-54.4)
8.3 (1.3-54.4)
41.7(19.7-63.6)
50.0(27.3-72.7)
16.7 (0.0-36.2) 8.3 (0-26.5)
Abbreviations: OS-overall survival; PFS-progression-free survival; NRM-non-relapse mortality; aGVHD-acute GVHD; cGVHD-chronic GVHD
Page 17/20
Table 3. Univariable analysis evaluating the impact of the HCT-CR model on OS and PFS
Univariable analysis for OS HR 95%CI P value
AML-DRG
Low Reference
Intermediate 2.29 1.33-3.93 0.003
High 5.14 2.50-10.57 <0.001
AML-HCT-CR
Low Reference
Intermediate 1.37 0.69-2.72 0.368
High 4.43 2.32-8.49 <0.001
Very high 5.82 2.81-12.04 <0.001
Univariable analysis for PFS
AML-DRG
Low Reference
Intermediate 2.34 1.37-4.01 0.002
High 5.57 2.71-11.48 <0.001
AML-HCT-CR
Low Reference
Intermediate 1.37 0.69-2.72 0.368
High 4.95 2.59-9.45 <0.001
Very high 6.15 2.96-12.73 <0.001
Abbreviations: HR-hazard ratio; CI-con�dence interval; OS-overall survival; PFS-progression-free survival.

Page 18/20
Table 4. Multivariable analysis for OS
AML-DRG AML-HCT-CR
Variable HR 95%CI Pvalue
HR 95%CI Pvalue
AML-DRG or AML-HCT-CR <0.001 <0.001
Low Reference Reference
Intermediate 2.26 1.30-3.93
0.004 1.62 0.81-3.28
0.172
High 4.52 2.01-9.72
<0.001 3 1.51-5.94
0.002
Very high 5.95 2.78-12.73
<0.001
Age (continuous variable) 1.03 1.01-1.06
0.02 1.03 1.00-1.06
0.024
Sex (male vs. female) 1.1 0.67-1.83
0.702 1.15 0.68-1.94
0.589
Conditioning type (Bu- vs. TBI-based)
1.32 0.40-4.35
0.647 1.16 0.35-3.90
0.81
PBSC vs. BMSC+PBSC 0.94 0.38-2.32
0.888 0.91 0.36-2.27
0.908
Transplant modality
HLA-matched sibling donor Reference Reference
HLA-matched unrelated donor 0.46 0.16-1.35
0.158 0.63 0.18-1.54
0.241
HLA-haploidentical donor 2.21 1.24-3.96
0.007 2.1 1.15-3.84
0.016
Abbreviations: HR-hazard ratio; CI-con�dence interval; BMSC-bone marrow stem cell; PBSC-peripheralblood stem cell; Bu: Busulfan; TBI: total body irradiation
Figures

Page 19/20
Figure 1
1A. Overall survival of in patients with low, intermediate and high risk groups with AML-DRG B. Cumulativeincidence of relapse in patients with low, intermediate and high risk groups C. Cumulative incidence of NRMin patients with low, intermediate and high risk groups

Page 20/20
Figure 2
A. Overall survival of in patients with low, intermediate, high and very high risk groups with AML-HCT-CR B.Cumulative incidence of relapse in patients with low, intermediate, high and very high risk groups. C.Cumulative incidence of NRM in patients with low, intermediate, high and very high risk groups