paul c. bressloff and andrew m. oster- theory for the alignment of cortical feature maps during...
TRANSCRIPT

8/3/2019 Paul C. Bressloff and Andrew M. Oster- Theory for the alignment of cortical feature maps during development
http://slidepdf.com/reader/full/paul-c-bressloff-and-andrew-m-oster-theory-for-the-alignment-of-cortical 1/10
Theory for the alignment of cortical feature maps during development
Paul C. Bressloff Mathematical Institute, University of Oxford, 24-29 St. Giles, Oxford OX1 3LB, United Kingdom
and Department of Mathematics, University of Utah, 155 South 1400 East, Salt Lake City, Utah 84112, USA
Andrew M. OsterGroup for Neural Theory, INSERM 960, Département d’Études Cognitives,
École Normale Supérieure, 29 Rue d’Ulm, 75005, Paris, Franceand Department of Mathematics, University of Utah, 155 South 1400 East, Salt Lake City, Utah 84112, USA
Received 20 June 2010; revised manuscript received 3 August 2010; published 23 August 2010
We present a developmental model of ocular dominance column formation that takes into account theexistence of an array of intrinsically specified cytochrome oxidase blobs. We assume that there is somemolecular substrate for the blobs early in development, which generates a spatially periodic modulation of experience-dependent plasticity. We determine the effects of such a modulation on a competitive Hebbianmechanism for the modification of the feedforward afferents from the left and right eyes. We show howalternating left and right eye dominated columns can develop, in which the blobs are aligned with the centersof the ocular dominance columns and receive a greater density of feedforward connections, thus becomingdefined extrinsically. More generally, our results suggest that the presence of periodically distributed anatomi-
cal markers early in development could provide a mechanism for the alignment of cortical feature maps.DOI: 10.1103/PhysRevE.82.021920 PACS numbers: 87.19.lp
I. INTRODUCTION
One of the most striking manifestations of the columnarorganization of primary visual cortex V1 are the cyto-chrome oxidase CO blobs found in both primates 1,2 andcats 3. These regions, which on average are about 0.2 mmin diameter and 0.5 mm apart, coincide with cells that aremore metabolically active and hence richer in their levels of CO. The spatial distribution of CO blobs within cortex iscorrelated with a number of periodically repeating feature
maps, in which local populations of neurons respond prefer-entially to stimuli with particular properties such as orienta-tion, spatial frequency, and ocular dominance OD. For ex-ample, in the macaque monkey the blobs are found at evenlyspaced intervals along the center of OD columns 2, andneurons within the blobs tend to be less binocular and lessorientation selective 4. The blobs are also linked with lowspatial frequency domains 5 and appear to be coincidentwith singularities in the orientation preference map 6. Simi-lar functional relationships have been shown in cat exceptthat they tend to be weaker 3,7. That is, although blobsavoid OD borders in cat visual cortex, they are not strictlyaligned along the center of the columns. The arrangement of
CO blobs is also reflected anatomically by the distribution of intrinsic horizontal connections, which tend to link blobs toblobs and interblobs to interblobs 4,8,9, and by extrinsiccorticocortical connections linking blobs to specific compart-ments in prestriate cortex V2 and other extrastriate areas4,10. Taken together these observations suggest that the COblobs are sites of functionally and anatomically distinctchannels of visual processing.
In macaque both CO blobs and OD columns emerge pre-natally, so that at birth the pattern of OD columns and theirspatial relationship with blobs are adultlike. Moreover, thisspatial relationship and the spacing of CO blobs do not ap-pear to be influenced by visual experience 11,12. In con-
trast, the cat’s visual cortex is quite immature at birth. Forexample, supragranular layers of cat V1 differentiate postna-tally and the blobs in these layers are normally first visiblearound 2 weeks of age about 1 week after eye opening and1 week before the critical period. This is approximately co-incident with the earliest observation of OD columns in cats13. However, in contrast to the OD columns, altering visualexperience by monocular or binocular deprivation or darkrearing does not affect the pattern of blobs, suggesting that
visual experience is not necessary for the initial expressionor early development of CO blobs in cat 14. Thus, the lackof influence of visual experience on CO blob development inboth cats and primates suggests that the blobs may reflect aninnate columnar organization within superficial layers of cor-tex 12,14. An intrinsic cortical specification of the blobs,which is distinct from the competition-driven developmentof cortical circuitry, could be generated by a periodic array of molecular markers. In addition to cytochrome oxidase, thereare a number of other molecular markers that are arranged ina patchy fashion during early development. These include N -methyl- D-asparatic acid NMDA receptors 15, whichplay a key role in experience-dependent plasticity, serotoninreceptors, and synaptic zinc 16. Interestingly, the distribu-
tions of these latter markers are sensitive to visual experi-ence, and these latter markers are periodically distributed in amanner precisely complementary to cytochrome oxidase,thus tending to be located at OD column borders.
Activity-based developmental models of ocular domi-nance columns in visual cortex typically involve someHebbian-like competitive mechanism for the modification of left L and right R eye afferents 17–19. Intrinsic intrac-ortical interactions consisting of short-range excitation andlonger-range inhibition mediate a pattern forming instabilitywith respect to the feedforward synaptic weights, leading tothe formation of alternating left and right eye dominated col-umns. The formation of the columns is sensitive to changes
PHYSICAL REVIEW E 82, 021920 2010
1539-3755/2010/822 /02192010 ©2010 The American Physical Society021920-1
8/3/2019 Paul C. Bressloff and Andrew M. Oster- Theory for the alignment of cortical feature maps during development
http://slidepdf.com/reader/full/paul-c-bressloff-and-andrew-m-oster-theory-for-the-alignment-of-cortical 2/10
in the degree of correlation among the afferents serving thetwo eyes. The intracortical interactions are usually taken tobe homogeneous, so there is no mechanism for aligning thecolumns with an array of CO blobs. In this paper, we showhow such an alignment can occur when there is a spatiallyperiodic modulation of experience-dependent plasticity by anarray of anatomical markers, which are assumed to provide
an intrinsic substrate for the CO blobs early in development.The basic alignment mechanism involves mode-locking be-tween spatial frequency components of the distribution of CO blobs and the emerging pattern of OD columns under theassumption of commensurability between the lateral interac-tions and the spacing of the molecular marker. We also showthat the blobs develop a higher density of feedforward con-nections, so that they ultimately become defined extrinsi-cally, as they are manifested in their staining in layer II/III of cortex. Although not considered in this work, such a spatiallydistributed marker might play a role in the development of patchy long-range connections within cortex that have aspacing inline with the CO blobs. Such an intrinsic patchi-
ness of the long-range horizontal circuitry could then affectthe developing formation of feature maps in V1 20–22.
From a more general perspective, our model is an ex-ample of a hybrid model that combines both activity-independent and activity-dependent processes. Most devel-opmental models keep these processes separate, either bypositing them as alternative explanations for the same phe-nomenon or by assuming that they contribute to differentstages of development. Indeed, a common assumption is thatactivity-independent effects are responsible for setting up acoarse-grained version of a given feature map, which is thenfurther refined by activity. Another example of a hybridmodel occurs in the theory of topographic map formation,
that is, the mapping of spatial position from eye to brain23,24. The molecular cues in this type of model are as-sumed to set up some sort of chemical gradient that providesa label for spatial position 25. This should be contrastedwith our model of ocular dominance formation, in whichmolecular cues are distributed in a periodic fashion. Such adistribution could itself arise from a diffusion-driven insta-bility 26.
II. DEVELOPMENTAL MODEL
There are a variety of activity-dependent developmentmodels that generate ocular dominance columns and that canaccount for various visual deprivation experiments 19.
Since the basic alignment mechanism we propose is indepen-dent of the details of any particular model, we will focus onone of the simplest of such models, namely, the Swindalemodel of ocular dominance column formation 17. Thistreats input layer IV of the cortex as a two-dimensional sheetof neural tissue and considers competition between the syn-aptic densities of feedforward afferents from the left andright eyes. Certain care has to be taken when extending sucha model to incorporate CO blobs since the latter are found insuperficial layers II/III of cortex rather than the input layer.In our simplified model, we collapse these into a single hy-brid layer, motivated by the fact that there are strong verticalconnections between layers early in development 27.
Let n Lr , t and n Rr , t denote the densities of left andright eye synaptic connections to a point r = x , y on thecortex at time t . The feedforward weights of the left and righteyes are taken to evolve according to a slightly modifiedversion of the competitive Hebbian learning rule introducedby Swindale 17:
ni
t = − ni + M F N ni
+ F N ni j= R, L
wijr − rn jr,t d r, 1
where i= L / R. The logistic function F N n =n N −n ensuresthat growth terminates at a maximum weight N and that theweights remain positive, that is, 0n N . The term−n+ M for 0 represents a process that tends to stabi-lize the uniform binocular state n L=n R = M for some constant M , which is identified as the initial state prior to the onset
of activity-driven synaptic modification. The transition tothe activity-driven phase could be modeled as a reductionin the parameter . The lateral interaction functionsw LL , w LR , w RL , w RR are taken to be difference of Gauss-ians of the form
wr = Ae−r 2/2 E 2
− Be−r 2/2 I 2, 2
where E , I are space constants with E I . Same-eye inter-actions RR and LL have A B0 and opposite-eye inter-actions RL and LR have A B0. The lateral interactionfunctions encompass the correlation structure of the presyn-aptic and postsynaptic activities as well as the horizontal
interlaminar cortical connections see the review in 19.Equation 1 reduces to the Swindale model if =0 and themaximal density N is spatially uniform.
We now incorporate the effects of an intrinsically definedarray of CO blobs by taking N to be spatially correlated withthe locations of the blobs. This is motivated by the recentexperimental data suggesting that the CO blobs are initiallyexpressed in terms of some patchy anatomical marker thatcan modulate synaptic plasticity 12,14,15. For example,such markers could regulate NMDA subunit expression,which is thought to be an important mechanism for metaplas-ticity 28. As mentioned above, the upper bound for tha-lamic input is nonuniform in adult animals when considering
a compressed laminar model of V1. The CO blob marker isdirectly coupled with additional thalamic input that inner-vates the supragranular layers in cortex layers II/III,whereas the majority of direct thalamic input innervateslayer IV which stains uniformly for CO. In contrast to this,early in development Murphy et al. observed weak patchyCO staining in layer IV of normal young kittens 2–2.5weeks postnatally 14. Since CO blobs are associated withhigher levels of metabolic activity and direct thalamic input,these findings suggest that the thalamic innervation becomesspatially periodic early in development, before the emer-gence of OD columns. Thus, we postulate that the marker forthe CO blobs locally enhances experience-dependent plastic-
PAUL C. BRESSLOFF AND ANDREW M. OSTER PHYSICAL REVIEW E 82, 021920 2010
021920-2

8/3/2019 Paul C. Bressloff and Andrew M. Oster- Theory for the alignment of cortical feature maps during development
http://slidepdf.com/reader/full/paul-c-bressloff-and-andrew-m-oster-theory-for-the-alignment-of-cortical 3/10
ity, which in the Swindale model can be interpreted as a localincrease in N , that is, we assume a periodic modulation of theupper bound of the synaptic weights.
Letting ur denote the patchy distribution of the COmarker, we set
N r = N ¯ + ur, 3
where N ¯ is a base line level for the maximal density of feed-forward afferents and is a positive constant that determinesthe strength of the modulation. The distribution ur hasmaxima at the CO blob centers, which are located at the sites of a two-dimensional lattice L. In order to elucidate thebasic principles underlying our theory of corticalalignment, we will take L to be a regular planar lattice= m11+m22d for integers m1 , m2 with 1 , 2 as thegenerators of the lattice and d as the lattice spacing. We willsubsequently show in Sec. III that the proposed alignmentmechanism is robust with respect to disorder in the distribu-tion of CO blobs 12, as well as disorder in the OD column
pattern. If is the angle between the two basis vectors
1 and2, then there are three types of planar lattices distinguishedby the value of : square lattice = /2, rhombic lattice0 /2, /3, and hexagonal lattice = /3.The density ur is assumed to be a doubly periodic functionon the planar lattice L, that is, ur + =ur for all latticevectors .
Note that there are a number of other ways in which aperiodic modulation due to some chemical marker could beintroduced into the developmental model 1. For example,there could be an extra additive contribution to the level of activity such that wijn j→wijn j +u. However, this presup-poses that the CO blobs have already been established assites of enhanced activity, perhaps through an increase in thedensity of feedforward afferents. On the other hand, we pos-tulate that the chemical marker modifies some aspect of syn-aptic plasticity, which in the Swindale model we take to bethe maximum synaptic density N . In more detailed models of the competitive process underlying synaptic modification29,30, this could be interpreted as a modulation in the locallevel of neurotrophic factors; an analogous feature could alsobe incorporated into the correlation-based model of Milleret al. 18 by modulating the weight constraints. Yet anotherpossibility would be to introduce a spatially periodic varia-tion in the rate of synaptic development −1. At the linearlevel, all of these forms of modulation would provide amechanism for the spatial mode-locking of the OD columns
to an array of CO blobs see Sec. II A 2. However, in theparticular case of a periodic modulation in the total density N , one finds that the developing pattern of OD columns natu-rally forms a higher density of feedforward afferents aroundthe CO blobs, which is consistent with what is found in adultcortex. The other cases would require an additional mecha-nism to achieve this.
A. Linear stability analysis
Following Swindale 1980, we impose the left-right eyesymmetry constraints w LL =w RR =−w LR =−w RL =w. Equation1 reduces to the form
ni
t = − ni + M F N ni + 2F N ni wr − rn−r,t d r,
4
where n= n Ln R /2 with i= L / R. It follows that the onlynonzero homogeneous equilibrium is the binocular state
n L
=n R
= M . The linear stability of the uniform binocular statecan be determined by setting n jr , t = M +n jr , t and ex-panding Eq. 4 to first order in n j. In terms of the sum anddifference densities n= n Ln R /2 we find that
n+r,t
t = − n+r,t H r, 5
n−r, t
t = − n−r, t + wr − rn−r, t d r
H r, 6
where
H r = M N ¯ + ur − M . 7
We will assume that N ¯ M so that H r is always positive. Itfollows that if 0 then n+r , t →0 as t →, so that thestability of the binocular state n jr = M will depend on theasymptotic behavior of n−. Writing n−r , t =et / ar, weobtain the linear eigenvalue equation
ar = − ar + wr − rard r H r . 8
The binocular state will be stable provided that all solutionsof Eq. 8 satisfy Re0. Note that if =0 then the equi-
librium is only marginally stable with respect to small per-turbations n+ of the total density, and one has to impose anadditional constraint in order to specify the equilibriumuniquely 17.
1. Homogeneous case ( = 0)
Let us first ignore the modulatory effect of the CO blobs
by setting =0 so that H r= M N ¯ − M . Since Eq. 8 ishomogeneous when =0, it has solutions of the formar =eik·r, where k denotes two-dimensional spatial fre-quency and the growth factor satisfies the dispersion rela-tion
= k − + W ˆ k M N ¯ − M , 9
with W ˆ k as the two-dimensional Fourier transform of
wr, that is, W ˆ k =e−ik·rwrd r with k = k. Since w sat-
isfies Eq. 2, it follows that W ˆ is a difference of Gaussianswith a positive maximum at a nonzero wave number k c:
W ˆ k = 2 E 2 Ae− E
2 k 2/2 − I 2 Be− I
2k 2/2. 10
If W ˆ k c then the equilibrium is stable with respect to
local perturbations. On the other hand, if W ˆ k c0 thenthe equilibrium is unstable due to the growth of a finite band
THEORY FOR THE ALIGNMENT OF CORTICAL FEATURE… PHYSICAL REVIEW E 82, 021920 2010
021920-3
8/3/2019 Paul C. Bressloff and Andrew M. Oster- Theory for the alignment of cortical feature maps during development
http://slidepdf.com/reader/full/paul-c-bressloff-and-andrew-m-oster-theory-for-the-alignment-of-cortical 4/10
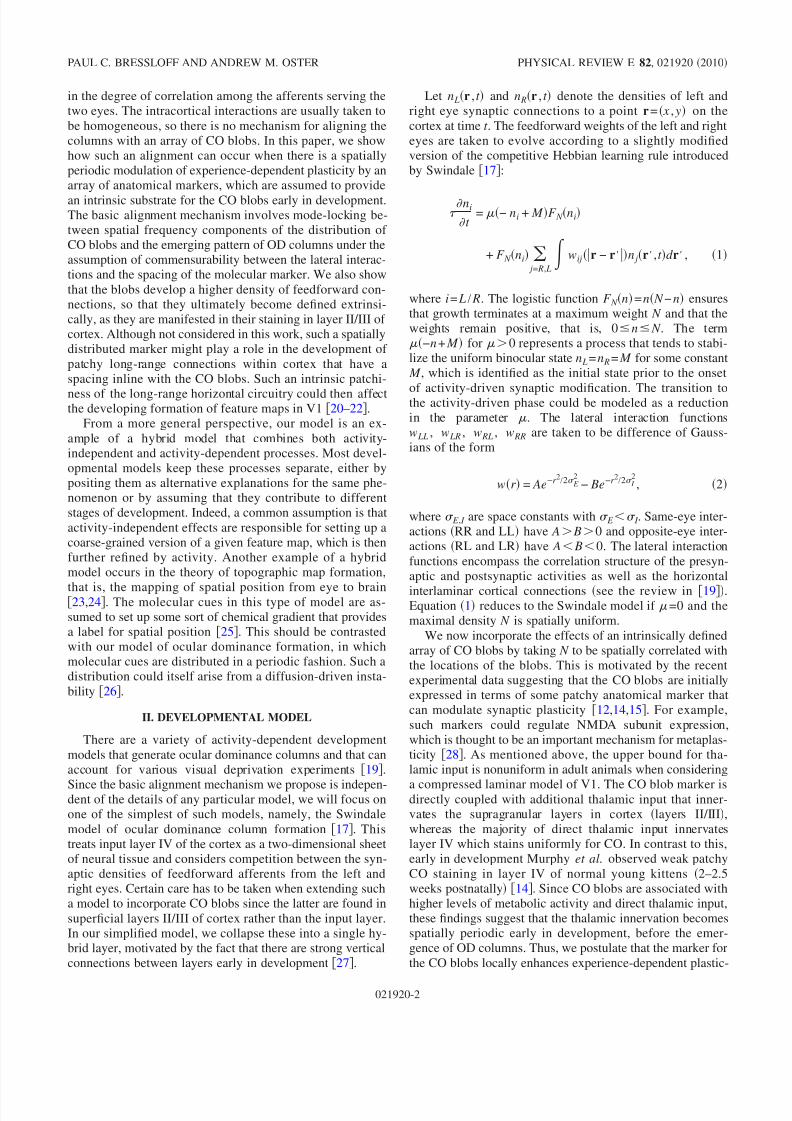
of Fourier modes lying in some interval containing k csee Fig. 1. Treating as a bifurcation parameter, we seethat there is a primary pattern forming instability at
=c W ˆ k c. Sufficiently close to the bifurcation point,
this instability leads to the formation of a spatially periodicstripe pattern of the form n−r= A cosk · r + withk k c. This represents alternating left and right eye oculardominance columns of approximate width /k c, each of which is a stripe running orthogonal to the direction of k.Ignoring boundary effects, the direction argk and spatialphase of the stripe pattern are arbitrary when =0, whichreflects the rotational and translational symmetries of the ef-fective lateral interactions w. In the case =0 considered bySwindale 17, the band of unstable modes extends to suchthat the dynamics is far from the primary bifurcation pointsee Fig. 1. The emerging pattern tends to have a moredisordered stripelike morphology, which is consistent with
the pattern of OD columns found in macaque. 2. Inhomogeneous case ( 0)
Including the effects of the CO blobs by taking 0breaks continuous rotation and translation symmetries, sothat the spatial phase and direction of the pattern will nolonger be arbitrary. In fact, for certain critical wave vectorsthe pattern locks to the lattice of blobs in an analogous fash-ion to the pinning of flow patterns observed in periodicallyforced convective fluid systems 31–33. A heuristic way tounderstand this pinning is to note that the factor H r tendsto enhance the rate of pattern growth at the blob centers, thatis, at the lattice sites L. Thus, there is a tendency for the
extrema of the resulting pattern to be located at the blobs,and this effect will be strongest when the selected pattern iscommensurate with the lattice. The pinning mechanism es-sentially involves mode locking between spatial frequencycomponents of the emerging pattern of OD columns and thedistribution of CO blobs. The coupling between these fre-quency components can be analyzed at the linear level byexpanding Eq. 8 as a Fourier series.
In order to elucidate further the pinning mechanism, weconsider the simpler case of a one-dimensional network witha periodic distribution of CO blobs: u x =q U qeiqx, whereq=2 m /d for integers m and d is the CO blob spacing. Wealso impose the periodic boundary condition a=a0,
where is the system size. In making this assumption, weare assuming that we are sufficiently far away from both thefovea and the boundary. The visual cortex is large comparedto the section of cortex that we are simulating; moreover, thedeveloped visual cortex has an intrinsic periodicity, suggest-ing that periodic boundary conditions are a natural choice.
The one-dimensional version of Eq. 8 can then be
analyzed by introducing the Fourier series expansiona x=−1k Ak e
ikx with k =2 m / for integers m the peri-odic boundary conditions restrain the spectrum to be dis-crete. Substitution into Eq. 8 yields the eigenvalue equa-tion after rescaling and
+ − W ˆ k Ak = qV qk Ak −q, 11
where W ˆ k is now the one-dimensional Fourier transform
W ˆ k =−
e−ikxw xdx = 2 E Ae− E 2 k 2/2 − 2 I Be− I
2k 2/2,
12
V qk = − + W ˆ k − q U q. 13
At this point, we note here that Eq. 11 arises in previousstudies examining the role of long-range periodic intracorti-cal connections on pinning cortical activity patterns to theunderlying cortical structure 34. Equation 11 implies thatthe periodic modulation only couples together those coeffi-cients Ak , Ak −q1
, Ak −q2, . .. whose wave numbers differ by qm
=2 m /d . In other words, if we fix k then a x =eikxbk x withbk x given by the d -periodic function bk x=q Ak −qe−iqx.
It is generally not possible to find exact solutions of theeigenvalue equation 11. However, one can proceed bytreating as a small parameter and carrying out a perturba-tion analysis along similar lines to a recent study of sponta-neous cortical activity patterns 21,34. Here, we will presenta perturbation argument for the occurrence of pinning. Let k cbe the critical wave number for a pattern forming instability
when =0. That is, W ˆ k cW ˆ k for all k 0, k k c.Suppose that k c is commensurate with the lattice spacingd when =0, that is, k c =m /d for some integer m. Itfollows that the pair of coefficients Ak associated with thedominant wave number k =k c are coupled in Eq. 11 since−k c =k c −Q for Q=2 m /d . This implies that there is an ap-proximate twofold degeneracy, and we must treat Eq. 11separately for the two cases k and k −Q. Thus, to first orderin , Eq. 11 reduces to a pair of equations for the coeffi-cients Ak and Ak −Q:
− E k − V Qk
− V −Qk − Q − E k − Q Ak
Ak −Q = 0,
where E k =−+W ˆ k + V 0k . We will assume thatu x is an even function of x so that U Q = U −Q. Since
W ˆ k c =W ˆ k c−Q and W ˆ k c =0, it follows that fork =m /d +O , the above matrix equation has solutions of the form to first order in
w(r)
r
h(k)
kkc
(a) (b)
+ > 0
+ = 0
FIG. 1. a Difference of Gaussians lateral interaction functionwr showing short-range excitation and long-range inhibition. b
Dispersion curve k =−+ W ˆ k . The shaded regions indicate theband of unstable eigenmodes around the critical wave number k cwhere W ˆ k c=maxk W ˆ k . Black: unstable modes for 0.Black+gray: unstable modes for =0.
PAUL C. BRESSLOFF AND ANDREW M. OSTER PHYSICAL REVIEW E 82, 021920 2010
021920-4
8/3/2019 Paul C. Bressloff and Andrew M. Oster- Theory for the alignment of cortical feature maps during development
http://slidepdf.com/reader/full/paul-c-bressloff-and-andrew-m-oster-theory-for-the-alignment-of-cortical 5/10
k = − + W ˆ k + V 0k V Qk , 14
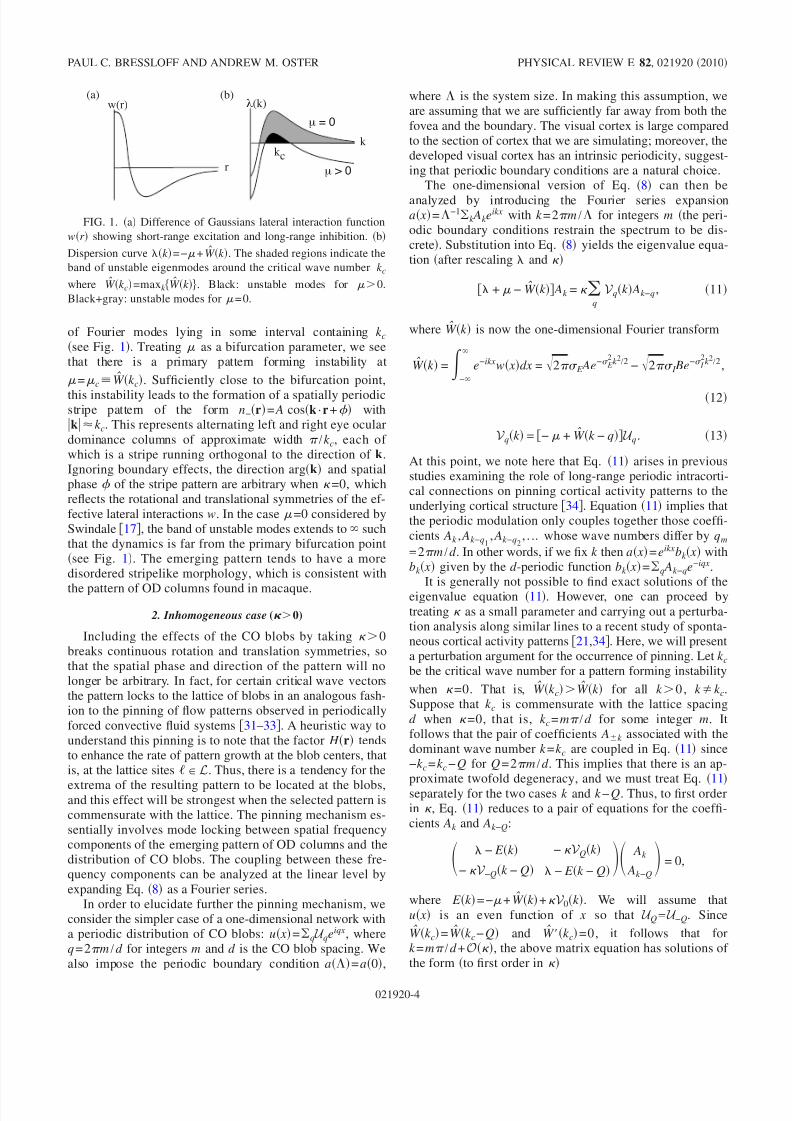
with Ak −Q = Ak . Thus, there is a splitting into the even andodd eigenmodes,
a+ x = A cosn x/d , a− x = A sinn x/d , 15
where A is an arbitrary amplitude at the linear level. The
even and odd eigenmodes for n=1 are shown in Fig. 2. Notethat the even mode has extrema at sites corresponding to theCO blobs, whereas the odd mode has extrema at sites corre-sponding to interblobs. Which of the two eigenmodes is se-lected by the pattern forming instability will depend on thesign of V Qk c for Q=2 /d . Assuming that U Q0 then theeven pattern will be selected leading to the formation of al-ternating left and right ocular dominance columns of width /d whose centers are located at the CO blob centers.
The major difference between the one- and two-dimensional versions of Eq. 8 is that in the latter case thereis an additional degeneracy arising from the isotropy of thelateral interactions w. In principle the pattern forming insta-
bility can excite any eigenmode eik·r lying on the criticalcircle k =k c for =0. However, when 0, continuous ro-tation symmetry is broken by the underlying lattice of COblobs, so that the OD stripes tend to favor particular direc-tions that reflect the discrete symmetries of the lattice. Themodulation term ur can be expanded as a two-dimensionalFourier series,
ur = qL̂
U qeiq·r, q = j=1,2
2 n j
d ̂
j, 16
where ̂ j are the generators of the reciprocal lattice
L̂ = q q ·=0 for all L with ̂ i · j = i, j. Such a term
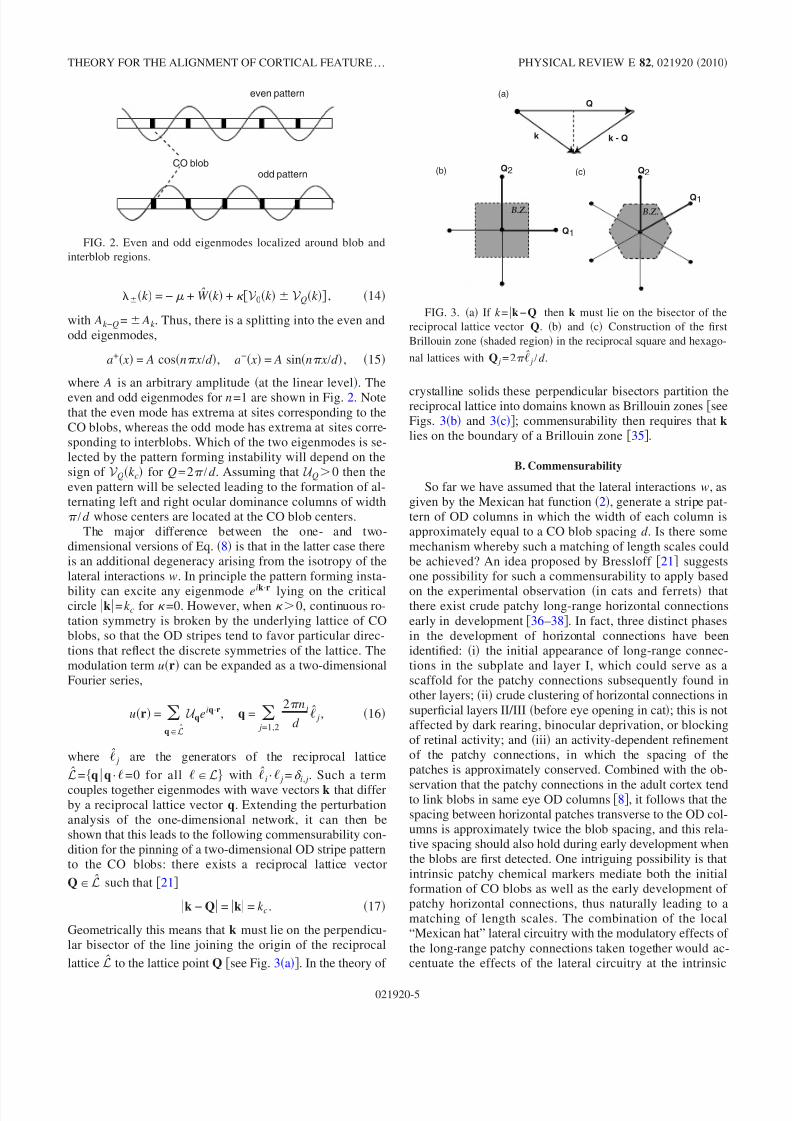
couples together eigenmodes with wave vectors k that differby a reciprocal lattice vector q. Extending the perturbationanalysis of the one-dimensional network, it can then beshown that this leads to the following commensurability con-dition for the pinning of a two-dimensional OD stripe patternto the CO blobs: there exists a reciprocal lattice vector
QL̂ such that 21
k − Q = k = k c . 17
Geometrically this means that k must lie on the perpendicu-lar bisector of the line joining the origin of the reciprocal
lattice L̂ to the lattice point Q see Fig. 3a. In the theory of
crystalline solids these perpendicular bisectors partition thereciprocal lattice into domains known as Brillouin zones seeFigs. 3b and 3c; commensurability then requires that k
lies on the boundary of a Brillouin zone 35.
B. Commensurability
So far we have assumed that the lateral interactions w, asgiven by the Mexican hat function 2, generate a stripe pat-tern of OD columns in which the width of each column isapproximately equal to a CO blob spacing d . Is there somemechanism whereby such a matching of length scales couldbe achieved? An idea proposed by Bressloff 21 suggestsone possibility for such a commensurability to apply based
on the experimental observation in cats and ferrets thatthere exist crude patchy long-range horizontal connectionsearly in development 36–38. In fact, three distinct phasesin the development of horizontal connections have beenidentified: i the initial appearance of long-range connec-tions in the subplate and layer I, which could serve as ascaffold for the patchy connections subsequently found inother layers; ii crude clustering of horizontal connections insuperficial layers II/III before eye opening in cat; this is notaffected by dark rearing, binocular deprivation, or blockingof retinal activity; and iii an activity-dependent refinementof the patchy connections, in which the spacing of thepatches is approximately conserved. Combined with the ob-
servation that the patchy connections in the adult cortex tendto link blobs in same eye OD columns 8, it follows that thespacing between horizontal patches transverse to the OD col-umns is approximately twice the blob spacing, and this rela-tive spacing should also hold during early development whenthe blobs are first detected. One intriguing possibility is thatintrinsic patchy chemical markers mediate both the initialformation of CO blobs as well as the early development of patchy horizontal connections, thus naturally leading to amatching of length scales. The combination of the local“Mexican hat” lateral circuitry with the modulatory effects of the long-range patchy connections taken together would ac-centuate the effects of the lateral circuitry at the intrinsic
even pattern
odd patternCO blob
FIG. 2. Even and odd eigenmodes localized around blob andinterblob regions.
Q
k k - Q
(a)
(c)(b)
B.Z.B.Z.
Q2
Q1
Q1
Q2
FIG. 3. a If k = k −Q then k must lie on the bisector of thereciprocal lattice vector Q. b and c Construction of the firstBrillouin zone shaded region in the reciprocal square and hexago-
nal lattices with Q j =2 ̂ j /d .
THEORY FOR THE ALIGNMENT OF CORTICAL FEATURE… PHYSICAL REVIEW E 82, 021920 2010
021920-5

8/3/2019 Paul C. Bressloff and Andrew M. Oster- Theory for the alignment of cortical feature maps during development
http://slidepdf.com/reader/full/paul-c-bressloff-and-andrew-m-oster-theory-for-the-alignment-of-cortical 6/10
blob spacing, that is, the Fourier mode associated with theblob spacing would be maximized.
III. RESULTS
As the amplitude of the selected pattern grows the dynam-ics will become dominated by nonlinearities arising from thelogistic function F N n. To what extent does the pinning of the OD pattern to the lattice of CO blobs persist when such
nonlinearities are included, and is the resulting patternstable? In order to investigate this issue, we numericallysolve Eq. 1 for both one- and two-dimensional networksusing periodic boundary conditions.
A. Pinning in a one-dimensional network
Consider the one-dimensional version of Eq. 1 with N =1+ u x and CO blob density
u x = 0.51 + cos2 x/d . 18
We choose the parameters of the Mexican hat function 2such that k c /d . Example space-time plots of the densitiesn+ x , t and n− x , t are shown in Fig. 4 for =0.4. It can beseen that the initial binocular state evolves into alternatingleft and right eye ocular dominance columns whose centersalign with the CO blobs. A periodic variation in the totaldensity of feedforward afferents also emerges, which can beunderstood as follows. If a point x lies within a left eye
ocular dominance column we expect n L x , t → N ¯ + u x andn R x , t →0 as t →, whereas we expect the opposite to oc-cur if x lies within a right eye column. This suggests thatthere will be a periodic variation in the total density of feed-
forward afferents such that n+ x N ¯ + u x /2. Thus, thepinning mechanism also provides a means for generating ahigher density of feedforward afferents to the CO blobs, so
that they ultimately become defined extrinsically. This isconsistent with what is found in the mature cortex, where theCO blobs in superficial layers are sites of enhanced meta-bolic activity resulting from a higher density of afferent in-puts. For example, in macaque the CO blobs receive addi-tional koniocellular inputs directly from the lateral geniculatenucleus LGN. When interpreting our numerical results,however, it is important to remember that we have collapsedsuperficial layers II/II and input layer IV into a single effec-tive layer. Thus, the ocular dominance columns shown inFig. 4 are more consistent with input layer IV since eachcolumn is predominately monocular. The variation in left or
right eye dominance is smoother in superficial layers, so thatthere is a more gradual transition from monocular to binocu-lar domains. On the other hand, the periodic variation in thetotal synaptic density is more consistent with superficial lay-ers where the CO blobs are located, since the total density of synapses is approximately uniform in the input layer IV.
How robust is the pinning mechanism with respect to pa-rameter variations in the strength of the periodic modula-tion or the mismatch k =dk c / −1 between the patternwavelength and the blob spacing? In order to answer thisquestion we introduce the following index for the degree of pinning:
= 1 − 4Pd p=1
P
x pOD − x p B , 19
where x pOD denotes the center of the pth OD column,
p= 1 , . . . , P, and x p B is the location of the nearest CO blob
center. The angular brackets · denote averaging over trialswith random initial conditions about the binocular state.Thus, =1 for perfect pinning, =−1 for perfect antipinning,and =0 for a random alignment in which x p
OD − x p B is uni-
formly distributed over the interval 0,d /2. In Fig. 5a weplot as a function of in the case c. It can be seenthat the degree of pinning tends to grow with the strength of modulation for fixed k c= /d although, even for quite large
time t (in units of τ)
s p
a c e
x
( i n
u n i t s
o f d )
0 350
0
8
(a)
s p a c e
x
( i n
u n i t s
o f d )
0 350
0
8
time t (in units of τ)
(b)
FIG. 4. Color online One-dimensional pinning of OD columnsto a periodic array of CO blobs. a Space-time plot of the densityn− x , t obtained by numerically solving a one-dimensionalversion of Eq. 4 for N =1+0.5 1+cos2 x /d with =0.4,=0.08c, and a network of size =8d . The parameters of theMexican hat function 2 are chosen to be A=1.8, B=1.0, E =0.29d , and I =0.72d , so that k c /d . The initial binocularstate gray evolves into alternating left and right eye ocular domi-nance columns colored white and black, respectively whose cen-ters align with the centers of the CO blobs indicated by red hori-
zontal lines. b Corresponding plot of n+ x , t showing theemergence of a periodic variation in the total density of feedforwardafferents white represents a high density of synaptic drive.
0 0.1 0.2 0.3 0.4-0.2
0
0.2
0.4
0.6
0.8
κ
d e g r e e
o f p i n n i n g
(a)
2 4 6 8 10 12 14 16
-1
-0.5
0
0.5
1
space x (in units of d)
d e n s i t y
n -
( x )
(b)
FIG. 5. a Plot of degree of pinning as a function of themodulation strength for k c= /d and =0.08 taken over 45 trialswith white noise about a binocular state. b One-dimensional ODpattern with a spatial phase defect. The steady-state density n− x isplotted as a function of x for =16d . Other parameter values are asin Fig. 4. It can be seen that pinning occurs except within a transi-tion region shaded in gray where the OD columns are graduallyshifted by an additional spatial phase equal to a single blob spacing.The variation in the CO blob density u x is shown by the alternat-ing light and dark dashed curve. The maxima of the density n− xshift from the dark to the light peaks of u x as x increases.
PAUL C. BRESSLOFF AND ANDREW M. OSTER PHYSICAL REVIEW E 82, 021920 2010
021920-6
8/3/2019 Paul C. Bressloff and Andrew M. Oster- Theory for the alignment of cortical feature maps during development
http://slidepdf.com/reader/full/paul-c-bressloff-and-andrew-m-oster-theory-for-the-alignment-of-cortical 7/10
values of , perfect pinning does not occur. The latter is dueto the occurrence of phase defects in a small number of tri-als; the existence of phase defects is a well-known phenom-
enon in the theory of spatial pattern formation 39. In ourparticular case, a phase defect corresponds to a localizedregion over which the centers of the ocular dominance col-umns are gradually shifted relative to the CO blob centers bya net spatial phase equal to a single blob spacing. An ex-ample is shown in Fig. 5b for a larger system size wherethe phase defect can be seen more clearly.
Now suppose that we take =0 as in the Swindale model17. Since the system is operating far from the bifurcationpoint when =0, it is outside the perturbative regime con-sidered in Sec. II A. In particular, we find that =O1 inorder for good pinning to occur see Fig. 6a. Another in-teresting feature also emerges for larger as illustrated in
Fig. 6b. Here, we plot the degree of pinning as a functionof k for fixed =1 black dots. As one might expect fromthe linear analysis of Sec. II B, pinning is maximal whenk 0 or k c /d , that is, when the pattern wavelength iscommensurate with the CO blob spacing.
As we have already commented, the actual distribution of CO blobs is not given by a perfect lattice. We find that thepinning mechanism is robust to certain levels of irregularityin the distribution of CO blobs. One way to introduce a de-gree of irregularity in the one-dimensional model is by tak-ing the CO blob density to be of the form
u x = p=1
P
exp− x − x p2/2 2, 20
where determines the patch size assumed to be smallerthan d . The center x p of the pth blob is taken to be x p = pd + p with p as a random variable generated from auniform distribution over the interval −0.5,0.5. Thus, is ameasure of the degree of disorder. In Fig. 7a we plot thedegree of pinning as a function of . We see that pinningpersists for irregular lattices with the most monocular re-gions lining up with the blobs as illustrated in Fig. 7b.Again our model predicts a shift between the center of theOD column and the most monocular region, depending onthe degree of disorder and the size of ; for smaller values of
this shift would be negligible. From an experimental per-spective, the current finding in macaque is that the CO blobs
tend to lie in the centers of OD columns and also tend tocoincide with the most monocular cell populations. As far aswe are aware of, the possibility of a statistically significantdifference between these two aspects has not been investi-gated.
B. Pinning in a two-dimensional network
All of the above observations extend to the more realisticcase of two-dimensional networks. In Fig. 8 we show ex-amples of two-dimensional OD patterns obtained by numeri-cally solving Eq. 4 for CO blobs on a square lattice. Wetake N =1+ u x , y with
u x, y = 0.252 + cos2 x/d + cos2 y/d , 21
representing the two-dimensional distribution of CO blobsand =1.0, =0. The parameters of the weight distribution
0 0.2 0.4 0.6 0.8 10
0.2
0.4
0.6
0.8
κ
d e g r e e
o f p i n n i n g
(a) (b)
0
0.2
0.4
0.6
0.8
1
-0.4 -0.2 0 0.2 0.4
k
d e g r e e
o f p i n n i n g
Δ
FIG. 6. a Plot of degree of pinning as a function of themodulation strength for k c = /d . b Plot of degree of pinning
as a function of the wavelength mismatch k = dk c / −1 for =1.0. Black dots show pinning with respect to OD centers. Weightparameters are as in Fig. 4 except that =0. Averages were per-formed over 40 trials.
0 0.1 0.2 0.3 0.4 0.5 0.6 0.70.2
0.4
0.6
0.8
1
disorder Γ
d e g r e e
o f p i n n i n g
χ
a)
1 2 3 4 5 6 7 8space x (in units of d)
-2
0
1
d e n s i t y
n -
( x )
(b)
-1
2
FIG. 7. a Plot of degree of pinning versus degree of irregularity in distribution of CO blobs as given by Eq. 20.Here, =1.0, =0, and k c= /d . b One-dimensional OD patternblack curve pinning to an irregular distribution =0.7 of COblobs solid gray curve. The corresponding regular distribution of spacing d is shown by the dashed gray curve. Same parameter val-ues as a with =0.7.
2
4
6
8
y
2 4 6x
8
a)
2 4 6x
8
(b)
2
4
6
8
y
FIG. 8. Two-dimensional pinning of OD columns to asquare lattice of CO blobs with N =1 + u x , y andu x , y =0.252+cos2 x /d +cos2 y /d . We take =0 and =1 and consider a radial weight distribution 2 with A=3.8,
B =3.3, e=0.51d , and i =0.64d such that k c /d , where d is theblob spacing. The two examples correspond to different initial con-ditions obtained by introducing small random perturbations of theuniform binocular state. For visualization purposes, the color scalewas chosen so that white corresponds to left eye dominance andgray corresponds to right eye dominance, with the lattice shown inblack.
THEORY FOR THE ALIGNMENT OF CORTICAL FEATURE… PHYSICAL REVIEW E 82, 021920 2010
021920-7

8/3/2019 Paul C. Bressloff and Andrew M. Oster- Theory for the alignment of cortical feature maps during development
http://slidepdf.com/reader/full/paul-c-bressloff-and-andrew-m-oster-theory-for-the-alignment-of-cortical 8/10
wr given by Eq. 2 are chosen so that k c /d . The re-sulting OD stripes tend to be oriented in directions corre-sponding to symmetries of the lattice, and the centers of theOD columns tend to coincide with CO blob centers.
Interestingly, pinning occurs even though the patterns arequite irregular with a number of defects and branches. Pin-ning also persists when there is a certain level of disorder inthe two-dimensional distribution of the blobs. This is illus-trated in Fig. 9 for the Gaussian CO blob distribution
u x, y = p
e− x − x p2/2 2e− y − y p2
/2 2. 22
Here, the center x p , y p of the pth blob is given by x p = pd + p, y p= pd + p with p , p as random variablesgenerated from a uniform distribution over the interval
−0.5,0.5. As in the one-dimensional case, the CO blobs arestrongly correlated with the most monocular regions of theOD column. Similar results also hold for regular or irregularrectangular and hexagonal lattices.
Since the CO blobs are intrinsically defined in our model,it follows that their spatial relationship with the ocular domi-nance columns is robust with respect to interventions thatmimic the effects of monocular deprivation MD during thecritical period in macaque 11. Following Swindale 17,19,monocular deprivation can be modeled as a temporary reduc-tion in the strength of the central part of the lateral interac-tion function 2 originating from one eye. In the case of amonocularly deprived right eye, this would involve a reduc-
tion in A RR and A RL, shown in Fig. 10a. Although the widthof the stripes associated with the deprived eye shrinks at theexpense of the nondeprived eye, the CO blobs still emerge asthe sites of highest-density afferents associated with the mostmonocular parts of the OD columns. Finally, one can alsointroduce a left-right eye asymmetry that tends to produceOD patterns more consistent with cat, that is, circular islandsof OD columns from one eye embedded in a complementarypattern of OD columns from the other eye 19, shown inFig. 10b. There is still a tendency for the blobs to coincidewith the centers of the OD columns but the patchy nature of the OD columns leads to a weaker correspondence than oc-curs for the stripe patterns.
IV. DISCUSSION
In this paper we have presented a simple model of oculardominance OD column formation that incorporates the ef-fects of a spatially periodic modulation in synaptic plasticity.We have suggested that such a modulation could arise from adistribution of patchy chemical markers early in develop-ment, corresponding to an array of intrinsically defined cy-tochrome oxidase CO blobs. Spatial coupling between the
emerging pattern of OD columns and the periodic markersprovides a mechanism for aligning the OD columns with theCO blobs. Such a mechanism is robust with respect to acertain degree of disorder in the distribution of the blobs aswell as irregularities defects and branches in the OD pat-tern.
An obvious extension of our work is to investigate thepossible role of CO blobs in the alignment of other corticalfeature maps. For example, one could carry out an analogousmodification of Swindale’s model for the development of orientation columns 40. The latter model is formulated interms of a complex-valued function zr, with arg zr speci-fying the orientation preference at r restricted to lie in theinterval 0, and zr determining the associated orienta-tion selectivity. The evolution equation for z takes the formfor =0
z
t = wr − r zrd rF z, 23
with F z = N − z. The effects of a CO blob distribution couldbe incorporated into the model by taking N to satisfy Eq. 3.One could then investigate to what extent the resulting ori-entation pinwheels align with the CO blobs as suggested byoptical imaging data 6. Swindale’s model for the joint de-velopment of ocular dominance and orientation columns 41could be modified along similar lines. The possible role of
0 2 4 6 8 10
2
4
6
8
1
x
y
FIG. 9. Two-dimensional pinning of OD columns to an irregularlattice of CO blobs. Distribution of CO blobs is given by Eq. 22with =0.3.
2
4
6
8
y
2 4 6x
8
(a)
2 4 6x
8
(b)
2
4
6
8
y
FIG. 10. Examples of pinning to the CO blob lattice in the casesof MD and “catlike” conditions, shown in a and b, respectively.In both a and b, the CO blob lattice and the primary weightdistribution are the same as in Fig. 8. In a, we simulate MDconditions by reducing the excitation level of the deprived eye to60% of its original value. The area that the nondeprived eye theninnervates is 67% of V1. In b, since the contralateral visual inputis dominant in early cat development, in order to simulate catlikeconditions, both excitation and inhibition levels of the ipsilateraldrive are reduced to 60% of their original values for the initialphase of development here, is taken to be =0.1. For visualiza-
tion purposes, the color scale was chosen so that white correspondsto left eye dominance and gray corresponds to right eye dominance,with the lattice shown in black.
PAUL C. BRESSLOFF AND ANDREW M. OSTER PHYSICAL REVIEW E 82, 021920 2010
021920-8
8/3/2019 Paul C. Bressloff and Andrew M. Oster- Theory for the alignment of cortical feature maps during development
http://slidepdf.com/reader/full/paul-c-bressloff-and-andrew-m-oster-theory-for-the-alignment-of-cortical 9/10
CO blobs in the joint alignment of OD and orientation col-umns has also been briefly reported in a computational studyby Jones and Leyton-Brown 42.
It is possible that the coalignment of multiple featuremaps could occur in the absence of a spatially periodic dis-tribution of molecular markers. Indeed, it has previouslybeen demonstrated that OD and orientation columns can de-
velop simultaneously, such that orientation pinwheels alignwith the centers of the OD columns and iso-orientation con-tours cross OD column boundaries orthogonally 41,43. Theinclusion of an additional feedforward label for the distribu-tion of CO blobs perhaps by taking into account the konio-cellular pathway that feeds directly to the CO blobs inmacaque could result in the simultaneous alignment of theOD columns, the orientation preference map, and the COblobs. In contrast to the mode-locking mechanism proposedin this paper, such an alignment would arise spontaneouslythrough the competitive process that drives the developmentof the multiple feature maps. There are, however, two poten-tial difficulties with the latter approach. First, the coalign-
ment of multiple feature maps tends to be sensitive to thechoice of parameter values 43. Second, it does not take intoaccount the experimental finding that the spatial distributionof the CO blobs appears early in development and is notaffected by activity 12,14. We also note that an abstractapproach of using elastic neural nets can produce results in
line with cortical feature maps seen in V1 44; however,here we have attempted to develop a biologically inspiredmathematical model in line with the anatomy.
Finally, it is tempting to argue that a spatially periodicdistribution of molecular markers early in development or-chestrates the coalignment of multiple feature maps in orderto achieve a modular architecture. This is consistent with
computational models that treat V1 as a system of coupledhypercolumns 45,46. Each hypercolumn processes localfeatures of an image by carrying out some form of localFourier decomposition, say; the results of these local compu-tations are then correlated within V1 through long-rangehorizontal connections and transmitted to extrastriate areasfor further processing. It would be interesting to determinewhether or not animals without such modular architecturesstill have periodically distributed markers.
ACKNOWLEDGMENTS
This paper was based on work supported in part by the
NSF Grant No. DMS-0209824 and by Award No. KUK-C1-013-4 made by the King Abdullah University of Scienceand Technology KAUST. P.C.B. was also partially sup-ported by the Royal Society–Wolfson Foundation, andA.M.O. was partially supported by the Neuropôle de Recher-che Francilien NeRF and an ANR MNP ‘Dopanic’ grant.
1 J. C. Horton and D. H. Hubel, Nature London 292, 7621981.
2 J. C. Horton, Philos. Trans. R. Soc. London, Ser. B 304, 1991984.3 K. M. Murphy, D. G. Jones, and R. C. Van Sluyters, J. Neu-
rosci. 156, 4196 1995 http://www.jneurosci.org/cgi/ content/abstract/15/6/4196.
4 M. S. Livingstone and D. H. Hubel, J. Neurosci. 411, 28301984 http://www.jneurosci.org/cgi/content/abstract/4/11/ 2830.
5 R. B. Tootell, M. S. Silverman, S. L. Hamilton, E. Switkes,and R. L. De Valois, J. Neurosci. 85, 1610 1988 http:// www.jneurosci.org/cgi/content/abstract/8/5/1610.
6 K. Obermayer and G. G. Blasdel, J. Neurosci. 1310, 41141993 http://www.jneurosci.org/cgi/content/abstract/13/10/ 4114.
7 D. Shoham, M. Hubener, S. Schulze, A. Grinvald, and T. Bon-hoeffer, Nature London 385, 529 1997.
8 T. Yoshioka, G. G. Blasdel, J. B. Levitt, and J. S. Lund, Cereb.Cortex 6, 297 1996.
9 N. H. Yabuta and E. M. Callaway, Visual Neurosci. 15, 10071998.
10 L. C. Sincich and J. C. Horton, Science 295, 1734 2002.11 J. C. Horton and D. R. Hocking, J. Neurosci. 1710, 3684
1997 http://www.jneurosci.org/cgi/content/abstract/17/10/ 3684.
12 K. M. Murphy, D. G. Jones, S. B. Fenstemeaker, V. D. Pegado,L. Kiorpes, and J. A. Movshon, Cereb. Cortex 8, 237 1998.
13 M. C. Crair, J. C. Horton, and A. Antonini, J. Comp. Neurol.
430, 235 2001.14 K. M. Murphy, K. R. Duffy, D. G. Jones, and D. E. Mitchell,
Cereb. Cortex 11, 122 2001.15 C. Trepel, D. R. Duffy, V. D. Pegado, and K. M. Murphy,J. Neurosci. 189, 3404 1998 http://www.jneurosci.org/cgi/ content/abstract/18/9/3404.
16 R. H. Dyck and M. S. Cynader, Proc. Natl. Acad. Sci. U.S.A.90, 9066 1993.
17 N. V. Swindale, Proc. R. Soc. London, Ser. B 208, 243 1980.18 K. D. Miller, J. B. Keller, and M. P. Stryker, Science 245, 605
1989.19 N. V. Swindale, Network 7, 161 1996.20 H. Z. Shouval, D. H. Goldberg, J. P. Jones, M. Beckerman, and
L. N. Cooper, J. Neurosci. 203, 1119 2000 http:// www.jneurosci.org/cgi/content/abstract/20/3/1119.
21 P. C. Bressloff, Physica D 185, 131 2003.
22 J. J. Wright, D. M. Alexander, and P. D. Bourke, Vision Res.46, 2703 2006.
23 V. A. Whitelaw and J. D. Cowan, J. Neurosci. 112, 13691981 http://www.jneurosci.org/cgi/content/abstract/1/12/ 1369.
24 C. Weber, H. Ritter, J. D. Cowan, and K. Obermayer, Philos.Trans. R. Soc. London, Ser. B 352, 1603 1997.
25 D. Willshaw and D. Price, Modeling Neural Development MIT Press, Cambridge, MA, 2003, pp. 213–244.
26 A. M. Turing, Philos. Trans. R. Soc. London, Ser. B 237, 371952.
27 E. M. Callaway, J. Neurosci. 184, 1505 1998 http:// www.jneurosci.org/cgi/content/abstract/18/4/1505.
THEORY FOR THE ALIGNMENT OF CORTICAL FEATURE… PHYSICAL REVIEW E 82, 021920 2010
021920-9

8/3/2019 Paul C. Bressloff and Andrew M. Oster- Theory for the alignment of cortical feature maps during development
http://slidepdf.com/reader/full/paul-c-bressloff-and-andrew-m-oster-theory-for-the-alignment-of-cortical 10/10
28 K. Yashiro and B. D. Philpot, Neuropharmacology 55, 10812008.
29 A. E. Harris, G. B. Ermentrout, and A. L. Small, J. Comput.Neurosci. 8, 227 2000.
30 A. van Ooyen and R. R. Ribchester, Modeling Neural Devel-opment MIT Press, Cambridge, MA, 2003, pp. 183–212.
31 M. Lowe and J. P. Gollub, Phys. Rev. A 31, 3893 1985.
32 P. Coullet, Phys. Rev. Lett. 56, 724 1986.33 D. Walgraef, Spatio-Temporal Pattern Formation Springer-
Verlag, Berlin, 1997.34 P. C. Bressloff, Phys. Rev. Lett. 89, 088101 2002.35 N. W. Ashcroft and N. D. Mermin, Solid State Physics Saun-
ders College Publishing, Philadelphia, PA, 1976.36 E. M. Callaway and L. C. Katz, J. Neurosci. 104, 1134
1990 http://www.jneurosci.org/cgi/content/abstract/10/4/ 1134.
37 E. S. Ruthazer and M. P. Stryker, J. Neurosci. 1622, 7253
1996 http://www.jneurosci.org/cgi/content/abstract/16/22/ 7253.
38 C. Chiu and M. Weliky, Neuron 35, 1123 2002.39 P. Bak, Rep. Prog. Phys. 45, 587 1982.40 N. V. Swindale, Proc. R. Soc. London, Ser. B 215, 211 1982.41 N. V. Swindale, Biol. Cybern. 66, 217 1992.42 D. G. Jones and K. Leyton-Brown, Soc. Neurosci. Abstr. 24,
813 1998.43 E. Erwin and K. D. Miller, J. Neurosci. 1823, 9870 1998
http://www.jneurosci.org/cgi/content/abstract/18/23/9870.44 M. Á. Carreira-Perpiňán, R. J. Lister, and G. J. Goodhill,
Cereb. Cortex 15, 1222 2005.45 S. LeVay and S. B. Nelson, The Neural Basis of Visual Func-
tion CRC Press, Boca Raton, FL, 1991, pp. 266–315.46 J. S. Lund, A. Angelucci, and P. C. Bressloff, Cereb. Cortex
131, 15 2003.
PAUL C. BRESSLOFF AND ANDREW M. OSTER PHYSICAL REVIEW E 82, 021920 2010
021920-10