paul mills eit instrument markets pmillsoh@aol · – il uva 250‐415 nm, cwl 365 nm (broad)...
TRANSCRIPT
UV Measurement UV Measurement For FormulatorsFor Formulators
Paul MillsEIT Instrument Markets

Anything that you can measure, you have a better chance of controlling. Things that you donot measure become the cause of mysterious problems
- Larry Goldberg, Beta Industries
Not everything that counts can be counted, and not everything that can be counted counts.
- Albert Einstein

EIT Facilities
Sterling Main
Danville Riverview Center
Sterling SMS
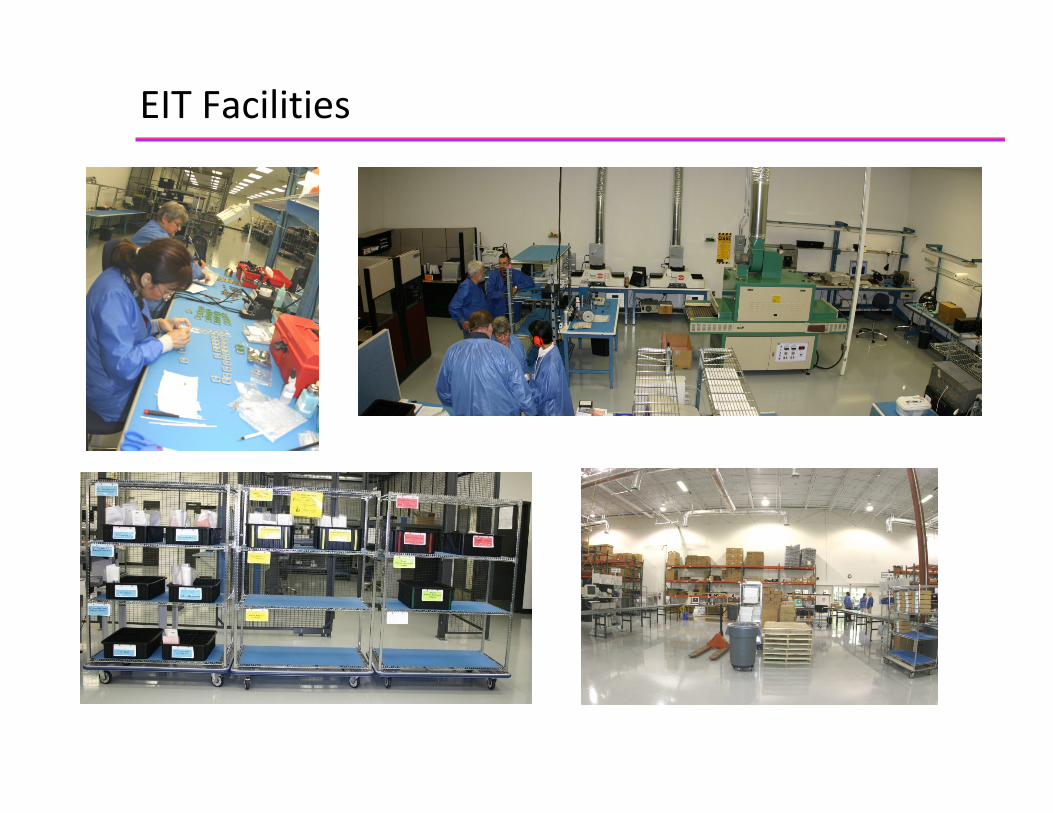
EIT Instrument Markets @ SMS FacilityEIT Facilities


UV Measurement Needs
End‐Users
• Is the process running consistently?
• Is the process running within the spec?
• Troubleshooting
• Record keeping/Traceability
• Tend to be relativemeasurements.
Formulators/Suppliers
• Establish a specification
• Determine a process window
• Optimize a process
• Help customers troubleshoot
• Tend to be absolutemeasurements.
Communication

Powder Cure RequirementsManufacturer’s Recommended Specifications

Content
• Principles of UV Measurement
• What to measure
• How to measure
• Role of UV Sources
• Specification details
• Instrument/User error
• Instrument selection

Practical Advice or Numerical Examples
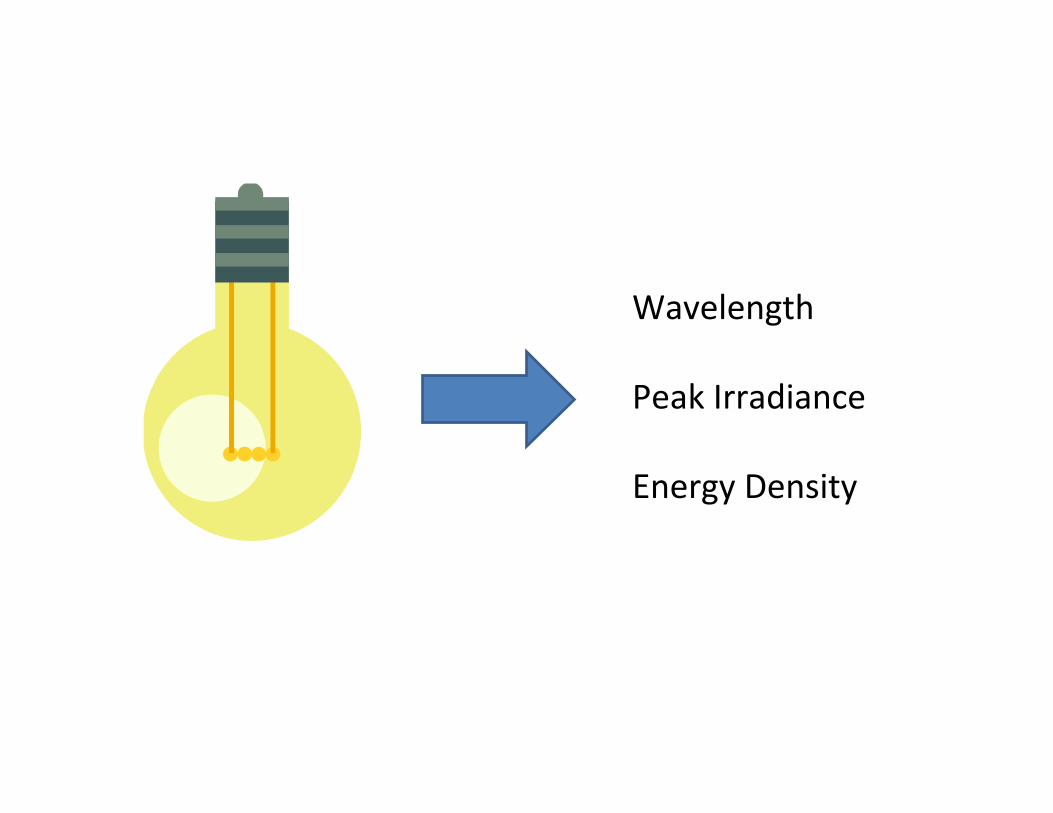
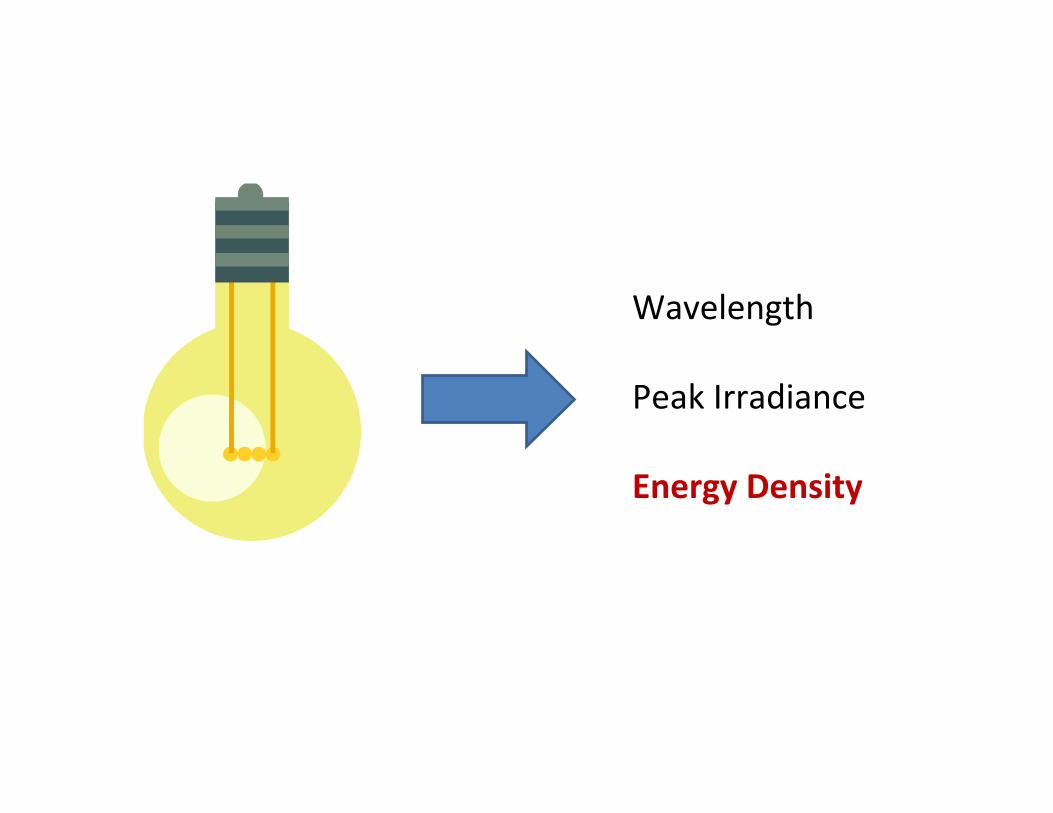
Wavelength
Peak Irradiance
Energy Density

Terms / Units
Wavelength = Nanometers(“light”)
Peak Irradiance = Watts / cm2
(“intensity”) (“watts”)
Energy Density = Joules / cm2
(“dose”) (“joules”)
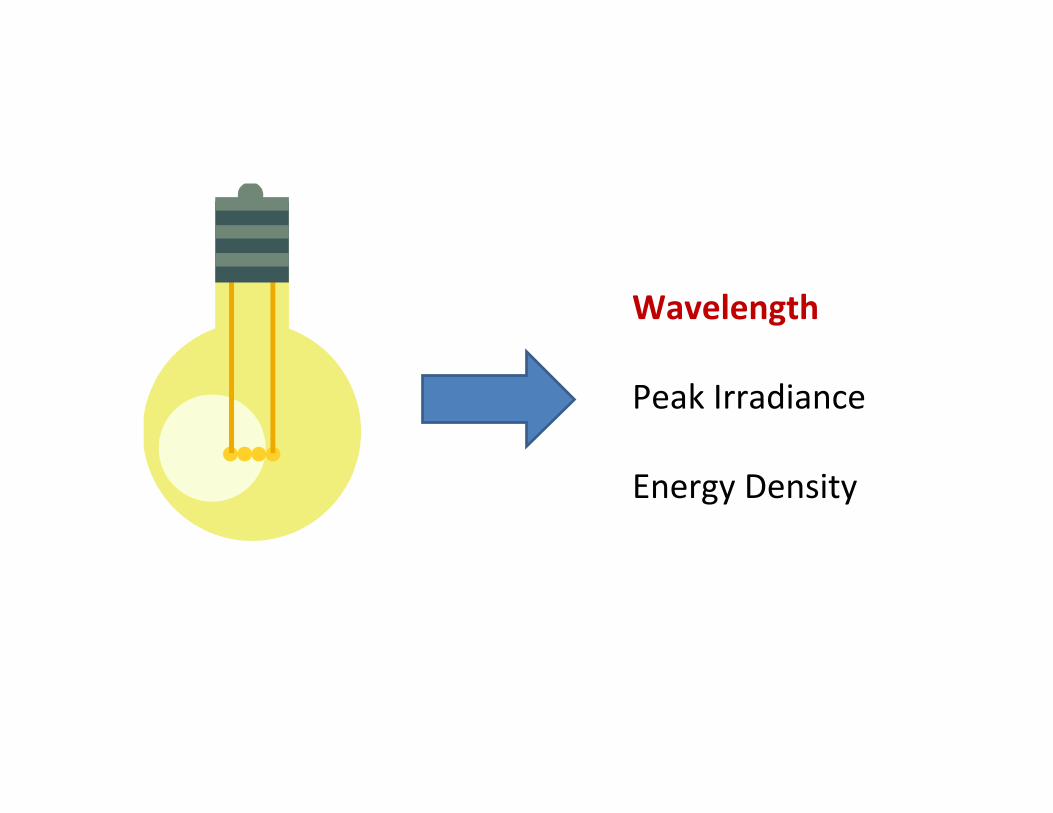
Wavelength
Peak Irradiance
Energy Density
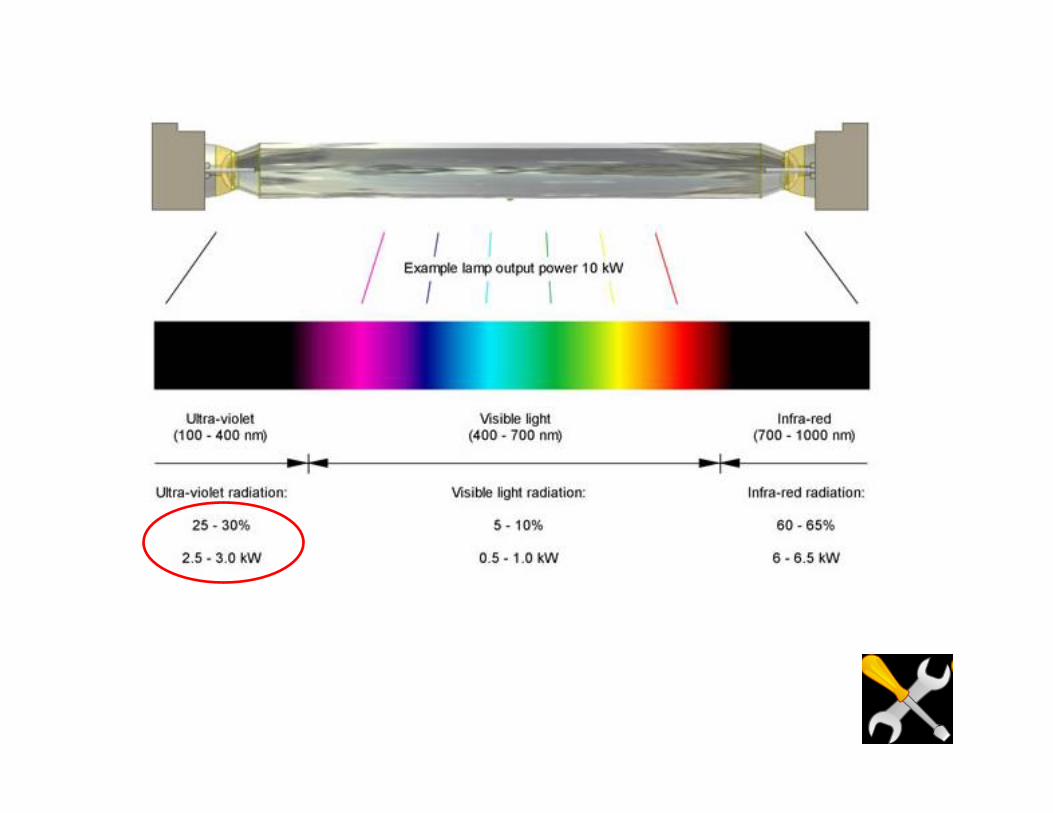

λ = WavelengthFor UV Curing ~ 200 nm through ~ 400 nm
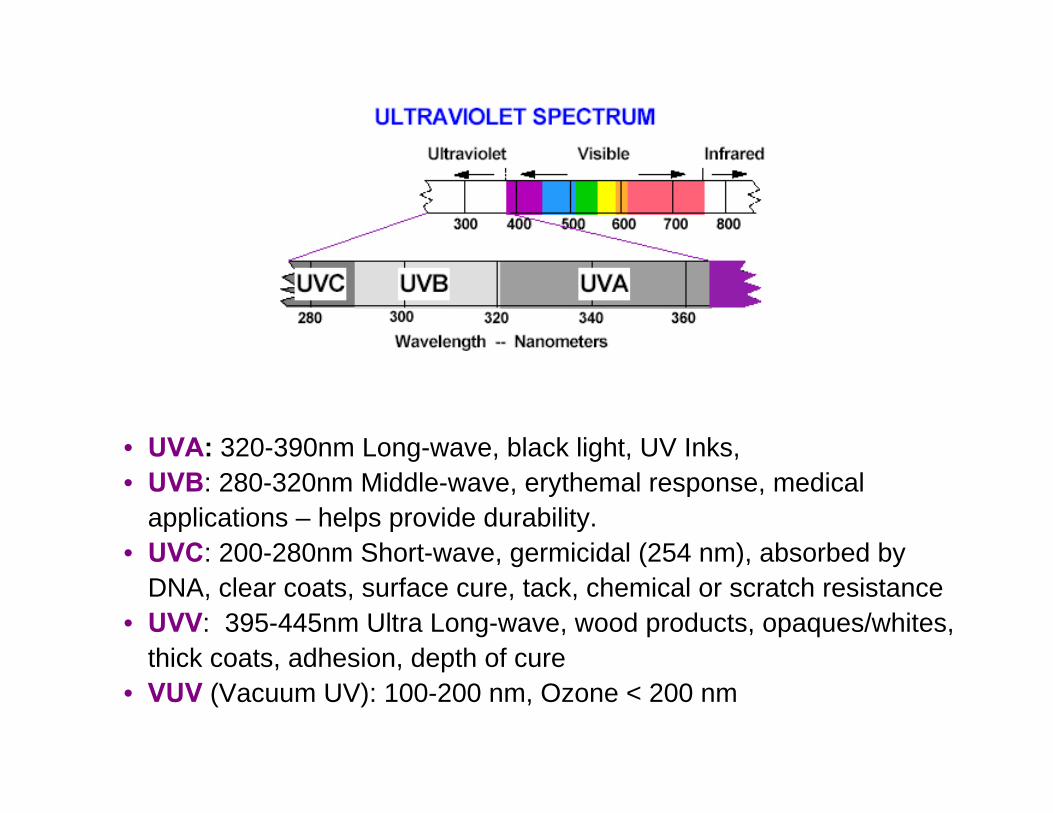
• UVA: 320-390nm Long-wave, black light, UV Inks, • UVB: 280-320nm Middle-wave, erythemal response, medical
applications – helps provide durability.• UVC: 200-280nm Short-wave, germicidal (254 nm), absorbed by
DNA, clear coats, surface cure, tack, chemical or scratch resistance• UVV: 395-445nm Ultra Long-wave, wood products, opaques/whites,
thick coats, adhesion, depth of cure• VUV (Vacuum UV): 100-200 nm, Ozone < 200 nm

Mercury Lamp Spectra“H” Lamp
Iron Additive Lamp Spectra“D” Lamp
Gallium Additive Lamp Spectra“V” Lamp

UV Relative Penetration
Substrate Surface
Ink, coating, adhesive thickness
UVC UVB UVA UVV
Film
Thi
ckne
ss

Wavelength
Peak Irradiance
Energy Density
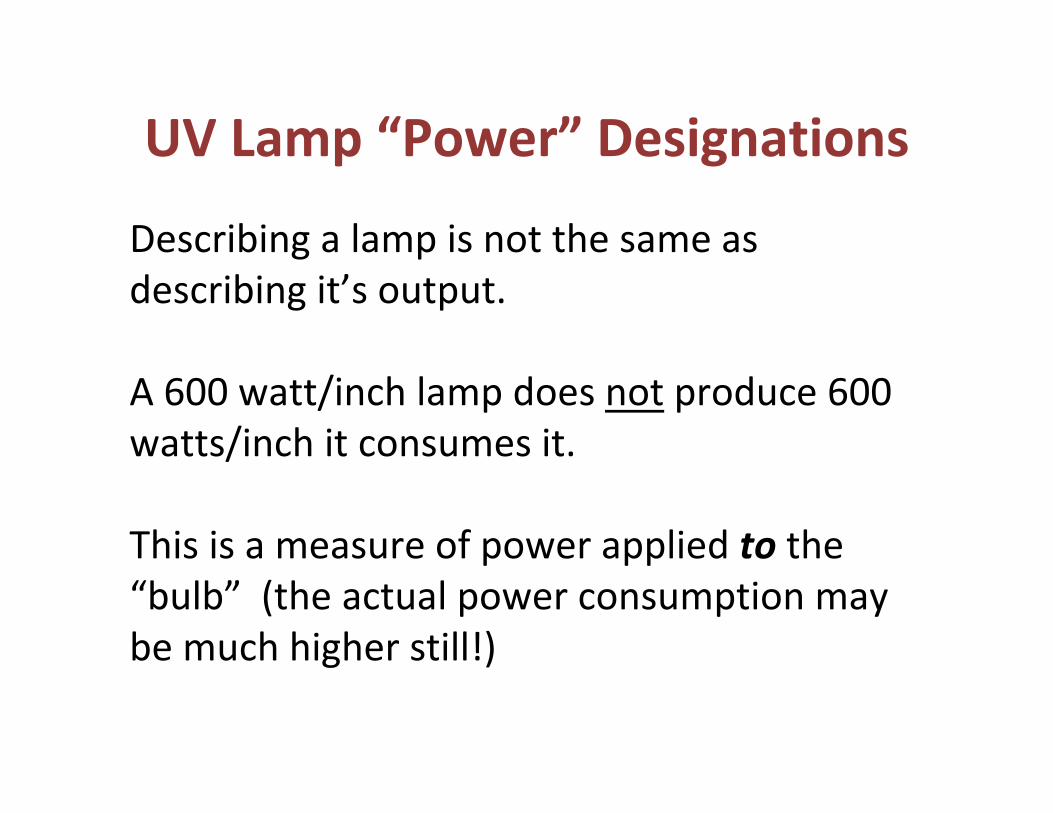
Describing a lamp is not the same as describing it’s output.
A 600 watt/inch lamp does not produce 600 watts/inch it consumes it.
This is a measure of power applied to the “bulb” (the actual power consumption may be much higher still!)
UV Lamp “Power” Designations

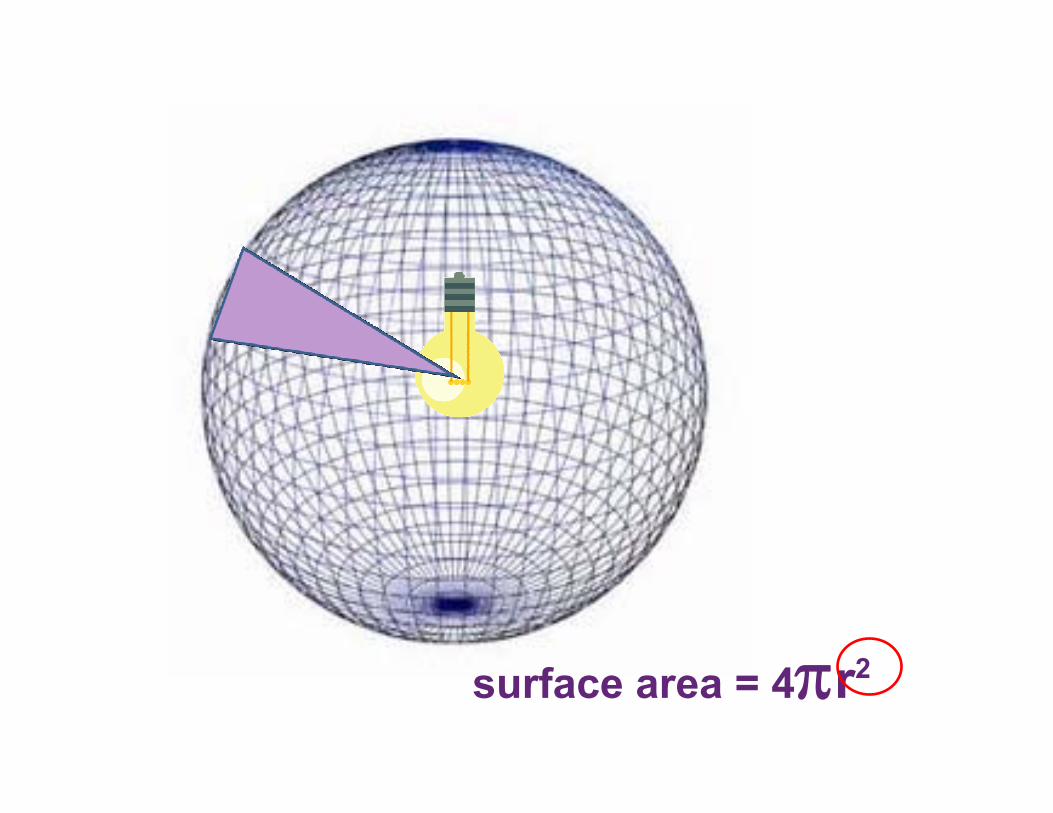
surface area = 4πr2
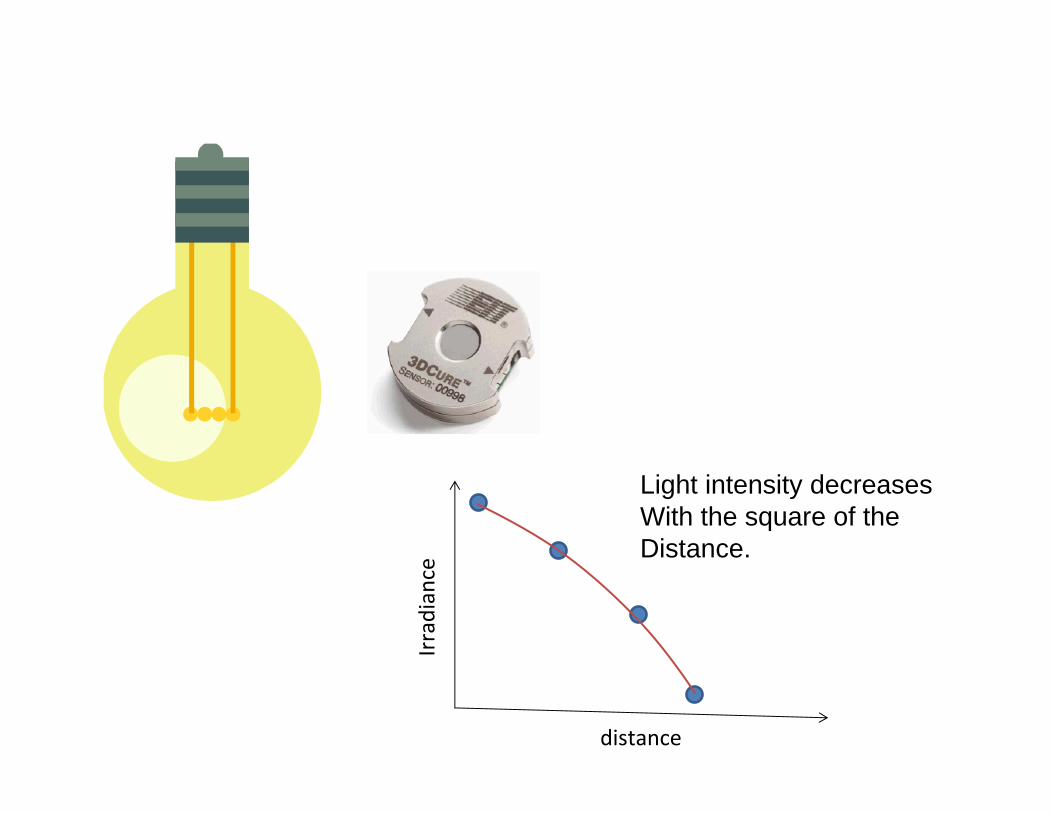
Irradiance
distance
Light intensity decreasesWith the square of theDistance.

Wavelength
Peak Irradiance
Energy Density
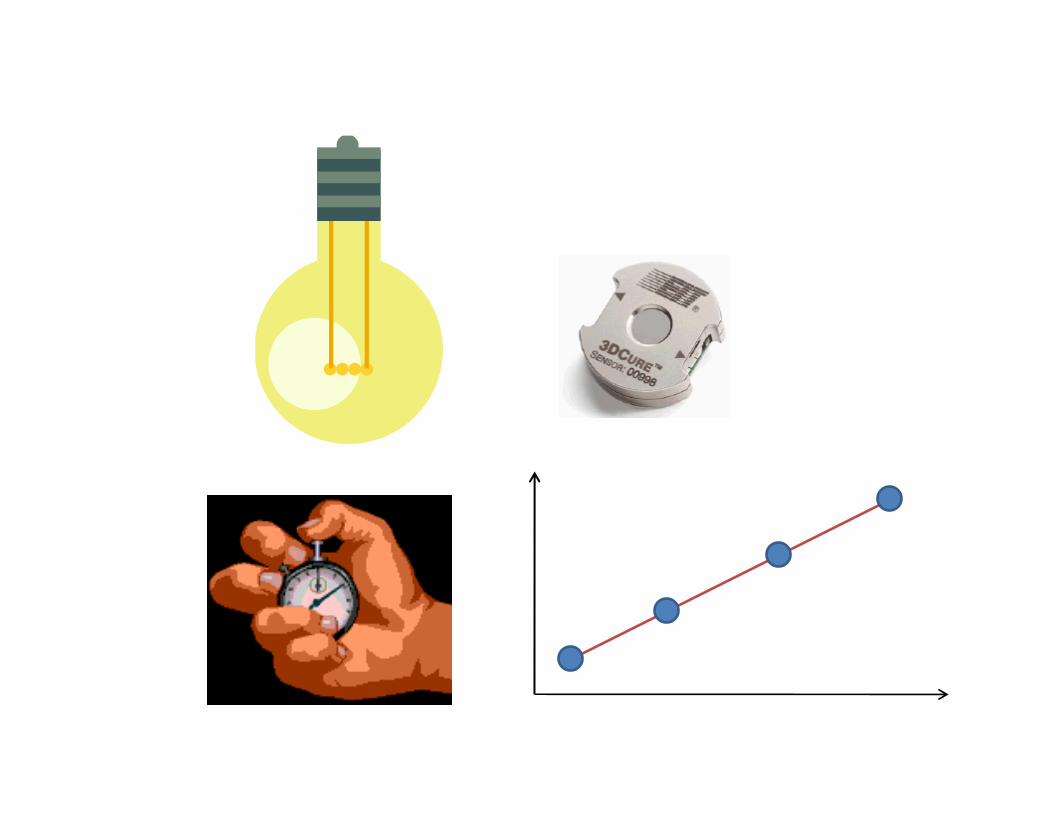

• Irradiance does not change with time.
• However both time and irradiance affect energy density
• Time can be the length of time a fixed object is exposed to a part, the time exposure of a moving part (e.g. a conveyorized part), or a moving lamp.
Energy Density ↔ Irradiance

Powder Cure RequirementsManufacturer’s Recommended Specifications
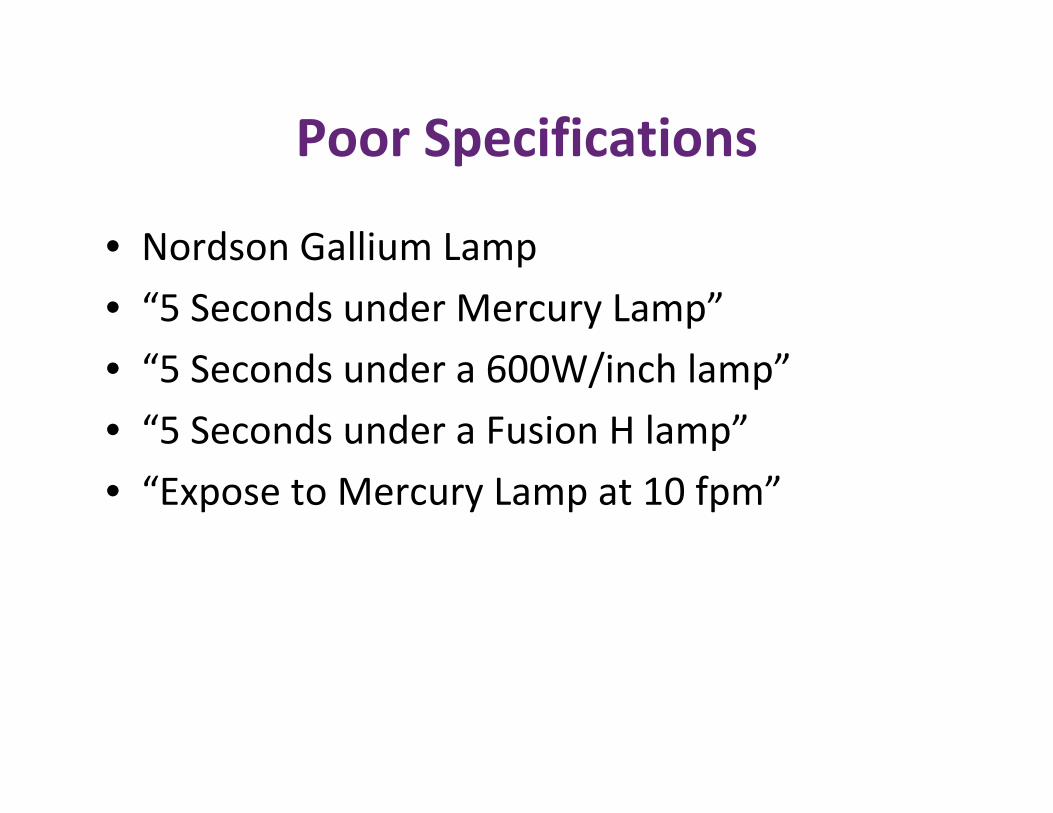
Poor Specifications
• Nordson Gallium Lamp
• “5 Seconds under Mercury Lamp”
• “5 Seconds under a 600W/inch lamp”
• “5 Seconds under a Fusion H lamp”
• “Expose to Mercury Lamp at 10 fpm”
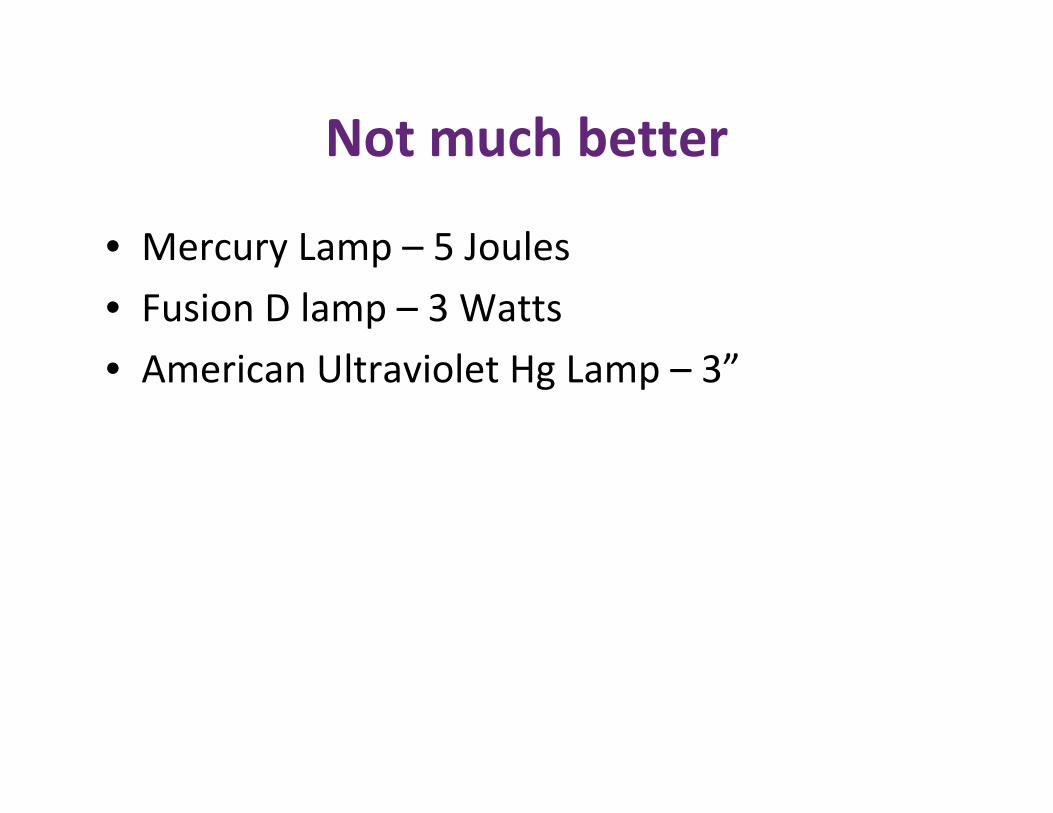
Not much better
• Mercury Lamp – 5 Joules
• Fusion D lamp – 3 Watts
• American Ultraviolet Hg Lamp – 3”
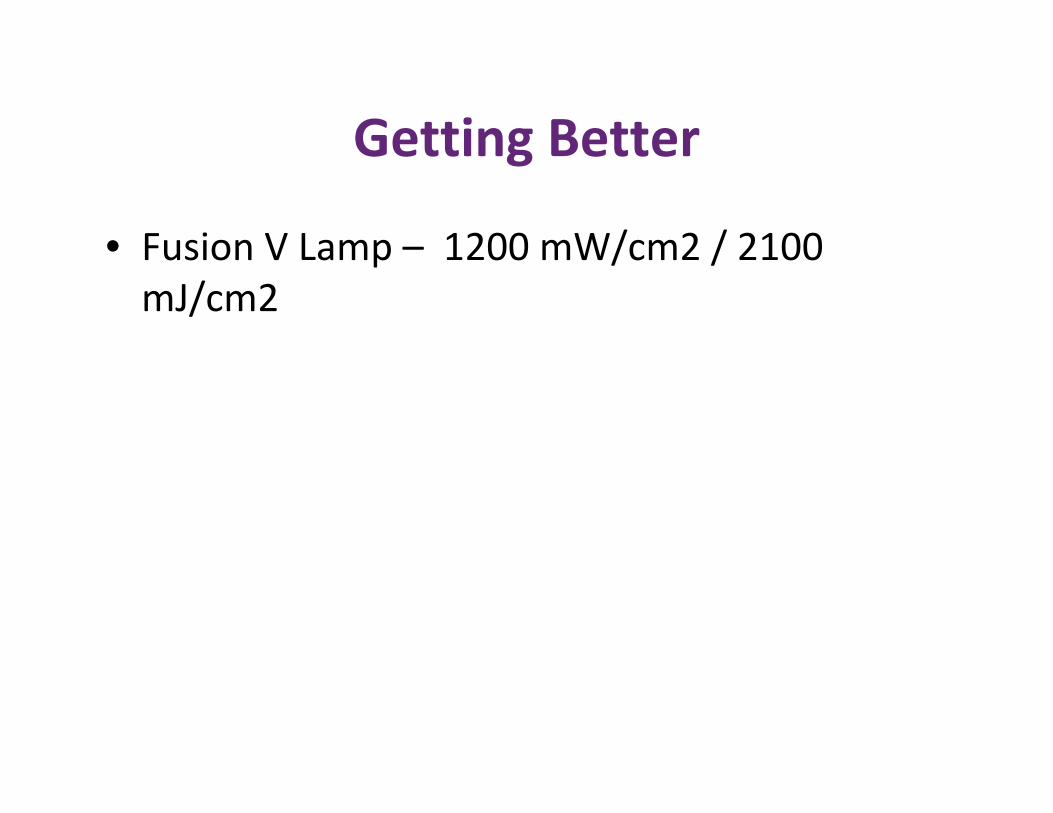
Getting Better
• Fusion V Lamp – 1200 mW/cm2 / 2100 mJ/cm2

Good Specification
• Nordson Iron Additive Lamp, UVA = 1100 mw/cm2, 2100 mJ/cm2
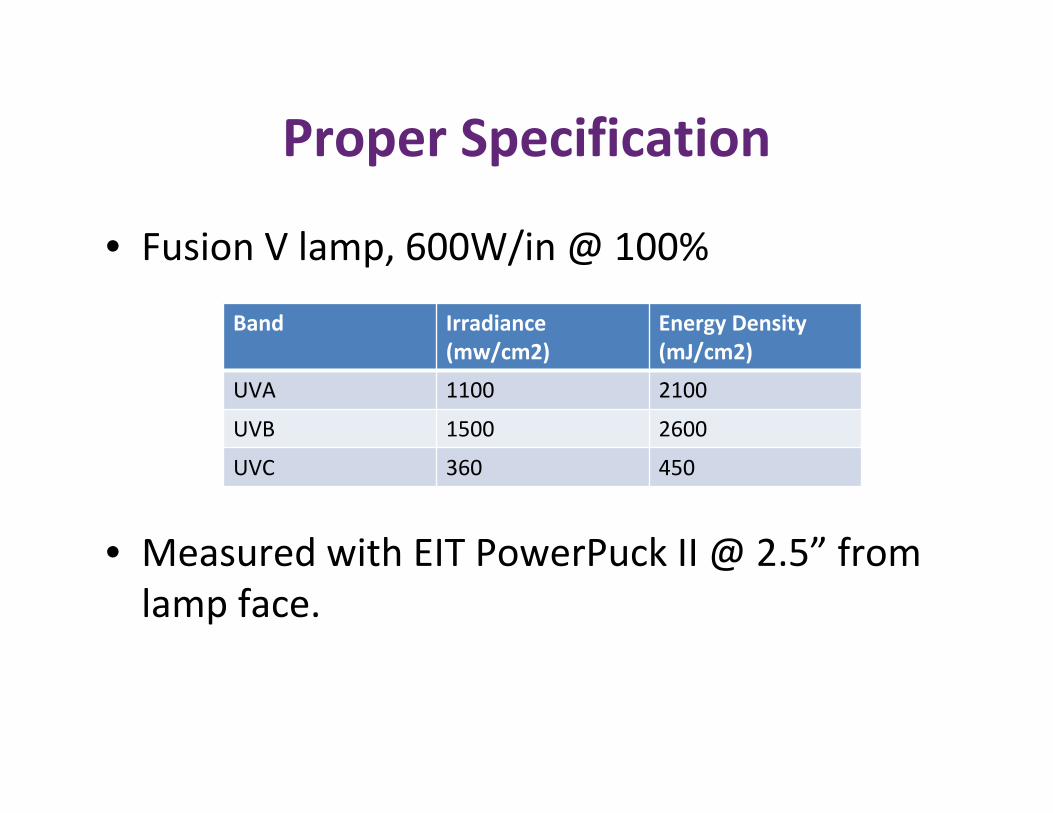
Proper Specification
• Fusion V lamp, 600W/in @ 100%
• Measured with EIT PowerPuck II @ 2.5” from lamp face.
Band Irradiance (mw/cm2)
Energy Density (mJ/cm2)
UVA 1100 2100
UVB 1500 2600
UVC 360 450
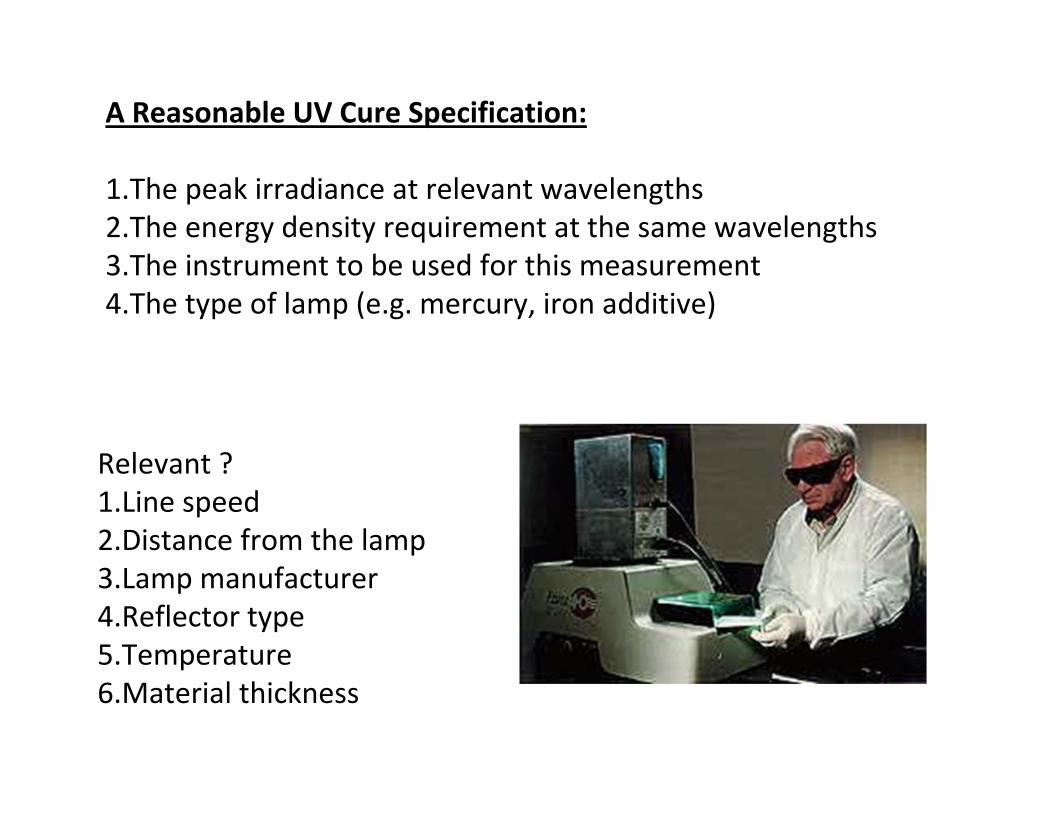
A Reasonable UV Cure Specification:
1.The peak irradiance at relevant wavelengths2.The energy density requirement at the same wavelengths3.The instrument to be used for this measurement4.The type of lamp (e.g. mercury, iron additive)
Relevant ?1.Line speed2.Distance from the lamp3.Lamp manufacturer4.Reflector type5.Temperature6.Material thickness
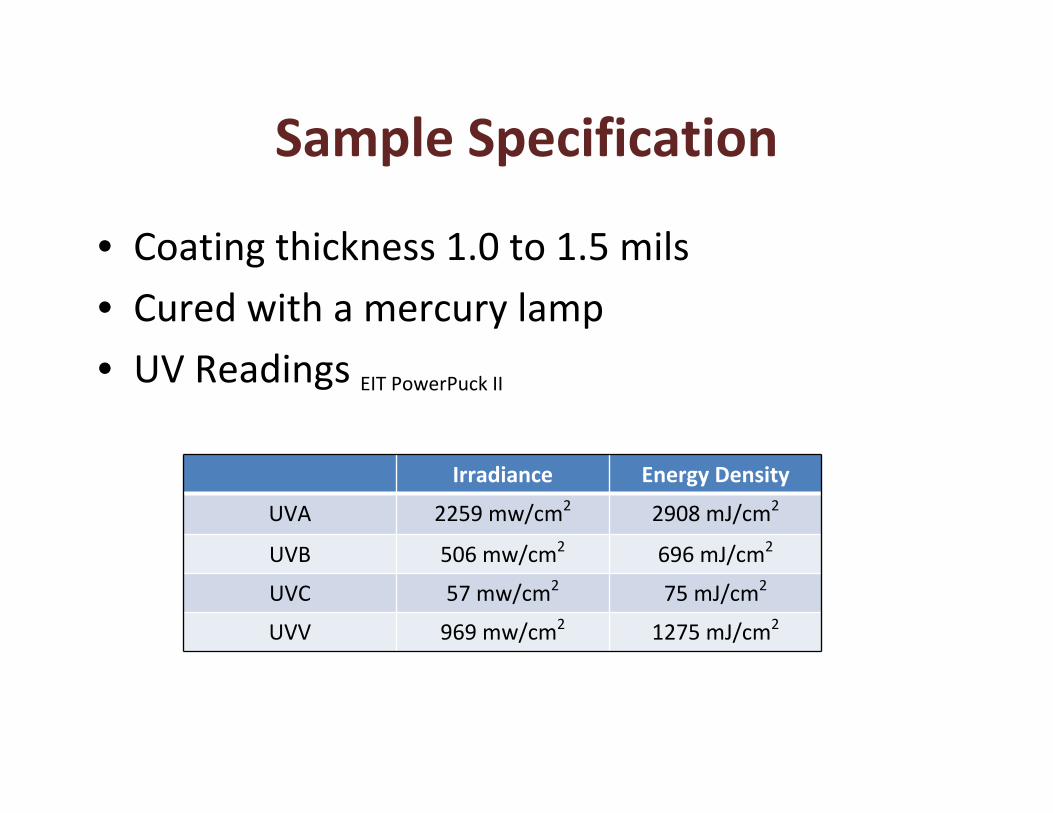
Sample Specification
• Coating thickness 1.0 to 1.5 mils
• Cured with a mercury lamp
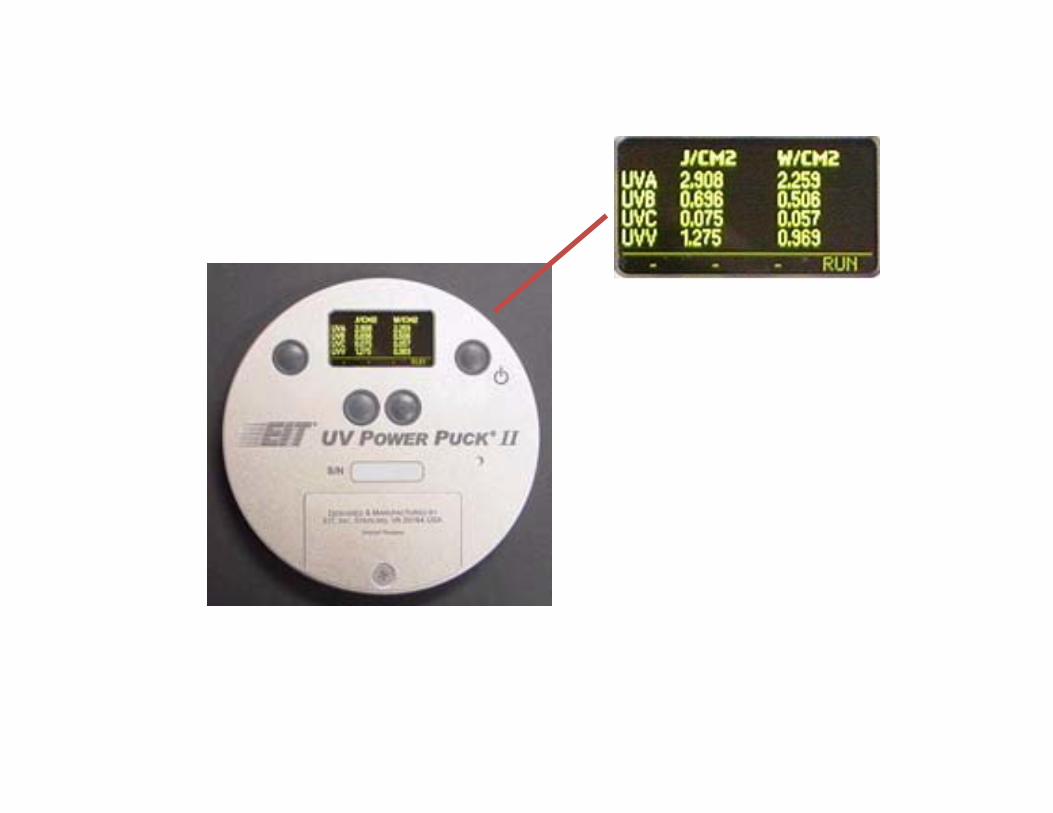
• UV Readings EIT PowerPuck II
Irradiance Energy Density
UVA 2259 mw/cm2 2908 mJ/cm2
UVB 506 mw/cm2 696 mJ/cm2
UVC 57 mw/cm2 75 mJ/cm2
UVV 969 mw/cm2 1275 mJ/cm2

Bulb Type & Focus Reminder

Powder Cure RequirementsManufacturer’s Recommended Specifications


Optimization
• Minimum irradiance• Lower lamp power
• Increase distance
• Minimum energy density• Less time
• Faster line speed
• Find point of failure?
Process Window
Wasted UV


Temperature
Time
Wavelength
Energy
Time
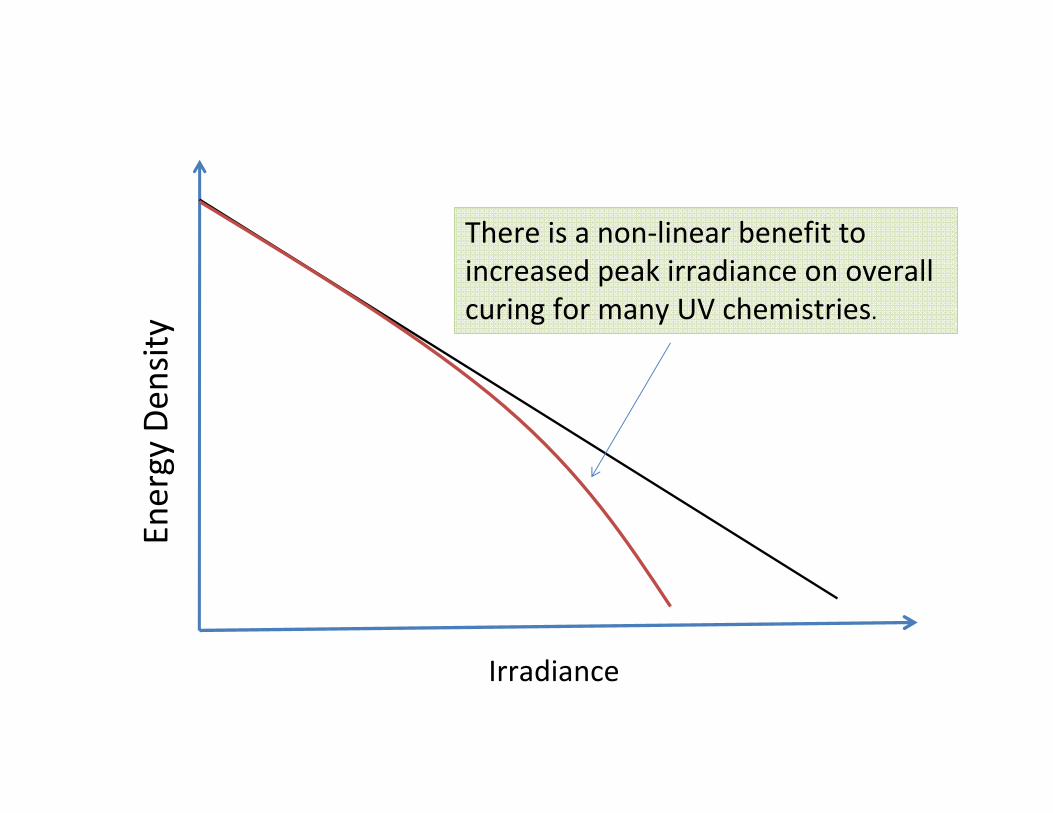
Energy Den
sity
Irradiance
There is a non‐linear benefit to increased peak irradiance on overall curing for many UV chemistries.

High Peak Irradiance Automotive Lighting Comparison
Low Peak Irradiance
• 10 x 600 W/in lamps
• 6‐8 total Joules UV
High Peak Irradiance
• 1 robot 600W lamp
• 2.5 total Joules UV
Coating: Red Spot UVT-200

Sources of Measurement Error

Wavelength
Peak Irradiance
Energy Density

Single Broadband Instrument


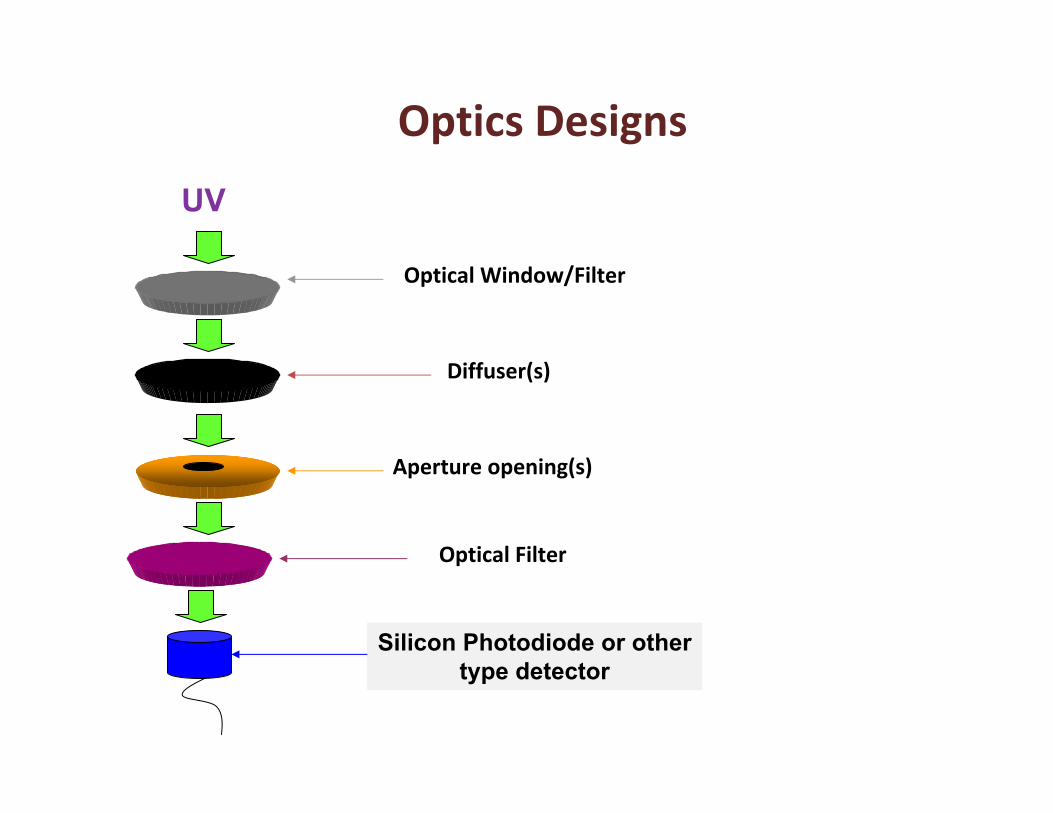
Optics Designs
Optical Window/Filter
Aperture opening(s)
Diffuser(s)
Optical Filter
Silicon Photodiode or other type detector
UV
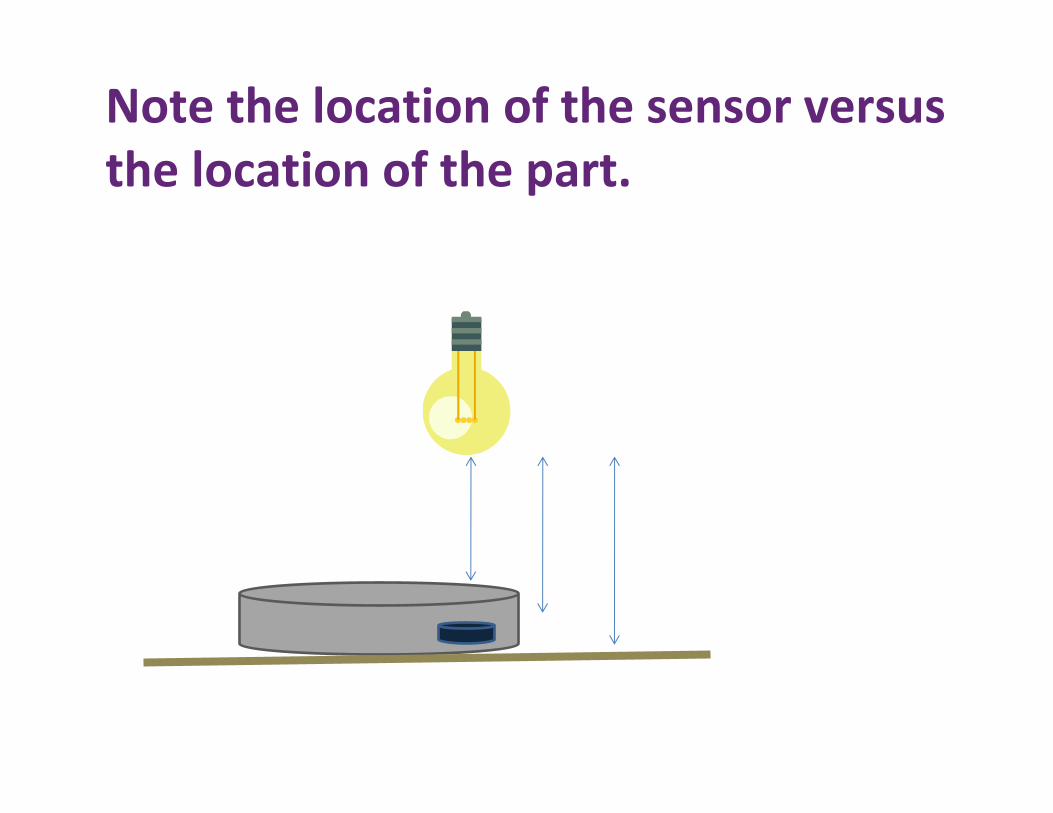
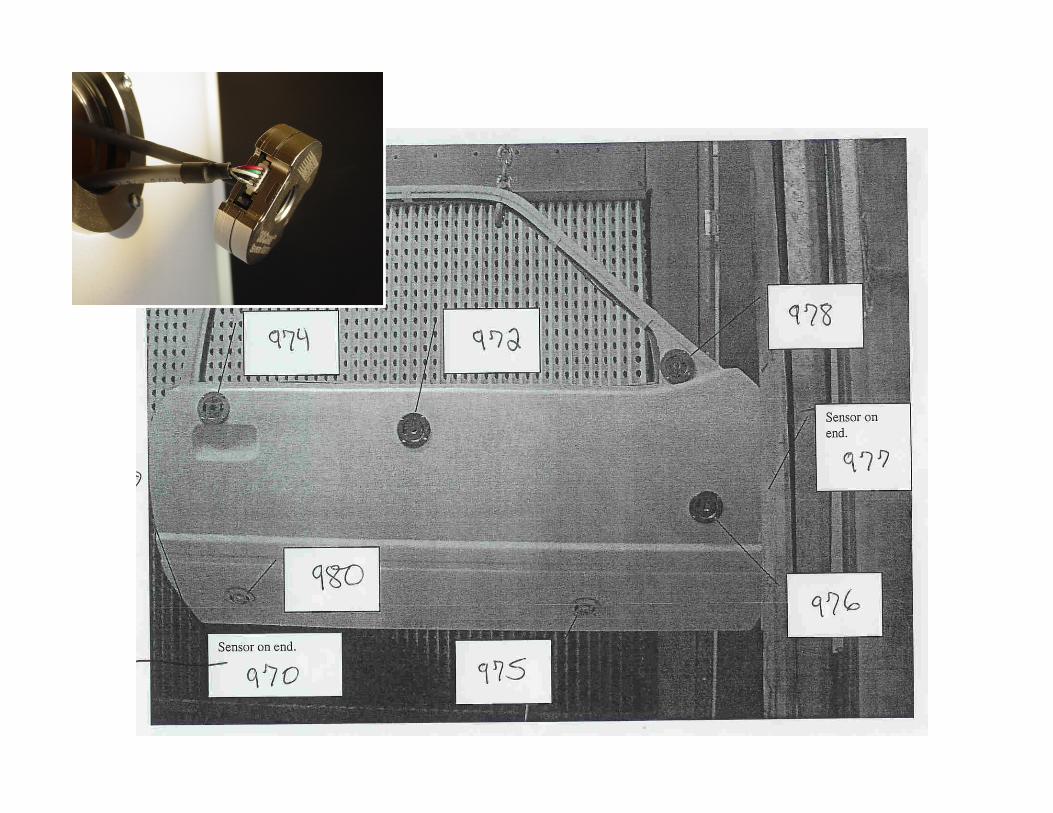
Note the location of the sensor versus the location of the part.

UVCUVV
UVAUVB
Multiple Band Instrument

EIT UVA 320-390 nm
IL UVA 250-415 nm
UVA-Spectral Bandwidth Comparisons
EITPower Puck
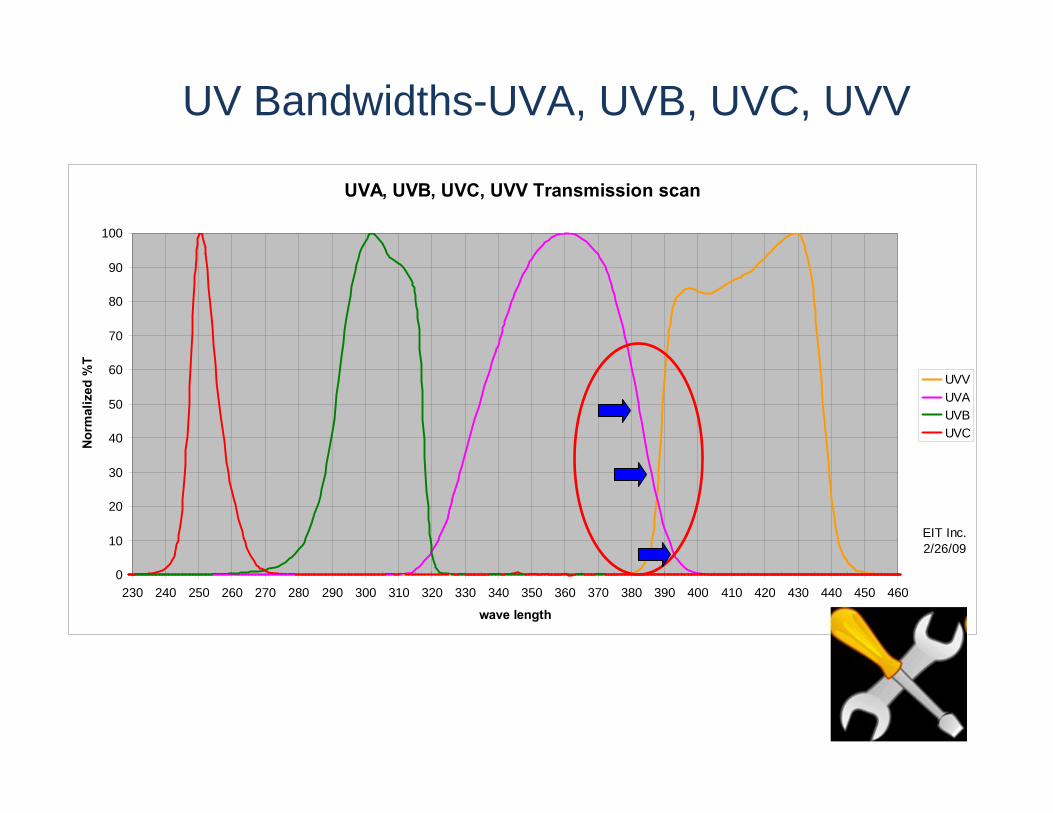
UVA, UVB, UVC, UVV Transmission scan
0
10
20
30
40
50
60
70
80
90
100
230 240 250 260 270 280 290 300 310 320 330 340 350 360 370 380 390 400 410 420 430 440 450 460
wave length
Nor
mal
ized
%T
UVVUVAUVBUVC
EIT Inc.2/26/09
UV Bandwidths-UVA, UVB, UVC, UVV

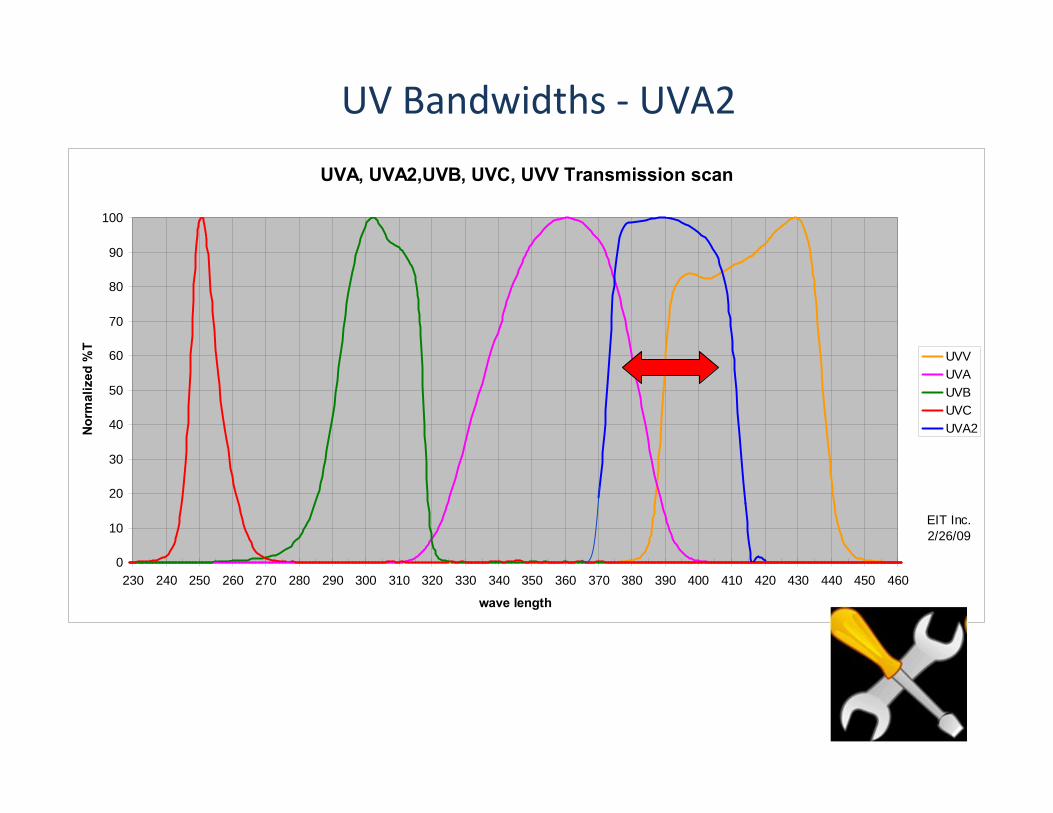
UV Bandwidths ‐ UVA2
UVA, UVA2,UVB, UVC, UVV Transmission scan
0
10
20
30
40
50
60
70
80
90
100
230 240 250 260 270 280 290 300 310 320 330 340 350 360 370 380 390 400 410 420 430 440 450 460
wave length
Nor
mal
ized
%T
UVVUVAUVBUVCUVA2
EIT Inc.2/26/09

Wavelength
Peak Irradiance
Energy Density

θ
Eθ = E x Cosθ
Cosine Error in Measurement

θ
Eθ = E x Cosθ
Cosine Error in Measurement
45o = .7 Watt 90o = 1.0 Watt

0.0 + 180.0‐ 180.0
1.0
0.75
0.25
0.5
‐ 90.0 + 90.0
Cosine Response Error
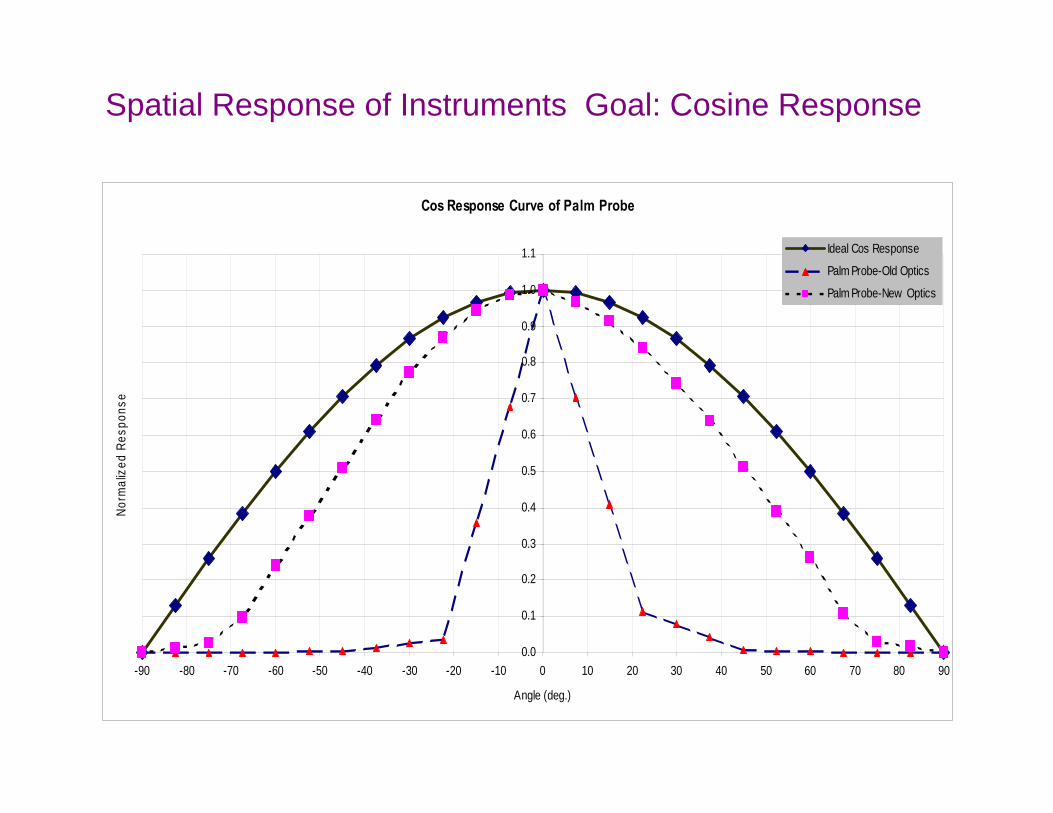
Cos Response Curve of Palm Probe
0.0
0.1
0.2
0.3
0.4
0.5
0.6
0.7
0.8
0.9
1.0
1.1
-90 -80 -70 -60 -50 -40 -30 -20 -10 0 10 20 30 40 50 60 70 80 90
Angle (deg.)
Norm
aliz
ed R
espo
nse
Ideal Cos Response
Palm Probe-Old Optics
Palm Probe-New Optics
Spatial Response of Instruments Goal: Cosine Response
Optics Designs
Optical Window/Filter
Aperture opening(s)
Diffuser(s)
Optical Filter
Silicon Photodiode or other type detector
UV
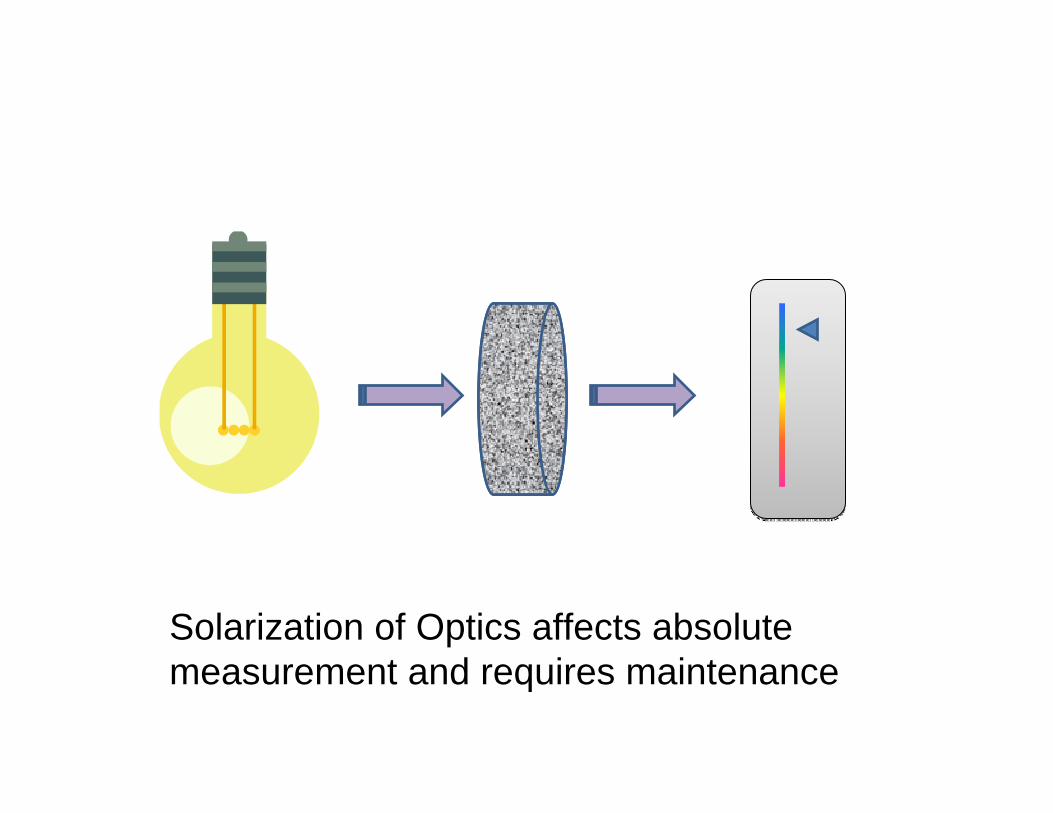
Solarization of Optics affects absolute measurement and requires maintenance
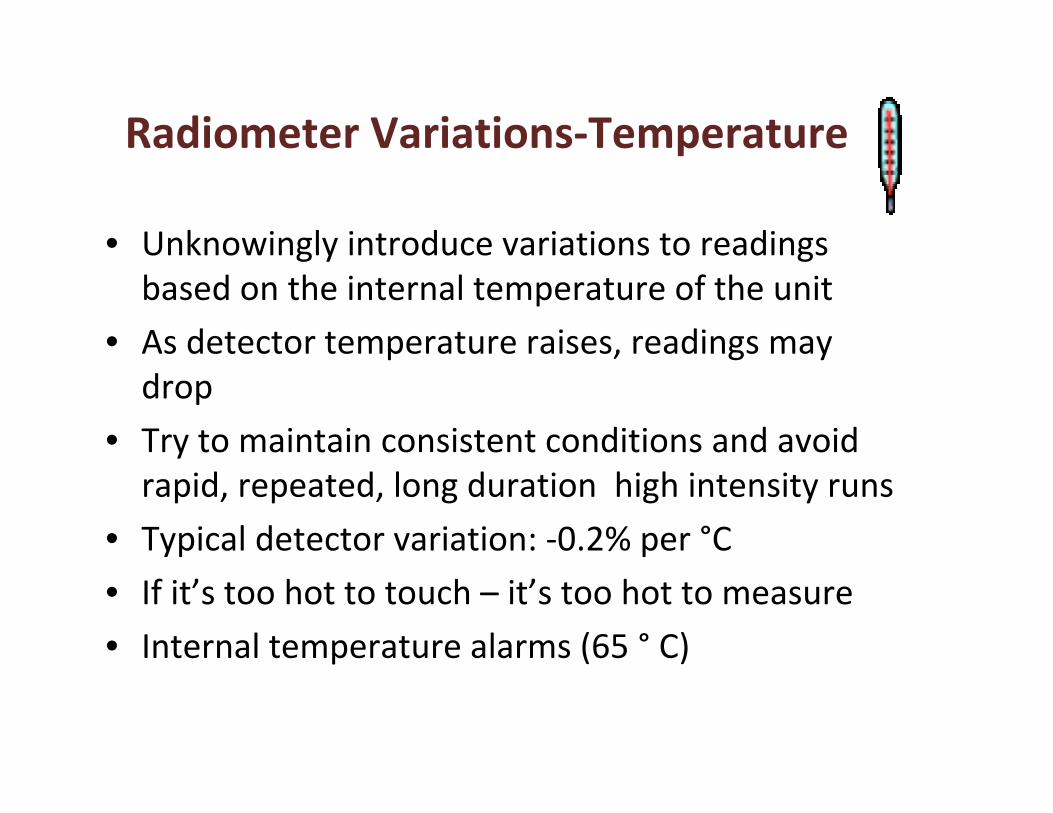
Radiometer Variations‐Temperature
• Unknowingly introduce variations to readings based on the internal temperature of the unit
• As detector temperature raises, readings may drop
• Try to maintain consistent conditions and avoid rapid, repeated, long duration high intensity runs
• Typical detector variation: ‐0.2% per °C
• If it’s too hot to touch – it’s too hot to measure
• Internal temperature alarms (65 ° C)
Wavelength
Peak Irradiance
Energy Density

When is a Joule not a Joule?
• Bandwidths are not defined and vary from manufacturer to manufacturer– EIT UVA 320‐390 nm, CWL 365 nm (narrow)
– IL UVA 250‐415 nm, CWL 365 nm (broad)
ANYthing that affects IRRADIANCE affects energy density.
Filters, cosine angle, solarization, etc.
But there are some factors that do not affect irradiance and do affect energy density.

Time
Energy Density (“Dose”)
energy density = ∫d irradiance /dt
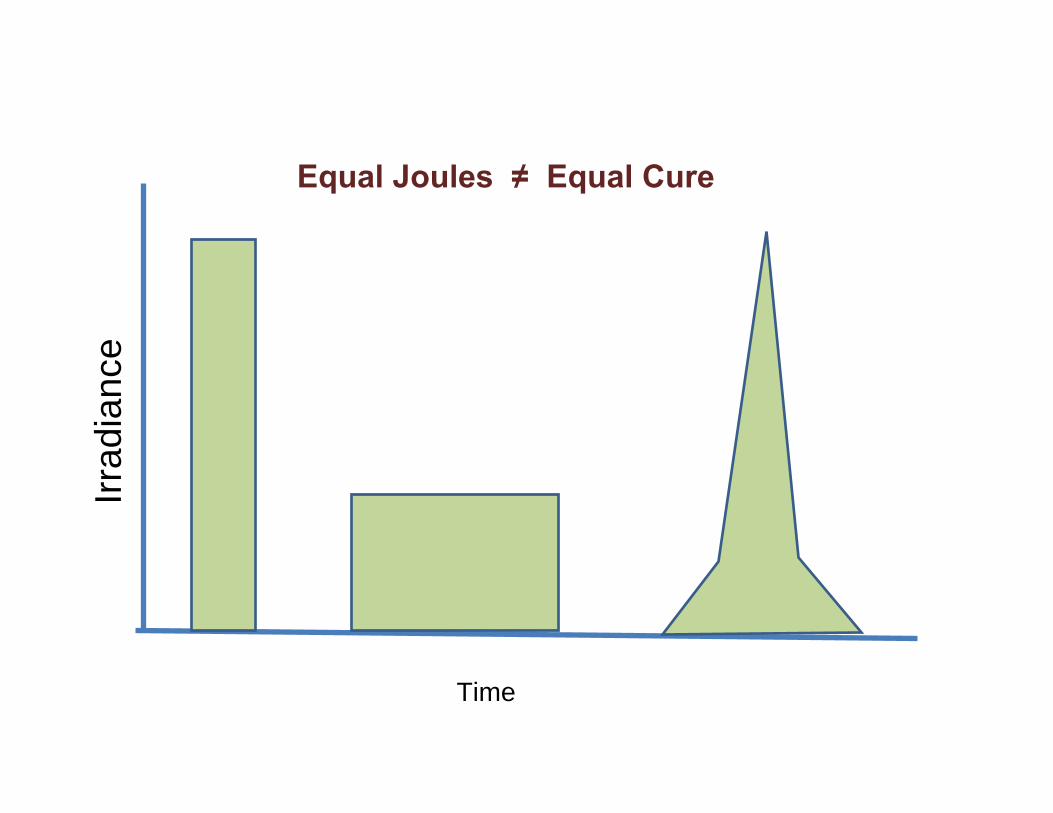
Equal Joules ≠ Equal Cure
Irrad
ianc
e
Time

Time
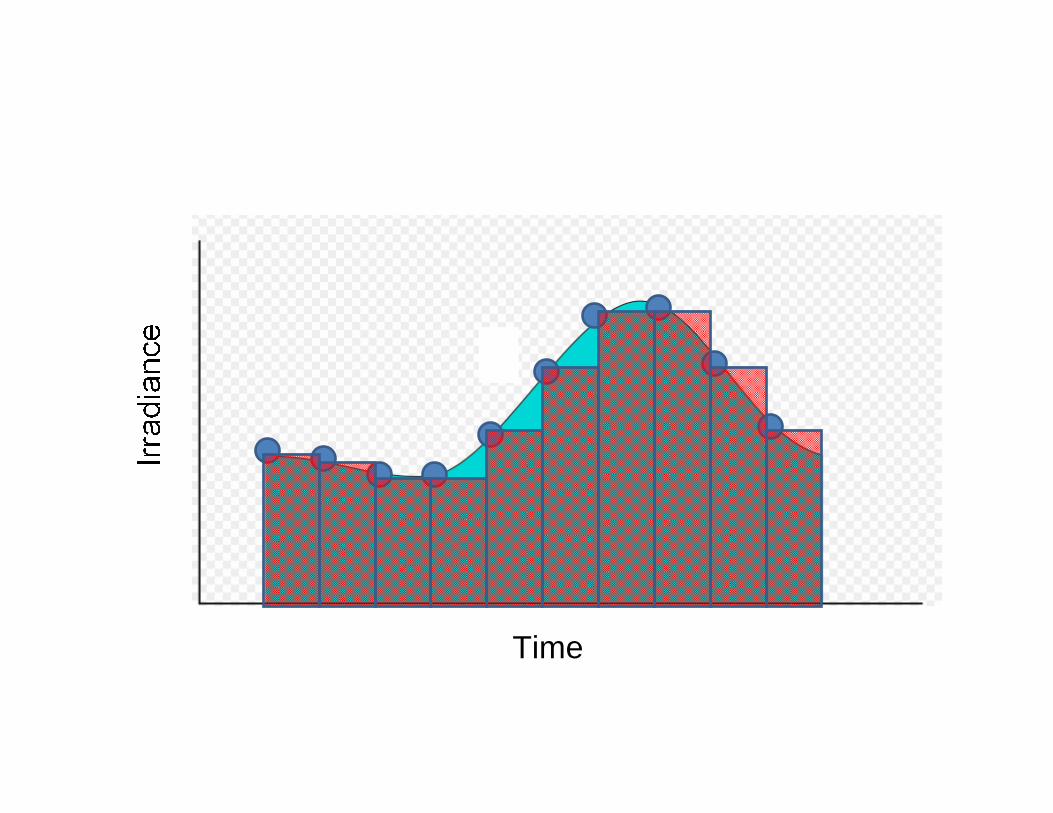
Low Sampling Rate = Less accurate for both Peak and Energy Density
Time

Sample 2 Hz
What works well at one line speed…

Sample 2 Hz
May not work well at another.
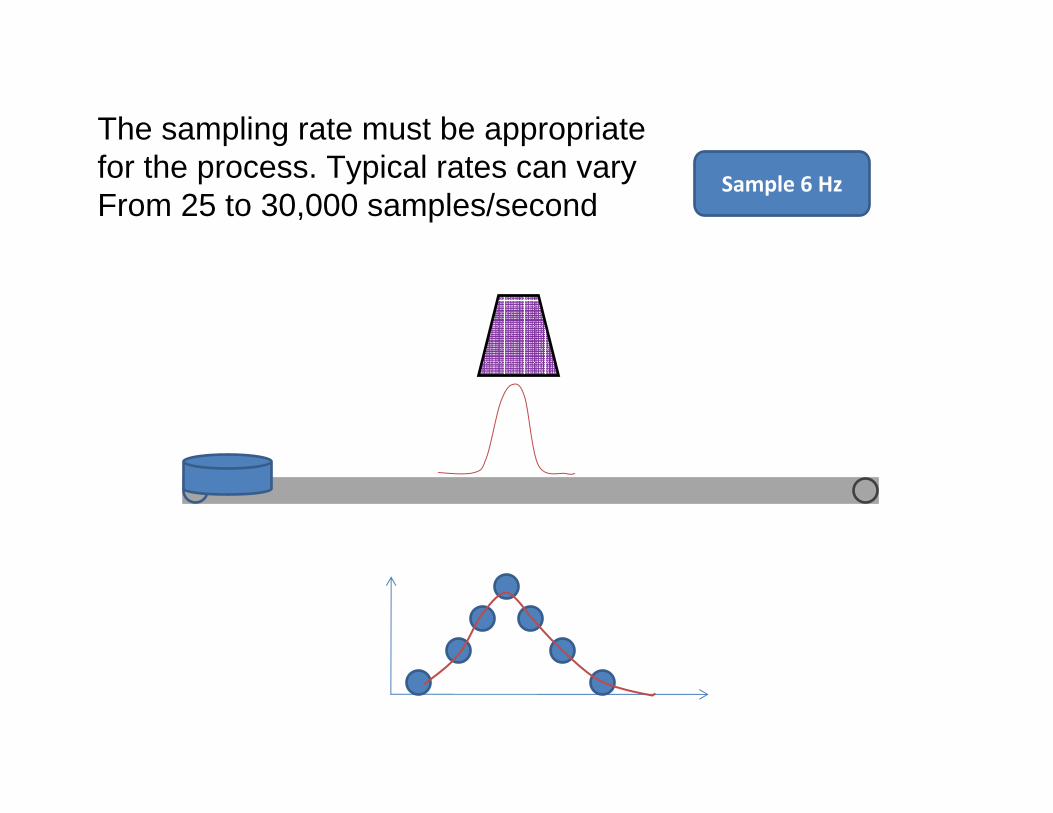
Sample 6 Hz
The sampling rate must be appropriatefor the process. Typical rates can vary From 25 to 30,000 samples/second

Pulsed Xenon Source

Pulsed Lamp Source ‐ 4 Pulses
X‐Axis Milli
seconds
1 2 3 4

UV Power Puck® FLASH
• Modified electronics for pulsed sources
• Power Puck Flash‐four UV Bandwidths
• Electronics designed for pulses between 100‐120 times/second
• Provides energy density values
• User selectable parameters
• User changeable batteries

Time
Energy Density (“Dose”)
energy density = ∫d irradiance /dt

Radiometer Variations-Threshold
40 mW
UV
W/c
m2

Radiometer Variations‐Threshold
• Start threshold: Irradiance level which causes the unit to start measuring UV– Counts all UV past that point– Varies due to scale, electronic response, optics, design
• Data threshold: Software allows user to discard all readings below a set range
• Challenge: Long slow runs of low irradiance– Potential for wide variation in energy density‐Joules

Some Practical Examplesof UV Measurement Related
Issues

Radiometer Variations ‐ Sample Rate
Total Time under UV reflector: 0.83 seconds
Time under Peak irradiance: 0.30 seconds
Inst. Sample Rate (#/sec) Samples
25 2040 33
128 106256 212
1024 8502048 1700
Speed: 33 fpm/10 mpm

Radiometer Variations ‐ Sample Rate
Total Time under UV reflector: 0.18 seconds
Time under Peak irradiance: 0.08 seconds
Inst.SampleRate (#/sec) Samples
25 440 7
128 23256 46
1024 1842048 368
Speed: 240 fpm/74 mpm
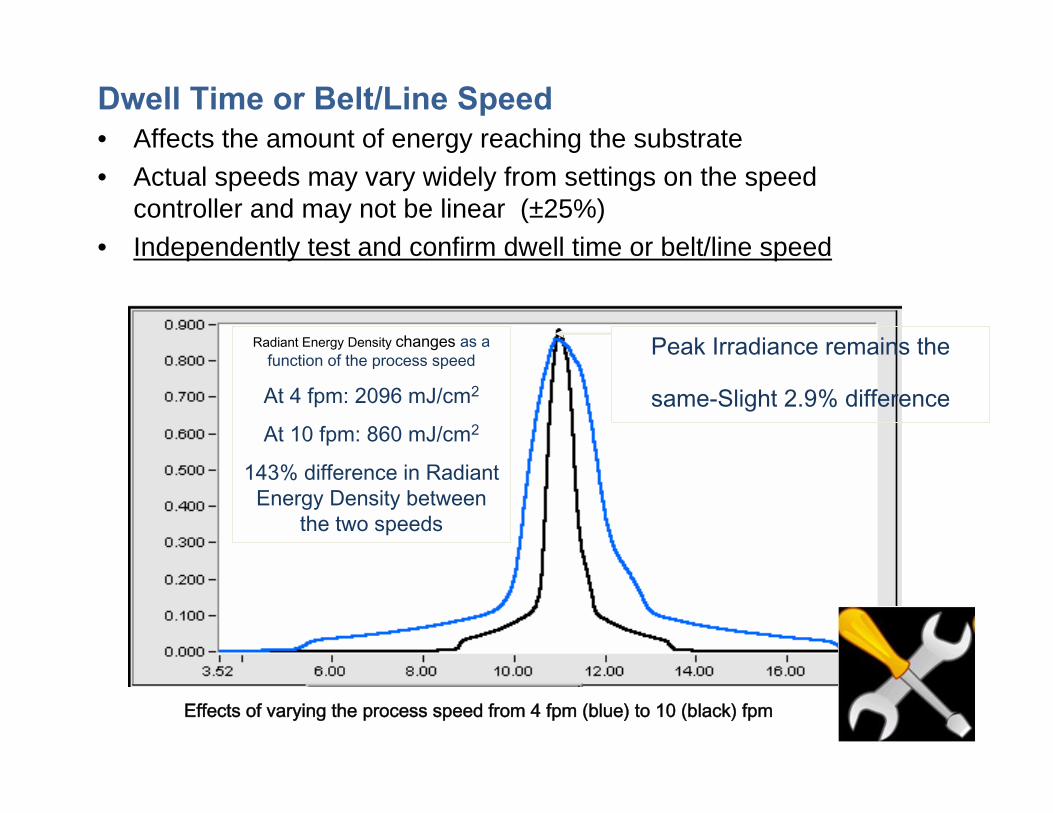
Dwell Time or Belt/Line Speed• Affects the amount of energy reaching the substrate• Actual speeds may vary widely from settings on the speed
controller and may not be linear (±25%)• Independently test and confirm dwell time or belt/line speed
Effects of varying the process speed from 4 fpm (blue) to 10 (black) fpm
Peak Irradiance remains the
same-Slight 2.9% difference
Radiant Energy Density changes as a function of the process speed
At 4 fpm: 2096 mJ/cm2
At 10 fpm: 860 mJ/cm2
143% difference in Radiant Energy Density between
the two speeds

Sagging• Middle reading lower on middle to end
comparison• 15 % difference in irradiance levels • Rotate bulbs• Cooling issues?
Life After The UV Honeymoon
Middle
End
Aging• Middle reading higher• Arc bulb aging on ends
• 440mW/cm2 (middle) vs.317 mW/cm2 (end)• Width of source to width of product?• Time to replace bulb?

Sagging‐15 % difference in irradiance levels middle to end
Across the bulb‐middle to end comparison(Inadequate Cooling/Air flow)
EndMiddle
Data collected with EIT PowerMAP

elliptical reflector

Focused lamp
Time in seconds
UV W
/cm
2

Parabolic vs. Elliptical reflectors
Elliptical ReflectorParabolic Reflector
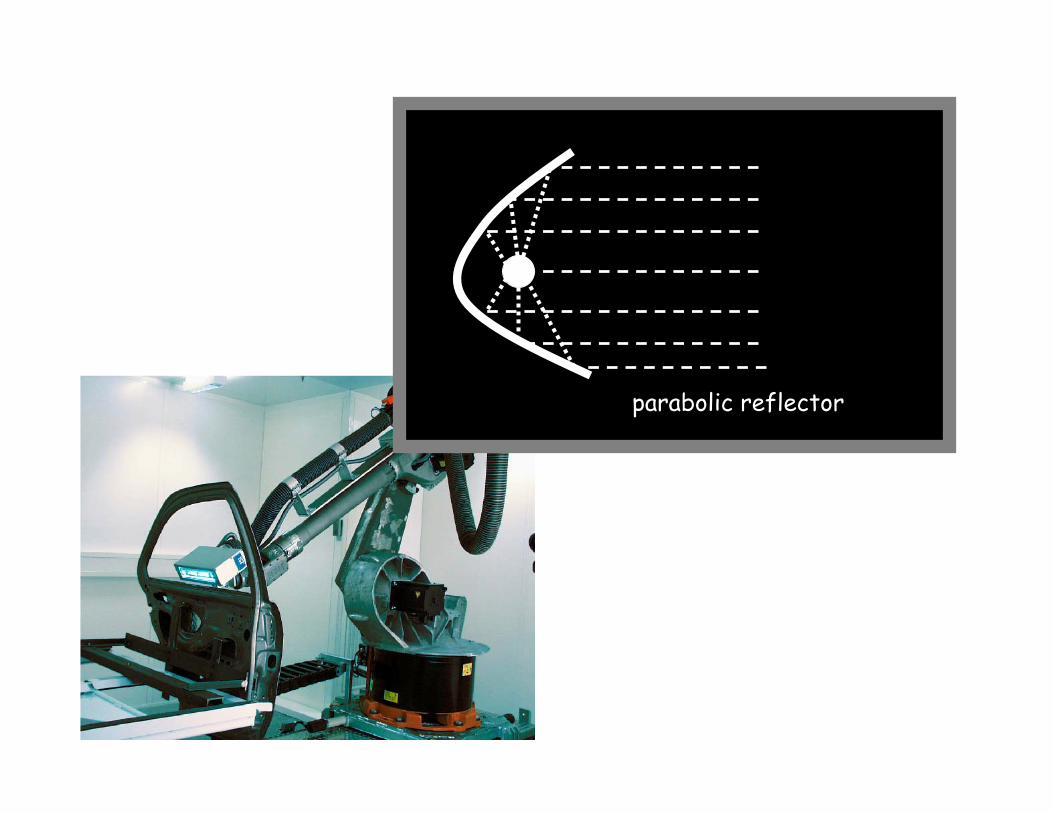
parabolic reflector

Parabolic Lamp
Time in seconds
UV W
/cm
2
Not always bad‐gloss control on wood for example
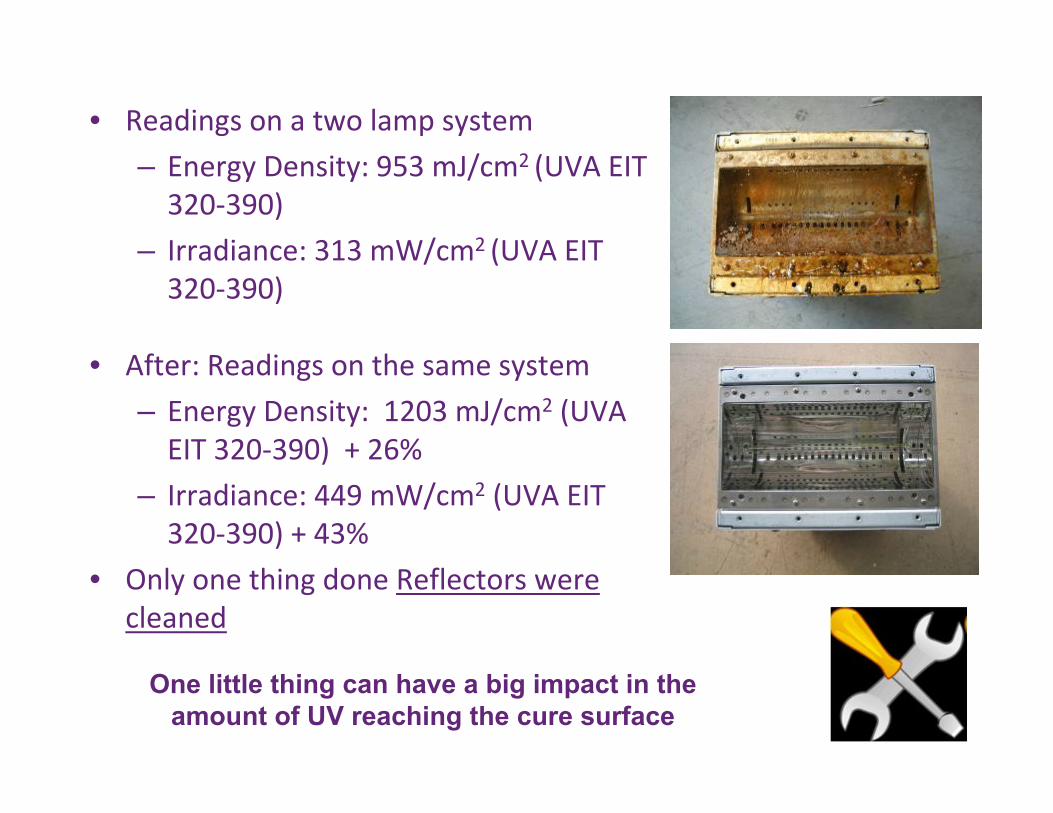
• Readings on a two lamp system
– Energy Density: 953 mJ/cm2 (UVA EIT 320‐390)
– Irradiance: 313 mW/cm2 (UVA EIT 320‐390)
• After: Readings on the same system
– Energy Density: 1203 mJ/cm2 (UVA EIT 320‐390) + 26%
– Irradiance: 449 mW/cm2 (UVA EIT 320‐390) + 43%
• Only one thing done Reflectors were cleaned
One little thing can have a big impact in the amount of UV reaching the cure surface
Images Courtesy DDU Enterprises
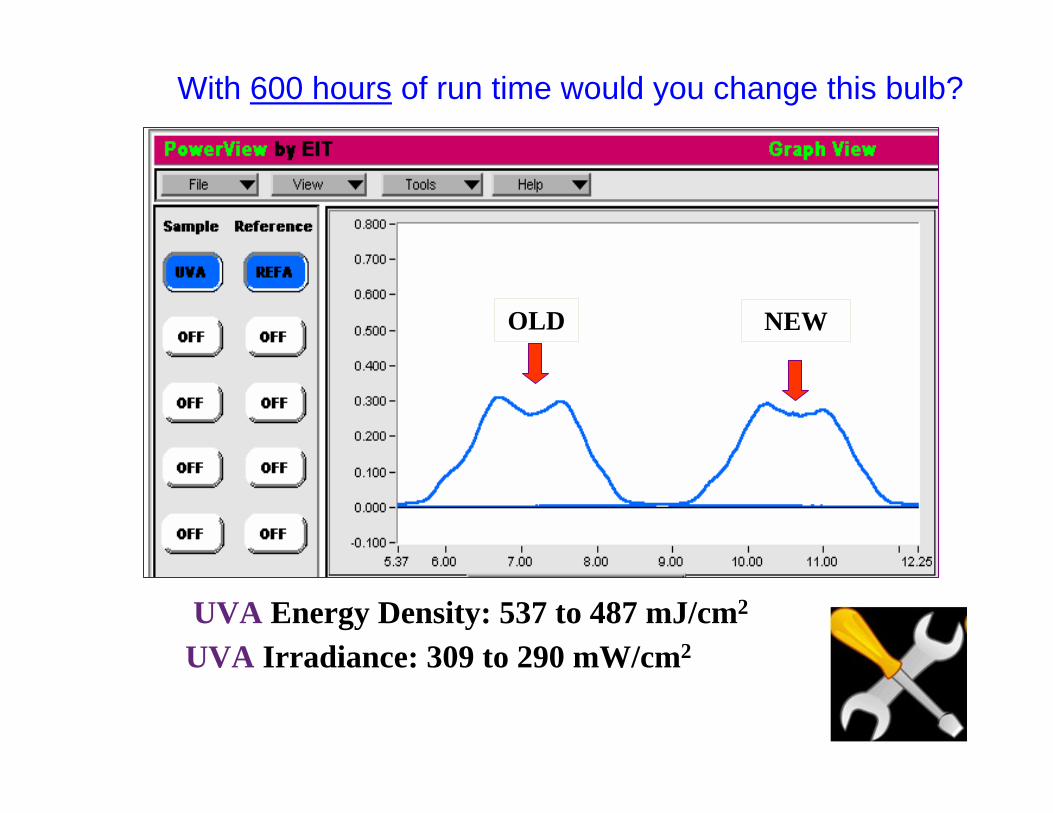
UVA Energy Density: 537 to 487 mJ/cm2
UVA Irradiance: 309 to 290 mW/cm2
NEWOLD
With 600 hours of run time would you change this bulb?

Change Now?
OLD
NEW
UVV Energy Density: 737 to 1331 mJ/cm2
UVV Irradiance: 397 to 734 mW/cm2
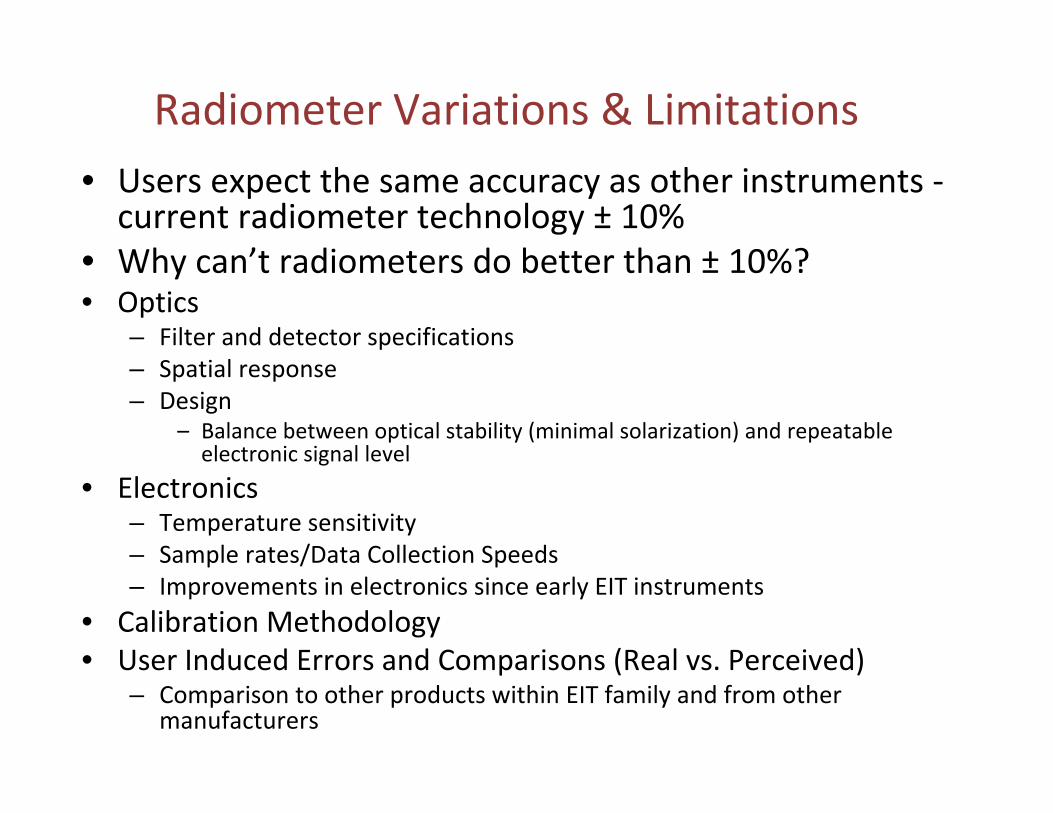
Radiometer Variations & Limitations• Users expect the same accuracy as other instruments ‐current radiometer technology ± 10%
• Why can’t radiometers do better than ± 10%?• Optics
– Filter and detector specifications – Spatial response– Design
– Balance between optical stability (minimal solarization) and repeatable electronic signal level
• Electronics – Temperature sensitivity – Sample rates/Data Collection Speeds– Improvements in electronics since early EIT instruments
• Calibration Methodology• User Induced Errors and Comparisons (Real vs. Perceived)
– Comparison to other products within EIT family and from other manufacturers
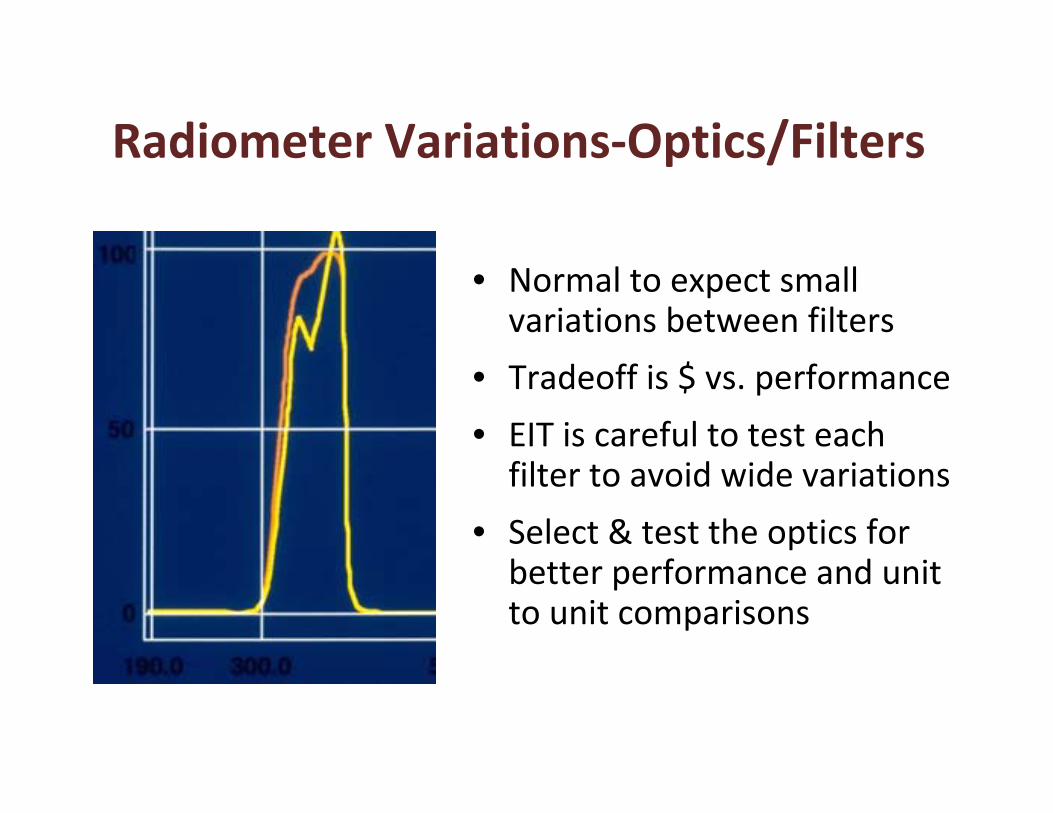
Radiometer Variations‐Optics/Filters
• Normal to expect small variations between filters
• Tradeoff is $ vs. performance
• EIT is careful to test each filter to avoid wide variations
• Select & test the optics for better performance and unit to unit comparisons
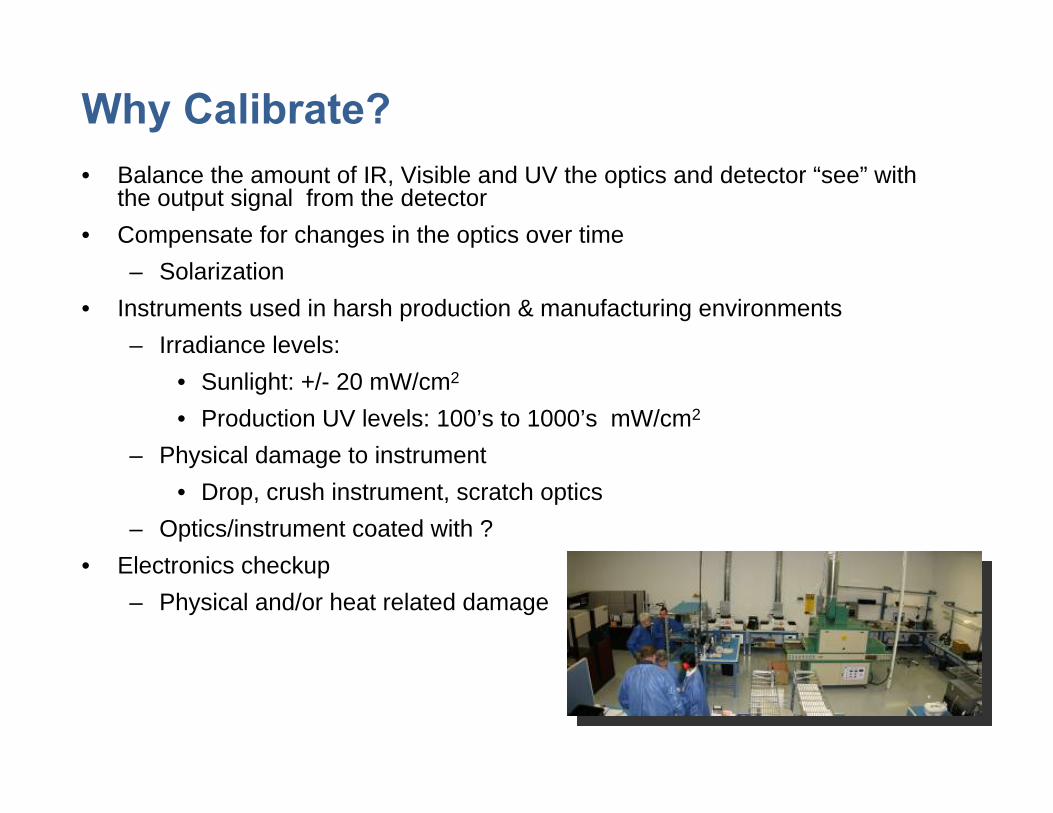
Why Calibrate?• Balance the amount of IR, Visible and UV the optics and detector “see” with
the output signal from the detector• Compensate for changes in the optics over time
– Solarization• Instruments used in harsh production & manufacturing environments
– Irradiance levels:• Sunlight: +/- 20 mW/cm2
• Production UV levels: 100’s to 1000’s mW/cm2
– Physical damage to instrument• Drop, crush instrument, scratch optics
– Optics/instrument coated with ? • Electronics checkup
– Physical and/or heat related damage

Instrument Selection
• Right Instrument/Product– Continuous, storage or mapping,
• Right Dynamic Range– Exposure vs. curing
– But I get readings…..
• Right Application– Size, Flat or 3D, etc.
• Right Source– Traditional
– Flash
– LED
• Right Expectations


Relative Instrument Examples

Examples of Compact Sensors used with either
spotcure light guides (left) or quartz pick-up
rod (below)
Process Sensors

Modern Logging Radiometer

High Speed Loggers for Xenon Lamps
• Modified electronics for pulsed sources
• Electronics designed for pulses between 100‐120 times/second
• Provides energy density values
• User adjustable parameters
• User changeable batteries

Profiling Radiometer


3DCURETM
A Multi‐Dimensional Measurement System For UV Curing Applications
Applications• UV measurement on complex, small-large objects • Formulation, process design & production process
verification including SPC/ISO support• Provide information for immediate, real-time adjustment of
lamps• Collect lamp output in different spectral bandwidths

3DCure System Examples
Headlight Bezel
Aluminum WheelAuto Door Panel

3DCure Data Screen (Cure3D)
3D Cure Software (Above)
ActiveX Custom Control Example (Right)

0
20
40
60
80
100
120
140
160
180
1 2 3 4 5 6 7 8 9 10 11 12 13 14 15 16 17
Trial Number
Peak
Irra
dian
cePath Tuning for Uniform Peak Intensity
dθ
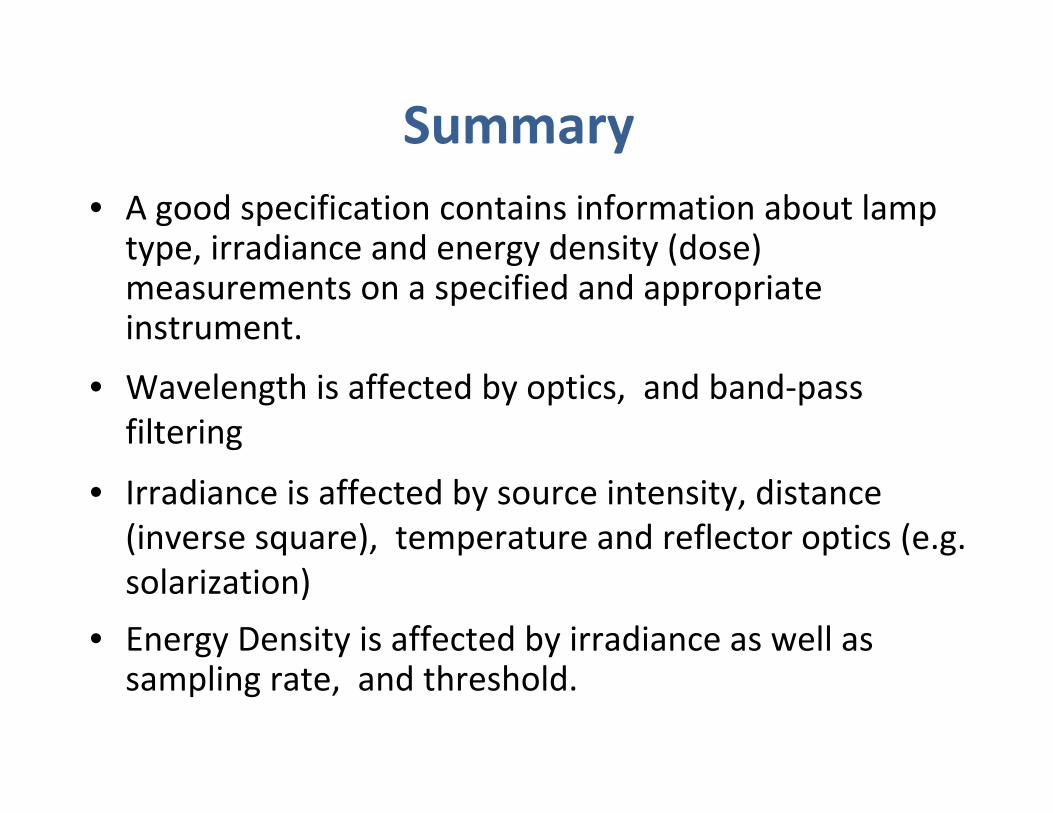
Summary• A good specification contains information about lamp type, irradiance and energy density (dose) measurements on a specified and appropriate instrument.
• Wavelength is affected by optics, and band‐pass filtering
• Irradiance is affected by source intensity, distance (inverse square), temperature and reflector optics (e.g. solarization)
• Energy Density is affected by irradiance as well as sampling rate, and threshold.

Summary• Edge effects, sagging, poor cooling, reflector design and condition, focus, etc. effect results.
• Calibrate! Instrument variation of +/‐ 10% is a practical, and unavoidable condition but time and solarization affect accuracy.
• Instrument selection depends on dynamic range, sampling rate, sensitivity, cost, size, etc. as well as many practical issues – the lab should replicate what happens in the field. A common instrument eases comparison.

Acknowledgements
• Fusion UV, UV Robotics, Phoseon Technology, Doug Delong – DDU, and Xenon Corp.
• Colleagues at EIT; Jim Raymont and Sue Casacia
UV Measurement For Formulators
Paul MillsEIT Instrument Markets
Thank You !
EIT Instrument Markets 108 Carpenter Drive
Sterling, VA 20164 USAPhone:703-478-0700
[email protected]: eitinc.com