pavement distress detection with picucha methodology … · few steps including field survey, key...
TRANSCRIPT

Article no. 4
THE CIVIL ENGINEERING JOURNAL 1-2017
-----------------------------------------------------------------------------------------------------------------
DOI 10.14311/CEJ.2017.01.0004 34
PAVEMENT DISTRESS DETECTION WITH PICUCHA METHODOLOGY FOR AREA-SCAN
CAMERAS AND DARK IMAGES
Reus Salini 1, Bugao Xu 2 and Paulius Paplauskas 3
1. Neogennium Technologies, Brazil; [email protected]
2. Advanced Materials and Manufacturing Processes Institute , University of North
Texas, Denton, Texas, USA; [email protected]
3. Road and Transport Research Institute, Lithuania; p.paplauskas@ktti. lt
ABSTRACT
The PICture Unsupervised Classification with Human Analysis (PICUCHA) refers to a hybrid human-artificial intelligence methodology for pavement distresses assessment. It combines the human flexibility to recognize patterns and features in images with the neural network ability to expand such recognition to large volumes of images. In this study, the PICUCHA performance was tested with images taken with area-scan cameras and flash light illumination over a pavement with dark textures. These images are particularly challenging for the analysis because of the lens distortion and non-homogeneous illumination, generating artificial joints that happened at random positions inside the image cells. The chosen images were previously analyzed by other software without success because of the dark coluor. The PICUCHA algorithms could analyze the images with no noticeable problem and without any image pre-processing, such as contrast or brightness adjustments. Because of the special procedure used by the pavement engineer for the key patterns description, the distresses detection accuracy of the PICUCHA for the particular image set could reach 100%.
KEYWORDS
Pavement Engineering; Pavement Survey; Pavement Inventory; Automatic Distress Detection; PICUCHA Method
INTRODUCTION
Road pavements are among the most expensive infrastructures for any country. The budgets to maintain the highways are always limited while a continuous demand for its expansion is present. The available funds are often insufficient for any country to keep all the road pavements in an excellent condition all the time. On the top of this, a large portion of the road infrastructure, constructed in the 1960/70, is approaching the end of its service life, which squeezes the budgets even more in the coming years. To help manage such situations and maximize the value of the existing budgets for roads, the effective pavement management is inevitable.
Together with the structural condition, the pavement surface condition assessment is the most important information for a proper pavement management as well as for pavement rehabilitation design. The handmade assessments, common decades ago, are no longer viable for many reasons, including the high costs, high labour demand and risks for staff on the current highly-trafficked highways.

Article no. 4
THE CIVIL ENGINEERING JOURNAL 1-2017
-----------------------------------------------------------------------------------------------------------------
DOI 10.14311/CEJ.2017.01.0004 35
Over the years different imaging technologies were developed or adapted for automated pavement surveys, including traditional area-scan cameras that take an image covering a rectangular area on every shot, line-scan cameras that take one single line of pixels on every shot, and 3D cameras that read one transversal lane profile on every shot. Despite the progress on the hardware used in the field survey, the distresses detection and analysis software for generating field data remains relatively underdeveloped.
Puan and others developed an automated pavement imaging program (APIP) for pavement distresses assessment, capable to work with longitudinal, transverse and alligator cracks, and able to analyze also the crack severity by using a number of different algorithms [1]. Ting and others used an approach based on the k-means and classification algorithms to identify the pavement distresses on pictures. The images were processed and filtered in order to keep only black-and-white pixels that were assumed as related to cracks. Then the images were grouped in clusters as distresses being detected by a decision-tree algorithm capable of recognizing horizontal, vertical, alligator and man-hole-like cracks [2].
To detect the pavement distresses in pictures Ouyang et al., tried an approach based on filtering the images to remove the background, or pavement texture, and image enhancements, segmentation and Canny edge detection [3]. Nguyen and others did the cracks detection using a kind of conditional texture anisotropy to characterize and classify the pixels as “crack” or “crack-free” pixels. The idea is to detect variations of features, including noise, continuity, homogeneity and others. The authors claimed the method can detect also other patterns, like joints [4].
Tsai and others worked on image segmentation as a kind of preprocessing for distresses detection and classification. Six different algorithms were used and evaluated with images taken near the city of Atlanta, USA, with varying lighting conditions, shadows and cracks [5]. Lin and Liu used Support Vector Machine (SVM), a topology of artificial intelligence similar to neural networks, for assessment of potholes on pavement pictures. The pavement texture was detected by using the histogram and a non-linear SVM was built to identify if the target region was a pothole. The experimental results show that the approach can achieve satisfactory results [6].
An approach combining analytic hierarchy process (AHP) and fuzzy logic theory for pavement condition assessment was developed by Sun and Gu. AHP is used to determine weight from a paired comparison matrix and an evaluation with fuzzy relations, combining the evaluation of five different indicators, including roughness, deflection, surface deterioration, rutting and skid resistance. A maximum grade principle and a defuzzified weighted cumulative index are proposed to assess the condition of a road [7].
Salman and others proposed a novel approach to automatically distinguish cracks in digital pavement images with the “Gabor” filter that is related to the mammalian visual perception. In their study the pavement images with a prominent surface macrotexture that are frequently harder to get analyzed [8].
Potholes were also the subject in Koch and Brilakis’ study. The images were first segmented into defect and non-defect regions using the histogram-based thresholding and then, the potential pothole shape was approximated by utilizing morphological thinning and elliptic regression. After that, the texture inside the potential pothole was compared with the texture of the surrounding area to decide if it represented a pothole or not. The routine was implemented in MATLAB [9]. After the procedure was improved by using a vision tracker to reduce the computational effort and improve the detection and pothole counting [10].
To detect distresses in images Avila and others used a “minimum path” technique, defined as when the sum of pixels intensity is the smallest. It is a single step procedure that works with geometry and intensity property of pixels, made viable for practical use by dynamic programing [11]. For the distresses assessment Díaz-Vilariño and others used data from a mobile Light

Article no. 4
THE CIVIL ENGINEERING JOURNAL 1-2017
-----------------------------------------------------------------------------------------------------------------
DOI 10.14311/CEJ.2017.01.0004 36
Detection And Range (LiDAR) system, a surveying technology that measures distances by illuminating the target with a laser light. Their method is based on the evaluation of roughness descriptors from LiDAR data to segment and classify the asphalt pavement [12].
The Kinect device is a motion sensor originally developed to provide a natural interface for gamers. Because of its low cost, interesting detection capabilities and easy connection to computers, it has been adapted for different uses in many industries. Xie worked with Kinect generated data to detect pavement distresses by considering the measurements of depth, width, length, and area, and various cracking types, such as alligator cracking, traverse cracking and longitudinal cracking [13].
PICUCHA FOR PAVEMENT DISTRESSES ASSESSMENT
The PICture Unsupervised Classification with Human Analysis (PICUCHA) method is a new approach for pavement distresses assessment that combines the human flexibility to recognize patterns on images with the neural network ability to match patterns by similarity, expanding the (human) pavement engineer decisions over large image sets.
PICUCHA has been designed to circumvent the limitations commonly found on other methodologies such as the variations on the pavement colour and texture, handling all the patterns registered on images, distresses or not. PICUCHA can detect good pavement, raveling, complex or isolated cracks, block or alligator cracks, sealed cracks, patches, potholes, painted horizontal signals, like white or yellow strips, reflective signs attached to the pavement, drainage devices, embedded inductive loops, joints, asphalt bleeding, or any combination of two or more of such patterns, among others. It can analyze road sections with mixed pavement types, like asphalt and concrete, with any type of surface texture, colour or pattern, including anti-slippery strips or cuttings, and with the presence of complex or solid shadows.
PICUCHA is capable of analyzing orthogonal images (“downward facing”) taken in the field with any device technology (line-scan or area-scan cameras, 3D cameras, …), different sources of illumination (laser beam, incandescent lamps, LED, …) and different image resolutions and dimensions such as 512 x 2048 or 2048 x 2048 pixels. The PICUCHA approach is structured in a few steps including field survey, key patterns extraction, key patterns analysis by a pavement engineer, and the engineer decisions expansion to all the images in a given set, as shown in Fig. 1. A study evaluating the PICUCHA method performance with images at different resolutions is also available [14].
The PICUCHA method is an extension of our previous developments on new methodologies and artificial intelligence applied for pavement engineering, including pavement management with genetic algorithms [15], pavement modelling with neural networks [16], the aside failure criteria that opens a new frontier of possibilities [17], and a deflection basin geometry analysis to calculate strains [18], among others.
CAMERA TECHNOLOGIES FOR PAVEMENT SURVEY
Over the years the companies developed different cameras technologies and other devices for pavement surface condition assessment with growing image resolutions. The most common are the area-scan cameras, line-scan cameras and 3D cameras. Those devices are available with different image resolutions and from different suppliers and integrators (“brands”). The camera type and resolution have a direct impact on the image quality and the equipment’s cost.

Article no. 4
THE CIVIL ENGINEERING JOURNAL 1-2017
-----------------------------------------------------------------------------------------------------------------
DOI 10.14311/CEJ.2017.01.0004 37
Area-scan cameras were the first generation of equipment for pavement survey. They are adaptations of general-purpose cameras (Fig. 2.a) and are notorious for its low cost. Some integrators assemble two cameras together for a higher resolution. This type of camera takes a rectangular image on every shot (e.g. 2048x512 pixels) resulting in a number of problems, especially image distortions and non-homogeneous illumination. Those problems are especially visible when two or more images are assembled together and generate an extra challenge for the distresses detection by software. Area-scan cameras are not compatible with laser illumination, requiring many lamps that are usually strobe flashlights.
1 Field survey
The field survey is done with any equipment capable to take downward facing pictures. The PICUCHA algorithms can process images taken with any device brand or technology including:
Line-scan or area-scan camera, laser crack measurement systems (LCMS) or other;
With laser, incandescent, LED or other types of lamps, or just natural illumination; and,
Images with any size and resolution.
2 Key patterns identification
The images are sliced into cells (e.g. 128 x 128 pixels) and a special algorithm will analyze and group the cells to identify the key patterns. There is no predefinition of distresses or limitations, the self-learning algorithm deals with any kind of pattern existing in a given image set. The key patterns represent the characteristics of every group.
3 The human pavement expert analysis
The key patterns are analyzed by a human pavement expert that will describe the distresses and other desired characteristics with base on any standard or manual for distresses assessment. At least one key pattern cell per group must be analyzed. This procedure avoids the problem to rely just on software tools and keeps the human expert on top of the process.
4 The human pavement expert analysis expanded to all images
The human pavement expert description is used to refeed the algorithms that will expand such decisions to all the images in the respective image set and groups, generating the final report.
Fig. 1 - Flow chart of PICUCHA Method’s main steps
Line-scan cameras represent an advance in technology and image quality (Fig. 2.b). As its name suggests, it takes one single line of pixels on every shot (e.g. 2048 x 1 pixels). Image distortions and illumination heterogeneity are minimal. The line-scanned pixels can be assembled together to generate a consistent and flat rectangular image. It is compatible with laser (beam) illumination in addition to incandescent, LED and other types of lamps.
The 3D cameras, also known as laser crack measurement systems (LCMS), collect two different information at the same time: a 2D top-view image and a transverse profile (Fig. 2.c). The image is usually a by-product for this equipment and its quality tends to be low. The analysis is performed by using the profile data to locate the cracks over the image. Some integrators install the 3D cameras together with line-scan cameras for a better image quality. This technology is relatively new and well-known for its very high costs.

Article no. 4
THE CIVIL ENGINEERING JOURNAL 1-2017
-----------------------------------------------------------------------------------------------------------------
DOI 10.14311/CEJ.2017.01.0004 38
(a) Area-scan camera (b) Line-scan camera (c) Laser crack measurement
system (LCMS)
Fig. 2 - Camera technologies for pavement surveys
PICUCHA PERFORMANCE WITH AREA-SCAN CAMERA AND DARK IMAGES
The objective of this study is to verify the PICUCHA algorithms ability to process images taken with area-scan cameras and showing a dark asphalt pavement.
Images taken with area-scan cameras and flash illumination represent an extra challenge for processing and distresses detection. Some pavement areas are closer to the camera than others, creating lens distortions and non-perfectly flat images, and the illumination is not homogeneous over the image because some areas are closer to the lamps than others, generating an artificial joint when two or more images are assembled together for the analysis, as shown in Fig. 3.
Dark images are an important challenge for the automatic distresses detection. Almost all software are capable to analyse only images with distresses patterns, colours and visual texture similar to those taken in consideration on the algorithms development, failing in all other cases. The images used in this study were previously analysed by other commercial software without success because of the pavement dark colour and texture.
Fig. 3 – Distortions and illumination joints are evident with image are assembled together

Article no. 4
THE CIVIL ENGINEERING JOURNAL 1-2017
-----------------------------------------------------------------------------------------------------------------
DOI 10.14311/CEJ.2017.01.0004 39
The images analysed in this study were taken by the Road and Transport Research Institute of Lithuania with a vehicle survey system equipped with two area-scan cameras, providing a final resolution of 1.1157 mm/pixel, and flash lights illumination (strobe light bar) (Fig. 4). The area-scan cameras took a rectangular image on every shot. Every image is 2921x444 pixels in size, resulting of the data fusion of both cameras, and covering an area of 3.25x0.50 meters (width x length), which is slightly narrow than a typical road lane.
Fig. 4 - Vehicle for pavement surveys with dual area-scan cameras and flashlights
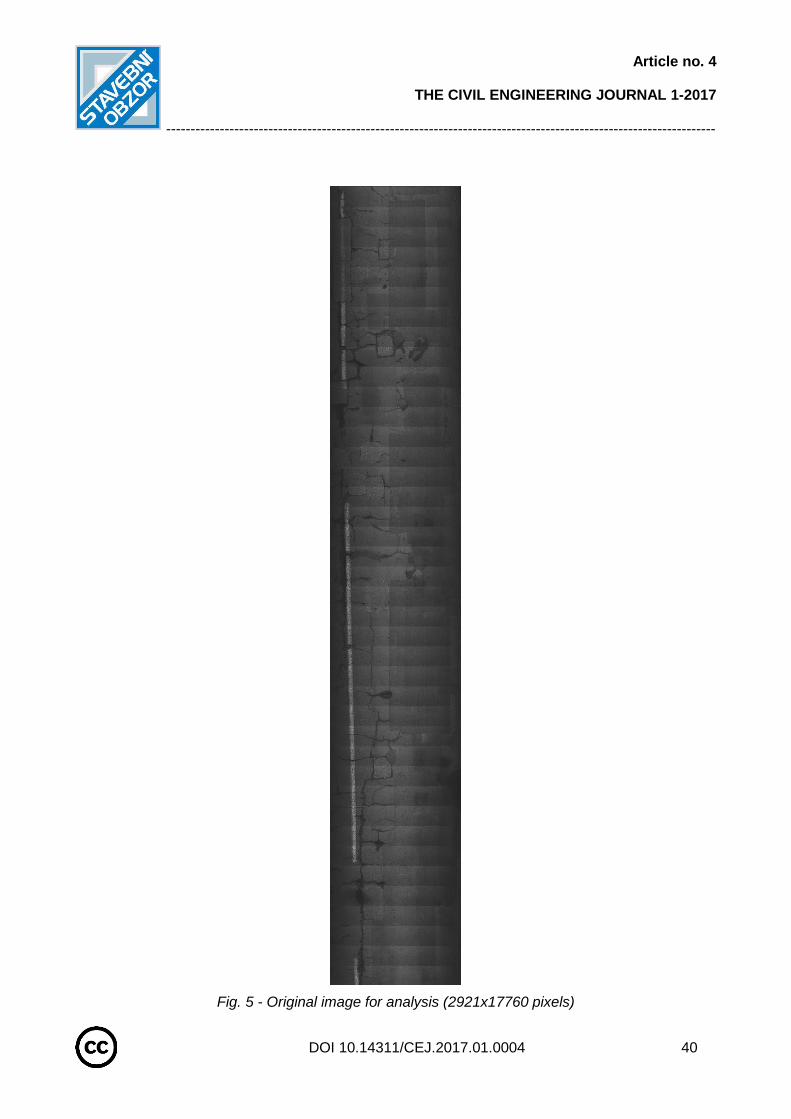
For this study 40 sequential images with 2921x444 pixels each one are used, assembled together as shown in Fig. 5, with a final size of 2921x17760 pixels. No image pre-processing has been used, like contrast or brightness adjustments, or others; they are raw as generated by the cameras.
The analysis followed PICUCHA methodology and the 2921x17760 pixels image (Fig. 5) was broken down into cells. For the processing the cell’s size was set to 133x133 pixels and the algorithms were set to generate 25 groups. This procedure, the 40 images assembling and successive slicing into cells, is required to have the illumination joints and lens distortion happening in random positions inside the cells (Fig. 6), preventing a bias and making the analysis more challenging.
PICUCHA algorithms had no problems to process the image (Fig. 5) and perform the cells’ grouping. The distribution of the 2814 cells among the 25 groups are shown on Fig. 7. The group 5 is the largest, with 349 cells while the group 19 has just 17 cells. The cells groups is a key step to reduce, simplify and rationalize the subsequent pavement engineering work describing the patterns.
Following the PICUCHA method, the pavement engineer did the key patterns description according to the Lithuanian standard for distresses assessment [19]. Five patterns were identified in the images: (1) good pavement, (2) crack medium severity, (3) longitudinal crack medium severity, (4) alligator cracking, and (5) pavement patch. The characteristics (patterns and distresses) of every group are shown in Fig. 8 and the groups of cells over the original image are shown in Fig. 9. The final results, containing the distresses assessment for this study, are shown in Fig. 10. Because of the special procedure used by the pavement engineer analysing the key patterns, the PICUCHA accuracy for this particular study is 100%. Different image sets may lead to different accuracies, which depend on the images quality, used camera, illumination type, pavement characteristics, distresses patterns complexity, pavement engineer work analysing the key patterns and other variables.
Article no. 4
THE CIVIL ENGINEERING JOURNAL 1-2017
-----------------------------------------------------------------------------------------------------------------
DOI 10.14311/CEJ.2017.01.0004 40
Fig. 5 - Original image for analysis (2921x17760 pixels)

Article no. 4
THE CIVIL ENGINEERING JOURNAL 1-2017
-----------------------------------------------------------------------------------------------------------------
DOI 10.14311/CEJ.2017.01.0004 41
Group 3 Group 5 Group 7 Group 11 Group 17
Fig. 6 - Sample cells (133x133 pixels) with illumination joints
and lens distortion in random positions
Fig. 7 - Cell’s distribution among the groups

Article no. 4
THE CIVIL ENGINEERING JOURNAL 1-2017
-----------------------------------------------------------------------------------------------------------------
DOI 10.14311/CEJ.2017.01.0004 42
CONCLUSIONS
40 images used in this study were taken with a survey device with two area-scan cameras and flashlights illumination. The images have lens distortion and illumination joints while the pavement has a dark colour texture. Other commercial software were not able to analyse and perform the distresses detection.
The 40 images were assembled together and, then, successfully divided into cells as a part of PICUCHA procedure. The illumination joints and lens distortion were distributed inside the cells in random positions as expected.
PICUCHA was able to perform the analysis despite of the lens distortion, illumination joints and dark aspect of the pavement. No image pre-processing was used. The algorithms made 25 groups, which is a relatively low number, and the distresses are well characterized in every group. The pavement engineer followed the Lithuania pavement distresses assessment standard to identify five key patterns: good pavement, crack medium severity, longitudinal crack medium severity, alligator cracking and patch. Because of the special procedure used by the pavement engineer, the distresses detection accuracy for this study could reach 100%. Different image sets may lead to different accuracies.
0%
10%
20%
30%
40%
50%
60%
70%
80%
90%
100%
1 2 3 4 5 6 7 8 9 10 11 12 13 14 15 16 17 18 19 20 21 22 23 24 25
Su
rfa
ce o
f th
e c
ell'
s g
rou
p
Group number
Patch
Alligator cracking
Longitudinal crackmedium severity
Crack mediumseverity
Good pavement
Fig. 8 - Pavement patterns and distresses according to the group

Article no. 4
THE CIVIL ENGINEERING JOURNAL 1-2017
-----------------------------------------------------------------------------------------------------------------
DOI 10.14311/CEJ.2017.01.0004 43
Fig. 9 - Analysed image with cells (2921x17760 pixels)

Article no. 4
THE CIVIL ENGINEERING JOURNAL 1-2017
-----------------------------------------------------------------------------------------------------------------
DOI 10.14311/CEJ.2017.01.0004 44
39.68%
8.17%6.54%
1.17%
44.43%
Good pavement
Crack medium severity
Longitudinal crackmedium severity
Aligator cracking
Patch
Fig. 10 - Final distresses assessment according to the Lithuanian standard with PICUCHA
ACKNOWLEDGMENTS
To the Road and Transport Research Institute of Lithuania and CAPES, Ministry of Education of Brazil, for their cooperation with this study.
REFERENCES
[1] Puan, O.C., Mustaffar, M., Ling, T.-C., 2007. Automated Pavement Imaging Program (APIP) for
Pavement Cracks Classification and Quantification. Malaysian Journal of Civil Engineering 19(1): 1–16.
[2] Ho, T., Chou, C., Chen, C., Lin, J., 2010. Pavement distress image recognition using k-means and
classification algorithms. In: Tizani, W., editor. Computing in Civil and Building Engineering, Proceedings of
the International Conference, Nottingham, UK: Nottingham University Press p. 73–8.
[3] Ouyang, A., Luo, C., Zhou, C., 2010. Surface Distresses Detection of Pavement Based on Digital
Image Processing. IFIP Advances in Information and Communication Technology, vol. 347 AICT. Nanchang,
China p. 368–75.
[4] Nguyen, T.S., Begot, S., Duculty, F., Bardet, J.-C., Avila, M., 2010. Pavement Cracking Detection
Using an Anisotropy Measurement. 11ème IASTED International Conference on Computer Graphics and
Imaging (CGIM), Innsbruck, Austria.
[5] Tsai, Y., Kaul, V., Mersereau, R.M., 2010. Critical Assessment of Pavement Distress Segmentation
Methods. Journal of Transportation Engineering 136(1): 11–9, Doi: 10.1061/(ASCE)TE.1943-5436.0000051.
[6] Lin, J., Liu, Y., 2010. Potholes detection based on SVM in the pavement distress image.
Proceedings - 9th International Symposium on Distributed Computing and Applications to Business,
Engineering and Science, DCABES 2010: 544–7, Doi: 10.1109/DCABES.2010.115.
[7] Sun, L., Gu, W., 2011. Pavement Condition Assessment Using Fuzzy Logic Theory and Analytic
Hierarchy Process. Journal of Transportation Engineering 137(9): 648–55, Doi: 10.1061/(ASCE)TE.1943-
5436.0000239.
[8] Salman, M., Mathavan, S., Kamal, K., Rahman, M., 2013. Pavement Crack Detection Using the
Gabor Filter. Proceedings of the 16th International IEEE Annual Conference on Intelligent Transportation
Systems (ITSC 2013), The Hague, The Netherlands p. 2039–44.

Article no. 4
THE CIVIL ENGINEERING JOURNAL 1-2017
-----------------------------------------------------------------------------------------------------------------
DOI 10.14311/CEJ.2017.01.0004 45
[9] Koch, C., Brilakis, I., 2011. Pothole detection in asphalt pavement images. Advanced Engineering
Informatics 25(3): 507–15, Doi: 10.1016/j.aei.2011.01.002.
[10] Koch, C., Jog, G.M., Brilakis, I., 2013. Automated Pothole Distress Assessment Using Asphalt
Pavement Video Data. Journal of Computing in Civil Engineering 27(4): 370–8, Doi:
10.1061/(ASCE)CP.1943-5487.0000232.
[11] Avila, M., Begot, S., Duculty, F., Nguyen, T.S., 2014. 2D image based road pavement crack
detection by calculating minimal paths and dynamic programming. 2014 IEEE International Conference on
Image Processing (ICIP), IEEE p. 783–7.
[12] Díaz-Vilariño, L., González-Jorge, H., Bueno, M., Arias, P., Puente, I., 2016. Automatic classification
of urban pavements using mobile LiDAR data and roughness descriptors. Construction and Building
Materials 102: 208–15, Doi: 10.1016/j.conbuildmat.2015.10.199.
[13] Xie, S., 2015. 3D Pavement Surface Reconstruction and Cracking Recognition Using Kinect-Based
Solution. The University of New Mexico, 2015.
[14] Salini, R., Xu, B., Souliman, M., 2016. Impact of Image Resolution on Pavement Distress Detection
Using PICUCHA Methodology. Stavební Obzor - Civil Engineering Journal 25(4), Doi:
10.14311/CEJ.2016.04.0024.
[15] Salini, R., Xu, B., Lenngren, C.A., 2015. Application of artificial intelligence for optimization in
pavement management. International Journal of Engineering and Technology Innovation 5(3): 189–97.
[16] Salini, R., 2010. INTELLIPave: Uma Abordagem Baseada em Inteligência Artificial para a
Modelagem de Pavimentos Asfálticos. University of Minho, 2010.
[17] Salini, R., Neves, J., Abelha, A., 2009. INTELLIPave - Considering aside failure criteria and unknown
variables in evolutionary intelligence based models for asphalt pavement. Proceedings - 23rd European
Conference on Modelling and Simulation, ECMS 2009, Madrid, Spain p. 624–9.
[18] Salini, R., 2004. Salini Method 2004. Computational Mechanics: Proceedings Of the Sixth World
Congress on Computational Mechanics in Conjunction with the Second Asian-Pacific Congress on
Computational Mechanics 2: 148–55.
[19] TKTI., 1994. Asfaltbetonio Dangų Defektų Nustatymo Metodika. Kaunas, Lithuania.