paying the freight: - consumer federation of america
TRANSCRIPT

2
PAYING THE FREIGHT:
THE CONSUMER BENEFITS OF INCREASING THE FUEL ECONOMY OF MEDIUM AND
HEAVY DUTY TRUCKS
Dr. Mark Cooper Director of Research, CFA
With contributions from
Jack Gillis Director of Public Affairs, CFA and author, The Car Book
February, 2014

CONTENTS
I. INTRODUCTION 1
Purpose Overview of Findings: Commercial Transportation Fuel Costs are Large, Growing and Have a Direct Impact on Households
II. CONSUMERS PAY THE FUEL COSTS FOR AMERICA’S TRUCKING 4 AND DELIVERY INDUSTRY
Current Household Expenditures for Medium and Heavy Duty Truck Fuel Future Household Expenditure Trends Commercial Fuel Costs Are Passed Through to Households Econometric Models Demonstrate the Pass-Through Nature of Transportation Fuel Costs
III. POTENTIAL FUEL AND COST SAVINGS FOR MEDIUM AND 10 HEAVY DUTY TRUCKS
Light Duty Technology Experience as Context for Medium and Heavy Duty Standards
Medium and Heavy Duty Truck Technology Curves Consumer Benefits of Reducing Transportation Fuel Costs Indirect Benefits of Reducing Transportation Fuel Costs The Costs of Implementing Standards
IV. ACHIEVING FUEL COST SAVINGS WITH EFFICIENCY STANDARDS 18
Externalities Lead to Underinvestment in Fuel Saving Technologies Market Obstacles , Barriers and Imperfections Inhibiting Investment Performance Standards as a Policy Tool to Overcome Obstacles to Investment Conclusion
LIST OF EXHIBITS
II-1: Annual Cost of Transportation Energy Costs per Household by Vehicle Type 4
II-2: Motor Vehicle Fuel Economy 1949-2011 5
II-3: Trends in Fuel Economy and Consumption Mileage by Vehicle 6 Type Expected MPG
II-4: Gross Domestic Product by Sectors 7
II-5: Sector Multipliers for the California Economy 9
III-1: Predicted Light Duty Fuel Efficiency Costs and Resulting Increases 10 in Fuel Economy
III-2: Technology Cost and Fuel Savings 11
III-3: The Cost of Fuel Efficiency Technology and its Payback in Fuel Savings 12
III-4: Break-Even analysis for Class 8 Trucks 13
III-5: Diesel Prices in the Long Term 14

III-6: Tractor Trailers: Reduction in Consumption & Break Even Fuel Costs 15
III-7: Ratio of Estimated Cost to Actual Cost by Source 17
IV-1: Performance Standard and Market Barriers to Efficiency in the 21 Medium and Heavy Duty Truck Sector
IV-2: Interaction of Supply and Demand Side Factors in a Recursive Loop 23

1
I. INTRODUCTION
PURPOSE
Over the past decade public opinion polling by the Consumer Federation of America and other consumer groups has revealed strong and widespread support for energy efficiency standards for consumer durables including automobiles and households appliances.1 Because gasoline and electricity bills are such a large household expense – in 2010, households spent about $2,130 on gasoline and $1400 on electricity2 — it is not surprising that polls consistently elicit these responses. Consumers feel the pain at the pump and when they pay their utility bills.
Economic analysis has shown that there is a sound basis for this consumer support of energy efficiency standards.3 Although energy saving technologies require an investment, when they lower energy bills by much more than the cost of the technology, the result is substantial net savings to consumers.
While direct household expenditures on personal energy are significant, they are only part of the nation’s expenditures on energy. Energy consumption in the commercial and industrial sectors exceeds the energy consumed in the residential sector.4 Ultimately, consumers pay the costs of commercial and industrial transportation energy consumption in the price of the goods and services they buy.
Although the consumer impact of commercial and industrial energy costs will vary across goods, services and markets, this report shows that these indirect expenditures on energy are substantial and have a significant impact on U.S. households. One of the largest contributors to commercial energy consumption is America’s medium and heavy duty trucks. Reducing the energy consumption of these truck fleets will have a positive impact on household expenditures.
This paper examines the costs of energy used by medium and heavy duty trucks, the potential for energy savings in this transportation sector, and the positive impact increased fuel efficiency will have on America’s households. When fuel prices rise, so does the cost of consumer goods due to the cost of transporting those goods. Conversely, because of competition, a reduction in transportation costs will result in lower cost of goods for consumers. Moreover, the fact that a significant component of the trucking industry is also seeking ways to reduce the enormous impact of fuel expenditures on their costs reinforces the recognition.5
1 Mark Cooper, 2013, Energy Efficiency Performance Standards: The Cornerstone of Consumer-Friendly Energy Policy, Consumer
Federation of America, presents an extensive bibliography of survey analysis by the Consumer Federation of America and other consumer groups.
2 Here we use 2010 estimates because the data for analyzing medium and heavy duty truck fuel expenditures used in this paper, is available through 2010. The most recent figures for consumer expenditures (mid-2011 through mid-2012) are $2600 for gasoline and $1400 for electricity.
3Cooper, 2013. 4 Household gasoline consumption accounts for about half of transportation fuels. Households account for about one-
third of electricity consumption and one-sixth of natural gas consumption. 5 Consumer Federation of America (Gillis) interviews with UPS, Navistar, Peterbilt, ATA.

2
OVERVIEW OF FINDINGS: COMMERCIAL TRANSPORTATION6 FUEL COSTS ARE LARGE,
GROWING AND HAVE A DIRECT IMPACT ON HOUSEHOLDS
Because the money households spend for fuel used to deliver consumer goods and services is substantial, reducing fuel usage would benefit Americans. CFA has concluded that:
In 2010, medium and heavy duty truck fuel costs amounted to more than $1100 per household. Unless policies are adopted to change underlying trends, this amount is expected to grow considerably during the next two decades.
Implementing fuel saving technologies could lower medium and heavy duty truck fuel consumption by almost 50% and yield a net savings to consumers (after the cost of the technologies are recovered) over $250 per year.
As fuel prices rise and transportation services increase, the potential household savings would rise to over $400 per year by 2035.
Because the transportation sector is very competitive, the cost savings in fuel will be passed through to consumers.
Reducing commercial transportation fuel costs will benefit the economy for the following reasons:
As the central transportation service in our economy, trucking accounts for nearly 90% of the total value of freight transport, two thirds of the fuel used and slightly less than half of the total ton miles.7 Reducing fuel expenses will reduce the cost of transportation and thereby increase the demand for transportation services, which will have a significant positive multiplier effect on the economy.
In spite of the fact that lower fuel costs increase demand for transportation services, the net effect will be overall cost savings because the increase in efficiency is much larger than the increase in the demand for services.
As pass-through transportation fuel costs for consumers decline, disposable income will increase, further stimulating economic growth and activity.
Reducing commercial transportation fuel costs will provide significant social benefits in the following ways:
The environmental impact of medium and heavy duty trucks is significant and growing. Reducing their use of fuel will provide a major contribution to reducing pollution and greenhouse gas emissions.
The potential for cutting commercial transportation fuel usage in half will significantly reduce our dependence on foreign oil thereby improving America’s energy security.
6 In this paper we are using the term “commercial transportation” to include transportation costs related to medium and
heavy duty trucks. We are excluding other types of commercial transportation (i.e., air, rail, public transportation, etc.).
7 Committee to Assess Fuel Economy for Medium and Heavy Duty Vehicles, Technologies and Approaches to Reducing the Fuel Consumption of Medium- and Heavy-Duty Vehicles, National Research Council, 2010, Figure 1-5, Table 2-1.

3
Performance standards are an effective approach to achieving savings in transportation fuel costs, as shown by:
Overcoming the market barriers and imperfections in the trucking sector that have prevented many economic opportunities to save energy from being implemented.
In 2011, the trucking sector had a fuel economy standard applied for the first time. This was almost 40 years after fuel economy standards were implemented for cars and small trucks (light duty vehicles). While not due to take effect until 2014, this standard has stimulated significant progress and will produce significant savings.8
More aggressive standards in the future will yield even greater savings.
In this report: Section II will explain how we derive the cost of fuel consumption by medium and heavy duty trucks that is borne by households.
Section III will identify the magnitude and cost of the reduction in fuel consumption that can be achieved in the medium and heavy duty truck sector.
Section IV will examine why the medium and heavy duty truck sector has failed to incorporate technologies that would lower fuel consumption on their own and why performance standards are an effective policy to address this significant economic issue.
8 Class 8 trucks are expected to experience a 20% increase in fuel efficiency.

4
II. CONSUMERS PAY THE FUEL COSTS FOR AMERICA’S TRUCKING AND DELIVERY INDUSTRY
CURRENT HOUSEHOLD EXPENDITURES FOR MEDIUM AND HEAVY DUTY TRUCK FUEL
To estimate the potential consumer savings from improvements in the fuel economy of medium and heavy duty trucks, we first estimated the fuel used by the three main vehicle categories: households, commercial and medium and heavy duty. We undertake this analysis because different organizations that analyze energy use slightly different categorizations of energy use by types of vehicles and because light duty vehicles, which make up the vast majority of households vehicles, are already covered by standards. We want to be careful not to double count energy consumption or potential energy savings in our estimate of indirect household expenditures on medium and heavy duty transportation fuel.
Exhibit II-1 shows transportation fuel consumption divided into three categories: household light duty vehicles, commercial light duty vehicles, and medium and heavy duty trucks. We use three data sources to build our estimate, the Annual Energy Outlook of the Energy Information Administration, the Bureau of Labor’s Consumer Expenditure Survey, and the data gathered by the U.S. Department of Transportation’s Bureau of Transportation Statistics, which estimates fuel usage by types of vehicles.
EXHIBIT II-1: ANNUAL COST OF TRANSPORTATION ENERGY COSTS PER HOUSEHOLD BY
VEHICLE TYPE (2010) How Vehicle Types are Characterized Consumption Fuel Annual Cost
Billion Gallons Type Cost Total Per Billion Household
EIA/BLS BTS EIA/BLS BTS
Household Gasoline Light Duty Short Axle 91 88 Gasoline $2.835 $254 $2,150
Commercial Light Duty Light Duty Long Axle 36 36 Gasoline $2.835 $102 $ 865
Medium & Heavy Duty 2Axle-Six Wheel 43 45 Diesel $2.993 $132 $1,116
& Combination
Source: Consumptions: Bureau of Labor Statistics (BLS), Consumer Expenditure Survey 2010, Energy Information Administration (EIA), Annual Energy Outlook, 2013, Appendix A; Department of Transportation (DOT), Bureau of Traffic Statistics (BTS) Data Base, Tables 4-11 to 4-14. Price: Energy Information Administration, Petroleum Database; Households, Bureau of the Census, Statistical Abstract of the United States: 2012, Table 59, 118 million households. Notes: Annual total is based on the average of the EIA and BTS consumption multiplied by the average price. Per household is calculated by dividing the annual total by 118 million households.
The EIA identifies the amount of energy consumed by automobiles and light duty vehicles, medium duty vehicles and heavy duty trucks. The EIA data does not separate out household and commercial use of light duty vehicles, so we used the Consumer Expenditure Survey from the Bureau of Labor Statistics to estimate the gasoline consumed by households. We subtracted this from the total for light duty vehicles, as reported in the Annual Energy Outlook, to determine the amount of energy consumed by light duty vehicles that is not consumed by households. We call this commercial light duty. As shown in Exhibit II-1, this approach provides an estimate that is consistent with the Department of Transportation data, which categorizes vehicles by axle length and the number of
5
tires. The consistency of this data provides us with a substantial level of confidence in the amount of medium and heavy duty truck fuel we use for our calculations.
We then divided the total dollar amount by the total number of households to arrive at the expenditure per households. Using 118 million households, Exhibit II-1 shows the resulting household energy costs attributed to each transportation sector.9 Direct household expenditures on gasoline were about $2,150 in 2010. We estimate that indirect household expenditures on fuels consumed by medium and heavy duty trucks was just over $1,100. In other words, for every one-dollar households spent directly on personal transportation fuel, they spent about 50 cents on medium and heavy duty truck transportation fuel.
FUTURE HOUSEHOLD EXPENDITURE TRENDS
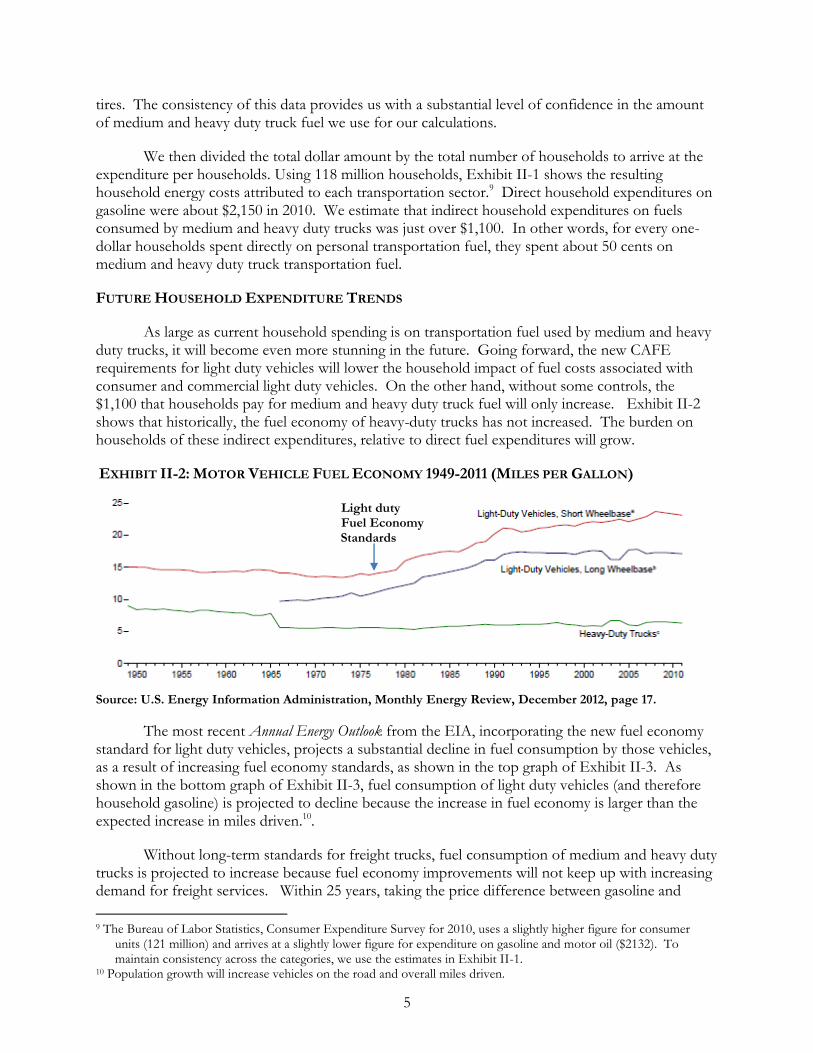
As large as current household spending is on transportation fuel used by medium and heavy duty trucks, it will become even more stunning in the future. Going forward, the new CAFE requirements for light duty vehicles will lower the household impact of fuel costs associated with consumer and commercial light duty vehicles. On the other hand, without some controls, the $1,100 that households pay for medium and heavy duty truck fuel will only increase. Exhibit II-2 shows that historically, the fuel economy of heavy-duty trucks has not increased. The burden on households of these indirect expenditures, relative to direct fuel expenditures will grow.
EXHIBIT II-2: MOTOR VEHICLE FUEL ECONOMY 1949-2011 (MILES PER GALLON) Light duty
Fuel Economy Standards
Source: U.S. Energy Information Administration, Monthly Energy Review, December 2012, page 17.
The most recent Annual Energy Outlook from the EIA, incorporating the new fuel economy standard for light duty vehicles, projects a substantial decline in fuel consumption by those vehicles, as a result of increasing fuel economy standards, as shown in the top graph of Exhibit II-3. As shown in the bottom graph of Exhibit II-3, fuel consumption of light duty vehicles (and therefore household gasoline) is projected to decline because the increase in fuel economy is larger than the expected increase in miles driven.10.
Without long-term standards for freight trucks, fuel consumption of medium and heavy duty trucks is projected to increase because fuel economy improvements will not keep up with increasing demand for freight services. Within 25 years, taking the price difference between gasoline and
9 The Bureau of Labor Statistics, Consumer Expenditure Survey for 2010, uses a slightly higher figure for consumer
units (121 million) and arrives at a slightly lower figure for expenditure on gasoline and motor oil ($2132). To maintain consistency across the categories, we use the estimates in Exhibit II-1.
10 Population growth will increase vehicles on the road and overall miles driven.

6
0
2
4
6
8
10
2010 2015 2020 2025 2030 2035
Trillion BTU Personal and Freight Consumption of Fuel
Personal Freight Freight-Price Adjusted
0
10
20
30
40
50
2010 2015 2020 2025 2030 2035
MPG Projected MPG by Vehicle Type
Light Duty
diesel into effect, direct and indirect household expenditures on transportation energy are projected to be almost equal. Moreover, rising diesel prices relative to gasoline prices will push freight fuel costs higher.
EXHIBIT II-3: TRENDS IN FUEL ECONOMY AND CONSUMPTION MILEAGE BY VEHICLE TYPE
EXPECTED MPG
Source: Energy Information Administration, Annual Energy Outlook, 2013.
COMMERCIAL FUEL COSTS ARE PASSED THROUGH TO HOUSEHOLDS
While we have calculated the size of fuel expenditures on a per household basis, we must ask, “do households actually pay these costs?” We believe the answer is clearly “Yes.” These costs are just like any other commercial costs in the economy. When a farmer pays for fertilizer or the delivery driver gets his paycheck, these are business costs that are recovered in the price of the related goods and services. The same is true with fuel costs. In fact, the Mid-Atlantic Freight

7
0%
2%
4%
6%
8%
10%
12%
14%
Chart Title
Coalition confirms the pass through of transportation costs in a recent report on how transportation and logistics consume a significant portion of household budgets. According to the report,
“the freight logistics system costs nearly $4,500 per person, which is spent moving and warehousing goods. This $4,500 factors into the cost of every product we buy. Anything that industry or government can do to make the logistics system more efficient will return benefits in terms of lower cost and greater global competitiveness.”11
While this estimate of the size of the expenditure on freight logistics includes all transportation modes and all costs, such as the cost of equipment, maintenance and salaries paid in the sector, the observation on the importance of transportation costs to the economy applies to all the components of transportation costs, including fuel costs. In fact, as discussed below, it applies with greater force to fuel costs since such a large share of the resource to produce transportation fuels is imported.
While the recognition that transportation costs are paid by consumers is obvious, the concept is reinforced by two observations: First, although transportation costs are a small part of the total economy (just under 3%), they are as large, or larger, than several other sectors, including agriculture, mining, utilities and construction (see Exhibit II-4).
EXHIBIT II-4: GROSS DOMESTIC PRODUCT BY SECTORS Source: GDP by Industry, http://en.wikipedia.org/wiki/Economy_of_the_United_States
Second, fuel costs are the single largest component of transportation costs, representing over one-third of the total cost. Fuel costs are slightly larger than driver pay and three times as large as the cost of owning and insuring the truck.12 As transportation costs are passed through to consumers, fuel is the largest component of that pass-through.
11 Mid-America Freight Coalition “The Economic Importance of Freight,” p. 2. 12 NRC, 2010, Table 6.1

8
ECONOMETRIC MODELS DEMONSTRATE THE PASS-THROUGH NATURE OF TRANSPORTATION
FUEL COSTS
The economic reality of the flow through to consumers of transportation fuel costs is reflected in the way econometric models describe the growth of the economy. Such models are built on input/output tables, and transportation costs are a significant input in the models. In building these models, the pass-through of transportation costs is assumed, since transportation plays a fundamental role in the overall cost of production.
In building these models, the pass-through of transportation costs is assumed, since transportation plays a fundamental role in economic activity as a factor of production.
Transportation is an economic factor of production of goods and services, implying that relatively small changes can have substantial impacts on costs, locations and performance… Transport also contributes to economic development through job creation and its derived economic activities. Accordingly, a large number of direct (freighters, managers, shippers) and indirect (insurance, finance, packaging, handling, travel agencies, transit operators) employment are associated with transport. Producers and consumers make economic decisions on products, markets, costs, location, prices which are themselves based on transport services, their availability, costs and
capacity.13
The importance of transportation in these economic models is reflected in the high
multiplier it is given in the models. In order to build a model of the economy, analysts study the places where a sector purchases inputs and sells output. Typically, the more places that are touched by a sector, the larger its multiplier. Because most economic models are built on the flow of goods and services through the economy, they depend on the geographic scope and nature of activity within the economy being modeled. Transportation is generally seen as a central input to measuring broader economic activity.
To further reinforce the impact of transportation costs on consumer pocketbooks, Exhibit II-5 presents the sector multipliers for the state of California. Transportation has the 20th largest multiplier, in a study of 60 California sectors. Not only is the transportation cost multiplier above average, but it is substantially larger than the multipliers on related to the petroleum production.
13 Transportation and Economic Development Authors: Dr. Jean-Paul Rodriguez and Dr. Theo Notteboom,
http://people.hofstra.edu/geotrans/eng/ch7en/conc7en/ch7c1en.html , A regional analysis reinforces this observation, Oregon, Transportation, Plan Update, Transportation and the Economy Manufacturing is dependent on transportation to receive raw materials and to deliver its products. Manufacturing is usually a highly competitive activity. Unless an area has other low cost attributes, high transportation costs will cause manufacturers to leave or avoid that area

9
0
0.5
1
1.5
2
2.5
3
Transport Oil extraction Petrol Mfct. Median
Mu
ltip
liers
Industry
EXHIBIT II-5: SECTOR MULTIPLIERS FOR THE CALIFORNIA ECONOMY
Source: California Economic Strategy Panel, Using Multipliers to Measure Economic Impacts, 2009, Table 1
In modeling the impact of higher fuel economy with these econometric models, it is important to understand the relative size of two different impacts. On the one hand, as the cost of transportation declines, demand for transportation increases because demand for goods and services that use transportation increases. However, the fuel savings from greater efficiency are much larger than the increase in consumption due to increases in demand for other goods and services. The net effect is to reduce expenditure on fuel as a percent of total output. In fact, the reduction in energy consumption may be so large that the absolute level of consumptions is lowered. This has a positive effect on the economy. We consume less petroleum products and more of other goods and services. Because those other goods and services have bigger multipliers, the economy expands.
Thus recognizing the pass through to consumers of expenditures on fuel for medium and heavy duty trucks is important for both energy policy and economic policy.

10
0
20
40
60
80
100
120
140
160
$0 $1,000 $2,000 $3,000 $4,000 $5,000 $6,000
Mile
s p
er
Gal
lon
Additional Cost
MIT- 2008 NAS - 2010 NHTSA - 2011
III. POTENTIAL FUEL AND COST SAVINGS FOR MEDIUM AND HEAVY DUTY TRUCKS
LIGHT DUTY TECHNOLOGY EXPERIENCE AS CONTEXT FOR MEDIUM AND HEAVY DUTY
STANDARDS
In 2002, after the first gasoline price spike of the 21st century, the National Academy of Science undertook an analysis of the technical potential to increase the fuel economy of light duty vehicles.14 It concluded that there was substantial opportunity to reduce fuel economy at relatively low costs. They determined that the value of the fuel savings was larger than the cost of the technology needed to reduce fuel use. As shown in Exhibit III-1, other well-respected research reached similar conclusions over the course of the decade.
EXHIBIT III-1: PREDICTED LIGHT DUTY FUEL EFFICIENCY COSTS AND RESULTING
INCREASES IN FUEL ECONOMY
Sources: NAS -2010, National Research Council of the National Academy of Science, America’s Energy Future (Washington, D.C.: 2009), Tables 4.3, 4.4; MIT, 2008; Laboratory of Energy and the Environment, On the Road in 2035: Reducing Transportation’s Petroleum Consumption and GHG Emissions Cambridge: July, 2008), Tables 7 and 8; EPA-NHTSA - 2010, Environmental Protection Agency Department of Transportation In the Matter of Notice of Upcoming Joint Rulemaking to Establish 2017 and Later Model Year Light Duty Vehicle GHG Emissions and CAFE Standards, Docket ID No. EPA-HQ-OAR-0799 Docket ID No. NHTSA-2010-0131, Table 2.
Although there were differences in the estimates, a clear consensus emerged showing a significant amount of economic benefit in developing new fuel saving technologies. This universal conclusion was a key reason why the doubling of the fuel economy standards for light duty vehicles (CAFE) was adopted in 2012. It was particularly significant that this standard was fully supported by diverse segments of the market including: car companies, unions, consumer groups, and environmentalists.
As shown in Exhibit III-1, as the 2025 CAFE standards were being considered, the consensus was that the fuel economy of cars could approach 60 miles per gallon at costs in the range of $2,000 to $3,000. The standard was set at 54.5 miles per gallon. Given that the average fuel
14 Transportation Research Board, National Research Council, 2002, Effectiveness and Impact of Corporate Average Fuel
Economy, National Academy of Sciences.

11
0%
10%
20%
30%
40%
50%
60%
$0 $10,000 $20,000 $30,000 $40,000 $50,000 $60,000 $70,000 $80,000 $90,000 $100,000
NESCCAF GO-60 UCS NRC ACEEE
economy at the time was about 27 miles per gallon, this represented more than a doubling of the fuel economy of new vehicles. When the fuel economy doubles, fuel consumption is cut in half. Given the amount of money being spent on gasoline, such a large reduction in gasoline costs would quickly pay for itself and yield large net benefits over the life of the vehicle. This result will be equally true in the medium and heavy duty truck sector.
MEDIUM AND HEAVY DUTY TRUCK TECHNOLOGY CURVES
The medium and heavy duty truck sector is a much more complex product space than light duty vehicles. Nevertheless, while there are different types of vehicles, equipment configurations, and use patterns, a similar consensus has emerged with respect to medium and heavy duty trucks—expenditures on fuel efficient technology will be more than offset by savings in fuel costs. Exhibit III-2 presents fuel savings in terms of percentage reduction (rather than gallons) for tractor trailers. Tractor trailers, defined as Class 8 trucks, are the most significant category of medium and heavy duty trucks, accounting for 60-75 percent15 of the fuel consumption for this class of vehicles.
EXHIBIT III-2: TECHNOLOGY COST AND FUEL SAVINGS
Sources: Northeast States Center for a Clear Air Future, International Council on Clean Transportation and Southwest Research Institute, Reducing Heavy Duty Long Haul Combination Truck Fuel Consumption and CO2 Emissions, October 2009; Don Air, Delivering Jobs: The Economic Costs and Benefits of Improving the Fuel Economy of Heavy-Duty Vehicles, Union of Concerned Scientists, May 2010; Committee to Assess Fuel Economy for Medium and Heavy Duty Vehicles, Technologies and Approaches to Reducing the Fuel Consumption of Medium- and Heavy-Duty Vehicles, National Research Council, 2010; Go 60 MPG, Delivering the Goods: Saving Oil and Cutting Pollution from Heavy Duty Trucks. A. Siddiq Khan and Therese Langer, 2011, Heavy Duty Vehicle Fuel Efficiency and Greenhouse Gas Emissions: The 2014-2019 Standards and a Pathway to the Next Phase, American Council for an Energy Efficient Economy, December.
As Exhibit III-2 shows, various studies predict that significant percentages of fuel reduction (10-20%) can be made with technology investments of $10,000-$20,000. In addition, substantial percentages of reduction (40-50%) can be made with investments of $40,000-$50,000.16 This high
15 NRC, 2010, Table 2-1. 16 It is important to note that a 50% fuel consumption decrease is equal to a 100% increase in fuel economy. In other
words, when the fuel economy doubles, the fuel consumption is cut in half.

12
reduction in fuel consumption is for Class 8 trucks, and other categories may not present equally rich fuel saving potential, but the potential is substantial in all classes of trucks.17
Compared to the figures for light duty vehicles, the cost of adding efficiency technologies to heavy duty trucks may appear large. However, heavy duty trucks are driven many more miles and cost between $100,000-$150,000. Given the much larger number of miles driven per year in heavy duty trucks and the much lower mileage per gallon, as well as the higher cost of diesel, the average annual expenditure on fuel for heavy duty trucks is almost ten times the expenditure for light duty vehicles.18
To demonstrate the economics of fuel cost savings, the EPA estimates that to achieve the 20% improvement in Class 8 vehicles by 2018, it could involve a technology cost of $6215.19 While this is a substantial amount of money, it would improve the MPG of a typical truck from today’s 6.5 average MPG, to 7.8 MPG. Using typical miles per year and a conservative 4 year period, the investment of $6215 will save over $43,000 after paying for the technology. For a truck operator, that provides a payback period of just over six months. This example is included in Exhibit III-2. This is a significant reduction in fuel consumption at a very low cost. While requirements for the next phase of fuel efficiency standards are likely to be more expensive, as this paper shows, the resulting benefits will be much greater. The bottom line: even with significant technology costs, because these vehicles consume such large quantities of fuel, the paybacks will be significant and rapid.
Exhibit III-3: THE COST OF FUEL EFFICIENCY TECHNOLOGY AND ITS PAYBACK IN FUEL
SAVINGS
Benefits of 2014-
2018 Standard MPG
Miles
Traveled
Per Year
Cost
of Fuel
Years of
Owner-
ship
4 Year
Cost of
Fuel
4 Year
Fuel
Savings
Fuel
Saving
Less Cost
Fuel
Savings
per
Year
Months
for
Payback
Average Truck
Efficiency 6.5 120,000 $3.88 4 $286,523
$6215
technology cost
to get 20%
improvement
7.8 120,000 $3.88 4 $238,769 $47,754 $43,534 $11,938 6.25
17 For example, the American Council for an Energy Efficient Economy estimates potential fuel savings from two
phases of technology improvement at between 30% and 46% for heavy duty pickup and vans and Class 8 trucks respectively, http://aceee.org/files/pdf/fact-sheet/hd-oil-reduction.pdf;. There are many opportunities to reduce fuel consumption that have been studied recently. See for example, Ben Sharpe and Nigel Clark, Trailer technologies for increased heavy-duty vehicle efficiency, Technical, market, and policy considerations, International Council on Clean Transportation, June 2013; Donald W. Stanton, Systematic Development of Highly Efficient and Clean Engines to Meet Future Commercial Vehicle Greenhouse Gas Regulations, Safe International, 2013-01-2421, September 2013; TA Engineering, DOE SuperTruck Program Benefits Analysis, December 20, 2012. It should also be noted that the cost analyses are being updated and, reflecting the findings in Cooper, 2013, the actual costs are likely to be lower than early estimates.
18 Energy Information Administration, Monthly Energy Review for fuel consumption, of 4, 26 gallons per heavy duty truck of 4126 gallon and 460 gallons per light duty vehicle in 2011. Diesel was over 7% more expensive than gasoline.
19 Fed. Register Vol.76, No. 179, page 57127

13
0
0.5
1
1.5
2
2.5
$0 $10,000 $20,000 $30,000 $40,000 $50,000 $60,000 $70,000 $80,000 $90,000 $100,000
Break-even $/gallon
Technology Cost
NRC
NESCAFF
GO-60
UCS
Log. (NESCAFF)
Log. (UCS)
With estimates of the technology costs and fuel savings, the National Research Council report on medium and heavy duty trucks simplifies the cost benefit analysis by focusing on the cost side and not making assumptions about fuel prices (See Exhibit III-3). Instead of engaging in the uncertain and sometimes contentious exercise of projecting fuel costs over long periods, the National Research Council estimates the price per gallon that would be necessary to break even on an investment that incorporates technologies to reduce fuel consumption in medium and heavy duty trucks. NRC includes a discount rate, representing the time value of money, set at 7% to compare the estimated costs of saved fuel to projections for the future cost of fuel.20
As shown in Exhibit III-4, the NRC estimated that fuel prices would have to be just $1.09 per gallon for a very large investment in new technology to earn a 7% real rate of return. As actual fuel prices are currently over three times this amount and expected to rise over time, the payout from these technologies would far exceed their cost.
EXHIBIT III-4: BREAK-EVEN ANALYSIS FOR CLASS 8 TRUCKS
Sources: Northeast States Center for a Clear Air Future, International Council on Clean Transportation and Southwest Research Institute, Reducing Heavy Duty Long Haul Combination Truck Fuel Consumption and CO2 Emissions, October 2009; Don Air, Delivering Jobs: The Economic Costs and Benefits of Improving the Fuel Economy of Heavy-Duty Vehicles, Union of Concerned Scientists, May 2010; Committee to Assess Fuel Economy for Medium and Heavy Duty Vehicles, Technologies and Approaches to Reducing the Fuel Consumption of Medium- and Heavy-Duty Vehicles, National Research Council, 2010; Go 60 MPG, Delivering the Goods: Saving Oil and Cutting Pollution from Heavy Duty Trucks. A. Sidddiq Khan and Therese Langer, 2011, Heavy Duty Vehicle Fuel Efficiency and Greenhouse Gas Emissions: The 2014-2019 Standards and a Pathway to the Next Phase, American Council for an Energy Efficient Economy, December, 2011.
In Exhibit III-4, we have also converted the results of several other recent studies to this
break-even approach. While there are some differences among these studies, there is a clear consensus that large investments in increasing the fuel economy of medium and heavy duty trucks are very attractive. All but one of the analyses show that investments in technology to improve fuel economy would earn more than the 7% discount rate at diesel prices of $2 and substantially more at
20 The discount rate also refers to the interest rate used in discounted cash flow (DCF) analysis to determine the present
value of future cash flows… takes into account not just the time value of money, but also the risk or uncertainty of future cash flows; investopedia.com/terms/d/discountrate.asp

14
$0.00
$0.50
$1.00
$1.50
$2.00
$2.50
$3.00
$3.50
$4.00
$4.50
$5.00
2010 2015 2020 2025 2030 2035
Per Gallon (2011$)
higher gas prices. Assuming a ten year truck life, the Peterbilt example yields a cost per gallon saved of $1.30
EIA’s projected fuel prices over the next quarter century will average close to $4.00 per gallon over the next quarter century, as shown in Exhibit III-5. With average diesel prices projected to be well above $4 per gallon over the next 25 years, the investment in energy saving technology would yield a very attractive return.
EXHIBIT III-5: DIESEL PRICES IN THE LONG TERM
Source: Energy Information Administration, Annual Energy Outlook, 2013.
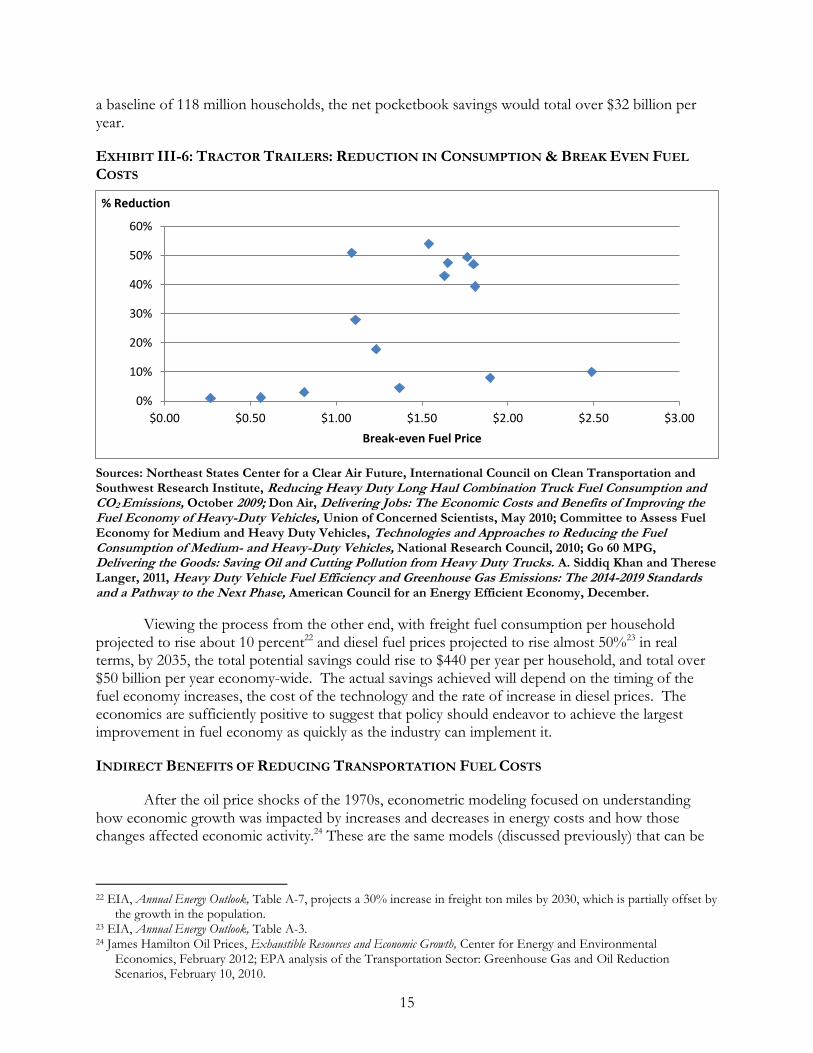
Exhibit III-6 shows the size of potential fuel savings compared to technology costs. It suggests that a goal of cutting tractor trailer fuel consumption in half is economical in the long run. In order to cut fuel consumption in half, one must double the fuel economy of the vehicle. This is exactly the target that was adopted for light duty vehicles in the 2025 CAFE rule. For example, if you reduce consumption by 50% the break even cost of fuel is $1.50, which means that as long as fuel is more than $1.50, the cost of technology will be a money saver.
CONSUMER BENEFITS OF REDUCING TRANSPORTATION FUEL COSTS
A long-term goal of cutting freight fuel consumption in half would substantially benefit consumer pocketbooks. With the cost of including technologies less than $2/gallon and the price of diesel at $4 gallon, approximately half of the savings in fuel costs ends up in the consumer’s pocket as a net savings.21
Since net pocketbook benefits (above and beyond the discount rate) would be one-half of the reduction in fuel consumption, which was one half of the baseline consumptions, net pocketbook benefits would be one-quarter of the baseline consumption. With a long term target of doubling fuel economy of medium and heavy duty trucks (i.e. cutting fuel consumption in half), the pocketbook savings would be very large. Given that we have estimated the baseline consumption at slightly over $1100 dollars, the net pocketbook savings would be $275 per year per household. With
21 Even after the interest rate is deducted and put in the bank, given that a 7% interest (discount) rate has been earned.
15
0%
10%
20%
30%
40%
50%
60%
$0.00 $0.50 $1.00 $1.50 $2.00 $2.50 $3.00
% Reduction
Break-even Fuel Price
a baseline of 118 million households, the net pocketbook savings would total over $32 billion per year.
EXHIBIT III-6: TRACTOR TRAILERS: REDUCTION IN CONSUMPTION & BREAK EVEN FUEL
COSTS
Sources: Northeast States Center for a Clear Air Future, International Council on Clean Transportation and Southwest Research Institute, Reducing Heavy Duty Long Haul Combination Truck Fuel Consumption and CO2 Emissions, October 2009; Don Air, Delivering Jobs: The Economic Costs and Benefits of Improving the Fuel Economy of Heavy-Duty Vehicles, Union of Concerned Scientists, May 2010; Committee to Assess Fuel Economy for Medium and Heavy Duty Vehicles, Technologies and Approaches to Reducing the Fuel Consumption of Medium- and Heavy-Duty Vehicles, National Research Council, 2010; Go 60 MPG, Delivering the Goods: Saving Oil and Cutting Pollution from Heavy Duty Trucks. A. Siddiq Khan and Therese Langer, 2011, Heavy Duty Vehicle Fuel Efficiency and Greenhouse Gas Emissions: The 2014-2019 Standards and a Pathway to the Next Phase, American Council for an Energy Efficient Economy, December.
Viewing the process from the other end, with freight fuel consumption per household projected to rise about 10 percent22 and diesel fuel prices projected to rise almost 50%23 in real terms, by 2035, the total potential savings could rise to $440 per year per household, and total over $50 billion per year economy-wide. The actual savings achieved will depend on the timing of the fuel economy increases, the cost of the technology and the rate of increase in diesel prices. The economics are sufficiently positive to suggest that policy should endeavor to achieve the largest improvement in fuel economy as quickly as the industry can implement it.
INDIRECT BENEFITS OF REDUCING TRANSPORTATION FUEL COSTS
After the oil price shocks of the 1970s, econometric modeling focused on understanding how economic growth was impacted by increases and decreases in energy costs and how those changes affected economic activity.24 These are the same models (discussed previously) that can be
22 EIA, Annual Energy Outlook, Table A-7, projects a 30% increase in freight ton miles by 2030, which is partially offset by
the growth in the population. 23 EIA, Annual Energy Outlook, Table A-3. 24 James Hamilton Oil Prices, Exhaustible Resources and Economic Growth, Center for Energy and Environmental
Economics, February 2012; EPA analysis of the Transportation Sector: Greenhouse Gas and Oil Reduction Scenarios, February 10, 2010.

16
used to explain how medium and heavy duty fuel costs are passed through to consumers. Energy costs are linked to overall economic activity for two main reasons:
First, the investment in consumption reducing technologies increases employment and economic output in the sector that produces the new technology. This effect can be seen in the previous Exhibit II-3. The multipliers in oil sector activity are much lower than most other activities. Shifting resources out of oil-related activities into other activities creates more economic growth. The impact is particularly large when imports are replaced because financial resources that go abroad to pay for imports go to nations with which the balance of trade is negative, resulting in a draining of resources. It is also large when there are energy savings in the transportation sector because of its central role as a factor of production in many sectors. Since energy accounts for such a large part of the transportation costs, the cost of transportation will be lowered significantly and demand for transportation services will increase disproportionately, triggering a larger multiplier for this sector.
Second, the resulting net savings for consumers gives them more discretionary income, which stimulates economic activity in other sectors. This effect flows from the fact that by lowering household expenditures broadly, consumers have more disposable income to spend.25 Since the goods and services purchased tend to have higher multipliers than the multipliers in the sector where consumption of services has been reduced (petroleum), the effect is magnified.
Given the role that transportation costs play in America’s economic structure, as well as the multiplier effects, it is no surprise that improvements in the fuel economy of medium and heavy duty trucks will have a large, positive effect on the economy. Due to the pass through nature of transportation fuel costs, these savings are a major reason why households will experience lower costs of goods. Applying an econometric model to the base case identified in Exhibit III-1, the Union of Concerned Scientists projects: 26
100 billion gallons of fuel savings with
net direct cost savings of $24 billion and
indirect economic benefits of a $10 billion increase in gross domestic product and 124,000 jobs.
This analysis suggests that indirect economic benefits are about two-fifths the size of the direct fuel cost savings, which adds substantially to the total net benefit and improves the cost benefit ratio substantially.
THE COSTS OF IMPLEMENTING STANDARDS
Another important consideration in estimating the net benefits of performance standards relates to how the estimate of the costs to meet the standard are calculated. The analysis often presented in regulatory proceedings is typically static and based on current costs. On the other hand, a thoughtful, well-designed performance standard will be dynamic and facilitate multiple responses to standard compliance rather than mandate specific technologies. If companies are given
25 Chapter 5: Regional Input-Output Multipliers, http://www.rri.wvu.edu/WebBook/Schaffer/chap05.html, “The
striking thing about the contrast of these two effects is the importance of the household in a regional economy. (The same relative pattern occurs in all regional models which I have encountered.)
26 Don Air, Delivering Jobs: The Economic Costs and Benefits of Improving the Fuel Economy of Heavy-Duty
Vehicles, Union of Concerned Scientists, May 2010.

17
0 1 2 3 4 5 6 7 8 9
10 11 12 13
Smal
l '8
2
Med
ium
'82
Larg
e '8
2
Smal
l '9
0
Med
ium
'90
Larg
e '9
0
Smal
l '8
2
Larg
e '8
2
19
82
19
95
19
90
19
75
LEV
I
TLEV
ULE
V I
19
96
T I
Ph
ase
2 R
VP
RFG
- 1
RFG
-1
Die
sel
Die
sel
Room AC Central AC Refrig Washer Café Fuel Controls
Rat
io o
f Es
tim
ate
d t
o A
ctu
al
Regulators
Industry
broad flexibility to meet standards, they will determine the most cost beneficial approach and they will learn how to lower the cost of adopting new technologies. History has shown in virtually every other standard compliance effort, the initial cost estimates always prove to have been too high, as shown in Exhibit III-7. There is clear and consistent evidence across a wide range of standards that the actual costs of implementing standards were consistently well below their original projections.
EXHIBIT III-7: RATIO OF ESTIMATED COST TO ACTUAL COST BY SOURCE
Sources: Winston Harrington, Richard Morgenstern and Peter Nelson, “On the Accuracy of Regulatory Cost Estimates,” Journal of Policy Analysis and Management 19(2) 2000, How Accurate are Regulatory Costs Estimates?, Resources for the Future, March 5, 2010; Winston Harrington, Grading Estimates of the Benefits and Costs of Federal Regulation: A Review of Reviews, Resources for the Future, 2006; Roland Hwang and Matt Peak, Innovation and Regulation in the Automobile Sector: Lessons Learned and Implications for California’s CO2 Standard, Natural Resources Defense Council, April 2006; Larry Dale, et Al., “Retrospective Evaluation of Appliance Price Trends,” Energy Policy 37, 2009.
Exhibit III-7, shows the systematic overestimation by regulators of the cost of efficiency improving regulations in consumer durables. The cost for household appliance regulations was overestimated by over 100 percent and the costs for automobile fuel standards were overestimated by about 50 percent. The estimates of the cost from industry were even farther off the mark, running three times higher for auto technologies.27 Broader studies of the cost of environmental regulation find a similar phenomenon, with overestimates of cost outnumbering underestimates by almost five to one with industry numbers being a “serious overestimate.”28
While the very high estimates of compliance costs offered by, for example, the auto manufacturers can be readily dismissed as self-interested political efforts to avoid regulation, they can also be seen as a worst case scenario in which the manufacturers take the most irrational approach to compliance under an assumption that there is no possibility of technological progress or strategic response.
27 Roland Hwang and Matt Peak, Innovation and Regulation in the Automobile Sector: Lessons Learned and
Implications for California’s CO2 Standard, Natural Resources Defense Council, April 2006; 28 Winston Harrington, Richard Morgenstern and Peter Nelson, 2000, “On the Accuracy of Regulatory Cost Estimates,”
Journal of Policy Analysis and Management 19(2), 2010, How Accurate Are Regulatory Costs Estimates? Resources for the Future, March 5; Winston Harrington, 2006, Grading Estimates of the Benefits and Costs of Federal Regulation: A Review of Reviews, Resources for the Future, 2006.
18
IV. ACHIEVING FUEL COST SAVINGS WITH EFFICIENCY STANDARDS
With such large potential economic gains available, two important question arise:
Why don’t market forces drive these technologies into the vehicles?
What policies can be implemented to achieve the economic gains?
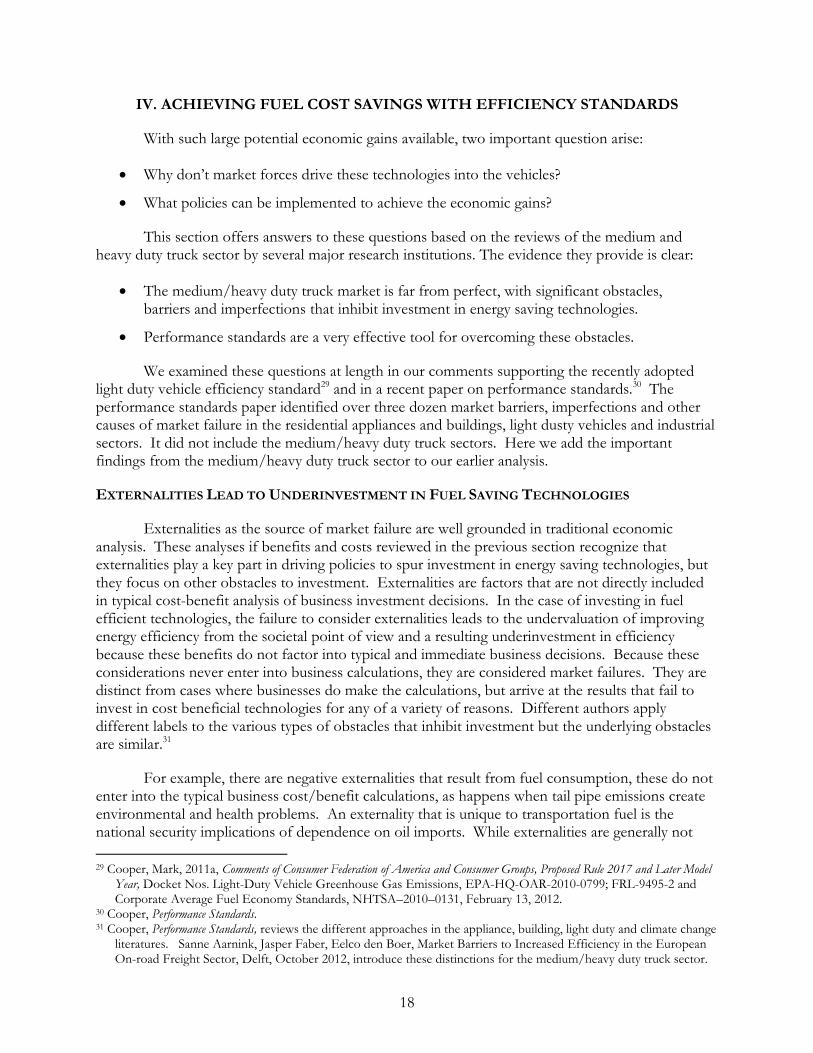
This section offers answers to these questions based on the reviews of the medium and heavy duty truck sector by several major research institutions. The evidence they provide is clear:
The medium/heavy duty truck market is far from perfect, with significant obstacles, barriers and imperfections that inhibit investment in energy saving technologies.
Performance standards are a very effective tool for overcoming these obstacles.
We examined these questions at length in our comments supporting the recently adopted light duty vehicle efficiency standard29 and in a recent paper on performance standards.30 The performance standards paper identified over three dozen market barriers, imperfections and other causes of market failure in the residential appliances and buildings, light dusty vehicles and industrial sectors. It did not include the medium/heavy duty truck sectors. Here we add the important findings from the medium/heavy duty truck sector to our earlier analysis.
EXTERNALITIES LEAD TO UNDERINVESTMENT IN FUEL SAVING TECHNOLOGIES
Externalities as the source of market failure are well grounded in traditional economic analysis. These analyses if benefits and costs reviewed in the previous section recognize that externalities play a key part in driving policies to spur investment in energy saving technologies, but they focus on other obstacles to investment. Externalities are factors that are not directly included in typical cost-benefit analysis of business investment decisions. In the case of investing in fuel efficient technologies, the failure to consider externalities leads to the undervaluation of improving energy efficiency from the societal point of view and a resulting underinvestment in efficiency because these benefits do not factor into typical and immediate business decisions. Because these considerations never enter into business calculations, they are considered market failures. They are distinct from cases where businesses do make the calculations, but arrive at the results that fail to invest in cost beneficial technologies for any of a variety of reasons. Different authors apply different labels to the various types of obstacles that inhibit investment but the underlying obstacles are similar.31
For example, there are negative externalities that result from fuel consumption, these do not enter into the typical business cost/benefit calculations, as happens when tail pipe emissions create environmental and health problems. An externality that is unique to transportation fuel is the national security implications of dependence on oil imports. While externalities are generally not
29 Cooper, Mark, 2011a, Comments of Consumer Federation of America and Consumer Groups, Proposed Rule 2017 and Later Model
Year, Docket Nos. Light-Duty Vehicle Greenhouse Gas Emissions, EPA-HQ-OAR-2010-0799; FRL-9495-2 and Corporate Average Fuel Economy Standards, NHTSA–2010–0131, February 13, 2012.
30 Cooper, Performance Standards. 31 Cooper, Performance Standards, reviews the different approaches in the appliance, building, light duty and climate change
literatures. Sanne Aarnink, Jasper Faber, Eelco den Boer, Market Barriers to Increased Efficiency in the European On-road Freight Sector, Delft, October 2012, introduce these distinctions for the medium/heavy duty truck sector.

19
factored into business decision making, from a societal perspective they can, and should, be an important factor in standard development.
While these negative externalities that are reduced by high fuel economy receive the most attention, our focus in the prior section was on positive economic externalities. Investment in energy efficiency creates benefits for the broad public for which the firm making the investment cannot charge. As a result, the indirect macroeconomic effects of energy efficiency do not enter into typical cost/benefit decisions about investing in energy efficient technologies. While transportation companies capture some of the benefits in increased demand for their services, each company captures, at best, only a small part of the broader economic stimulus that reducing fuel consumption would cause. Therefore, such a benefit would be absent in each company’s typical cost benefit analysis of fuel saving technology. This category of externalities has expanded recently well beyond the public goods aspect that was identified in traditional economic analysis to include information and learning, network effects and innovation process.
Similarly, U.S. consumption of transportation fuels is sufficiently large that a reduction in the quantity consumed has the effect of lowering the global (and therefore the national) price of crude oil. The public enjoys a large benefit, but the firms investing in efficiency receive only a small part of that total benefit because each individual firm receives a very small share of the total. This is called a consumption externality.32
Ironically, these positive economic externalities can create concerns from the energy and environmental points of view. When consumers use their savings from lower fuel costs to buy more goods and services they are likely to indirectly increase their use of energy. However, the increase in consumption due to this dynamic, called the ‘rebound effect,’ is much smaller than the direct reduction in energy consumption, so the net effect is to reduce overall energy consumption.33 From the point of view of consumer and macroeconomic analysis, “the rebound effect” represents a positive economic result for consumers. It means that consumer welfare is increasing. How consumers use their increased disposable income is of secondary importance to the fact that they have more income to spend on other goods and services. If the goal is to reduce energy consumption, one must subtract the rebound effect from the benefits column. But experience shows that the rebound effect erases only a fraction of the energy savings.34
In all of the economic analyses of efficiency presented above, only direct economic costs and benefits were included. No value was placed on environmental or national security benefits; however these are significant additional benefits. Even though we did not include externalities in the cost benefit calculation, we found that the benefits far exceeded the costs. EPA reached exactly the same conclusion. Since externalities cannot explain the failure of firms to invest in these attractive technologies, EPA shifts it attention to the other factors that inhibit investment.
32 Consumer Federation of America, et al., 2012, Comments on the Proposed Rule 2017 and Later Model Year Light-
Duty Vehicle Greenhouse Gas Emissions and Corporate Average Fuel Economy Standards, Docket Nos. EPA-HQ-OAR-2010-0799; FRL-9495-2, NHTSA–2010–0131, 2/13/12.
33 Barker, Terry, Paul Eakins and Tim Foxon, 2007, “The Macro-economic Rebound Effect in the UK Economy,” Energy Policy, 35; Cambridge Centre for Climate Mitigation Research, 2006, The Macro-economic Rebound Effect and the UK Economy, Cambridge Econometrics and Policy Studies Institute, May 15; Goldstein, David, Sierra Martines and Robin Roy, Are there Rebound Effects from Energy Efficiency? An Empirical Analysis, Internal Consistency and Solutions, Electric Policy.com.; Nadel, Steven, 2012, The Rebound Effect: Large or Small, American Council For An Energy Efficient Economy, August.; Bornstein, Severin, 2013, A Microeconomic Framework for Evaluating Energy Efficiency Rebound and Some Implications, Energy Institute at HAAS, May.
34 Cooper, Performance Standards.

20
MARKET OBSTACLES , BARRIERS AND IMPERFECTIONS INHIBITING INVESTMENT
Not surprisingly, given the strong evidence of many factors that inhibit efficiency in the other sectors demonstrated in our earlier analysis, we find strong support for similar factors in the medium and heavy duty truck sector. Exhibit IV-1 shows the results of the analysis of the obstacles to investment in efficiency in the medium/heavy duty truck sector prepared by four major independent institutions. It also identifies the major documents on which they rely. These studies support our findings in several important ways. In constructing this table we use the same criteria as we applied in the analysis of Performance Standards – including empirical studies or summaries of the empirical literature from the past ten years.
While some argue that there are no market barriers and imperfections to inhibit investment in energy saving technologies in the medium and heavy duty truck sector,35 the failure to make the previously cited investment in technologies, in spite of their clear benefits, indicates that there are significant inhibitors at work that have created an “efficiency gap.”
EPA identified six broad categories of factors that have been offered as explanations for the failure of the truck market to pursue investment opportunities in fuel saving technologies that appear to be cost effective. The other major analyses identify these obstacles and several more, adding a great deal of detail. The findings from the medium/heavy duty truck sector reinforce several of the key aspects of our earlier analysis.
The analysis involves commercial enterprises, which affirms the fact that economic motivation alone does not ensure optimum investment in efficiency.
Many of the same factors are confirmed as important obstacles to energy saving investment on both the supply and the demand sides of the market.
The supply and the demand sides interact and reinforce each other in a vicious circle. Policies that can break the circle are extremely attractive.
The diffusion of innovation unfolds as a process in which the early challenge is to provide reliable, verifiable information to trigger the diffusion process. Experience allows the sharing of information later in the process, which creates different challenges.
The Environmental Protection Agency and the National Highway Traffic Safety Administration (EPA/NHTSA) examined the evidence that these barriers affect the truck market and summarized their conclusion as follows.
On the other hand, the short payback period required by buyers of new trucks is a symptom that suggests some combination of uncertainty about future cost savings, transaction costs, and imperfectly functioning market. In addition, widespread uses of tractor-trailer combinations introduces the possibility that owners of trailers have weaker incentives than truck owners to adopt fuel-saving technology for their trailers…
35 Mark Cooper, Performance Standards, examines the arguments in detail.

21
Exhibit IV-1: Performance Standard and Market Barriers to Efficiency in the Medium and Heavy Duty Truck Sector (Based on empirical analysis within the past 10 years)
Nature of the Barrier Effect on the Market Impact of the Standard Information Issues in the first sale market* Inadequate or unreliable information Better information more readily available Unavailable due to public good nature about fuel saving technologies Public provision of information Complexity due to geography, driving styles, uses* Cost of gathering Cost of “redundant” production of Information
Information Issues in the Secondary Market Resale value inadequately rewards Better information more readily available Compounded information problem fuel saving technology
Complexity due to geography, driving styles, uses* Lack of incentive to invest in fuel economy Different uses may affect mileage in 1st sale market
Split Incentives* Owners emphasize different attributes Alters the incentives Owner-Operator* Information does not overcome Investment embedded in market Owner-Renter Coordination Problem Fosters coordination Tractor-Trailer Contract structure*
Shrouded Attribute Bundles of attributes maximize other Increased emphasis on shrouded attribute Lack of availability in bundles* characteristics --durability, maintenance Positional, “status” good costs
Market power Ability to choose operators, Investment embedded in market, lower risk dulls market signals
Uncertainty Savings are future, technology costs are Some market uncertainties removed Future savings, level and variance * current Investment embedded in market, lower risk Fuel price, performance, life, use, geography* Hidden costs*
Risk aversion, Option value Reliability
Adjustment & Transaction Costs Slows innovation Experience with technology accelerates Conservative approach to change, need to learn Resistance to capital expenditure innovation & evaluate technology Resistance to increased cost Levels the playing field for investment Accelerated fleet turnover Training costs
Financial* Crowds out investment in efficiency Levels the playing field for investment Limited Access to Capital* Short payback period due to under- Investment embedded in market, lower risk Short payback, First Cost Bias* compensation of initial investment Time lag for retrofit*

22
PRIMARY SOURCES: Bold = EPA-NHTSA, Greenhouse Gas Emissions Standards and Fuel Economy Standards for Medium and
Heavy Duty Engines and Vehicles, Federal Register 76(179), September 15, 2011, pp. 57315-57319. Italic = Committee to Asses Fuel Economy for Medium and Heavy Duty Vehicles, Technologies and
Approaches to Reducing the Fuel Consumption of Medium- and Heavy-Duty Vehicles, National Research Council, 2010.
Underlined = Mike Roeth, et al., Barriers to the Increased Adoption of Fuel Efficiency Technologies in the
North American On--‐Road Freight Sector Report for the International Council for Clean Transportation March 2013.
* = Sanne Aarnink, Jasper Faber, Eelco den Boer, Market Barriers to Increased Efficiency in the European On-road Freight Sector, Delft, October 2012. Other sources:
Carbon War Room, Road Transport: Unlocking Fuel--‐Saving Technologies in Trucking and Fleets, 2012.
Lisa M. Ellram and Susan L. Golicic. Environmentally Sustainable Transport, Executive summary, 2011.
Jasper Faber, et al., Technical support for European action to reducing Greenhouse Gas Emissions from international maritime transport, CE Delft, 2009.
Goodyear Dunlop, Driving fleet fuel efficiency – the road to 2020, Diegem (Belgium), 2012.
Corina Klessmann, et al. 2007, Making energy-efficiency happen: from potential to realization. An assessment of policies and measures in G8 plus 5 countries, with recommendations for decision makers at national and international level, Utrecht : Ecofys, 2007.
Heikki Liimatainen, et al., “Energy Efficiency Practices Among Road Freight Haulers,” Energy Policy, 2012 50.
Gunter Prockl, Henrik Sternberg and Jan Holmstrom, “ICT in Road Transport Operations: Analyzing Potential Effects on Individual Activity Level.” In Logistics and Supply Chain Management in A High North Perspective: The 23rd Annual NOFOMA Conference Proceedings June 9-10, 2011.
Greater Than, Analysis of the European road freight market: Business models and driving forces influencing its carbon footprint Stockholm: Greater Than AB, 2011.
Patrik Thollander, Jenny. Palm and Patrik, “Categorizing barriers to energy efficiency: An interdisciplinary perspective,” In: Energy Efficiency, Edited by Jenny Palm, S.L. : Sciyo, 2010
David Vernon and Alan Meier, “Identification And Quantification Of Principal--‐Agent Problem Affect Energy Efficiency Investments And Use Decisions In the Trucking Industry.” Energy Policy, 2012, 49.
Haifeng Wang, et al., Marginal Abatement Costs and Cost Effectiveness of Energy-Efficiency Measures, London : International Maritime Organization (IMO), 2010.

23
[B]ecause individual results of new technologies vary, new truck purchasers may find it difficult to identify or verify the effects of fuel saving technologies. Those who are risk averse are likely to avoid new technologies out of a concern over the possibility of inadequate returns on the investment, or with other impacts….
Both baselines used project substantially less adoption than the agencies consider to be cost-effective. The agencies will continue to explore reasons for this slow adoption of cost-effective technologies.36
The report from the International Council on Clean Transportation summarized the supply-and demand side factors that inhibit innovation with a simple graph that depicts a recursive loop of factors that reinforce one another, as shown in Exhibit IV-2.
EXHIBIT IV-2: INTERACTION OF SUPPLY AND DEMAND SIDE FACTORS IN A RECURSIVE
LOOP INHIBITING INVESTMENT IN EFFICIENCY
Lack of Credible Information
Slowed Technology Development and Deployment
Source: Mike Roeth, et al., Barriers to the Increased Adoption of Fuel Efficiency Technologies in the North
American On--‐Road Freight Sector Report for the International Council for Clean Transportation March 2013, p. 5
Given the thorough review by EPA/NHTSA, the NRC, and the International Council for Clean Transportation, as well as our own, suffice it to say that there is a significant energy efficiency gap in the medium and heavy duty truck market and there is no reason to doubt the economic analysis of the potential benefits of closing that gap. In fact, the benefits have likely been underestimated, not only because the full value of externalities has not been included in the economic analyses, but also because the costs of implementing the standards have likely been overestimated, as discussed above.
PERFORMANCE STANDARDS AS A POLICY TOOL TO OVERCOME OBSTACLES TO INVESTMENT
These reviews of the literature on obstacles investment in efficiency in the medium/heavy duty truck sector also identify and discuss the ways that performance standards can improve the market performance. The regulatory analyses are required to consider alternatives. They do not conclude that the alternatives (like simple information programs) will have no impact, but that the
36 EPA-NHTSA, Greenhouse Gas Emissions Standards and Fuel Economy Standards for Medium and Heavy Duty
Engines and Vehicles, Federal Register 76(179), September 15, 2011, p. 57319
Uncertain Payback Time
Lack of Access To Capital
Insufficient Reliability
Lack of Technology Availability

24
alternatives do not address key obstacles effectively. As we showed in our Performance Standards paper, standards are attractive because they effectively address a wide range of obstacles. As shown in Exhibit IV-1, in the medium/heavy duty truck sector these beneficial effects include the following:
Partially internalize the externalities
Provides experience with the new technologies, lowering hidden costs.
Creates the market by embedding the technology in products, thereby lowering marketplace and first mover risk
Triggers learning and economies of scale that lower cost
Generates and makes available reliable information in a standardized manner
Fosters cooperation, as the efficiency attribute is giver higher visibility
We believe that one of the other major findings of our earlier analysis of fuel economy and performance standards applies in the medium/heavy duty truck sector as well. In order to effectively achieve the large net benefits, performance standards must be well-designed and carefully implemented. The following characteristics, which were critical for the success in the adoption of fuel economy standards for automobiles and light duty trucks, can successfully guide the development of performance for medium and heavy duty trucks:
Long-Term: Setting a progressively rising standard that targets a high long term goal over the course of a decade or more will foster and support a long-term perspective for the truck manufacturers, transportation companies and public, by reducing the marketplace risk of investing in new technologies. The long-term view gives the truckmakers time to re-orient their thinking, retool their plants and help re-educate the transportation industry. It also gives the industry buying and using these trucks time to adjust.
Technology Neutral: Taking a technology neutral approach to a long term standard unleashes competition around the standard that ensures that the industry will get a wide range of choices at that lowest cost possible.
Product Neutral: The new attribute-based approach to standards accommodates buyer preferences; it does not try to supplant them. This levels the playing field between truck makers and removes any pressure to push inappropriate vehicles into the market.
Responsive to industry needs: As was done in the light vehicle standards, establishing a long term performance standard recognizes the need to keep the standards in touch with reality. The standards can be set at a moderately aggressive level that is clearly beneficial and achievable. With thoughtful cost estimates, consistent with the results of independent analyses of technology costs, a long term performance standard will contribute to the significant reduction of the most significant cost in the transportation industry.
Responsive to market needs: Setting standards that are market-friendly facilitates compliance. The attribute-based approach ensures that the standards do not require radical changes in the types or size of vehicles the industry needs; so, the full range of choices will be available to the market. The setting of a coordinated national standard that lays out a steady rate of increase over a long time period giving the market and the industry certainty and time to adapt to change. These

25
characteristics make standards pro-competitive. Truck makers have strong incentives to compete around the standard to achieve them in the least cost manner, while targeting the market segments they prefer to serve.
CONCLUSION
This analysis has made the case for the consumer benefits (and resulting consumer support) for higher fuel economy standards for medium and heavy duty trucks. We have shown that the amount that the industry spends on truck fuel is substantial and those fuel costs are passed to consumers. We have also shown that technologies to reduce the energy consumption of medium and heavy duty trucks would cut fuel consumption dramatically over the next decade. The cost of the energy saving technologies will be more than be recouped in lower fuel costs. The net benefit would ramp up to over $400 per year, per household, and add up total $50 billion dollars per year. Moreover, macroeconomic benefits would add another $20 billion to the benefit column.
A number of barriers and imperfections in the medium and heavy duty truck market have inhibited investment in fuel saving technologies in the past and are likely to continue to do so. As such, fuel economy standards are an effective tool for overcoming those market barriers and imperfections and delivering the savings to the transportation industry, consumers, and the economy.