payments evolution from paper to electronic: bill payments
TRANSCRIPT

No. 21-5
Payments Evolution from Paper to Electronic: Bill Payments and Purchases
Joanna Stavins
Abstract: Consumer payments in the United States gradually have been shifting away from paper checks for the past several years. Cash use has declined as well, although at a much slower pace. As the number of check payments has decreased, those payments have been replaced with electronic and card payments. However, the transition from paper to electronic and card payments for bills has not proceeded in the same way as the transition for purchases. Using detailed consumer survey panel data collected over nine years, we track the same respondents over time and find that consumers who reduced their check or cash use for bill payments in a given year were more likely to reduce their check or cash use for purchases in the following year; but a reduction in check or cash use for purchases was not followed by the use of fewer checks or less cash for bill payments. The results suggest that a change in bill payment behavior may be a precursor to payment behavior changes in general. These results may help predict changes in payment instrument use for various transaction types as new payment methods, such as faster payments or central bank digital currency, become available to consumers in the future. JEL Classifications: D12, D14, D15 Keywords: consumer payments, check, cards, electronic payments Joanna Stavins is a senior economist and policy advisor in the Research Department of the Federal Reserve Bank of Boston. Her email is [email protected]. José Fillat, Joe Peek, and Oz Shy provided helpful comments, and Ruth Cohen and Liang Zhang provided excellent research assistance. This paper presents preliminary analysis and results intended to stimulate discussion and critical comment. The views expressed herein are those of the author and do not indicate concurrence by the Federal Reserve Bank of Boston, the principals of the Board of Governors, or the Federal Reserve System. This paper, which may be revised, is available on the website of the Federal Reserve Bank of Boston at https://www.bostonfed.org/publications/research-department-working-paper.aspx. This version: April 2021 https://doi.org/10.29412/res.wp.2021.05

1
I. Introduction Paper check use in the United States has declined over the past several years, both for
paying bills and for making purchases. There is some evidence that replacing the remaining
paper checks with electronic payments would lower transaction costs. For example, Álvez et al.
(2020) summarize the literature estimating the cost of various payment methods in several
countries and show that checks are more expensive to process than electronic payments.
Although there are no reliable recent estimates of the cost of check processing in the United
States, there is some evidence that checks might be the most expensive payment method in this
country (Garcia-Swartz et al. 2006) and in other countries (Stewart et al. 2014). While the
transition to electronic processing of checks in the United States following the implementation of
the Check Clearing for the 21st Century Act (Check 21) in 2004 lowered those processing costs
(Humphrey and Hunt 2013), maintaining the check processing infrastructure remains costly.
High cost is only one reason why consumer payments have been shifting away from
paper checks. Consumer payment choice is affected by several factors, both on the supply side
and on the demand side (Stavins 2017). Convenience, budgeting, and acceptance are some of the
other payment instrument attributes consumers value, and consumer preferences are highly
heterogenous (Schuh and Stavins 2010). Even if consumers opt to shift away from checks,
merchants may prefer to accept checks rather than credit and debit cards, for which merchants
are charged high processing fees (Felt et al. 2020). Despite the overall high cost of check
processing, the direct cost to individual consumers writing a check or to small businesses
accepting a check might be lower than the cost of alternative payment methods. In addition to
consumer choice, an array of market forces influence payment evolution, including the provider
market structure and regulatory changes (Rosenbaum et al. 2017).
Based on data from the Federal Reserve Payments Study (FRPS), the total number of
check payments in the United States decreased 8.2 percent per year on average from 2015
through 2018 (FRPS 2020). From 2000 through 2018, the total number of checks, including
those paid by businesses and government, plummeted from 42.6 billion to 14 billion, a 67
percent drop. During the same time period, the number of checks written by consumers fell from
19.3 billion to 7.1 billion, a 63 percent drop (FRPS; Figure 1). Despite the decline in check use
over the past several years, the United States still has the largest number of checks as a share of

2
noncash payments in the world, according to a comparison of check use among 22 countries
conducted by the Bank for International Settlements (BIS) in 2019 (Figure 2).
The number of cash payments in the United States also has decreased in recent years, but
only slightly; the decline in cash use has not been nearly as large as the decline in check use. In
fact, along with credit and debit cards, cash has been one of the top three payment instruments
for consumers every year since at least 2008 (Foster et al. 2020). This is according to the Survey
of Consumer Payment Choice (SCPC), a representative survey of US adults conducted annually
by the Federal Reserve Banks of Boston and Atlanta that was initiated in 2008.
Most of the studies analyzing changes in the use of consumer payment methods over time
rely on aggregate data. However, consumers have been shown to vary in terms of their payment
behavior. For example, in one of the few papers analyzing the use of payment methods by
demographic groups, Greene et al. (2020) use data from the 2017 and 2018 Diary of Consumer
Payment Choice (DCPC)2 and find that older, lower-income, or non-minority consumers are
significantly more likely to pay with paper checks. Given such cross-sectional heterogeneity, it is
reasonable to expect that the evolution from paper to electronic payments also would proceed
differently across consumers.
In particular, consumers might change their payment behavior for bills and their behavior
for purchases at different rates. Although there is evidence that check use has declined over time,
there is little analysis in the literature of how changes in check use for bill payments and
purchases relate to each other. This paper addresses the relationship between the evolution of bill
payments and purchases. We use detailed survey data on consumer payment behavior over nine
years to track individual consumers over time. Who shifted away from paper checks, and what
did they substitute for checks? Did consumers reduce their check use for bills and then reduce it
for purchases, or vice versa? Understanding which type of transactions has led the evolution
from paper to electronic payments can help researchers and policymakers predict future changes,
such as a potential transition to faster payments or to central bank digital currency when those
payment options become available to consumers.
2 The Diary of Consumer Payment Choice (DCPC) is a complementary survey to the SCPC filled out by the same set of respondents. In the DCPC, consumers record details of specific transactions (including dollar values) and their payment choices during a designated three-day period.

3
Consumers have multiple alternatives to checks for both types of transactions—they can
pay bills automatically or online, and they can make purchases with a card, in person or
remotely. While those options enable the transition away from check use, heterogeneous
preferences and other differences among consumers generate disparities in their payment
patterns.
The remainder of the paper is as follows. Section II describes the data used in the paper.
Section III analyzes changes in payment instrument use by consumers over time for bill
payments and purchases, with an emphasis on the decline in check and cash use. Section IV
employs panel data regressions to estimate the effect of individual consumers’ attributes on the
use of payment instruments. Section V tests whether changes in bill payments influence changes
in purchases or vice versa. Section VI examines geographic network effects on consumer
payment behavior, and Section VII concludes.
II. Data We use data from the Survey of Consumer Payment Choice (SCPC), which collects detailed
information on consumer payment behavior, including adoption and use of payment instruments,
bank account ownership, and cash holdings and withdrawals. It also collects consumer
assessments of payment characteristics and a rich set of consumer and household demographic
characteristics. Payment behavior includes adoption and use of the following payment
instruments: cash, check, money order, credit card, debit card, prepaid card, and electronic
payments out of a bank account (online banking bill pay [OBBP] and bank account number
payment [BANP]). Respondents report their payment behavior in a typical month, including
retail transactions for goods and services (both in person and online), bill payments, and person-
to-person transactions. For more details on the SCPC and its design, see Schuh and Stavins
(2014).
The SCPC was conducted using the RAND Corporation’s American Life Panel (ALP)
from 2008 through 2014. Since 2015, it has been conducted using the Understanding America
Study (UAS), managed by the University of Southern California (USC) Dornsife Center for
Economic and Social Research (CESR). Both panels are nationally representative of US
consumers. Because the survey vendor changed, the sample changed after 2014. Starting in

4
2015, most of the respondents appear in the panel data for two or more consecutive years. Table
1 shows the number of respondents in each year, as well as the number of respondents who were
also in the sample in the preceding year. For example, of the 3,153 respondents to the 2018
SCPC, 2,573 also took the 2017 survey (2,284 of them took both the 2016 and 2017 SCPC). For
more details on recent survey data, see Foster et al. (2019), and for details on the methodology,
see Angrisani et al. (2018).
Even though the SCPC data have been collected since 2008, the sample from that first
year was very small, and one of the questions about the characteristics of payment instruments
was added in 2010. Therefore, we include all the data in the summary statistics below but
exclude the first two years of the survey from the regression analysis and use a panel of nine
consecutive years of data, from 2010 through 2018.
III. Payment instrument use over time In this section, we show changes in payment use for purchases and for bill payments by
individual consumers to examine which payment methods replaced checks and which replaced
cash for each type of transaction. The share of payments using instrument j in year t is calculated
as the average of individual shares across all consumers:
1
tN
ijti
jtt
sS
N==∑
, where ijtijt
it
Ns
N= , (1)
where tN = number of consumers in year t, j = payment instrument, i = consumer, ijtN =
number of payments by consumer i using instrument j in year t, itN =number of payments by
consumer i in year t using all instruments ( it ijtj
N N= ∑ ), and ijts = share of consumer i’s
transactions conducted using payment instrument j in year t.
Table 2 shows the shares of transactions conducted with each payment instrument in each
year, averaged across all consumers. The top panel of the table shows the average shares for all
transactions (bills and purchases), while the bottom panel shows the average shares for bill
payments. The average share of all transactions paid with checks dropped from 18 percent in
2008 to 5 percent in 2018. The average share of bills paid with checks fell from 30 percent in
2008 to 10 percent in 2018. The share of bills paid with checks was higher than the share of

5
purchases paid with checks, but the check share decreased faster for purchases than for bills: The
share of check use for all bill payments dropped by two-thirds, while the overall check-use share
dropped by almost three-quarters during the sample period. Checks continued to be used
predominantly for paying bills: In 2018, 54 percent of checks were used to pay bills and 46
percent were used to make retail purchases (in person and online).
The drop in the check-use share for bill payments was offset by an increase in the shares
of a few other payment instruments: the share of BANP for bill payments increased from 14
percent in 2009 to 22 percent in 2018; the share of payments by credit card rose from 12 percent
in 2008 to 16 percent in 2018, and the share of payments by debit card increased from 19 percent
in 2008 to 23 percent in 2018.
IV. Individual consumers’ changes in payment use Although check use declined over time for all consumers, the change was not uniform across age
cohorts. Check use declined more for older and middle-aged consumers, while it remained low
and relatively steady for the youngest (under 25) and second youngest (25 to 34) age groups
(Figure 3). The order across age cohorts did not change throughout the period: Check use
remained highest for the oldest group (65 and older) and lowest for the youngest group, but the
dispersion among age cohorts diminished substantially. The decline was more uniform across
income and education cohorts (Figure 4 and Figure 5).
Changes in the rate at which checks were used for bill payments reflect the changes in
total check use. Both for bills and for all transactions (bills and purchases combined), the oldest
consumers experienced the biggest drop in check-use share, but their share remained greater than
the check-use share of any other age group (Figure 6).
1. Model of consumer payment use
The high rate of check use by the oldest consumers could indicate that as consumers age,
they start using checks more extensively. Alternatively—and more likely—a particular cohort of
consumers might use checks more extensively throughout their lifespan, and we observe them in
the data when they are 65 years old or older. Payment habits are persistent, and adopting new
technology is costly. The older generation of consumers had fewer options when they developed
their payment habits (cash and checks), and therefore it might take them longer to switch to other

6
instruments. Younger generations enter the financial markets having more choices, and they can
start with the most convenient method of payment because they do not have to bear switching
costs. Thus 65-year-old consumers at the beginning of the sample period might have payment
habits that are different from those of 65-year-old consumers at the end of the sample period.
Having access to almost a decade of data allows us to separate the effect of a consumer’s
age from the effect of calendar years on the use of each payment method. Using panel data on
individual US consumers’ payment behavior from 2010 through 2018 and controlling for
demographic and income attributes of every consumer, we estimate how the use of each payment
instrument changed over time. To estimate the effect of time, we include dummy variables for
each year of the sample.
We regress the share of payment instrument j for consumer i in year t, ijts , on
demographic attributes, income, characteristics of payment instruments, and year dummies. We
estimate the share of all payments, bills, and purchases separately. Coefficients on the year
dummies are then used to calculate the average annual change in shares over time, controlling for
demographics and income of individual consumers.
( , , , , )ijt it it ijt t ijts s DEM INC CHAR YEAR ε= , (2)
where ijts is a share of payment instrument j for consumer i in year t, itDEM is a vector of
demographic attributes for consumer i in year t (age or birth year cohort, education, race,
gender), itINC is a set of income and financial variables for consumer i in year t (income,
employment status, homeownership), ijtCHAR is a vector of characteristics of payment
instrument j for consumer i in year t (cost, convenience, record keeping, and security), tYEAR is
a set of year dummy variables (t = 2010, … , 2018; 2014 omitted as the reference year), and ijtε
is an error term. Including state fixed effects in the regression does not affect the results
significantly. Because the state of residence variable is not available for all the years of the
survey, we do not include those fixed effects in the final specification shown here.

7
To test whether the age effects differ from the generation effects, we estimate three
different specifications: one with age and age squared, one with a set of dummy variables for age
cohorts, and one with a set of dummy variables for each decade-long birth year cohort.3
Previous studies find that payment instrument characteristics are significant in estimating
consumer payment behavior, even when controlling for demographic and financial attributes of
each consumer (Schuh and Stavins 2010, 2013). Previous studies also find that the explanatory
power of characteristics (assessments) of payment instruments exceeds the explanatory power of
demographic attributes. The payment method characteristics in our model are:
{ }, , ,CHAR COST CONVENIENCE RECORD KEEPING SECURITY= .
Consumers assess each of these characteristics for each payment method and rate it on a
1–5 scale. We are interested in consumers’ rating of each payment instrument j relative to all the
other payment instruments j’. Therefore, for each characteristic k, we use log relative
characteristics as explanatory variables,
( , ) log kijki
kij
CHARRCHAR j j
CHAR ′
′ ≡
,
where k indexes the characteristic’s cost, convenience, record keeping, and security; i indexes the
consumer; and j is the payment instrument. In principle, all of the relative characteristics could
influence a consumer’s choice of any payment instrument. However, to facilitate the
interpretation of the marginal effects of the characteristics on payment instrument use, we
construct the average relative characteristic for each payment characteristic,
𝑅𝑅𝑅𝑅𝑅𝑅𝑅𝑅𝑅𝑅����������𝑘𝑘𝑘𝑘(𝑗𝑗) = 1𝐽𝐽∑ 𝑅𝑅𝑅𝑅𝑅𝑅𝑅𝑅𝑅𝑅𝑘𝑘𝑘𝑘(𝑗𝑗, 𝑗𝑗′)𝐽𝐽−1𝑗𝑗′≠𝑗𝑗 ,
where J = all of the payment instruments. For example, RCHAR for cost in the check-use
equation is the average of the log ratios of the cost of the check use to the cost of each of the
other payment instruments. It measures how a consumer evaluates the cost of using checks
relative to the cost of all of the other payment methods. There is substantial variation in the
relative characteristics across consumers. Security and convenience have especially large
3 Because our panel is not balanced, we cannot follow each individual over the nine-year span of the data.

8
variation, indicating that these numerical measures are subjective to some extent. We expect the
coefficients on all of the average relative characteristics to be positive, because a greater
numerical value of CHAR indicates a more positive assessment by a consumer, and we assume
that consumers value all of the characteristics.
2. Results
Table 3a shows the results of the panel data regressions for each payment instrument with age
cohorts, while Table 3b shows the results with birth year cohorts. Table 4 shows the average
year-to-year changes in individual consumers’ shares for each payment instrument, calculated
from the year dummy coefficients estimated in equation (2) and shown in Table 3a. Although our
focus is on the evolution of check use, the use of other payment instruments changed over time
as well.
Year effects: After controlling for age, other demographics, and income, we find that the average
share of check payments decreased every year, with statistically significant drops from the years
2010 to 2014, from 2016 to 2017, and from 2017 to 2018. It also decreased from 2014 to 2015
and from 2015 to 2016, although the coefficients for those two declines are not statistically
significant. The annual decrease ranges from 0.3 percentage point in 2018 to 1.4 percentage
points in 2011. Cash use declined as well: After we control for demographics and income, the
share of cash payments dropped significantly every year except for 2015 and 2017, with the
decreases ranging from 0.1 to 2.4 percentage points. The drop in the shares of cash use and check
use was offset by an increase in the shares of the use of debit cards (in 2011, 2013, 2014, 2016,
and 2018), prepaid cards (in 2016, 2017, and 2018), credit cards (in 2013 and 2014), and BANP
(in 2013 and 2018).
Age and generation effects: Regardless of whether we include age and age squared, age cohort,
or birth year cohort in the regression, the effect on check use is significant. All three
specifications indicate that older consumers use checks more extensively than younger
consumers do. Relative to the omitted category, consumers who were older (by age or by birth
year) used checks more, while consumers who were younger (by age or by birth year) used
checks less. In particular, consumers over 65 had a 4.3 percentage point higher check-share use
and those aged 55 to 64 had a 1.7 percentage point higher check-share use, on average, compared

9
with the omitted category of those aged 45 to 54. Consumers born before 1945 had a 7-
percentage point higher check-share use and those born between 1945 and 1954 had a 3.7
percentage point higher check-share use compared with the omitted category of those born
between 1965 and 1974. The generational effects are greater in magnitude than the age effects,
although because the cohorts are not lined up exactly, drawing such conclusions might be
misleading. It is possible that a longer time series would reveal even stronger generational effects
compared with the age effects. The results suggest that both generational effects and age effects
influence check use. Moreover, the year effects remain unchanged in each of the three
specifications when we control for either the age or birth year cohort.
Demographic and income effects: The regression results show that coefficients on demographic
and income attributes are highly significant and much greater in magnitude than the year effects,
reflecting the substantial heterogeneity across consumers in their use of payment methods.
Moreover, the significant differences across demographic and income cohorts persisted over time
despite the transition from paper payments to electronic and card payments. In particular, older,
less educated, lower income, Black, or unemployed consumers used cash more frequently than
their counterparts. Consumers who are lower income, white, employed, or homeowners used
more checks than their counterparts. Compared with consumers with a graduate school
education, consumers with less than a high school education or a high school education had a
cash-use share that was 17 percent higher and 7 percent higher, respectively. Unemployed
consumers had a 7.9 percent higher cash-use share than employed consumers, but a 2.1 percent
lower check-use share. Consumers with an annual household income of less than $25,000 had a
10 percent higher cash-use share and a 1 percent lower check-use share than consumers with an
annual household income of more than $100,000. Men had a 4.5 percent higher cash-use share
and a 0.9 percent lower check-use share compared with women.
Credit card use was strongly affected by education and income. Consumers with less than
a high school education or a high school education had a credit-card-use share that was 14.5
percent and 11.5 percent lower, respectively, compared with those who have a graduate school
education, controlling for income. Consumers in the lowest income cohort (less than $25,000
annually) had a credit-card-use share that was 9.5 percent lower than those in the highest income
cohort (more than $100,000 annually). Less educated consumers and lower income consumers
10
used debit cards more extensively than their counterparts. The lowest income consumers and
least educated consumers used prepaid cards more extensively, possibly reflecting the use of
prepaid cards for social benefit programs.
Employment and homeownership significantly affected payment method use, even when
we control for income and demographic attributes. Homeowners had higher shares of use of the
instruments used for paying bills—check, OBBP, and BANP—and lower shares of use of cash,
debit, and prepaid cards. Compared with employed consumers, unemployed consumers more
extensively used payment instruments that are not linked to a bank account—namely cash and
prepaid cards.
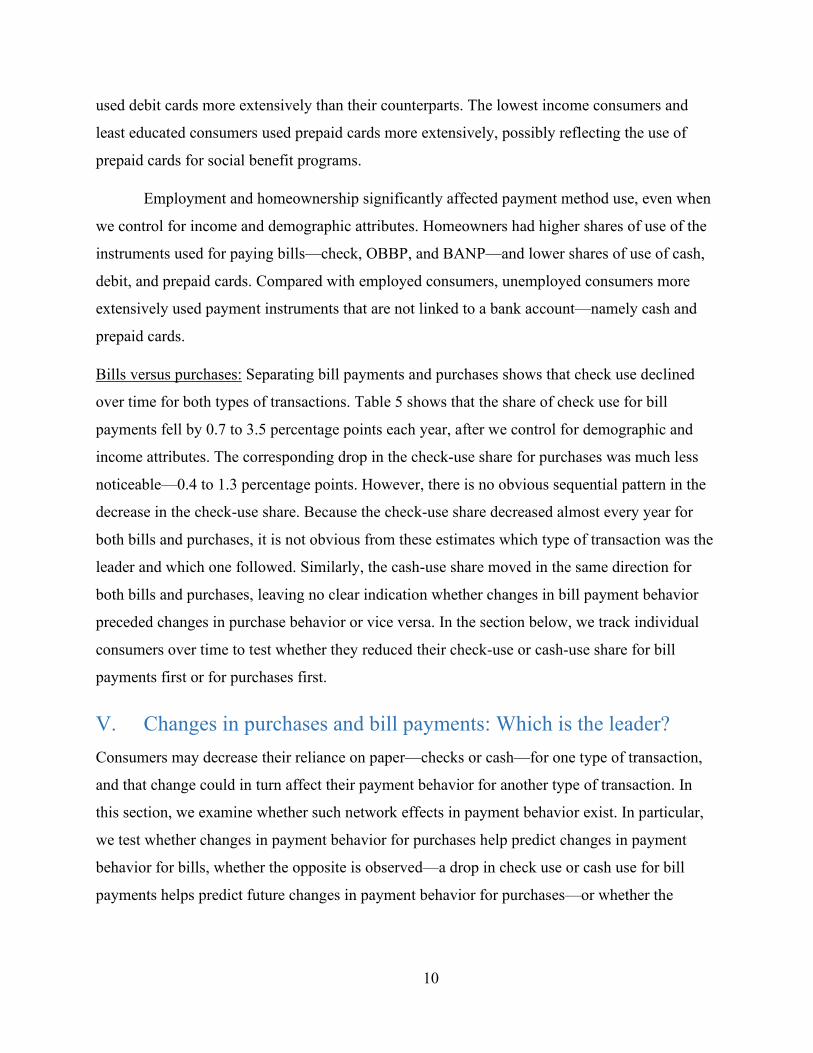
Bills versus purchases: Separating bill payments and purchases shows that check use declined
over time for both types of transactions. Table 5 shows that the share of check use for bill
payments fell by 0.7 to 3.5 percentage points each year, after we control for demographic and
income attributes. The corresponding drop in the check-use share for purchases was much less
noticeable—0.4 to 1.3 percentage points. However, there is no obvious sequential pattern in the
decrease in the check-use share. Because the check-use share decreased almost every year for
both bills and purchases, it is not obvious from these estimates which type of transaction was the
leader and which one followed. Similarly, the cash-use share moved in the same direction for
both bills and purchases, leaving no clear indication whether changes in bill payment behavior
preceded changes in purchase behavior or vice versa. In the section below, we track individual
consumers over time to test whether they reduced their check-use or cash-use share for bill
payments first or for purchases first.
V. Changes in purchases and bill payments: Which is the leader? Consumers may decrease their reliance on paper—checks or cash—for one type of transaction,
and that change could in turn affect their payment behavior for another type of transaction. In
this section, we examine whether such network effects in payment behavior exist. In particular,
we test whether changes in payment behavior for purchases help predict changes in payment
behavior for bills, whether the opposite is observed—a drop in check use or cash use for bill
payments helps predict future changes in payment behavior for purchases—or whether the

11
payment behaviors move independently of each other. Do consumers reduce their check use for
bills and follow with a similar change for purchases, or vice versa?
In addition to consumer preferences, the supply side may play an important role in
payment choice. For example, broader acceptance of electronic bill payments or of debit and
credit cards may induce a decline in the use of checks. Because the data do not allow us to
separate such supply-side effects from demand-side effects, shifts in payment behavior do not
imply causality. We limit this part of our analysis to three consecutive years: 2016, 2017, and
2018. Those years had the largest samples and the greatest number of respondents who remained
in the panel for consecutive years (Table 1). More than 80 percent of the respondents were in the
sample for two consecutive years, and almost three-fourths (2,284 respondents) stayed in the
sample for all three years.
Although many consumers reduced their check use or cash use from one year to the next,
a similar number increased their use of these payment instruments (see Table 6). However, the
magnitude of the declines differed: While the average drop in check use for bills was 15
percentage points in 2017 and 14 percentage points in 2018, the corresponding drop in check use
for purchases was only 9 and 10 percentage points, respectively. For cash, the average declines
in use for bill payments and use for purchases were very similar.
Table 7a shows demographic attributes and income for consumers who reduced their
check use or cash use from the years 2016 to 2017, and Table 7b shows the same statistics for
those who reduced their check use or cash use from 2017 to 2018. Although the decline in cash
use was more evenly distributed across income and demographic cohorts, especially from 2016
to 2017, the decline in check use was not: Older, more educated, or higher income consumers
were most likely to reduce their check use, both for bills and for purchases. In 2017, the youngest
consumers were most likely to decrease their cash use for both purchases and bill payments, and
the highest educated consumers were most likely to reduce their cash use for purchases. The
lowest income consumers were most likely to decrease their cash use for bill payments in both
years.
Do changes in bill payment behavior precede changes in purchase behavior, or vice
versa? We look at the consumers who reduced their check use for bills from 2016 to 2017 and
test whether that drop was followed by a decline in their use of checks for purchases the

12
following year. There is some (weak) evidence that bill payments led changes in consumers’
payment behavior: People who reduced their check use for bills one year decreased their use of
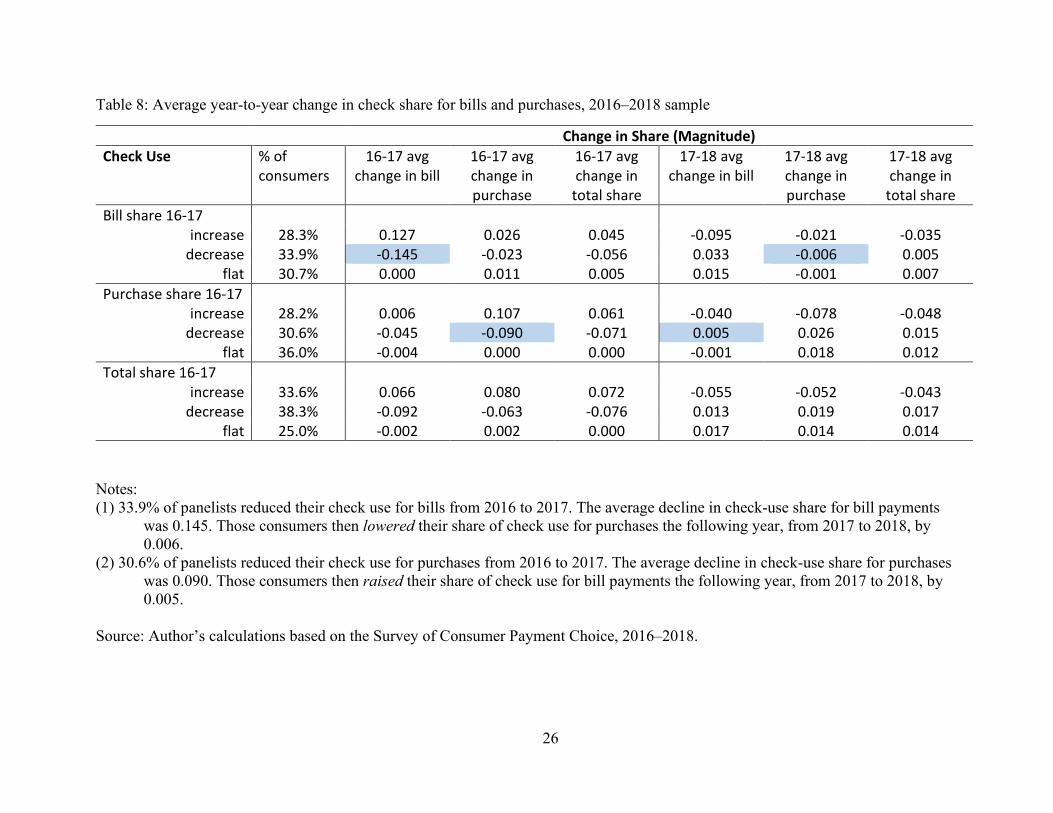
checks for purchases the following year. Table 8 shows that consumers who reduced their check
use for bill payments from 2016 to 2017 (33.9 percent of the sample) reduced their check-use
share by 14.5 percentage points on average. Those consumers then decreased their check use for
purchases in the following year, from 2017 to 2018, although by only 0.6 percentage point on
average. In contrast, consumers who reduced their check use for purchases from 2016 to 2017
(30.6 percent of the sample) increased their check use for bills the following year, albeit by only
0.5 percentage point on average. This indicates that bill payment behavior influences purchase
payment behavior, but not the other way around.
There is similar evidence regarding cash use (Table 9): Consumers who reduced their
cash-use share for bill payments from 2016 to 2017 (20.1 percent of the sample, with an average
drop in cash-use share of 20.7 percentage points), subsequently decreased their cash-use share
for purchases the following year, by 0.8 percentage point on average. Consumers who reduced
their cash-use share for purchases (44.1 percent of the sample, with an average drop in cash-use
share of 18.6 percentage points) increased their share of cash use for bill payments the following
year, by 1.2 percentage points on average.
Based on the panel of consumers who were in the sample for three consecutive years,
changes in bill payment behavior led to subsequent changes in purchase payment behavior.
Specifically, consumers who reduced their check use or cash use for bills decreased their check
use or cash use for purchases the following year.
VI. Geographic network effects 1. Cross-sectional geographic effects
We examine geographic areas to test whether consumers who use electronic bill payments more
extensively tend to cluster together. For example, there may be some cultural differences across
states that may be relevant for payment habits. Figure 7 shows the geographic distribution of
average shares of electronic bill payments by state. States that have the highest shares of bills
paid electronically tend to be either those with low density of population or smaller East Coast
states with a more educated or higher income population.

13
To test whether the frequency of use of electronic payments is correlated with population
density and/or with per capita income, we merge state-level per capita income and population
density measures with the SCPC data. Although per capita income and population density are
positively correlated with the average use of electronic payments for bills across states
(electronic bill payments as a share of all bill payments), the correlation coefficients are very
low: 0.04 for per capita income and 0.03 for population density. Thus, there is no evidence that
consumers living in states with higher average per capita income or higher population density
pay their bills electronically at a higher rate on average than consumers living in other states.
2. Intertemporal change in payment behavior
We continue our analysis of panelists who participated in the sample in three consecutive
years—from 2016 through 2018—to test whether the patterns observed at the individual
consumer level also exist at the state level. Intertemporal geographic analysis by state shows that
states that had higher average shares of bills paid electronically in 2016 had lower shares of
transactions made using paper instruments—cash and checks—the following year (Table 10, left
column). Correlation coefficients between the share of bills paid electronically in 2016 in a given
state and the share of check or cash payments in 2017 in that state were negative and ranged
from –0.15 to –0.48. The negative correlation was especially high for check-use shares,
indicating that paying bills electronically may induce a shift from checks for all types of
transactions, including purchases. Similarly, states that had higher shares of bills paid
electronically in 2017 had lower shares of cash and check payments in 2018, except for the share
of purchases paid with checks.
Looking at year-to-year changes in shares at a state level (Table 10, right column), states
that had a larger increase in the average share of bills paid electronically in a given year were
more likely to have a larger decline in the share of purchases paid with cash (in 2017) or with
checks (in 2018).
The connection at the state level is not very strong, but there is some indication that
changes in bill payment habits—shifting from paper payment instruments to electronic
payments—may be a leading indicator of changes in payment behavior in general, including
shifting away from paper payment instruments for purchases.

14
VII. Conclusion The evolution of consumer payments in the United States away from paper instruments—checks
and cash—has been documented for several years. The change has been especially pronounced
for the use of checks, which has declined significantly over the past two decades. This paper
analyzes the shift away from paper payment instruments for bills and purchases and shows some
evidence that bill payment behavior leads to changes in payment behavior in general, including
changes in purchases. Consumers who reduced their use of checks or cash for bills were more
likely to subsequently reduce their use of checks or cash for purchases, but not the other way
around.
Several factors affect consumers’ choice of payment instruments. Lack of acceptance of
electronic bill payments may be one obstacle preventing consumers from reducing their check
use even further. But in light of possible future developments in consumer payment choices, such
as the availability of new payment options including faster payments or central bank digital
currency, understanding which types of transactions consumers change first might help predict
future shifts from paper to electronic payments. Because checks are costly to process, facilitating
a faster transition from checks to electronic payments for bills might help disseminate that
transition to all types of transactions, including purchases.
This paper analyzes the evolution of consumer payments from paper to electronic during
the pre-pandemic period. Future research will extend the data to examine the effect of the
pandemic on the shift from paper to electronic payments and will analyze the heterogeneity
among merchant types.

15
References
Álvez, Marcelo, Rodrigo Lluberas, and Jorge Ponce. 2020. “The Cost of Using Cash and Checks in Uruguay.” Journal of Central Banking Theory and Practice 9(2): 109–129. https://doi.org/10.2478/jcbtp-2020-0016
Angrisani, Marco, Kevin Foster, and Marcin Hitczenko. 2018. “The 2016 and 2017 Surveys of Consumer Payment Choice: Technical Appendix.” Federal Reserve Bank of Atlanta Research Data Report No. 18-4.
Foster, Kevin, Claire Greene, and Joanna Stavins. 2019. “The 2018 Survey of Consumer Payment Choice: Summary Results.” Federal Reserve Bank of Atlanta Research Data Report No. 19-2.
Foster, Kevin, Claire Greene, and Joanna Stavins. 2020. “The 2019 Survey of Consumer Payment Choice: Summary Results.” Federal Reserve Bank of Atlanta Research Data Report No. 20-3.
The 2019 Federal Reserve Payments Study (FRPS). 2020. https://www.federalreserve.gov/paymentsystems/fr-payments-study.htm
Felt, Marie-Hélène, Fumiko Hayashi, Joanna Stavins, and Angelika Welte. 2020. “Distributional Effects of Payment Card Pricing and Merchant Cost Pass-through in the United States and Canada.” Federal Reserve Bank of Boston Working Paper No. 20-13.
Garcia-Swartz, Daniel D., Robert W. Hahn, and Anne Layne-Farrar. 2006. “The Move toward a Cashless Society: Calculating the Costs and Benefits.” Review of Network Economics 5(2): 1–30.
Greene, Claire, Marcin Hitczenko, Brian Prescott, and Oz Shy. 2020. “U.S. Consumers’ Use of Personal Checks: Evidence from a Diary Survey.” Federal Reserve Bank of Atlanta Research Data Report 20-1.
Humphrey, David B., and Robert Hunt. 2013. “Cost Savings from Check 21 Electronic Payment Legislation.” Journal of Money, Credit and Banking 45(7): 1415–1429.
Kosse, Anneke, Heng Chen, Marie-Hélène Felt, Valéry Dongmo Jiongo, Kerry Nield, and Angelika Welte. 2017. “The Costs of Point-of-Sale Payments in Canada.” Bank of Canada Staff Discussion Paper 2017-4.
Rosenbaum, Aaron, Garth Baughman, Mark Manuszak, Kylie Stewart, Fumiko Hayashi, and Joanna Stavins. 2017. “Faster Payments: Market Structure and Policy Considerations.” Finance and Economics Discussion Series 2017-100. Washington, DC: Board of Governors of the Federal Reserve System. https://doi.org/10.17016/FEDS.2017.100
Schuh, Scott, and Joanna Stavins. 2010. “Why Are (Some) Consumers (Finally) Writing Fewer Checks? The Role of Payment Characteristics.” Journal of Banking and Finance 34(8): 1745–1758.
Schuh, Scott, and Joanna Stavins. 2013. “How Consumers Pay: Adoption and Use of Payments.” Accounting and Finance Research 2(2): 1–21.

16
Schuh, Scott, and Joanna Stavins. 2014. “The 2011 and 2012 Surveys of Consumer Payment Choice.” 2014. Federal Reserve Bank of Boston Research Data Report No. 14-1.
Stavins, Joanna. 2017. “How Do Consumers Make Their Payment Choices?” Federal Reserve Bank of Boston Research Data Report No. 17-1.
Stewart, C., Chan, I., Ossolinski, C., Halperin, D., and Ryan, P. 2014. “The Evolution of Payment Costs in Australia.” Reserve Bank of Australia Research Discussion Papers No. 2014-14.

17
Table 1: Number of respondents and number of repeat respondents, by year
Year Number of Respondents Number of Respondents Who Participated in the
Previous Year 2010 2091 -- 2011 2124 1779 2012 2041 1893 2013 2071 1320 2014 1220 0 2015 1411 903 2016 3404 1050 2017 3099 2681 2018 3153 2573
Source: Survey of Consumer Payment Choice, various years.

18
Table 2: Average shares by payment instrument by year, percent of all transactions
2008 2009 2010 2011 2012 2013 2014 2015 2016 2017 2018 Share of All Transactions Cash 22.9 29.3 30.2 29.1 29.5 28.3 26.2 28.9 28.3 28.5 25.1 Check 17.6 14.0 11.5 10.8 10.2 9.8 7.8 7.1 7.4 6.1 5.4 Money order 1.3 2.0 1.4 1.2 1.4 1.2 1.1 0.8 1.0 1.1 1.2 Credit 19.6 15.6 16.7 17.3 18.0 19.0 18.5 19.7 19.4 21.2 22.0 Debit 27.3 26.4 27.2 28.5 28.1 28.7 33.0 30.0 30.0 29.3 30.2 Prepaid 0.6 1.6 1.3 1.3 1.5 1.6 1.6 1.8 2.5 2.9 3.5 OBBP 3.7 5.1 4.8 5.1 5.0 4.6 4.5 4.1 4.2 3.7 3.8 BANP -- 5.2 5.6 5.7 5.4 5.9 6.2 6.7 6.3 6.1 7.9 Income -- 0.8 1.2 1.1 0.9 1.0 1.2 0.9 1.0 1.0 0.9 Traveler's checks 0.0 0.0 0.0 0.0 0.0 0.0 0.0 0.0 0.0 0.0 -- Electronic bank account deduction (2008) 8.8 -- -- -- -- -- -- -- -- -- -- Share of Bills Cash 7.7 12.3 11.7 12.3 11.8 12.1 10.1 11.7 11.9 12.5 10.6 Check 29.8 22.7 21.4 19.0 17.4 16.5 13.8 12.5 13.0 10.8 9.8 Money order 2.3 3.9 2.7 1.8 2.6 2.0 2.4 1.7 1.6 1.7 1.5 Credit 12.2 10.1 11.4 13.1 13.5 14.9 13.9 14.7 14.8 16.2 15.9 Debit 18.6 18.4 19.9 21.1 22.6 22.8 24.4 24.8 23.5 23.3 23.1 Prepaid 0.2 0.9 0.9 1.0 1.2 1.1 1.3 1.6 2.3 3.1 3.3 OBBP 10.7 15.0 14.1 13.6 13.4 13.0 14.2 12.5 11.9 11.7 11.5 BANP -- 13.7 15.0 15.0 15.1 15.2 16.6 18.1 18.1 17.7 21.7 Income -- 2.9 2.9 3.1 2.4 2.5 3.2 2.5 2.9 3.0 2.6 Number of consumers participated 1000 2160 2091 2124 2041 2071 1220 1411 3404 3099 3153
Notes: sampling weights were applied to all statistics. The share of payments using instrument j is calculated as:
1
N
iji
j
sS
N==∑
, where ijij
i
Ns
N=
N =Number of consumers; j = Payment instrument; i = consumer; ijN = Number of payments by consumer i using instrument j ;
iN = Number of payments by consumer i using all instruments.

19
Table 3a: Payment instrument use regressions (share of all payments), age cohorts Cash Check Credit Debit BANP OBBP Prepaid
Under 25 0.009 -0.023 *** -0.005 0.042 *** -0.012 *** -0.015 *** -0.011 ***
25 - 34 -0.042 *** -0.017 *** 0.016 *** 0.034 *** -0.003 -0.013 *** 0.006 ***
Age 35-44 -0.022 *** -0.014 *** 0.008 0.017 *** -0.003 -0.004 * 0.008 ***
45-54 -- -- -- -- -- -- -- -- -- -- -- -- -- --
55-64 -0.009 * 0.017 *** 0.012 *** -0.015 *** -0.001 0.007 *** -0.003 *
Over 65 -0.021 *** 0.043 *** 0.044 *** -0.051 *** 0.004 0.006 ** -0.011 *** Less Than High School 0.168 *** 0.006 -0.144 *** 0.003 -0.011 *** -0.006 * 0.012 ***
High School 0.069 *** 0.015 *** -0.113 *** 0.059 *** 0.000 -0.004 ** 0.004 **
Education Some College 0.028 *** 0.007 ** -0.105 *** 0.076 *** 0.005 *** 0.002 0.005 *** College -0.001 0.003 -0.033 *** 0.031 *** 0.003 0.005 ** -0.002
Graduate -- -- -- -- -- -- -- -- -- -- -- -- -- --
Gender Male 0.044 *** -0.008 *** 0.011 *** -0.032 *** -0.011 *** -0.006 *** -0.004 *** Female -- -- -- -- -- -- -- -- -- -- -- -- -- --
Less than $25,000 0.100 *** 0.010 *** -0.095 *** 0.023 *** -0.009 *** -0.013 *** 0.018 *** $25,000-$49,999 0.032 *** 0.018 *** -0.080 *** 0.069 *** 0.002 -0.010 *** -0.002
Income $50,000-$74,999 0.007 0.017 *** -0.054 *** 0.062 *** 0.005 ** -0.008 *** -0.005 *** $75,000-$99,999 -0.004 0.005 * -0.041 *** 0.065 *** 0.002 -0.008 *** -0.004 **
More than $100,000 -- -- -- -- -- -- -- -- -- -- -- -- -- --
Ethnicity Latino 0.023 *** -0.012 *** -0.037 *** 0.030 *** 0.003 0.005 ** -0.002 Non-Latino -- -- -- -- -- -- -- -- -- -- -- -- -- --
Black 0.041 *** -0.015 *** -0.047 *** 0.013 ** 0.009 *** 0.007 *** 0.012 ***
Race Asian -0.028 *** -0.016 *** 0.150 *** -0.111 *** -0.002 0.009 ** 0.001
Other 0.036 *** -0.013 *** -0.019 ** 0.002 -0.003 -0.002 0.002
White -- -- -- -- -- -- -- -- -- -- -- -- -- --
Home Homeowner -0.041 *** 0.023 *** 0.034 *** -0.024 *** 0.010 *** 0.012 *** -0.015 *** Ownership Non-homeowner -- -- -- -- -- -- -- -- -- -- -- -- -- --
Unemployed 0.077 *** -0.022 *** -0.003 -0.051 *** -0.013 *** 0.000 0.016 ***
Work Status Retired -0.002 -0.009 *** 0.050 *** -0.041 *** -0.007 *** 0.004 * 0.005 ** Disabled or other 0.006 -0.005 * 0.021 *** -0.034 *** -0.003 -0.004 ** 0.012 ***
Employed -- -- -- -- -- -- -- -- -- -- -- -- -- --
Cost 0.043 *** 0.015 *** 0.113 *** 0.118 *** 0.018 *** 0.024 *** 0.006 ***
Relative Convenience 0.085 *** 0.072 *** 0.093 *** 0.167 *** 0.020 *** 0.041 *** 0.013 ***
Characteristics Records 0.035 *** 0.024 *** 0.085 *** 0.092 *** 0.013 *** 0.020 *** 0.011 ***
Security 0.017 *** 0.024 *** 0.035 *** 0.035 *** 0.004 *** 0.016 *** 0.001
2010 0.043 *** 0.045 *** -0.013 * -0.040 *** 0.000 0.003 0.001
2011 0.042 *** 0.031 *** -0.016 ** -0.027 *** -0.001 0.009 *** 0.003
2012 0.032 *** 0.021 *** -0.020 *** -0.046 *** -0.009 ** -0.001 0.002
2013 0.020 ** 0.013 *** -0.014 * -0.036 *** -0.003 0.000 -0.001
Year FE 2014 -- -- -- -- -- -- -- -- -- -- -- -- -- --
2015 0.026 *** -0.005 0.000 -0.028 *** 0.000 -0.003 0.004
2016 0.025 *** -0.003 -0.006 -0.026 *** 0.000 -0.004 0.011 ***
2017 0.039 *** -0.012 *** -0.002 -0.035 *** -0.003 -0.011 *** 0.015 ***
2018 0.015 ** -0.016 *** -0.016 ** -0.017 * 0.018 *** -0.010 *** 0.017 *** Adjusted R-Squared 0.1852 0.1796 0.3057 0.1845 0.0438 0.1056 0.0748 Number of Observations 19995 19992 19988 19984 19979 19989 19976
Source: Survey of Consumer Payment Choice, 2010–2018.
Table 3b: Payment instrument use regressions (share of all payments), birth year cohorts

20
Cash Check Credit Debit BANP OBBP Prepaid
Before 1945 -0.014 * 0.070 *** 0.052 *** -0.090 *** 0.007 ** 0.002 -0.011 ***
1945-1954 0.000 0.037 *** 0.029 *** -0.046 *** 0.003 0.003 -0.008 ***
1955-1964 0.005 0.020 *** 0.009 * -0.031 *** 0.004 ** 0.003 -0.003
Birth year 1965-1974 -- -- -- -- -- -- -- -- -- -- -- -- -- --
1975-1984 -0.021 *** -0.006 ** 0.011 ** 0.002 0.001 -0.009 *** 0.008 ***
1985-1994 -0.019 *** -0.007 * 0.014 ** 0.021 *** -0.005 * -0.018 *** -0.002
After 1994 0.052 *** -0.018 * -0.019 0.009 -0.013 * -0.018 ** 0.004 Less Than High School 0.170 *** 0.006 -0.145 *** 0.003 -0.011 *** -0.006 0.012 ***
High School 0.070 *** 0.015 *** -0.113 *** 0.060 *** 0.000 -0.005 ** 0.004 *
Education Some College 0.029 *** 0.007 ** -0.105 *** 0.076 *** 0.005 ** 0.002 0.004 ** College -0.001 0.003 -0.033 *** 0.031 *** 0.003 0.005 ** -0.002
Graduate -- -- -- -- -- -- -- -- -- -- -- -- -- --
Gender Male 0.044 *** -0.008 *** 0.011 *** -0.032 *** -0.011 *** -0.006 *** -0.004 *** Female -- -- -- -- -- -- -- -- -- -- -- -- -- --
Less than $25,000 0.100 *** 0.010 *** -0.095 *** 0.024 *** -0.009 *** -0.012 *** 0.017 *** $25,000-$49,999 0.031 *** 0.018 *** -0.080 *** 0.070 *** 0.002 -0.010 *** -0.002
Income $50,000-$74,999 0.006 0.017 *** -0.054 *** 0.062 *** 0.005 ** -0.007 *** -0.005 *** $75,000-$99,999 -0.005 0.005 * -0.040 *** 0.065 *** 0.002 -0.008 *** -0.004 **
More than $100,000 -- -- -- -- -- -- -- -- -- -- -- -- -- --
Ethnicity Latino 0.023 *** -0.013 *** -0.036 *** 0.030 *** 0.003 0.005 * -0.002 Non-Latino -- -- -- -- -- -- -- -- -- -- -- -- -- --
Black 0.042 *** -0.015 *** -0.047 *** 0.013 * 0.009 *** 0.006 *** 0.012 ***
Race Asian -0.028 *** -0.016 *** 0.152 *** -0.112 *** -0.002 0.008 * 0.001
Other 0.037 *** -0.012 ** -0.018 ** 0.001 -0.003 -0.002 0.002
White -- -- -- -- -- -- -- -- -- -- -- -- -- --
Home Homeowner -0.040 *** 0.023 *** 0.033 *** -0.024 *** 0.010 *** 0.012 *** -0.014 *** Ownership Non-homeowner -- -- -- -- -- -- -- -- -- -- -- -- -- --
Unemployed 0.077 *** -0.021 *** -0.003 -0.052 *** -0.013 *** 0.000 0.015 ***
Work Status Retired -0.004 -0.013 *** 0.050 *** -0.036 *** -0.006 ** 0.006 *** 0.004 * Disabled or other 0.005 -0.005 ** 0.021 *** -0.033 *** -0.003 -0.004 ** 0.012 ***
Employed -- -- -- -- -- -- -- -- -- -- -- -- -- --
Cost 0.043 *** 0.015 *** 0.113 *** 0.117 *** 0.018 *** 0.024 *** 0.006 ***
Relative Convenience 0.085 *** 0.071 *** 0.094 *** 0.166 *** 0.020 *** 0.041 *** 0.012 ***
Characteristics Records 0.035 *** 0.024 *** 0.085 *** 0.092 *** 0.013 *** 0.020 *** 0.011 ***
Security 0.017 *** 0.024 *** 0.035 *** 0.035 *** 0.004 *** 0.016 *** 0.001
2010 0.044 *** 0.038 *** -0.018 ** -0.032 *** -0.001 0.002 0.002
2011 0.043 *** 0.026 *** -0.019 ** -0.021 ** -0.002 0.008 ** 0.003
2012 0.033 *** 0.018 *** -0.023 *** -0.041 *** -0.009 *** -0.001 0.003
2013 0.021 *** 0.011 ** -0.015 * -0.034 *** -0.003 0.000 0.000
Year FE 2014 -- -- -- -- -- -- -- -- -- -- -- -- -- --
2015 0.027 *** -0.004 0.000 -0.029 *** 0.000 -0.003 0.004
2016 0.026 *** -0.001 -0.004 -0.030 *** 0.001 -0.003 0.010 ***
2017 0.039 *** -0.008 ** 0.000 -0.041 *** -0.002 -0.010 *** 0.014 ***
2018 0.014 * -0.010 ** -0.013 * -0.025 *** 0.019 *** -0.009 *** 0.016 *** Adjusted R-Squared 0.1840 0.1820 0.3055 0.1855 0.0439 0.1055 0.0738 Number of Observations 19996 19993 19989 19985 19980 19990 19977
Source: Survey of Consumer Payment Choice, 2010–2018.

21
Table 4: Year-to-year changes in shares, controlling for demographics and income (based on shares regressions):
Year-to-Year Change
Cash Check Money Order
Credit Debit Prepaid OBBP BANP
2010 – 2011 -0.001 *** -0.014 *** NA -0.002 * 0.013 *** 0.002 0.006 -0.001 2011 – 2012 -0.009 *** -0.010 *** NA -0.005 ** -0.019 *** -0.001 -0.010 *** -0.007 2012 – 2013 -0.012 *** -0.009 *** 0.001 0.006 *** 0.010 *** -0.003 0.001 0.006 ** 2013 – 2014 -0.020 ** -0.013 *** -0.002 0.014 * 0.036 *** 0.001 0.000 0.003 2014 – 2015 0.026 *** -0.005 -0.001 0.000 -0.028 *** 0.004 -0.003 0.000 2015 – 2016 -0.001 *** 0.001 0.002 -0.005 0.002 *** 0.006 *** -0.001 0.001 2016 – 2017 0.013 *** -0.009 *** 0.001 0.004 -0.009 *** 0.004 *** -0.007 *** -0.004 2017 - 2018 -0.024 ** -0.003 *** 0.000 -0.014 ** 0.018 * 0.002 *** 0.001 *** 0.021 ***
Source: Survey of Consumer Payment Choice, 2010–2018. Note: Calculated as the difference between each consecutive year dummy coefficients. The 2014 year dummy was omitted from the regressions.

22
Table 5: Year-to-year changes in bill shares, controlling for demographics and income (based on shares of bills regressions)
year to year change: share of bills regressions
Cash Check Money Order
Credit Debit Prepaid OBBP BANP
2014 as base 2010 – 2011 0.016 -0.035 *** NA 0.010 ** 0.015 *** 0.002 -0.002 -0.010 2011 – 2012 -0.004 *** -0.024 *** NA -0.004 0.010 ** -0.002 -0.028 -0.008 2012 – 2013 -0.007 *** -0.011 *** 0.000 0.005 -0.001 -0.003 0.008 *** 0.008 2013 – 2014 -0.014 ** -0.017 ** 0.001 0.004 0.013 0.002 0.014 0.005 2014 – 2015 0.017 ** -0.010 -0.005 -0.003 -0.005 0.008 ** -0.015 0.017 * 2015 – 2016 0.001 *** 0.002 0.002 0.003 0.002 0.004 *** -0.011 *** 0.000 ** 2016 – 2017 0.016 *** -0.021 *** 0.000 0.010 0.001 0.007 *** -0.011 *** -0.007 2017 - 2018 -0.015 *** -0.007 *** -0.001 -0.023 * 0.006 0.001 *** -0.004 *** 0.047 ***
Year-to-year changes in purchase shares, controlling for demographics and income (based on shares of purchases regressions):
year to year change: share of purchases regressions
Cash Check Money Order
Credit Debit Prepaid OBBP BANP
2014 as base 2010 – 2011 0.000 *** -0.006 *** NA -0.005 0.015 *** 0.001 0.000 -0.001 ** 2011 – 2012 -0.017 *** -0.006 *** NA -0.007 ** -0.029 *** 0.000 0.001 -0.004 ** 2012 – 2013 -0.009 *** -0.008 *** 0.001 0.009 *** 0.013 *** -0.002 -0.002 * 0.001 2013 – 2014 -0.022 ** -0.013 *** -0.001 0.016 * 0.044 *** 0.001 0.001 -0.001 2014 – 2015 0.023 ** -0.004 0.000 0.003 -0.034 *** 0.001 0.000 0.000 2015 – 2016 0.001 *** 0.003 0.001 -0.009 0.002 *** 0.007 *** -0.001 0.001 2016 – 2017 0.011 *** -0.004 0.001 0.002 -0.018 *** 0.004 *** -0.001 ** -0.004 2017 - 2018 -0.024 -0.004 ** 0.002 ** -0.010 * 0.027 ** 0.001 *** 0.001 0.006 *
Source: Survey of Consumer Payment Choice, 2010–2018. Note: Calculated as the difference between each consecutive year dummy coefficients. The 2014 year dummy was omitted from the regressions.

23
Table 6: Changes in check and cash use among panelists, 2016 to 2017 and 2017 to 2018
Check use 2016 to 2017 2017 to 2018
Check use total % of all consumers who decreased check use 40.7% 36.4%
Average drop in share -0.08 -0.07
% of all consumers who increased check use 33.8% 36.4%
Average increase in share 0.07 0.06
% of all consumers check use stayed the same 25.5% 27.2%
Check use for bill pay % of all consumers who decreased check use for bill pay 37.0% 33.7%
Average drop in share -0.15 -0.14
% of all consumers who increased check use 29.7% 31.2%
Average increase in share 0.13 0.12
% of all consumers check use for bill pay stayed the same 33.3% 35.0%
Check use for purchases % of all consumers who decreased check use for purchases 33.2% 31.3%
Average drop in share -0.09 -0.10
% of all consumers who increased check use for purchases 29.5% 30.3%
Average increase in share 0.11 0.08
% of all consumers check use for purchases stayed the same 37.2% 38.4%
Cash use 2016 to 2017 2017 to 2018
Cash use total % of all consumers who decreased cash use 45.5% 52.1%
Average drop in share -0.16 -0.18
% of all consumers who increased cash use 49.0% 43.4%
Average increase in share 0.16 0.15
% of all consumers cash use stayed the same 5.5% 4.5%
Cash use for bill pay % of all consumers decreased cash use 22.1% 25.4%
Average drop in share -0.21 -0.24
% of all consumers who increased cash use 26.0% 24.3%
Average increase in share 0.24 0.20
% of all consumers cash use for bill pay stayed the same 51.9% 50.2%
Cash use for purchases % of all consumers who decreased cash use for purchases 46.0% 52.7%
Average drop in share -0.20 -0.21
% of all consumers who increased cash use for purchases 47.6% 41.8%
Average increase in share 0.19 0.18
% of all consumers cash use for purchases stayed the same 6.4% 5.5%
Total number of participants (current year) 3099 3153
Number of respondents who participated in both years 2681 2573
Source: Survey of Consumer Payment Choice, 2016–2018

24
Table 7a: Consumers who reduced their check or cash use from 2016 to 2017
2016 to 2017 Decreased cash use
Decreased cash use for bill pay
Decreased cash use for purchases
Decreased check use
Decreased check use for bill pay
Decreased check use for purchases
Number of Consumers 1206 575 1183 1122 1017 912 Under 25 51% 36% 55% 28% 29% 18% 25-34 44% 19% 44% 28% 28% 24% 35-44 45% 23% 45% 37% 35% 32% 45-54 46% 22% 47% 47% 42% 36% 55-64 45% 23% 43% 47% 43% 37% Over 64 46% 21% 48% 50% 41% 42% Less than high school 43% 22% 37% 30% 22% 24% High school 42% 25% 44% 39% 36% 31% Some college 48% 24% 47% 37% 37% 30% College 44% 19% 44% 48% 42% 38% Graduate 53% 17% 53% 45% 38% 42% Less than $25,000 45% 34% 46% 31% 30% 28% $25,000-$49,999 47% 25% 46% 39% 33% 30% $50,000-$74,999 42% 18% 45% 45% 42% 34% $75,000-$99,999 44% 21% 44% 45% 42% 34% More than $100,000 47% 17% 48% 43% 38% 38% Male 45% 21% 45% 41% 36% 34% Female 46% 23% 46% 41% 38% 33% White 45% 21% 45% 42% 39% 35% Black 38% 27% 38% 30% 30% 21% Asian 56% 27% 57% 43% 46% 42% Other 47% 48% 51% 32% 32% 35% Employed 45% 20% 46% 41% 38% 33% Unemployed 41% 31% 39% 22% 25% 18% Retired 50% 20% 50% 49% 40% 42% Disabled or other 44% 31% 43% 37% 33% 31%
Source: SCPC, 2016 and 2017. Interpretation: 50 percent of consumers over 64 years old reduced their use of checks from 2016 to 2017.

25
Table 7b: Consumers who reduced their check or cash use from 2017 to 2018
2017 to 2018 Decreased cash use
Decreased cash use for bill pay
Decreased cash use for purchases
Decreased check use
Decreased check use for bill pay
Decreased check use for purchases
Number of Consumers 1320 626 1288 1024 920 843 Under 25 45% 30% 51% 20% 9% 25% 25-34 54% 25% 54% 32% 29% 25% 35-44 51% 28% 51% 36% 29% 33% 45-54 53% 27% 56% 37% 34% 32% 55-64 49% 25% 49% 40% 39% 33% Over 64 54% 22% 53% 41% 41% 36% Less than high school 48% 31% 48% 21% 17% 18% High school 52% 29% 55% 30% 29% 27% Some college 53% 28% 50% 31% 30% 28% College 55% 22% 55% 45% 40% 34% Graduate 47% 19% 49% 46% 39% 44% Less than $25,000 50% 33% 50% 25% 21% 22% $25,000-$49,999 52% 29% 53% 33% 28% 29% $50,000-$74,999 53% 22% 56% 38% 36% 33% $75,000-$99,999 46% 23% 47% 47% 37% 38% More than $100,000 57% 22% 55% 40% 42% 35% Male 51% 26% 52% 35% 34% 30% Female 53% 25% 53% 37% 34% 33% White 51% 23% 52% 38% 37% 32% Black 54% 36% 52% 25% 18% 25% Asian 50% 39% 46% 41% 30% 37% Other 57% 27% 57% 39% 34% 32% Employed 52% 25% 54% 38% 34% 32% Unemployed 49% 25% 50% 22% 11% 21% Retired 52% 20% 54% 42% 41% 39% Disabled or other 54% 31% 47% 31% 30% 25%
Source: SCPC, 2017 and 2018. Interpretation: 41 percent of consumers over 64 years old reduced their use of checks from 2017 to 2018.
26
Table 8: Average year-to-year change in check share for bills and purchases, 2016–2018 sample
Change in Share (Magnitude) Check Use % of
consumers 16-17 avg
change in bill 16-17 avg change in purchase
16-17 avg change in
total share
17-18 avg change in bill
17-18 avg change in purchase
17-18 avg change in
total share Bill share 16-17
increase 28.3% 0.127 0.026 0.045 -0.095 -0.021 -0.035 decrease 33.9% -0.145 -0.023 -0.056 0.033 -0.006 0.005
flat 30.7% 0.000 0.011 0.005 0.015 -0.001 0.007 Purchase share 16-17
increase 28.2% 0.006 0.107 0.061 -0.040 -0.078 -0.048 decrease 30.6% -0.045 -0.090 -0.071 0.005 0.026 0.015
flat 36.0% -0.004 0.000 0.000 -0.001 0.018 0.012 Total share 16-17
increase 33.6% 0.066 0.080 0.072 -0.055 -0.052 -0.043 decrease 38.3% -0.092 -0.063 -0.076 0.013 0.019 0.017
flat 25.0% -0.002 0.002 0.000 0.017 0.014 0.014
Notes: (1) 33.9% of panelists reduced their check use for bills from 2016 to 2017. The average decline in check-use share for bill payments
was 0.145. Those consumers then lowered their share of check use for purchases the following year, from 2017 to 2018, by 0.006.
(2) 30.6% of panelists reduced their check use for purchases from 2016 to 2017. The average decline in check-use share for purchases was 0.090. Those consumers then raised their share of check use for bill payments the following year, from 2017 to 2018, by 0.005.
Source: Author’s calculations based on the Survey of Consumer Payment Choice, 2016–2018.

27
Table 9: Average year-to-year change in cash share for bills and purchases, 2016–2018 sample
Change in Share (Magnitude) Cash Use % of
consumers 16-17 avg
change in bill 16-17 avg change in purchase
16-17 avg change in total
share
17-18 avg change in bill
17-18 avg change in purchase
17-18 avg change in total
share Bill share 16-17
increase 23.4% 0.237 0.074 0.133 -0.166 -0.069 -0.109 decrease 20.1% -0.207 -0.060 -0.109 0.068 -0.008 0.018
flat 49.4% 0.000 0.000 0.000 0.020 -0.019 -0.010 Purchase share 16-17
increase 44.3% 0.057 0.192 0.148 -0.042 -0.121 -0.103 decrease 44.1% -0.028 -0.186 -0.138 0.012 0.060 0.039
flat 6.4% 0.029 0.000 0.028 -0.017 0.027 0.008 Total share 16-17
increase 46.6% 0.089 0.167 0.166 -0.057 -0.110 -0.114 decrease 44.6% -0.060 -0.166 -0.155 0.025 0.044 0.045
flat 5.6% 0.000 0.000 0.000 0.031 0.104 0.096
Notes: (1) 20.1% of panelists reduced their cash use for bills from 2016 to 2017. The average decline in cash-use share for bill payments was
0.207. Those consumers then lowered their share of cash use for purchases the following year, from 2017 to 2018, by 0.008. (2) 44.1% of panelists reduced their cash use for purchases from 2016 to 2017. The average decline in cash-use share for purchases
was 0.186. Those consumers then raised their share of cash use for bill payments the following year, from 2017 to 2018, by 0.012.
Source: Author’s calculations based on the Survey of Consumer Payment Choice, 2016–2018.

28
Table 10: State-level correlations, levels and year-to-year change
State-level correlation 2016 electronic bill share vs.
2017 Cash/Check share (level-level correlation)
2016-2017 change in electronic bill share
vs. 2016-2017 change in
Cash/Check share (change-change correlation)
Cash share, all payments -0.236 -0.151 Cash share, bills only -0.153 -0.219 Cash share, purchases -0.258 -0.070 Check share, all payments -0.477 -0.112 Check share, bills only -0.431 -0.401 Check share, purchases -0.467 0.140
State-level correlation 2017 electronic bill share
vs. 2018 Cash/Check share levels
(level-level correlation)
2017-2018 change in electronic bill share
vs. 2017-2018 change in
Cash/Check share (change-change correlation)
Cash share, all payments -0.367 0.311 Cash share, bills only -0.315 -0.078 Cash share, purchases -0.211 0.277 Check share, all payments -0.099 -0.423 Check share, bills only -0.439 -0.332 Check share, purchases 0.128 -0.430
Source: Survey of Consumer Payment Choice, 2016–2018

29
Figure 1: Total number of noncash payments in the United States
Source: Federal Reserve Payment Study.

30
Figure 2: Number of checks as a share of all noncash payments in 22 countries in 2019
Source: Oz Shy’s calculations based on the Bank of International Settlements Redbook, https://stats.bis.org/statx/toc/CPMI.html.

31
Figure 3: Share of all transactions paid with checks by consumer’s age in the United States
Source: Survey of Consumer Payment Choice, 2009–2018.
Figure 4: Share of all transactions paid with checks by consumer’s annual household income
Source: Survey of Consumer Payment Choice, 2009–2018.

32
Figure 5: Share of all transactions paid with checks by consumer’s education level
Source: Survey of Consumer Payment Choice, 2009–2018.
Figure 6: Share of bill payments paid with check by consumer’s age in the United States
Source: Survey of Consumer Payment Choice, 2009–2018.

33
Figure 7: Average share of bill payments paid electronically per person by state
Source: 2018 Survey of Consumer Payment Choice. Note: Share of bills paid electronically in a typical month for each consumer, averaged across all consumers residing in the state