payments to the states - budget.gov.au · improving trachoma control services for indigenous...
TRANSCRIPT
1
Annex A
PAYMENTS TO THE STATES
This annex provides accrual estimates of Commonwealth payments to the States (and local governments). This includes Commonwealth advances (loans) to the States, including new advances, interest on advances and repayments of advances. Most of these advances were funded from borrowings made on behalf of the States under previous Australian Loan Council arrangements.
Each table presents estimated payments to the States for the period 2015-16 to 2018-19 as follows:
A.1 — health;
A.2 — education;
A.3 — skills and workforce development;
A.4 — community services;
A.5 — affordable housing;
A.6 — infrastructure;
A.7 — environment;
A.8 — contingent payments;
A.9 — other;
A.10 — GST and general revenue assistance;
A.11 — payments presented on the Australian Bureau of Statistics Government Finance Statistics (GFS) functional basis; and
A.12 — advances, repayment of advances and interest payments.

Attachm
ent D: A
nnex A (online only)
2
Table A.1: Estimated payments to support state health services, by year and state $'000 NSW VIC QLD WA SA TAS ACT NT Total2015-16National Health Reform funding(a)
Hospital services 5,129,563 4,045,489 3,212,386 1,792,213 1,162,813 341,455 315,576 170,686 16,170,181Public health 113,384 88,575 71,303 38,881 25,241 7,632 5,815 3,641 354,472
Public hospitals funding - - - - - - - - -National Partnership payments
Health infrastructureHealth and Hospitals Fund
Hospital infrastructure and other projects of national significance - - - 600 - - - - 600
National cancer system - 51,500 440 7,361 - 6,320 50 - 65,671Regional priority round - 45,724 20,737 17,878 1,000 - - 60,185 145,524
Albury-Wodonga Cardiac CatheterisationLaboratory - 3,500 - - - - - - 3,500
Bright Hospital – feasibility study - 50 - - - - - - 50Construction of Palmerston Hospital - - - - - - - - -Improving local access to health care on
Phillip Island - 2,500 - - - - - - 2,500Redevelopment of the Royal Victorian
Eye and Ear Hospital - 50,000 - - - - - - 50,000Upgrade of Ballina Hospital 2,600 - - - - - - - 2,600

3
Attachm
ent D: A
nnex A (online only)
Table A.1: Estimated payments to support state health services, by year and state (continued) $'000 NSW VIC QLD WA SA TAS ACT NT Total2015-16
Health servicesExpansion of the BreastScreen
Australia Programme 4,780 3,457 1,391 2,028 1,106 420 356 76 13,614Health care grants for the Torres Strait - - 4,600 - - - - - 4,600Hummingbird House - - 800 - - - - - 800Improving Health Services in Tasmania
Better access to community basedpalliative care services - - - - - 1,700 - - 1,700
Cradle Coast Connected Care clinical repository - - - - - 250 - - 250
Improving patient pathways throughclinical and system redesign - - - - - 8,985 - - 8,985
Innovative flexible funding formental health - - - - - 1,025 - - 1,025
Reducing elective surgery waiting listsin Tasmania - - - - - 12,000 - - 12,000
Subacute and acute projects - - - - - 15,663 - - 15,663National Bowel Cancer Screening Programme
– participant follow-up function - 811 654 335 258 150 118 94 2,420OzFoodNet 346 254 254 199 199 184 139 144 1,719Royal Darwin hospital – equipped,
prepared and ready - - - - - - - 15,461 15,461Torres Strait health protection strategy
Mosquito control - - 973 - - - - - 973Saibai Island - health clinic - - 500 - - - - - 500
Vaccine-preventable diseases surveillance 202 189 163 83 79 33 34 47 830
Victorian Cytology Service - 9,332 - - - - - - 9,332

4
Attachm
ent D: A
nnex A (online only)
Table A.1: Estimated payments to support state health services, by year and state (continued) $'000 NSW VIC QLD WA SA TAS ACT NT Total2015-16
Indigenous healthAccommodation related to renal services
for Aboriginal and Torres Strait Islander peoples in the Northern Territory - - - - - - - 3,000 3,000
Improving trachoma control services forIndigenous Australians 264 - 50 1,367 971 - - 1,559 4,211
Northern Territory remote Aboriginalinvestment
Health component - - - - - - - 5,649 5,649Rheumatic fever strategy - - 893 893 395 - - 893 3,074
Other healthAdult public dental services 49,948 38,457 30,324 13,028 12,480 5,534 2,365 2,864 155,000Essential vaccines 59,494 33,940 33,480 19,560 10,495 3,134 2,947 3,050 166,100Supporting National Mental Health Reform 13,559 7,608 10,428 7,004 3,446 1,699 620 887 45,251
Total 5,374,140 4,381,386 3,389,376 1,901,430 1,218,483 406,184 328,020 268,236 17,267,255 (a) National Health Reform funding relates to payments for estimated services in 2014-15 and 2015-16. This funding has not been adjusted for the 2014-15
reconciliation of actual state hospital activity data. The recalculation of Commonwealth funding entitlements for 2014-15 and 2015-16 will be determined by the Treasurer upon a final reconciliation of actual state hospital activity data by the Administrator of the National Health Funding Pool.

5
Attachm
ent D: A
nnex A (online only)
Table A.1: Estimated payments to support state health services, by year and state (continued) $'000 NSW VIC QLD WA SA TAS ACT NT Total2016-17National Health Reform funding(a)
Hospital services 5,403,812 4,237,911 3,376,309 1,914,372 1,211,558 350,900 336,813 188,910 17,020,585Public health 119,217 93,520 75,085 41,166 26,427 7,930 6,121 3,817 373,283
Public hospitals funding - - - - - - - - -National Partnership payments
Health infrastructureHealth and Hospitals Fund
Hospital infrastructure and other projects of national significance - - - - - - - - -
National cancer system - - - 1,480 - - - - 1,480Regional priority round 15,700 - 5,098 19,269 - 25,000 - 39,300 104,367
Albury-Wodonga Cardiac CatheterisationLaboratory - 1,500 - - - - - - 1,500
Bright Hospital – feasibility study - - - - - - - - -Construction of Palmerston Hospital - - - - - - - 20,000 20,000Improving local access to health care on
Phillip Island - - - - - - - - -Redevelopment of the Royal Victorian
Eye and Ear Hospital - - - - - - - - -Upgrade of Ballina Hospital - - - - - - - - -

6
Attachm
ent D: A
nnex A (online only)
Table A.1: Estimated payments to support state health services, by year and state (continued) $'000 NSW VIC QLD WA SA TAS ACT NT Total2016-17
Health servicesExpansion of the BreastScreen
Australia Programme 5,436 4,278 1,614 2,333 1,284 495 263 86 15,789Health care grants for the Torres Strait - - 4,653 - - - - - 4,653Hummingbird House - - 800 - - - - - 800Improving Health Services in Tasmania
Better access to community basedpalliative care services - - - - - - - - -
Cradle Coast Connected Care clinical repository - - - - - - - - -
Improving patient pathways throughclinical and system redesign - - - - - - - - -
Innovative flexible funding formental health - - - - - - - - -
Reducing elective surgery waiting listsin Tasmania - - - - - 8,486 - - 8,486
Subacute and acute projects - - - - - 15,000 - - 15,000National Bowel Cancer Screening Programme
– participant follow-up function 1,507 1,096 913 457 320 197 151 106 4,747OzFoodNet 352 259 257 203 203 187 141 146 1,748Royal Darwin hospital – equipped,
prepared and ready - - - - - - - 15,740 15,740Torres Strait health protection strategy
Mosquito control - - 992 - - - - - 992Saibai Island - health clinic - - - - - - - - -
Vaccine-preventable diseases surveillance 206 192 166 84 80 34 35 48 845
Victorian Cytology Service - 9,799 - - - - - - 9,799

7
Attachm
ent D: A
nnex A (online only)
Table A.1: Estimated payments to support state health services, by year and state (continued) $'000 NSW VIC QLD WA SA TAS ACT NT Total2016-17
Indigenous healthAccommodation related to renal services
for Aboriginal and Torres Strait Islander peoples in the Northern Territory - - - - - - - 3,000 3,000
Improving trachoma control services forIndigenous Australians 269 - 50 1,394 990 - - 1,591 4,294
Northern Territory remote Aboriginalinvestment
Health component - - - - - - - 5,905 5,905Rheumatic fever strategy - - 905 905 - - - 905 2,715
Other healthAdult public dental services(b) nfp nfp nfp nfp nfp nfp nfp nfp nfpEssential vaccines 44,401 34,163 30,827 17,180 9,238 2,823 2,419 2,648 143,699Supporting National Mental Health Reform - - - - - - - - -
Total 5,590,900 4,382,718 3,497,669 1,998,843 1,250,100 411,052 345,943 282,202 17,759,427 (a) The efficient growth funding component of National Health Reform funding is indicative only. The distribution of efficient growth funding will be determined by the
actual efficient growth in activity in each of the States. (b) Funding amounts are not published as negotiations are yet to be finalised.

8
Attachm
ent D: A
nnex A (online only)
Table A.1: Estimated payments to support state health services, by year and state (continued) $'000 NSW VIC QLD WA SA TAS ACT NT Total2017-18National Health Reform funding
Hospital services - - - - - - - - -Public health - - - - - - - - -
Public hospitals funding(a) 5,755,480 4,533,363 3,629,297 2,001,025 1,270,205 378,126 295,745 183,713 18,046,954National Partnership payments
Health infrastructureHealth and Hospitals Fund
Hospital infrastructure and other projects of national significance - - - - - - - - -
National cancer system - - - 1,600 - - - - 1,600Regional priority round - - 2,000 499 - 15,000 - 8,000 25,499
Albury-Wodonga Cardiac CatheterisationLaboratory - - - - - - - - -
Bright Hospital – feasibility study - - - - - - - - -Construction of Palmerston Hospital - - - - - - - - -Improving local access to health care on
Phillip Island - - - - - - - - -Redevelopment of the Royal Victorian
Eye and Ear Hospital - - - - - - - - -Upgrade of Ballina Hospital - - - - - - - - -

9
Attachm
ent D: A
nnex A (online only)
Table A.1: Estimated payments to support state health services, by year and state (continued) $'000 NSW VIC QLD WA SA TAS ACT NT Total2017-18
Health servicesExpansion of the BreastScreen
Australia Programme - - - - - - - - -Health care grants for the Torres Strait - - - - - - - - -Hummingbird House - - 800 - - - - - 800Improving Health Services in Tasmania
Better access to community basedpalliative care services - - - - - - - - -
Cradle Coast Connected Care clinical repository - - - - - - - - -
Improving patient pathways throughclinical and system redesign - - - - - - - - -
Innovative flexible funding formental health - - - - - - - - -
Reducing elective surgery waiting listsin Tasmania - - - - - - - - -
Subacute and acute projects - - - - - - - - -National Bowel Cancer Screening Programme
– participant follow-up function 2,037 1,481 1,234 617 432 245 184 122 6,352OzFoodNet(b) nfp nfp nfp nfp nfp nfp nfp nfp nfpRoyal Darwin hospital – equipped,
prepared and ready - - - - - - - 16,023 16,023Torres Strait health protection strategy
Mosquito control - - - - - - - - -Saibai Island - health clinic - - - - - - - - -
Vaccine-preventable diseases surveillance - - - - - - - - -
Victorian Cytology Service - - - - - - - - -

10
Attachm
ent D: A
nnex A (online only)
Table A.1: Estimated payments to support state health services, by year and state (continued) $'000 NSW VIC QLD WA SA TAS ACT NT Total2017-18
Indigenous healthAccommodation related to renal services
for Aboriginal and Torres Strait Islander peoples in the Northern Territory - - - - - - - - -
Improving trachoma control services forIndigenous Australians - - - - - - - - -
Northern Territory remote Aboriginalinvestment
Health component - - - - - - - 6,171 6,171Rheumatic fever strategy - - - - - - - - -
Other healthAdult public dental services(b) nfp nfp nfp nfp nfp nfp nfp nfp nfpEssential vaccines 44,173 34,120 30,921 17,412 9,176 2,796 2,413 2,652 143,663Supporting National Mental Health Reform - - - - - - - - -
Total 5,801,690 4,568,964 3,664,252 2,021,153 1,279,813 396,167 298,342 216,681 18,247,062 (a) State allocations of public hospitals funding are shown on the basis of state population shares of total funding and are not adjusted for cross-border activity. (b) Funding amounts are not published as negotiations are yet to be finalised.

11
Attachm
ent D: A
nnex A (online only)
Table A.1: Estimated payments to support state health services, by year and state (continued) $'000 NSW VIC QLD WA SA TAS ACT NT Total2018-19National Health Reform funding
Hospital services - - - - - - - - -Public health - - - - - - - - -
Public hospitals funding(a) 5,986,607 4,734,285 3,778,284 2,095,464 1,315,095 388,242 307,713 190,511 18,796,201National Partnership payments
Health infrastructureHealth and Hospitals Fund
Hospital infrastructure and other projects of national significance - - - - - - - - -
National cancer system - - - - - - - - -Regional priority round - - - 161 - 10,000 - - 10,161
Albury-Wodonga Cardiac CatheterisationLaboratory - - - - - - - - -
Bright Hospital – feasibility study - - - - - - - - -Construction of Palmerston Hospital - - - - - - - - -Improving local access to health care on
Phillip Island - - - - - - - - -Redevelopment of the Royal Victorian
Eye and Ear Hospital - - - - - - - - -Upgrade of Ballina Hospital - - - - - - - - -

12
Attachm
ent D: A
nnex A (online only)
Table A.1: Estimated payments to support state health services, by year and state (continued) $'000 NSW VIC QLD WA SA TAS ACT NT Total2018-19
Health servicesExpansion of the BreastScreen
Australia Programme - - - - - - - - -Health care grants for the Torres Strait - - - - - - - - -Hummingbird House - - 800 - - - - - 800Improving Health Services in Tasmania
Better access to community basedpalliative care services - - - - - - - - -
Cradle Coast Connected Care clinical repository - - - - - - - - -
Improving patient pathways throughclinical and system redesign - - - - - - - - -
Innovative flexible funding formental health - - - - - - - - -
Reducing elective surgery waiting listsin Tasmania - - - - - - - - -
Subacute and acute projects - - - - - - - - -National Bowel Cancer Screening Programme
– participant follow-up function - - - - - - - - -OzFoodNet(b) nfp nfp nfp nfp nfp nfp nfp nfp nfpRoyal Darwin hospital – equipped,
prepared and ready - - - - - - - 16,311 16,311Torres Strait health protection strategy
Mosquito control - - - - - - - - -Saibai Island - health clinic - - - - - - - - -
Vaccine-preventable diseases surveillance - - - - - - - - -
Victorian Cytology Service - - - - - - - - -

13
Attachm
ent D: A
nnex A (online only)
Table A.1: Estimated payments to support state health services, by year and state (continued) $'000 NSW VIC QLD WA SA TAS ACT NT Total2018-19
Indigenous healthAccommodation related to renal services
for Aboriginal and Torres Strait Islander peoples in the Northern Territory - - - - - - - - -
Improving trachoma control services forIndigenous Australians - - - - - - - - -
Northern Territory remote Aboriginalinvestment
Health component - - - - - - - 6,448 6,448Rheumatic fever strategy - - - - - - - - -
Other healthAdult public dental services(b) nfp nfp nfp nfp nfp nfp nfp nfp nfpEssential vaccines 44,517 34,509 31,401 17,880 9,217 2,801 2,448 2,645 145,418Supporting National Mental Health Reform - - - - - - - - -
Total 6,031,124 4,768,794 3,810,485 2,113,505 1,324,312 401,043 310,161 215,915 18,975,339 (a) State allocations of public hospitals funding are shown on the basis of state population shares of total funding and are not adjusted for cross-border activity. (b) Funding amounts are not published as negotiations are yet to be finalised.

14
Attachm
ent D: A
nnex A (online only)
Table A.2: Estimated payments to support state education services, by year and state $'000 NSW VIC QLD WA SA TAS ACT NT Total2015-16Students First funding(a)(b)(c) 4,812,349 3,923,556 3,297,971 1,579,120 1,126,436 364,982 264,538 288,041 15,658,466National Partnership payments
Independent Public Schools initiative 6,500 9,080 3,680 2,300 1,580 600 260 460 24,460MoneySmart Teaching 273 257 206 140 134 - - 115 1,125National quality agenda for early childhood
education and care(d) ~ ~ ~ ~ ~ ~ ~ ~ 19,080National School Chaplaincy Programme 11,113 12,615 18,102 7,627 7,489 2,192 966 483 60,587National School for Travelling Show Children 200 - - - - - - - 200Northern Territory remote Aboriginal
investment(e)Children and schooling component - - - - - - - 51,213 51,213
Online safety programs in schools(d) ~ ~ ~ ~ ~ ~ ~ ~ 1,250School Pathways Programme - - - 600 675 - - - 1,275Schools Security Programme 3,029 1,570 329 573 131 - 13 67 5,712Trade training centres in schools 5,699 20,673 4,620 9,345 2,405 - 725 8,251 51,718Universal access to early childhood education 130,471 98,431 85,988 45,137 27,112 8,692 6,849 4,975 407,655
Total 4,969,634 4,066,182 3,410,896 1,644,842 1,165,962 376,466 273,351 353,605 16,282,741Memorandum item – payments for non-government
schools included in payments aboveStudents First funding(a)(b)(c) 3,057,978 2,568,388 2,008,124 1,010,593 726,048 199,306 183,255 139,505 9,894,670National Partnership payments
Online safety programs in schools(d) ~ ~ ~ ~ ~ ~ ~ ~ 365Schools Security Programme 2,459 1,570 - 573 131 - 13 - 4,746Trade training centres in schools - 234 771 - - - - - 1,005
Total 3,060,437 2,570,192 2,008,895 1,011,166 726,179 199,306 183,268 139,505 9,900,786 (a) Includes funding for non-government representative bodies. (b) Includes special circumstances funding. As state allocations cannot be determined, this funding is included in the total for each year only. As such, the total for each
year does not equal the sum of state totals. (c) Includes other prescribed purpose funding. (d) State allocations are yet to be finalised. (e) Includes payments for government and non-government schools; however, payments for non-government schools are not shown in the Memorandum item.

15
Attachm
ent D: A
nnex A (online only)
Table A.2: Estimated payments to support state education services, by year and state (continued) $'000 NSW VIC QLD WA SA TAS ACT NT Total2016-17Students First funding(a)(b)(c) 5,239,820 4,220,933 3,627,429 1,700,626 1,202,165 394,300 280,568 315,008 16,982,369National Partnership payments
Independent Public Schools initiative 6,500 4,540 3,680 2,300 1,580 600 260 460 19,920MoneySmart Teaching 318 300 240 162 156 - - 134 1,310National quality agenda for early childhood
education and care(d) ~ ~ ~ ~ ~ ~ ~ ~ 21,646National School Chaplaincy Programme 11,113 12,615 18,102 7,627 7,489 2,192 966 483 60,587National School for Travelling Show Children - - - - - - - - -Northern Territory remote Aboriginal
investment(e)Children and schooling component - - - - - - - 46,097 46,097
Online safety programs in schools(d) ~ ~ ~ ~ ~ ~ ~ ~ 2,500School Pathways Programme - - - - - - - - -Schools Security Programme 2,780 3,617 329 1,146 262 - 13 67 8,214Trade training centres in schools - - - - - - - - -Universal access to early childhood education 133,852 101,631 87,487 46,639 27,557 8,578 7,150 5,111 418,005
Total 5,394,383 4,343,636 3,737,267 1,758,500 1,239,209 405,670 288,957 367,360 17,560,648Memorandum item – payments for non-government
schools included in payments aboveStudents First funding(a)(b)(c) 3,255,378 2,760,117 2,173,016 1,096,820 778,008 215,483 195,393 148,427 10,624,162National Partnership payments
Online safety programs in schools(d) ~ ~ ~ ~ ~ ~ ~ ~ 727Schools Security Programme 2,210 3,617 - 1,146 262 - 13 - 7,248Trade training centres in schools - - - - - - - - -
Total 3,257,588 2,763,734 2,173,016 1,097,966 778,270 215,483 195,406 148,427 10,632,137 (a) Includes funding for non-government representative bodies. (b) Includes special circumstances funding. As state allocations cannot be determined, this funding is included in the total for each year only. As such, the total for each
year does not equal the sum of state totals. (c) Includes other prescribed purpose funding. (d) State allocations are yet to be finalised. (e) Includes payments for government and non-government schools; however, payments for non-government schools are not shown in the Memorandum item.

16
Attachm
ent D: A
nnex A (online only)
Table A.2: Estimated payments to support state education services, by year and state (continued) $'000 NSW VIC QLD WA SA TAS ACT NT Total2017-18Students First funding(a)(b) 5,541,085 4,465,933 3,807,611 1,897,343 1,276,635 404,240 294,428 310,162 17,998,979National Partnership payments
Independent Public Schools initiative - - - - - - - - -MoneySmart Teaching(c) nfp nfp nfp nfp nfp nfp nfp nfp nfpNational quality agenda for early childhood
education and care(d) ~ ~ ~ ~ ~ ~ ~ ~ 20,330National School Chaplaincy Programme 11,113 12,615 18,102 7,627 7,489 2,192 966 483 60,587National School for Travelling Show Children - - - - - - - - -Northern Territory remote Aboriginal
investment(e)Children and schooling component - - - - - - - 46,567 46,567
Online safety programs in schools(d) ~ ~ ~ ~ ~ ~ ~ ~ 3,750School Pathways Programme - - - - - - - - -Schools Security Programme 3,202 - - - - - 12 - 3,214Trade training centres in schools - - - - - - - - -Universal access to early childhood education 95,260 72,328 62,262 33,192 19,611 6,105 5,089 3,637 297,484
Total 5,650,660 4,550,876 3,887,975 1,938,162 1,303,735 412,537 300,495 360,849 18,430,911Memorandum item – payments for non-government
schools included in payments aboveStudents First funding(a)(b) 3,406,630 2,912,748 2,275,334 1,153,174 816,072 224,382 202,165 156,459 11,148,506National Partnership payments
Online safety programs in schools(d) ~ ~ ~ ~ ~ ~ ~ ~ 1,092Schools Security Programme 3,202 - - - - - 12 - 3,214Trade training centres in schools - - - - - - - - -
Total 3,409,832 2,912,748 2,275,334 1,153,174 816,072 224,382 202,177 156,459 11,152,812 (a) Includes special circumstances funding. As state allocations cannot be determined, this funding is included in the total for each year only. As such, the total for each
year does not equal the sum of state totals. (b) State allocations from the 2018 school year onwards are indicative only, and final allocations are subject to formal negotiations between the Commonwealth, the
States and the non-government sector. (c) Provision has been made in the Contingency Reserve for funding from 2017-18, subject to negotiations with the States. (d) State allocations are yet to be finalised. (e) Includes payments for government and non-government schools; however, payments for non-government schools are not shown in the Memorandum item.

17
Attachm
ent D: A
nnex A (online only)
Table A.2: Estimated payments to support state education services, by year and state (continued) $'000 NSW VIC QLD WA SA TAS ACT NT Total2018-19Students First funding(a)(b) 5,692,591 4,668,140 3,914,899 2,090,194 1,344,558 406,084 310,847 297,968 18,726,846National Partnership payments
Independent Public Schools initiative - - - - - - - - -MoneySmart Teaching(c) nfp nfp nfp nfp nfp nfp nfp nfp nfpNational quality agenda for early childhood
education and care(d) nfp nfp nfp nfp nfp nfp nfp nfp nfpNational School Chaplaincy Programme - - - - - - - - -National School for Travelling Show Children - - - - - - - - -Northern Territory remote Aboriginal
investment(e)Children and schooling component - - - - - - - 39,644 39,644
Online safety programs in schools - - - - - - - - -School Pathways Programme - - - - - - - - -Schools Security Programme - - - - - - - - -Trade training centres in schools - - - - - - - - -Universal access to early childhood education - - - - - - - - -
Total 5,692,591 4,668,140 3,914,899 2,090,194 1,344,558 406,084 310,847 337,612 18,766,490Memorandum item – payments for non-government
schools included in payments aboveStudents First funding(a)(b) 3,518,593 3,043,845 2,361,520 1,206,544 851,833 229,864 211,237 163,291 11,588,292National Partnership payments
Online safety programs in schools - - - - - - - - -Schools Security Programme - - - - - - - - -Trade training centres in schools - - - - - - - - -
Total 3,518,593 3,043,845 2,361,520 1,206,544 851,833 229,864 211,237 163,291 11,588,292 (a) Includes special circumstances funding. As state allocations cannot be determined, this funding is included in the total for each year only. As such, the total for each
year does not equal the sum of state totals. (b) State allocations from the 2018 school year onwards are indicative only, and final allocations are subject to formal negotiations between the Commonwealth, the
States and the non-government sector. (c) Provision has been made in the Contingency Reserve for funding from 2017-18, subject to negotiations with the States. (d) Provision has been made in the Contingency Reserve for funding from 2018-19, subject to negotiations with the States. (e) Includes payments for government and non-government schools; however, payments for non-government schools are not shown in the Memorandum item.

18
Attachm
ent D: A
nnex A (online only)
Table A.3: Estimated payments to support state skills and workforce development services, by year and state $'000 NSW VIC QLD WA SA TAS ACT NT Total2015-16National Skills and Workforce
Development SPP 465,560 363,696 292,773 159,649 103,642 31,336 23,876 14,952 1,455,484National Partnership payments
Building Australia's Future WorkforceSkills reform 121,281 93,909 77,070 39,364 27,418 8,444 6,050 3,903 377,439
Joint group training programme - - 2,533 2,052 - - - - 4,585Total 586,841 457,605 372,376 201,065 131,060 39,780 29,926 18,855 1,837,5082016-17National Skills and Workforce
Development SPP 472,026 370,283 297,289 162,992 104,635 31,397 24,236 15,113 1,477,971National Partnership payments
Building Australia's Future WorkforceSkills reform 165,910 128,466 105,430 53,849 37,507 11,551 8,276 5,339 516,328
Joint group training programme - - - - - - - - -Total 637,936 498,749 402,719 216,841 142,142 42,948 32,512 20,452 1,994,2992017-18National Skills and Workforce
Development SPP 478,705 377,055 301,861 166,432 105,647 31,450 24,598 15,280 1,501,028National Partnership payments
Building Australia's Future WorkforceSkills reform - - - - - - - - -
Joint group training programme - - - - - - - - -Total 478,705 377,055 301,861 166,432 105,647 31,450 24,598 15,280 1,501,0282018-19National Skills and Workforce
Development SPP 485,464 383,912 306,388 169,925 106,644 31,483 24,953 15,449 1,524,218National Partnership payments
Building Australia's Future WorkforceSkills reform - - - - - - - - -
Joint group training programme - - - - - - - - -Total 485,464 383,912 306,388 169,925 106,644 31,483 24,953 15,449 1,524,218

Attachm
ent D: A
nnex A (online only)
19
Table A.4: Estimated payments to support state community services, by year and state $'000 NSW VIC QLD WA SA TAS ACT NT Total2015-16National Disability SPP 461,246 360,325 290,060 158,170 102,682 31,045 23,655 14,813 1,441,996National Partnership payments
Assistance to States for DisabilityCareAustralia(a) nfp nfp nfp nfp nfp nfp nfp nfp nfp
Assisting preparation towards the launch ofthe National Disability Insurance Scheme - - - - - 616 - - 616
Home and Community Care - 433,785 - 185,154 - - - - 618,939Launch of My Way sites - - - 46,246 - - - - 46,246National Occasional Care Programme - 1,168 - 534 318 - - - 2,020Northern Territory remote Aboriginal investment
Community safety component - - - - - - - 72,992 72,992Municipal and essential services component - - - - - - - 154,821 154,821
Pay equity for the social and communityservices sector 16,770 27,939 61,012 30,994 12,900 2,679 4,008 2,208 158,510
Transitioning responsibilites for aged careand disability services - specialist
disability services - - - - - - - - -Total 478,016 823,217 351,072 421,098 115,900 34,340 27,663 244,834 2,496,140 (a) Access to the DisabilityCare Australia Fund will be determined through negotiations between the Commonwealth and the States. The maximum amount of funding
available to the States is set out in the DisabilityCare Australia Fund Act 2013.

Attachm
ent D: A
nnex A (online only)
20
Table A.4: Estimated payments to support state community services, by year and state (continued) $'000 NSW VIC QLD WA SA TAS ACT NT Total2016-17National Disability SPP 476,537 373,821 300,130 164,550 105,635 31,697 24,468 15,257 1,492,095National Partnership payments
Assistance to States for DisabilityCareAustralia(a) nfp nfp nfp nfp nfp nfp nfp nfp nfp
Assisting preparation towards the launch ofthe National Disability Insurance Scheme - - - - - - - - -
Home and Community Care(b) - - - nfp - - - - nfpLaunch of My Way sites - - - - - - - - -National Occasional Care Programme - 1,186 - 543 323 - - - 2,052Northern Territory remote Aboriginal investment
Community safety component - - - - - - - 65,833 65,833Municipal and essential services component - - - - - - - - -
Pay equity for the social and communityservices sector 25,604 46,767 42,272 25,313 9,862 4,311 2,603 1,668 158,400
Transitioning responsibilites for aged careand disability services - specialist
disability services(c) ~ ~ ~ ~ ~ ~ ~ ~ 251,024Total 502,141 421,774 342,402 190,406 115,820 36,008 27,071 82,758 1,969,404 (a) Access to the DisabilityCare Australia Fund will be determined through negotiations between the Commonwealth and the States. The maximum amount of funding
available to the States is set out in the DisabilityCare Australia Fund Act 2013. (b) Funding for 2016-17 is provisioned for in the Contingency Reserve subject to negotiations. (c) Payments relating to the transition of responsibilities for aged care and disability services, including the budget neutral adjustment, are subject to negotiations and
will be finalised as part of the transition to the National Disability Insurance Scheme.

Attachm
ent D: A
nnex A (online only)
21
Table A.4: Estimated payments to support state community services, by year and state (continued) $'000 NSW VIC QLD WA SA TAS ACT NT Total2017-18National Disability SPP 494,280 389,323 311,682 171,847 109,085 32,473 25,398 15,777 1,549,865National Partnership payments
Assistance to States for DisabilityCareAustralia(a) nfp nfp nfp nfp nfp nfp nfp nfp nfp
Assisting preparation towards the launch ofthe National Disability Insurance Scheme - - - - - - - - -
Home and Community Care(b) - - - nfp - - - - nfpLaunch of My Way sites - - - - - - - - -National Occasional Care Programme - 1,207 - 552 329 - - - 2,088Northern Territory remote Aboriginal investment
Community safety component - - - - - - - 62,145 62,145Municipal and essential services component - - - - - - - - -
Pay equity for the social and communityservices sector 32,483 59,918 49,253 32,645 12,584 5,420 3,311 2,100 197,714
Transitioning responsibilites for aged careand disability services - specialist
disability services(c) ~ ~ ~ ~ ~ ~ ~ ~ 264,757Total 526,763 450,448 360,935 205,044 121,998 37,893 28,709 80,022 2,076,569 (a) Access to the DisabilityCare Australia Fund will be determined through negotiations between the Commonwealth and the States. The maximum amount of funding
available to the States is set out in the DisabilityCare Australia Fund Act 2013. (b) Funding for 2017-18 is provisioned for in the Contingency Reserve subject to negotiations. (c) Payments relating to the transition of responsibilities for aged care and disability services, including the budget neutral adjustment, are subject to negotiations and
will be finalised as part of the transition to the National Disability Insurance Scheme.

22
Attachm
ent D: A
nnex A (online only)
Table A.4: Estimated payments to support state community services, by year and state (continued) $'000 NSW VIC QLD WA SA TAS ACT NT Total2018-19National Disability SPP(a) 513,809 406,326 324,276 179,846 112,870 33,321 26,410 16,351 1,613,209National Partnership payments
Assistance to States for DisabilityCareAustralia(b) nfp nfp nfp nfp nfp nfp nfp nfp nfp
Assisting preparation towards the launch ofthe National Disability Insurance Scheme - - - - - - - - -
Home and Community Care(c) - - - nfp - - - - nfpLaunch of My Way sites - - - - - - - - -National Occasional Care Programme - - - - - - - - -Northern Territory remote Aboriginal investment
Community safety component - - - - - - - 53,938 53,938Municipal and essential services component - - - - - - - - -
Pay equity for the social and communityservices sector 39,895 74,329 56,809 40,760 15,549 6,598 4,077 2,559 240,576
Transitioning responsibilites for aged careand disability services - specialist
disability services(d) ~ ~ ~ ~ ~ ~ ~ ~ 278,593Total 553,704 480,655 381,085 220,606 128,419 39,919 30,487 72,848 2,186,316 (a) The Commonwealth and New South Wales have agreed that there will be a process to cease the National Disability SPP for New South Wales from 1 July 2018,
coinciding with the full implementation of the National Disability Insurance Scheme in that state. (b) Access to the DisabilityCare Australia Fund will be determined through negotiations between the Commonwealth and the States. The maximum amount of funding
available to the States is set out in the DisabilityCare Australia Fund Act 2013. (c) Funding for 2018-19 is provisioned for in the Contingency Reserve subject to negotiations. (d) Payments relating to the transition of responsibilities for aged care and disability services, including the budget neutral adjustment, are subject to negotiations and
will be finalised as part of the transition to the National Disability Insurance Scheme.

23
Attachm
ent D: A
nnex A (online only)
Table A.5: Estimated payments to support state affordable housing services, by year and state $'000 NSW VIC QLD WA SA TAS ACT NT Total2015-16National Affordable Housing SPP 423,520 330,853 266,335 145,233 94,283 28,506 21,720 13,602 1,324,052National Partnership payments
First Home Owners Boost(a) 2 -230 - 61 -88 -14 - - -269Homelessness 30,020 22,790 28,710 14,970 8,870 2,800 1,520 5,320 115,000Northern Territory remote Aboriginal investment
Remote Australia strategies component - - - - - - - 55,953 55,953Remote Indigenous housing 16,345 - 149,374 143,001 18,722 - - 66,552 393,994
Total 469,887 353,413 444,419 303,265 121,787 31,292 23,240 141,427 1,888,7302016-17National Affordable Housing SPP 429,211 336,696 270,324 148,208 95,145 28,549 22,038 13,742 1,343,913National Partnership payments
First Home Owners Boost - - - - - - - - -Homelessness 30,020 22,790 28,710 14,970 8,870 2,800 1,520 5,320 115,000Northern Territory remote Aboriginal investment
Remote Australia strategies component - - - - - - - 49,692 49,692Remote Indigenous housing 15,520 - 128,266 97,429 14,374 - - 150,954 406,543
Total 474,751 359,486 427,300 260,607 118,389 31,349 23,558 219,708 1,915,148 (a) Recoveries of funds due to compliance activities by states are expected to exceed new payments, resulting in an overall negative balance for some states.

24
Attachm
ent D: A
nnex A (online only)
Table A.5: Estimated payments to support state affordable housing services, by year and state (continued) $'000 NSW VIC QLD WA SA TAS ACT NT Total2017-18National Affordable Housing SPP 435,025 342,652 274,319 151,247 96,008 28,580 22,354 13,886 1,364,071National Partnership payments
First Home Owners Boost - - - - - - - - -Homelessness - - - - - - - - -Northern Territory remote Aboriginal investment
Remote Australia strategies component - - - - - - - 50,924 50,924Remote Indigenous housing 16,178 - 111,716 84,424 12,431 - - 137,104 361,853
Total 451,203 342,652 386,035 235,671 108,439 28,580 22,354 201,914 1,776,8482018-19National Affordable Housing SPP 440,976 348,728 278,309 154,352 96,870 28,598 22,666 14,033 1,384,532National Partnership payments
First Home Owners Boost - - - - - - - - -Homelessness - - - - - - - - -Northern Territory remote Aboriginal investment
Remote Australia strategies component - - - - - - - 3,568 3,568Remote Indigenous housing - - - - - - - - -
Total 440,976 348,728 278,309 154,352 96,870 28,598 22,666 17,601 1,388,100

25
Attachm
ent D: A
nnex A (online only)
Table A.6: Estimated payments to support state infrastructure services, by year and state $'000 NSW VIC QLD WA SA TAS ACT NT Total2015-16National Partnership payments(a)
Infrastructure Investment Programme(b)Black spot projects 19,583 16,396 14,190 7,490 3,516 2,441 653 2,270 66,539Bridges Renewal Programme(c) 19,193 14,992 12,069 6,581 4,272 1,292 984 617 60,000Developing Northern Australia(c)
Improving cattle supply chains - - - - - - - - -Northern Australia Roads - - 18,792 10,248 - - - 960 30,000
Heavy vehicle safety and productivity 27,377 5,562 4,881 7,445 9,997 762 276 3,173 59,473Improving the national network(d) - - - - 410 - - - 410Investment
Rail 103,976 7,333 102,000 - 250 16,500 - - 230,059Road 1,367,636 472,229 1,042,102 461,064 167,781 92,765 1,385 99,723 3,704,685Supplementary(d) - - - 2,975 - - - - 2,975
Roads to Recovery 166,582 134,966 147,890 103,086 61,103 21,425 7,377 20,490 662,919Infrastructure Growth Package –
Asset Recycling Fund(e)Asset Recycling Initiative(f) ~ ~ ~ ~ ~ ~ ~ ~ 1,028,000New Investments 133,514 102,380 271,896 164,875 128,080 20,677 10,411 55,906 887,739Western Sydney Infrastructure Plan 192,235 - - - - - - - 192,235
Building Australia FundRail - - - - 102,000 - - - 102,000Road - - - - - - 6,920 - 6,920
Centenary of Canberra 2013 –A gift to the national capital - - - - - - 8,000 - 8,000
Drought Communities Programme 4,000 - 16,000 - - - - - 20,000Interstate road transport 32,738 19,049 6,745 2,819 8,586 355 355 355 71,002Latrobe Valley economic diversification - 6,050 - - - - - - 6,050Murray-Darling Basin regional economic
diversification programme 15,000 7,815 4,704 - - - - - 27,519Total 2,081,834 786,772 1,641,269 766,583 485,995 156,217 36,361 183,494 7,166,525

26
Attachm
ent D: A
nnex A (online only)
Table A.6: Estimated payments to support state infrastructure services, by year and state (continued) $'000 NSW VIC QLD WA SA TAS ACT NT Total2015-16Memorandum item – payments direct to local
governments included in payments aboveInfrastructure Investment Programme(b)
InvestmentSupplementary(d) - - - 2,975 - - - - 2,975
Roads to Recovery 165,386 134,950 147,890 103,086 47,303 21,425 - 12,085 632,125Infrastructure Growth Package –
Asset Recycling FundNew Investments 96,800 71,200 71,200 51,200 24,140 11,400 - 5,600 331,540
Drought Communities Programme 4,000 - 16,000 - - - - - 20,000Latrobe Valley economic diversification - 5,400 - - - - - - 5,400
Total 266,186 211,550 235,090 157,261 71,443 32,825 - 17,685 992,040 (a) The Fuel Indexation (Road Funding) special account was established with effect from 1 July 2014. Payment amounts to the States for 2014-15 will be finalised by
the Infrastructure Minister following a determination on the net additional revenue from fuel indexation by the Treasurer. Payments from this special account will be reflected in the 2016-17 Budget and onwards.
(b) State allocations do not include the impact of the Government’s new Infrastructure Investment commitments ($999m) or the offset for the freeze in the Road User Charge collections at the 2015-16 level ($118m).
(c) Some amounts within some programmes are yet to be allocated. These amounts have been notionally allocated on an equal per capita basis between the relevant States.
(d) Figures represent expenses incurred against prepayments made to the States in prior years. (e) The Government remains committed to the establishment of an Asset Recycling Fund. Currently, all payments to the States for the Infrastructure Growth Package
are paid through the COAG Reform Fund. (f) State allocations have not been determined for payments under the Asset Recycling Initiative. Projects will be agreed between the Commonwealth and individual
states on a first-come, first-served basis, until the total amount of funding available under this measure is exhausted.

27
Attachm
ent D: A
nnex A (online only)
Table A.6: Estimated payments to support state infrastructure services, by year and state (continued) $'000 NSW VIC QLD WA SA TAS ACT NT Total2016-17National Partnership payments(a)
Infrastructure Investment Programme(b)Black spot projects 19,199 13,666 12,178 6,585 4,800 1,606 966 1,000 60,000Bridges Renewal Programme(c) 25,549 20,043 16,092 8,823 5,663 1,700 1,312 818 80,000Developing Northern Australia(c)
Improving cattle supply chains - - 21,924 11,956 - - - 1,120 35,000Northern Australia Roads - - 62,534 34,286 - - - 3,180 100,000
Heavy vehicle safety and productivity(c) 20,628 16,182 12,993 7,123 4,573 1,372 1,059 660 64,590Improving the national network - - - - - - - - -Investment
Rail - 22,000 99,996 - - 15,000 - - 136,996Road(c) 2,606,613 349,073 1,926,789 436,836 179,753 121,646 681 41,708 5,663,099Supplementary - - - - - - - - -
Roads to Recovery 321,713 234,994 234,932 169,036 103,908 37,626 18,531 33,652 1,154,392Infrastructure Growth Package –
Asset Recycling Fund(d)Asset Recycling Initiative(e) ~ ~ ~ ~ ~ ~ ~ ~ 1,317,087New Investments 45,999 45,832 228,297 303,475 166,300 3,556 1,610 28,667 823,736Western Sydney Infrastructure Plan 299,625 - - - - - - - 299,625
Building Australia FundRail - - - - 130,100 - - - 130,100Road - - - - - - - - -
Centenary of Canberra 2013 –A gift to the national capital - - - - - - - - -
Drought Communities Programme 1,000 - 4,000 - - - - - 5,000Interstate road transport 32,738 19,049 6,745 2,819 8,586 355 355 355 71,002Latrobe Valley economic diversification - - - - - - - - -Murray-Darling Basin regional economic
diversification programme 12,573 6,331 3,802 - - - - - 22,706Total 3,385,637 727,170 2,630,282 980,939 603,683 182,861 24,514 111,160 9,963,333

28
Attachm
ent D: A
nnex A (online only)
Table A.6: Estimated payments to support state infrastructure services, by year and state (continued) $'000 NSW VIC QLD WA SA TAS ACT NT Total2016-17Memorandum item – payments direct to local
governments included in payments aboveInfrastructure Investment Programme(b)
InvestmentSupplementary - - - - - - - - -
Roads to Recovery 319,359 234,982 234,932 169,036 79,717 37,626 - 18,531 1,094,183Infrastructure Growth Package –
Asset Recycling FundNew Investments - - - - - - - - -
Drought Communities Programme 1,000 - 4,000 - - - - - 5,000Latrobe Valley economic diversification - - - - - - - - -
Total 320,359 234,982 238,932 169,036 79,717 37,626 - 18,531 1,099,183 (a) The Fuel Indexation (Road Funding) special account was established with effect from 1 July 2014. Payments from this special account will be reflected in the
2016-17 Budget and onwards. (b) State allocations do not include the impact of the Government’s new Infrastructure Investment commitments ($999m) or the offset for the freeze in the Road User
Charge collections at the 2015-16 level ($118m). (c) Some amounts within some programmes are yet to be allocated. These amounts have been notionally allocated on an equal per capita basis between the relevant
States. (d) The Government remains committed to the establishment of an Asset Recycling Fund. Currently, all payments to the States for the Infrastructure Growth Package
are paid through the COAG Reform Fund. (e) State allocations have not been determined for payments under the Asset Recycling Initiative. Projects will be agreed between the Commonwealth and individual
states on a first-come, first-served basis, until the total amount of funding available under this measure is exhausted.

29
Attachm
ent D: A
nnex A (online only)
Table A.6: Estimated payments to support state infrastructure services, by year and state (continued) $'000 NSW VIC QLD WA SA TAS ACT NT Total2017-18National Partnership payments(a)
Infrastructure Investment Programme(b)Black spot projects 19,199 13,666 12,178 6,585 4,800 1,606 966 1,000 60,000Bridges Renewal Programme(c) 28,701 22,608 18,100 9,979 6,334 1,886 1,475 917 90,000Developing Northern Australia(c)
Improving cattle supply chains - - 21,888 12,000 - - - 1,112 35,000Northern Australia Roads - - 131,088 72,276 - - - 6,636 210,000
Heavy vehicle safety and productivity(c) 15,946 12,560 10,056 5,544 3,519 1,047 820 508 50,000Improving the national network - - - - - - - - -Investment
Rail - 15,000 - - - 14,300 - - 29,300Road(c) 1,529,610 322,604 1,605,163 369,952 225,328 39,487 2,287 17,819 4,112,250Supplementary - - - - - - - - -
Roads to Recovery 97,516 71,219 71,200 51,200 31,480 11,400 5,600 10,200 349,815Infrastructure Growth Package –
Asset Recycling Fund(d)Asset Recycling Initiative(e) ~ ~ ~ ~ ~ ~ ~ ~ 937,000New Investments 30,000 3,630 245,900 304,900 122,000 - - 11,400 717,830Western Sydney Infrastructure Plan 534,700 - - - - - - - 534,700
Building Australia FundRail - - - - - - - - -Road - - - - - - - - -
Centenary of Canberra 2013 –A gift to the national capital - - - - - - - - -
Drought Communities Programme 1,000 - 4,000 - - - - - 5,000Interstate road transport 32,738 19,049 6,745 2,819 8,586 355 355 355 71,002Latrobe Valley economic diversification - - - - - - - - -Murray-Darling Basin regional economic
diversification programme - - - - - - - - -Total 2,289,410 480,336 2,126,318 835,255 402,047 70,081 11,503 49,947 7,201,897

30
Attachm
ent D: A
nnex A (online only)
Table A.6: Estimated payments to support state infrastructure services, by year and state (continued) $'000 NSW VIC QLD WA SA TAS ACT NT Total2017-18Memorandum item – payments direct to local
governments included in payments aboveInfrastructure Investment Programme(b)
InvestmentSupplementary - - - - - - - - -
Roads to Recovery 96,800 71,219 71,200 51,200 24,140 11,400 - 5,600 331,559Infrastructure Growth Package –
Asset Recycling FundNew Investments - - - - - - - - -
Drought Communities Programme 1,000 - 4,000 - - - - - 5,000Latrobe Valley economic diversification - - - - - - - - -
Total 97,800 71,219 75,200 51,200 24,140 11,400 - 5,600 336,559 (a) The Fuel Indexation (Road Funding) special account was established with effect from 1 July 2014. Payments from this special account will be reflected in the
2016-17 Budget and onwards. (b) State allocations do not include the impact of the Government’s new Infrastructure Investment commitments ($999m) or the offset for the freeze in the Road User
Charge collections at the 2015-16 level ($118m). (c) Some amounts within some programmes are yet to be allocated. These amounts have been notionally allocated on an equal per capita basis between the relevant
States. (d) The Government remains committed to the establishment of an Asset Recycling Fund. Currently, all payments to the States for the Infrastructure Growth Package
are paid through the COAG Reform Fund. (e) State allocations have not been determined for payments under the Asset Recycling Initiative. Projects will be agreed between the Commonwealth and individual
states on a first-come, first-served basis, until the total amount of funding available under this measure is exhausted.

31
Attachm
ent D: A
nnex A (online only)
Table A.6: Estimated payments to support state infrastructure services, by year and state (continued) $'000 NSW VIC QLD WA SA TAS ACT NT Total2018-19National Partnership payments(a)
Infrastructure Investment Programme(b)Black spot projects 19,199 13,666 12,178 6,585 4,800 1,606 966 1,000 60,000Bridges Renewal Programme(c) 22,297 17,631 14,071 7,803 4,897 1,446 1,146 709 70,000Developing Northern Australia(c)
Improving cattle supply chains - - 18,726 10,326 - - - 948 30,000Northern Australia Roads - - 121,494 67,380 - - - 6,126 195,000
Heavy vehicle safety and productivity(c) 12,741 10,075 8,041 4,459 2,798 826 655 405 40,000Improving the national network - - - - - - - - -Investment
Rail - 3,000 - - - 14,000 - - 17,000Road(c) 653,512 172,041 1,011,597 248,659 171,495 48,939 1,876 17,561 2,325,680Supplementary - - - - - - - - -
Roads to Recovery 112,187 71,219 71,200 51,200 31,480 11,400 5,600 10,200 364,486Infrastructure Growth Package –
Asset Recycling Fund(d)Asset Recycling Initiative(e) ~ ~ ~ ~ ~ ~ ~ ~ 910,000New Investments 13,350 - - 198,100 32,790 - - 4,000 248,240Western Sydney Infrastructure Plan 553,650 - - - - - - - 553,650
Building Australia FundRail - - - - - - - - -Road - - - - - - - - -
Centenary of Canberra 2013 –A gift to the national capital - - - - - - - - -
Drought Communities Programme - - 5,000 - - - - - 5,000Interstate road transport 32,738 19,049 6,745 2,819 8,586 355 355 355 71,002Latrobe Valley economic diversification - - - - - - - - -Murray-Darling Basin regional economic
diversification programme - - - - - - - - -Total 1,419,674 306,681 1,269,052 597,331 256,846 78,572 10,598 41,304 4,890,058

32
Attachm
ent D: A
nnex A (online only)
Table A.6: Estimated payments to support state infrastructure services, by year and state (continued) $'000 NSW VIC QLD WA SA TAS ACT NT Total2018-19Memorandum item – payments direct to local
governments included in payments aboveInfrastructure Investment Programme(b)
InvestmentSupplementary - - - - - - - - -
Roads to Recovery 111,471 71,212 71,200 51,200 24,140 11,400 - 5,600 346,223Infrastructure Growth Package –
Asset Recycling FundNew Investments - - - - - - - - -
Drought Communities Programme - - 5,000 - - - - - 5,000Latrobe Valley economic diversification - - - - - - - - -
Total 111,471 71,212 76,200 51,200 24,140 11,400 - 5,600 351,223 (a) The Fuel Indexation (Road Funding) special account was established with effect from 1 July 2014. Payments from this special account will be reflected in the
2016-17 Budget and onwards. (b) State allocations do not include the impact of the Government’s new Infrastructure Investment commitments ($999m) or the offset for the freeze in the Road User
Charge collections at the 2015-16 level ($118m). (c) Some amounts within some programmes are yet to be allocated. These amounts have been notionally allocated on an equal per capita basis between the relevant
States. (d) The Government remains committed to the establishment of an Asset Recycling Fund. Currently, all payments to the States for the Infrastructure Growth Package
are paid through the COAG Reform Fund. (e) State allocations have not been determined for payments under the Asset Recycling Initiative. Projects will be agreed between the Commonwealth and individual
states on a first-come, first-served basis, until the total amount of funding available under this measure is exhausted.

33
Attachm
ent D: A
nnex A (online only)
Table A.7: Estimated payments to support state environment services, by year and state $'000 NSW VIC QLD WA SA TAS ACT NT Total2015-16National Partnership payments
Environmental management of the formerRum Jungle mine site - - - - - - - 4,295 4,295
Established Pest and Weed Management(a) 1,628 1,458 1,565 1,459 812 157 32 389 7,500Great Artesian Basin Sustainability Initiative 2,500 - 2,500 - 1,000 - - - 6,000Implementation of the National Insurance
Affordability Initiative - - 11,980 - - - - - 11,980Implementing Water Reform in the
Murray-Darling Basin 9,402 6,800 1,985 - 1,486 - 327 - 20,000Mechanical Fuel Load Reduction Trial 1,000 - - - - - - - 1,000National Bushfire Mitigation Programme 2,190 900 300 300 450 450 300 300 5,190National Urban Water and Desalination Plan - - - - 5,500 - - - 5,500National Water Security Plan for Cities
and Towns 2,945 - - - - - - - 2,945Natural disaster resilience 10,179 6,264 9,003 4,698 4,176 1,958 1,958 1,305 39,541Pest and disease eradication(b) 348 1,658 14,883 - 523 - - 2,588 20,000Pest animal and weed management in
drought-affected areas(a) 3,000 500 10,000 500 1,000 - - - 15,000South Australian River Murray
Sustainability ProgrammeIrrigation efficiency and water purchase - - - - 45,000 - - - 45,000Irrigation industry assistance - - - - 28,000 - - - 28,000Regional economic development - - - - 11,500 - - - 11,500
Sustainable Rural Water Use andInfrastructure Programme 218,647 249,999 21,049 671 29,780 41,641 3,320 240 565,347

34
Attachm
ent D: A
nnex A (online only)
Table A.7: Estimated payments to support state environment services, by year and state (continued) $'000 NSW VIC QLD WA SA TAS ACT NT Total2015-16
Water Infrastructure Development Fund –Capital component - - - - - - - - -Feasibility studies(c) ~ ~ ~ ~ ~ ~ ~ ~ 13,000
Water for the Environment Special Account –Constraints Management(a) 2,358 1,669 - - 830 - - - 4,857
Whale and dolphin entanglements 12 12 12 12 12 12 - 12 87World Heritage Values of the Tasmanian
Wilderness - - - - - 5,170 - - 5,170Total 254,209 269,260 73,277 7,640 130,069 49,388 5,937 9,129 811,912Memorandum item – payments direct to local
governments included in payments aboveNational Urban Water and Desalination Plan - - - - 5,500 - - - 5,500
Total - - - - 5,500 - - - 5,500 (a) Amounts for each state are notional only and are subject to further negotiations. (b) Funding is allocated to each state based on 2014-15 data and represents indicative estimates only. This funding is conditional on agreed national responses to pest
or disease incursions. (c) State allocations are yet to be finalised.

35
Attachm
ent D: A
nnex A (online only)
Table A.7: Estimated payments to support state environment services, by year and state (continued) $'000 NSW VIC QLD WA SA TAS ACT NT Total2016-17National Partnership payments
Environmental management of the formerRum Jungle mine site - - - - - - - - -
Established Pest and Weed Management(a) 1,086 972 1,044 972 541 105 21 259 5,000Great Artesian Basin Sustainability Initiative 3,750 - 3,750 - 1,500 - - - 9,000Implementation of the National Insurance
Affordability Initiative - - - - - - - - -Implementing Water Reform in the
Murray-Darling Basin 9,402 6,800 1,985 - 1,486 - 327 - 20,000Mechanical Fuel Load Reduction Trial 500 - - - - - - - 500National Bushfire Mitigation Programme 1,508 898 299 299 449 449 299 299 4,500National Urban Water and Desalination Plan - - - - 2,100 - - - 2,100National Water Security Plan for Cities
and Towns - - - - - - - - -Natural disaster resilience 6,786 4,176 6,003 3,132 2,088 1,305 1,305 1,305 26,100Pest and disease eradication(b) 250 480 16,662 - 135 - - 2,473 20,000Pest animal and weed management in
drought-affected areas(a) 1,000 - 2,000 500 500 - - - 4,000South Australian River Murray
Sustainability ProgrammeIrrigation efficiency and water purchase - - - - 23,500 - - - 23,500Irrigation industry assistance - - - - 39,500 - - - 39,500Regional economic development - - - - 2,000 - - - 2,000
Sustainable Rural Water Use andInfrastructure Programme 102,484 200,668 35,621 - 59,985 18,000 27,000 - 443,758

36
Attachm
ent D: A
nnex A (online only)
Table A.7: Estimated payments to support state environment services, by year and state (continued) $'000 NSW VIC QLD WA SA TAS ACT NT Total2016-17
Water Infrastructure Development Fund –Capital component - - - - - - - - -Feasibility studies(c) ~ ~ ~ ~ ~ ~ ~ ~ 10,000
Water for the Environment Special Account –Constraints Management(c) ~ ~ ~ ~ ~ ~ ~ ~ 5,143
Whale and dolphin entanglements 32 32 32 32 32 32 - 32 223World Heritage Values of the Tasmanian
Wilderness - - - - - 1,780 - - 1,780Total 126,798 214,026 67,396 4,935 133,816 21,671 28,952 4,368 617,104Memorandum item – payments direct to local
governments included in payments aboveNational Urban Water and Desalination Plan - - - - 2,100 - - - 2,100
Total - - - - 2,100 - - - 2,100 (a) Amounts for each state are notional only and are subject to further negotiations. (b) Funding is allocated to each state based on 2014-15 data and represents indicative estimates only. This funding is conditional on agreed national responses to pest
or disease incursions. (c) State allocations are yet to be finalised.

37
Attachm
ent D: A
nnex A (online only)
Table A.7: Estimated payments to support state environment services, by year and state (continued) $'000 NSW VIC QLD WA SA TAS ACT NT Total2017-18National Partnership payments
Environmental management of the formerRum Jungle mine site - - - - - - - - -
Established Pest and Weed Management(a) 1,086 972 1,044 972 541 105 21 259 5,000Great Artesian Basin Sustainability Initiative - - - - - - - - -Implementation of the National Insurance
Affordability Initiative - - - - - - - - -Implementing Water Reform in the
Murray-Darling Basin 9,402 6,800 1,985 - 1,486 - 327 - 20,000Mechanical Fuel Load Reduction Trial - - - - - - - - -National Bushfire Mitigation Programme - - - - - - - - -National Urban Water and Desalination Plan - - - - - - - - -National Water Security Plan for Cities
and Towns - - - - - - - - -Natural disaster resilience(b) nfp nfp nfp nfp nfp nfp nfp nfp nfpPest and disease eradication(c) 250 363 17,217 - 121 - - 2,039 19,990Pest animal and weed management in
drought-affected areas(a) 1,000 - 2,000 500 500 - - - 4,000South Australian River Murray
Sustainability ProgrammeIrrigation efficiency and water purchase - - - - 8,500 - - - 8,500Irrigation industry assistance - - - - 25,000 - - - 25,000Regional economic development - - - - - - - - -
Sustainable Rural Water Use andInfrastructure Programme 69,973 77,814 31,700 - - - 30,000 - 209,487

38
Attachm
ent D: A
nnex A (online only)
Table A.7: Estimated payments to support state environment services, by year and state (continued) $'000 NSW VIC QLD WA SA TAS ACT NT Total2017-18
Water Infrastructure Development Fund –Capital component(d) ~ ~ ~ ~ ~ ~ ~ ~ 20,000Feasibility studies(d) ~ ~ ~ ~ ~ ~ ~ ~ 5,000
Water for the Environment Special Account –Constraints Management(d) ~ ~ ~ ~ ~ ~ ~ ~ 10,000
Whale and dolphin entanglements - - - - - - - - -World Heritage Values of the Tasmanian
Wilderness - - - - - 1,663 - - 1,663Total 81,711 85,949 53,946 1,472 36,148 1,768 30,348 2,298 328,640Memorandum item – payments direct to local
governments included in payments aboveNational Urban Water and Desalination Plan - - - - - - - - -
Total - - - - - - - - - (a) Amounts for each state are notional only and are subject to further negotiations. (b) Funding from 2017-18 has been provided for in the Contingency Reserve. (c) Funding is allocated to each state based on 2014-15 data and represents indicative estimates only. This funding is conditional on agreed national responses to pest
or disease incursions. (d) State allocations are yet to be finalised.

39
Attachm
ent D: A
nnex A (online only)
Table A.7: Estimated payments to support state environment services, by year and state (continued) $'000 NSW VIC QLD WA SA TAS ACT NT Total2018-19National Partnership payments
Environmental management of the formerRum Jungle mine site - - - - - - - - -
Established Pest and Weed Management(a) 1,086 972 1,044 972 541 105 21 259 5,000Great Artesian Basin Sustainability Initiative - - - - - - - - -Implementation of the National Insurance
Affordability Initiative - - - - - - - - -Implementing Water Reform in the
Murray-Darling Basin 9,402 6,800 1,985 - 1,486 - 327 - 20,000Mechanical Fuel Load Reduction Trial - - - - - - - - -National Bushfire Mitigation Programme - - - - - - - - -National Urban Water and Desalination Plan - - - - - - - - -National Water Security Plan for Cities
and Towns - - - - - - - - -Natural disaster resilience(b) nfp nfp nfp nfp nfp nfp nfp nfp nfpPest and disease eradication(c) 277 384 17,212 - 100 - - 2,000 19,973Pest animal and weed management in
drought-affected areas(a) 500 - 1,000 250 250 - - - 2,000South Australian River Murray
Sustainability ProgrammeIrrigation efficiency and water purchase - - - - - - - - -Irrigation industry assistance - - - - 10,000 - - - 10,000Regional economic development - - - - - - - - -
Sustainable Rural Water Use andInfrastructure Programme - 42,322 17,037 - - 7,572 17,671 - 84,602

40
Attachm
ent D: A
nnex A (online only)
Table A.7: Estimated payments to support state environment services, by year and state (continued) $'000 NSW VIC QLD WA SA TAS ACT NT Total2018-19
Water Infrastructure Development Fund –Capital component(d) ~ ~ ~ ~ ~ ~ ~ ~ 50,000Feasibility studies(d) ~ ~ ~ ~ ~ ~ ~ ~ 7,000
Water for the Environment Special Account –Constraints Management(d) ~ ~ ~ ~ ~ ~ ~ ~ 20,000
Whale and dolphin entanglements - - - - - - - - -World Heritage Values of the Tasmanian
Wilderness - - - - - - - - -Total 11,265 50,478 38,278 1,222 12,377 7,677 18,019 2,259 218,575Memorandum item – payments direct to local
governments included in payments aboveNational Urban Water and Desalination Plan - - - - - - - - -
Total - - - - - - - - - (a) Amounts for each state are notional only and are subject to further negotiations. (b) Funding from 2017-18 has been provided for in the Contingency Reserve. (c) Funding is allocated to each state based on 2014-15 data and represents indicative estimates only. This funding is conditional on agreed national responses to pest
or disease incursions. (d) State allocations are yet to be finalised.

41
Attachm
ent D: A
nnex A (online only)
Table A.8: Estimated contingent payments to the states, by year and state $'000 NSW VIC QLD WA SA TAS ACT NT Total2015-16National Partnership payments
Hepatitis C settlement fund 540 - - 50 100 - 50 - 740Natural Disaster Relief and Recovery
Arrangements 2,330 1,638 33,606 334 76 2 - 2,193 40,179Total 2,870 1,638 33,606 384 176 2 50 2,193 40,9192016-17National Partnership payments
Hepatitis C settlement fund - - - - - - - - -Natural Disaster Relief and Recovery
Arrangements 21 1 6,915 46 1 - - 1,452 8,436Total 21 1 6,915 46 1 - - 1,452 8,4362017-18National Partnership payments
Hepatitis C settlement fund - - - - - - - - -Natural Disaster Relief and Recovery
Arrangements - - 2,862 6 - - - 579 3,447Total - - 2,862 6 - - - 579 3,4472018-19National Partnership payments
Hepatitis C settlement fund - - - - - - - - -Natural Disaster Relief and Recovery
Arrangements - - - - - - - - -Total - - - - - - - - -

42
Attachm
ent D: A
nnex A (online only)
Table A.9: Estimated payments to support other state services, by year and state $'000 NSW VIC QLD WA SA TAS ACT NT Total2015-16National Partnership payments
2014 G20 leaders' summit security - - 1,600 - - - - - 1,600Developing demand-driver infrastructure for the
tourism industry 2,379 3,637 3,601 1,388 989 775 775 775 14,319Financial assistance grants(a)
General purpose financial assistance 253,828 197,494 159,383 86,603 56,751 17,287 13,006 8,195 792,547Untied local roads grants 102,033 72,503 65,891 53,772 19,327 18,636 11,277 8,238 351,677
Heffron Park Centre of Excellence 5,000 - - - - - - - 5,000Legal assistance services 74,648 57,578 50,059 29,022 19,483 7,274 5,788 7,090 250,942Managing Farm Risk Programme(b) 2,113 204 1,860 841 745 44 15 1,478 7,300National Register of Foreign Ownership of
Land Titles(c) ~ ~ ~ ~ ~ ~ ~ ~ 16,000North Queensland Strata Title Inspection
Scheme - - 6,250 - - - - - 6,250Provision of fire services 4,264 3,003 3,025 1,350 1,007 264 5,114 1,633 19,660Sinking fund on state debt 20 .. - - - - - - 20Tasmanian Horticulture Market Growth - - - - - 50 - - 50
Total 444,285 334,419 291,669 172,976 98,302 44,330 35,975 27,409 1,465,365 (a) The first two quarterly financial assistance grants for 2015-16 were paid in 2014-15. (b) Amounts for each state are notional only and are subject to further negotiations. (c) State allocations are still to be finalised.
43
Attachm
ent D: A
nnex A (online only)
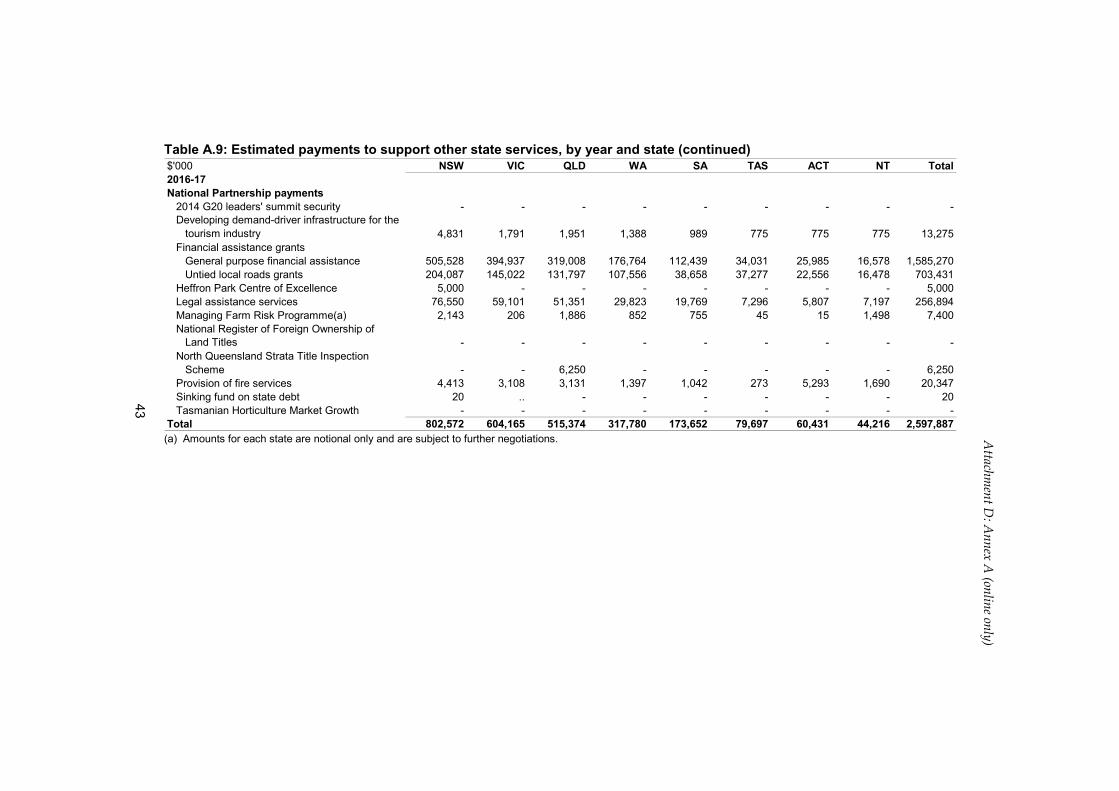
Table A.9: Estimated payments to support other state services, by year and state (continued) $'000 NSW VIC QLD WA SA TAS ACT NT Total2016-17National Partnership payments
2014 G20 leaders' summit security - - - - - - - - -Developing demand-driver infrastructure for the
tourism industry 4,831 1,791 1,951 1,388 989 775 775 775 13,275Financial assistance grants
General purpose financial assistance 505,528 394,937 319,008 176,764 112,439 34,031 25,985 16,578 1,585,270Untied local roads grants 204,087 145,022 131,797 107,556 38,658 37,277 22,556 16,478 703,431
Heffron Park Centre of Excellence 5,000 - - - - - - - 5,000Legal assistance services 76,550 59,101 51,351 29,823 19,769 7,296 5,807 7,197 256,894Managing Farm Risk Programme(a) 2,143 206 1,886 852 755 45 15 1,498 7,400National Register of Foreign Ownership of
Land Titles - - - - - - - - -North Queensland Strata Title Inspection
Scheme - - 6,250 - - - - - 6,250Provision of fire services 4,413 3,108 3,131 1,397 1,042 273 5,293 1,690 20,347Sinking fund on state debt 20 .. - - - - - - 20Tasmanian Horticulture Market Growth - - - - - - - - -
Total 802,572 604,165 515,374 317,780 173,652 79,697 60,431 44,216 2,597,887 (a) Amounts for each state are notional only and are subject to further negotiations.

44
Attachm
ent D: A
nnex A (online only)
Table A.9: Estimated payments to support other state services, by year and state (continued) $'000 NSW VIC QLD WA SA TAS ACT NT Total2017-18National Partnership payments
2014 G20 leaders' summit security - - - - - - - - -Developing demand-driver infrastructure for the
tourism industry 2,379 1,791 1,951 1,387 989 775 775 775 10,822Financial assistance grants
General purpose financial assistance 525,170 412,013 332,804 186,695 116,299 34,963 27,057 17,326 1,652,327Untied local roads grants 212,720 151,156 137,372 112,105 40,294 38,854 23,510 17,175 733,186
Heffron Park Centre of Excellence - - - - - - - - -Legal assistance services 74,339 56,966 50,010 28,746 18,779 6,925 5,609 6,858 248,232Managing Farm Risk Programme(a) 2,143 206 1,886 852 755 45 15 1,498 7,400National Register of Foreign Ownership of
Land Titles - - - - - - - - -North Queensland Strata Title Inspection
Scheme - - - - - - - - -Provision of fire services 4,567 3,217 3,241 1,446 1,078 283 5,478 1,749 21,059Sinking fund on state debt 20 .. - - - - - - 20Tasmanian Horticulture Market Growth - - - - - - - - -
Total 821,338 625,349 527,264 331,231 178,194 81,845 62,444 45,381 2,673,046 (a) Amounts for each state are notional only and are subject to further negotiations.

45
Attachm
ent D: A
nnex A (online only)
Table A.9: Estimated payments to support other state services, by year and state (continued) $'000 NSW VIC QLD WA SA TAS ACT NT Total2018-19National Partnership payments
2014 G20 leaders' summit security - - - - - - - - -Developing demand-driver infrastructure for the
tourism industry - - - - - - - - -Financial assistance grants
General purpose financial assistance 545,818 429,978 347,312 197,191 120,348 35,936 28,183 18,115 1,722,881Untied local roads grants 221,804 157,611 143,238 116,892 42,014 40,513 24,514 17,908 764,494
Heffron Park Centre of Excellence - - - - - - - - -Legal assistance services 75,270 57,849 50,880 29,458 19,013 7,004 5,705 6,991 252,170Managing Farm Risk Programme(a) 2,113 204 1,860 841 745 44 15 1,478 7,300National Register of Foreign Ownership of
Land Titles - - - - - - - - -North Queensland Strata Title Inspection
Scheme - - - - - - - - -Provision of fire services 4,727 3,330 3,354 1,497 1,116 293 5,670 1,810 21,797Sinking fund on state debt 20 .. - - - - - - 20Tasmanian Horticulture Market Growth - - - - - - - - -
Total 849,752 648,972 546,644 345,879 183,236 83,790 64,087 46,302 2,768,662 (a) Amounts for each state are notional only and are subject to further negotiations.

46
Attachm
ent D: A
nnex A (online only)
Table A.10: GST and general revenue assistance payments to the states, by year and state $'000 NSW VIC QLD WA SA TAS ACT NT Total2015-16GST entitlement 17,401,399 12,807,218 13,024,120 1,889,570 5,556,356 2,248,938 1,036,330 3,286,069 57,250,000Other payments
ACT municipal services - - - - - - 38,515 - 38,515Reduced royalties - - - 32,020 - - - - 32,020Royalties(a) - - - nfp - - - nfp 698,769Snowy Hydro Ltd tax compensation 50,000 25,000 - - - - - - 75,000
Total 17,451,399 12,832,218 13,024,120 1,921,590 5,556,356 2,248,938 1,074,845 3,286,069 58,094,3042016-17GST entitlement 18,025,013 13,341,297 14,847,058 1,615,408 6,152,560 2,331,293 1,083,662 3,323,709 60,720,000Other payments
ACT municipal services - - - - - - 39,092 - 39,092Reduced royalties - - - 31,676 - - - - 31,676Royalties(a) - - - nfp - - - nfp 622,749Snowy Hydro Ltd tax compensation 50,000 25,000 - - - - - - 75,000
Total 18,075,013 13,366,297 14,847,058 1,647,084 6,152,560 2,331,293 1,122,754 3,323,709 61,488,5172017-18GST entitlement 18,890,111 14,016,218 16,193,894 1,308,849 6,511,391 2,420,617 1,165,608 3,183,312 63,690,000Other payments
ACT municipal services - - - - - - 39,679 - 39,679Reduced royalties - - - 28,156 - - - - 28,156Royalties(a) - - - nfp - - - nfp 557,705Snowy Hydro Ltd tax compensation 50,000 25,000 - - - - - - 75,000
Total 18,940,111 14,041,218 16,193,894 1,337,005 6,511,391 2,420,617 1,205,287 3,183,312 64,390,5402018-19GST entitlement 19,884,990 14,829,805 16,840,573 1,535,980 6,681,895 2,458,695 1,213,272 3,224,790 66,670,000Other payments
ACT municipal services - - - - - - 40,274 - 40,274Reduced royalties - - - 22,681 - - - - 22,681Royalties(a) - - - nfp - - - nfp 448,421Snowy Hydro Ltd tax compensation 50,000 25,000 - - - - - - 75,000
Total 19,934,990 14,854,805 16,840,573 1,558,661 6,681,895 2,458,695 1,253,546 3,224,790 67,256,376 (a) State allocations are not published due to commercial sensitivities.

47
Attachm
ent D: A
nnex A (online only)
Table A.11: Total payments to the states by GFS function $'000 NSW VIC QLD WA SA TAS ACT NT Total(a)2015-16General public services - - 11,980 - - - - - 27,980Public order and safety 84,760 62,461 54,326 30,750 20,823 7,888 11,132 81,985 354,125Education 5,553,446 4,522,217 3,780,410 1,843,282 1,296,891 416,246 303,264 363,746 18,082,225Health 5,374,680 4,381,386 3,389,376 1,901,480 1,218,583 406,184 328,070 268,236 17,267,995Social security and welfare 478,016 823,217 351,072 421,098 115,900 34,340 27,663 29,372 2,299,758Housing and community amenities 499,078 373,554 480,388 307,975 137,475 33,262 33,198 298,156 2,176,089Recreation and culture 5,000 - - - - 5,170 - - 10,170Fuel and energy - - - - - - - - -Agriculture, forestry and fishing 242,941 262,288 53,842 3,471 114,676 41,892 3,694 4,695 727,499Mining, manufacturing and construction - - - - - - - - -Transport and communication 2,062,834 772,907 1,620,565 766,583 485,995 156,217 28,361 183,494 7,104,956Other economic affairs 2,750 4,227 7,121 3,935 1,237 875 858 872 21,875Other purposes(b) 17,809,610 13,103,853 13,283,000 2,062,299 5,632,510 2,284,863 1,099,128 3,304,695 59,278,727Total payments to the states 32,113,115 24,306,110 23,032,080 7,340,873 9,024,090 3,386,937 1,835,368 4,535,251 107,351,399less payments 'through' the states 3,257,087 2,725,805 2,214,970 1,106,261 809,642 216,423 211,370 172,010 10,715,406less financial assistance grants for
local government 355,861 269,997 225,274 140,375 76,078 35,923 24,283 16,433 1,144,224less payments direct 'to'
local government 266,186 211,550 235,090 157,261 76,943 32,825 - 17,685 997,540equals total payments 'to' the states for
own-purpose expenses 28,233,981 21,098,758 20,356,746 5,936,976 8,061,427 3,101,766 1,599,715 4,329,123 94,494,229 (a) Total column may not equal sum of state totals. There is no basis on which to estimate state allocations for several payments, which are not reflected in state totals. (b) Payments for ‘Other purposes’ includes general revenue assistance to the States.

48
Attachm
ent D: A
nnex A (online only)
Table A.11: Total payments to the states by GFS function (continued) $'000 NSW VIC QLD WA SA TAS ACT NT Total(a)2016-17General public services - - - - - - - - -Public order and safety 85,255 65,945 54,009 32,039 21,211 7,899 11,317 74,968 352,643Education 6,029,539 4,838,768 4,139,657 1,974,195 1,381,089 448,618 321,456 380,097 19,517,439Health 5,590,900 4,382,718 3,497,669 1,998,843 1,250,100 411,052 345,943 282,202 17,759,427Social security and welfare 502,141 421,774 342,402 190,406 115,820 36,008 27,071 28,069 1,936,361Housing and community amenities 495,142 370,025 447,387 263,771 122,509 32,686 24,863 217,549 1,983,931Recreation and culture 5,000 - - - - 1,780 - - 6,780Fuel and energy - - - - - - - - -Agriculture, forestry and fishing 120,115 209,126 62,948 2,324 130,002 18,150 27,363 4,230 579,401Mining, manufacturing and construction - - - - - - - - -Transport and communication 3,372,064 720,839 2,622,480 980,939 603,683 182,861 24,514 111,160 9,935,627Other economic affairs 5,327 2,570 3,052 2,014 1,300 894 870 893 16,920Other purposes(b) 18,784,669 13,906,257 15,304,778 1,931,450 6,303,658 2,402,601 1,171,295 3,358,217 63,785,674Total payments to the states 34,990,152 24,918,022 26,474,382 7,375,981 9,929,372 3,542,549 1,954,692 4,457,385 115,874,203less payments 'through' the states 3,462,328 2,945,392 2,383,177 1,206,108 856,355 233,605 227,713 183,581 11,500,506less financial assistance grants for
local government 709,615 539,959 450,805 284,320 151,097 71,308 48,541 33,056 2,288,701less payments direct 'to'
local government 320,359 234,982 238,932 169,036 81,817 37,626 - 18,531 1,101,283equals total payments 'to' the states for
own-purpose expenses 30,497,850 21,197,689 23,401,468 5,716,517 8,840,103 3,200,010 1,678,438 4,222,217 100,983,713 (a) Total column may not equal sum of state totals. There is no basis on which to estimate state allocations for several payments, which are not reflected in state totals. (b) Payments for ‘Other purposes’ includes general revenue assistance to the states.

49
Attachm
ent D: A
nnex A (online only)
Table A.11: Total payments to the states by GFS function (continued) $'000 NSW VIC QLD WA SA TAS ACT NT Total(a)2017-18General public services - - - - - - - - -Public order and safety 81,461 59,230 52,005 29,452 19,493 7,066 10,981 70,611 330,299Education 6,126,163 4,927,931 4,189,836 2,104,594 1,409,382 443,987 325,081 368,367 19,900,633Health 5,801,690 4,568,964 3,664,252 2,021,153 1,279,813 396,167 298,342 216,681 18,247,062Social security and welfare 526,763 450,448 360,935 205,044 121,998 37,893 28,709 29,142 2,046,019Housing and community amenities 452,203 342,652 390,035 235,671 108,439 28,580 22,354 198,411 1,803,345Recreation and culture - - - - - 1,663 - - 1,663Fuel and energy - - - - - - - - -Agriculture, forestry and fishing 83,854 86,155 55,832 2,324 36,903 150 30,363 3,796 309,377Mining, manufacturing and construction - - - - - - - - -Transport and communication 2,288,410 480,336 2,122,318 835,255 402,047 70,081 11,503 49,947 7,196,897Other economic affairs 3,026 2,744 3,197 2,127 1,353 917 893 916 15,173Other purposes(b) 19,678,021 14,604,387 16,666,932 1,635,811 6,667,984 2,494,434 1,255,854 3,218,392 66,779,520Total payments to the states 35,041,591 25,522,847 27,505,342 7,071,431 10,047,412 3,480,938 1,984,080 4,156,263 116,629,988less payments 'through' the states 3,564,880 3,070,243 2,492,837 1,266,511 866,733 239,215 218,023 179,529 11,900,605less financial assistance grants for
local government 737,890 563,169 470,176 298,800 156,593 73,817 50,567 34,501 2,385,513less payments direct 'to'
local government 97,800 71,219 75,200 51,200 24,140 11,400 - 5,600 336,559equals total payments 'to' the states for
own-purpose expenses 30,641,021 21,818,216 24,467,129 5,454,920 8,999,946 3,156,506 1,715,490 3,936,633 102,007,311 (a) Total column may not equal sum of state totals. There is no basis on which to estimate state allocations for several payments, which are not reflected in state totals. (b) Payments for ‘Other purposes’ includes general revenue assistance to the States.

50
Attachm
ent D: A
nnex A (online only)
Table A.11: Total payments to the states by GFS function (continued) $'000 NSW VIC QLD WA SA TAS ACT NT Total(a)2018-19General public services - - - - - - - - -Public order and safety 79,225 60,040 52,870 30,065 19,696 7,128 11,235 62,570 322,829Education 6,178,055 5,052,052 4,221,287 2,260,119 1,451,202 437,567 335,800 346,525 20,284,172Health 6,031,124 4,768,794 3,810,485 2,113,505 1,324,312 401,043 310,161 215,915 18,975,339Social security and welfare 553,704 480,655 381,085 220,606 128,419 39,919 30,487 29,014 2,142,482Housing and community amenities 440,976 348,728 283,309 154,352 96,870 28,598 22,666 14,033 1,446,532Recreation and culture - - - - - - - - -Fuel and energy - - - - - - - - -Agriculture, forestry and fishing 13,378 50,682 40,138 2,063 13,122 7,721 18,034 3,737 168,875Mining, manufacturing and construction - - - - - - - - -Transport and communication 1,419,674 306,681 1,264,052 597,331 256,846 78,572 10,598 41,304 4,885,058Other economic affairs 772 1,139 1,364 890 433 169 140 169 5,076Other purposes(b) 20,702,632 15,442,394 17,331,123 1,872,744 6,844,257 2,535,144 1,306,243 3,260,813 69,743,771Total payments to the states 35,419,540 26,511,165 27,385,713 7,251,675 10,135,157 3,535,861 2,045,364 3,974,080 117,974,134less payments 'through' the states 3,572,558 3,129,269 2,498,543 1,281,260 877,918 237,447 221,701 181,092 12,001,353less financial assistance grants for
local government 767,622 587,589 490,550 314,083 162,362 76,449 52,697 36,023 2,487,375less payments direct 'to'
local government 111,471 71,212 76,200 51,200 24,140 11,400 - 5,600 351,223equals total payments 'to' the states for
own-purpose expenses 30,967,889 22,723,095 24,320,420 5,605,132 9,070,737 3,210,565 1,770,966 3,751,365 103,134,183 (a) Total column may not equal sum of state totals. There is no basis on which to estimate state allocations for several payments, which are not reflected in state totals. (b) Payments for ‘Other purposes’ includes general revenue assistance to the States.

51
Attachm
ent D: A
nnex A (online only)
Table A.12: Other financial flows — estimated advances, repayment of advances and interest payments, by year and state $'000 NSW VIC QLD WA SA TAS ACT NT Total2015-16AdvancesAsbestos removal in the ACT - - - - - - 250,000 - 250,000Contingent liabilities
Loan to NSW to assist beneficiaries of the Asbestos Injuries Compensation Fund 37,500 - - - - - - - 37,500
Natural disaster relief 1,554 - 789 - - - - - 2,343RepaymentsAsbestos removal in the ACT - - - - - - - - -Contingent liabilities
Loan to NSW to assist beneficiaries of the Asbestos Injuries Compensation Fund - - - - - - - - -
Natural disaster relief -4,083 - -17,286 - - - - - -21,369Environment
Northern Territory – water and sewerageassistance - - - - - - - -136 -136
HousingCommonwealth-State Housing
Agreement loans -37,130 - -9,955 -9,543 -2,596 -5,052 - -828 -65,104Housing for service personnel -1,595 - -976 -263 -57 - - - -2,891Other housing - - - - - - -7,854 -2,839 -10,693
InfrastructureRailway projects - - - - - - - - -Sewerage -1,342 - -963 - -648 - - - -2,953
Other purposesAustralian Capital Territory debt
repayments - - - - - - -555 - -555Loan Council – housing nominations -8,967 - -3,299 -5,719 -3,751 -2,404 - -2,985 -27,125

52
Attachm
ent D: A
nnex A (online only)
Table A.12: Other financial flows — estimated advances, repayment of advances and interest payments, by year and state (continued) $'000 NSW VIC QLD WA SA TAS ACT NT Total2015-16InterestAsbestos removal in the ACT - - - - - - -26,787 - -26,787Contingent liabilities
Loan to NSW to assist beneficiaries of the Asbestos Injuries Compensation Fund -3,223 - - - - - - - -3,223
Natural disaster relief -451 - -1,325 - - - - - -1,776Environment
Northern Territory – water and sewerageassistance - - - - - - - -548 -548
HousingCommonwealth-State Housing
Agreement loans -31,943 - -9,156 -8,618 -2,452 -4,472 - -1,345 -57,986Housing for service personnel -1,881 - -1,047 -189 -86 - - - -3,203Other housing - - - - - - -6,620 -2,781 -9,401
InfrastructureRailway projects - - - - - - - - -Sewerage -97 - -32 - -91 - - - -220
Other purposesAustralian Capital Territory debt
repayments - - - - - - -558 - -558Loan Council – housing nominations -20,366 - -7,273 -12,429 -8,781 -5,366 - -7,072 -61,287
Net Financial Flow -72,024 - -50,523 -36,761 -18,462 -17,294 207,626 -18,534 -5,972

53
Attachm
ent D: A
nnex A (online only)
Table A.12: Other financial flows — estimated advances, repayment of advances and interest payments, by year and state (continued) $'000 NSW VIC QLD WA SA TAS ACT NT Total2016-17AdvancesAsbestos removal in the ACT - - - - - - - - -Contingent liabilities
Loan to NSW to assist beneficiaries of the Asbestos Injuries Compensation Fund 50,000 - - - - - - - 50,000
Natural disaster relief - - 1,179 - - - - - 1,179RepaymentsAsbestos removal in the ACT - - - - - - - - -Contingent liabilities
Loan to NSW to assist beneficiaries of the Asbestos Injuries Compensation Fund - - - - - - - - -
Natural disaster relief -4,083 - -12,276 - - - - - -16,359Environment
Northern Territory – water and sewerageassistance - - - - - - - -136 -136
HousingCommonwealth-State Housing
Agreement loans -37,268 - -10,033 -9,596 -2,736 -5,105 - -865 -65,603Housing for service personnel -1,697 - -1,037 -277 -63 - - - -3,074Other housing - - - - - - -7,972 -2,983 -10,955
InfrastructureRailway projects - - - - - - - - -Sewerage - - -52 - -340 - - - -392
Other purposesAustralian Capital Territory debt
repayments - - - - - - -555 - -555Loan Council – housing nominations -9,370 - -3,447 -5,976 -3,920 -2,512 - -3,119 -28,344

54
Attachm
ent D: A
nnex A (online only)
Table A.12: Other financial flows — estimated advances, repayment of advances and interest payments, by year and state (continued) $'000 NSW VIC QLD WA SA TAS ACT NT Total2016-17InterestAsbestos removal in the ACT - - - - - - -27,076 - -27,076Contingent liabilities
Loan to NSW to assist beneficiaries of the Asbestos Injuries Compensation Fund -5,947 - - - - - - - -5,947
Natural disaster relief -395 - -1,087 - - - - - -1,482Environment
Northern Territory – water and sewerageassistance - - - - - - - -542 -542
HousingCommonwealth-State Housing
Agreement loans -30,078 - -8,665 -8,142 -2,309 -4,222 - -1,307 -54,723Housing for service personnel -1,810 - -1,004 -178 -83 - - - -3,075Other housing - - - - - - -6,267 -2,637 -8,904
InfrastructureRailway projects - - - - - - - - -Sewerage -1 - - - -38 - - - -39
Other purposesAustralian Capital Territory debt
repayments - - - - - - -488 - -488Loan Council – housing nominations -19,992 - -7,133 -12,184 -8,623 -5,264 - -6,946 -60,142
Net Financial Flow -60,641 - -43,555 -36,353 -18,112 -17,103 -42,358 -18,535 -236,657

55
Attachm
ent D: A
nnex A (online only)
Table A.12: Other financial flows — estimated advances, repayment of advances and interest payments, by year and state (continued) $'000 NSW VIC QLD WA SA TAS ACT NT Total2017-18AdvancesAsbestos removal in the ACT - - - - - - - - -Contingent liabilities
Loan to NSW to assist beneficiaries of the Asbestos Injuries Compensation Fund 12,500 - - - - - - - 12,500
Natural disaster relief - - - - - - - - -RepaymentsAsbestos removal in the ACT - - - - - - -50,000 - -50,000Contingent liabilities
Loan to NSW to assist beneficiaries of the Asbestos Injuries Compensation Fund - - - - - - - - -
Natural disaster relief -4,083 - -12,276 - - - - - -16,359Environment
Northern Territory – water and sewerageassistance - - - - - - - -136 -136
HousingCommonwealth-State Housing
Agreement loans -37,531 - -10,109 -9,737 -2,883 -5,151 - -904 -66,315Housing for service personnel -1,813 - -1,089 -287 -69 - - - -3,258Other housing - - - - - - -8,131 -3,135 -11,266
InfrastructureRailway projects - - - - - - - - -Sewerage - - - - -168 - - - -168
Other purposesAustralian Capital Territory debt
repayments - - - - - - -555 - -555Loan Council – housing nominations -9,792 - -3,602 -6,246 -4,096 -2,626 - -3,260 -29,622

56
Attachm
ent D: A
nnex A (online only)
Table A.12: Other financial flows — estimated advances, repayment of advances and interest payments, by year and state (continued) $'000 NSW VIC QLD WA SA TAS ACT NT Total2017-18InterestAsbestos removal in the ACT - - - - - - -27,076 - -27,076Contingent liabilities
Loan to NSW to assist beneficiaries of the Asbestos Injuries Compensation Fund -7,849 - - - - - - - -7,849
Natural disaster relief -338 - -918 - - - - - -1,256Environment
Northern Territory – water and sewerageassistance - - - - - - - -535 -535
HousingCommonwealth-State Housing
Agreement loans -28,189 - -8,166 -7,660 -2,158 -3,966 - -1,268 -51,407Housing for service personnel -1,735 - -958 -166 -80 - - - -2,939Other housing - - - - - - -5,908 -2,486 -8,394
InfrastructureRailway projects - - - - - - - - -Sewerage - - - - -14 - - - -14
Other purposesAustralian Capital Territory debt
repayments - - - - - - -418 - -418Loan Council – housing nominations -19,595 - -6,984 -11,925 -8,456 -5,156 - -6,813 -58,929
Net Financial Flow -98,425 - -44,102 -36,021 -17,924 -16,899 -92,088 -18,537 -323,996

57
Attachm
ent D: A
nnex A (online only)
Table A.12: Other financial flows — estimated advances, repayment of advances and interest payments, by year and state (continued) $'000 NSW VIC QLD WA SA TAS ACT NT Total2018-19AdvancesAsbestos removal in the ACT - - - - - - - - -Contingent liabilities
Loan to NSW to assist beneficiaries of the Asbestos Injuries Compensation Fund - - - - - - - - -
Natural disaster relief - - - - - - - - -RepaymentsAsbestos removal in the ACT - - - - - - -50,000 - -50,000Contingent liabilities
Loan to NSW to assist beneficiaries of the Asbestos Injuries Compensation Fund -15,116 - - - - - - - -15,116
Natural disaster relief -4,083 - -11,695 - - - - - -15,778Environment
Northern Territory – water and sewerageassistance - - - - - - - -136 -136
HousingCommonwealth-State Housing
Agreement loans -37,608 - -10,245 -9,850 -3,038 -5,172 - -945 -66,858Housing for service personnel -1,892 - -1,139 -295 -77 - - - -3,403Other housing - - - - - - -8,222 -3,293 -11,515
InfrastructureRailway projects - - - - - - - - -Sewerage - - - - -60 - - - -60
Other purposesAustralian Capital Territory debt
repayments - - - - - - -555 - -555Loan Council – housing nominations -10,232 - -3,765 -6,527 -4,281 -2,744 - -3,406 -30,955

58
Attachm
ent D: A
nnex A (online only)
Table A.12: Other financial flows — estimated advances, repayment of advances and interest payments, by year and state (continued) $'000 NSW VIC QLD WA SA TAS ACT NT Total2018-19InterestAsbestos removal in the ACT - - - - - - -25,722 - -25,722Contingent liabilities
Loan to NSW to assist beneficiaries of the Asbestos Injuries Compensation Fund -8,249 - - - - - - - -8,249
Natural disaster relief -282 - -748 - - - - - -1,030Environment
Northern Territory – water and sewerageassistance - - - - - - - -528 -528
HousingCommonwealth-State Housing
Agreement loans -26,271 - -7,658 -7,166 -1,997 -3,698 - -1,225 -48,015Housing for service personnel -1,654 - -910 -153 -77 - - - -2,794Other housing - - - - - - -5,542 -2,327 -7,869
InfrastructureRailway projects - - - - - - - - -Sewerage - - - - -3 - - - -3
Other purposesAustralian Capital Territory debt
repayments - - - - - - -348 - -348Loan Council – housing nominations -19,175 - -6,826 -11,650 -8,279 -5,047 - -6,673 -57,650
Net Financial Flow -124,562 - -42,986 -35,641 -17,812 -16,661 -90,389 -18,533 -346,584
