pbgc’s multiemployer guarantee - pension benefit … 11. illustration of application of the...
TRANSCRIPT

PBGC’s Multiemployer Guarantee
March 2015

i
Contents
Executive Summary ....................................................................................................................................... 1
Understanding Financial Assistance for the Multiemployer System ............................................................ 2
Multiemployer Benefit Structures and Guarantees (Compared to Single-Employer) .................................. 3
Study of the Multiemployer Guarantee for Current and Future Plans ......................................................... 5
System-wide Benefit Payments .................................................................................................................... 6
Conclusions ................................................................................................................................................... 8
Appendix ....................................................................................................................................................... 9
Data Set Summary .................................................................................................................................... 9
Accrual Rates in our Data Set .................................................................................................................. 10
Large Plan Description ............................................................................................................................ 11
The Guarantee ........................................................................................................................................ 12
ii
Figures
Figure 1. Changes in the Effectiveness of PBGC’s Multiemployer Safety Net .............................................. 1
Figure 2. PBGC Financial Assistance to Insolvent Plans ................................................................................ 3
Figure 3. PBGC Guarantees are Much Lower for Multiemployer Plans ........................................................ 4
Figure 4. Average Monthly Benefits are Larger in Ongoing Plans ................................................................ 6
Figure 5. PBGC’s Safety Net is Effective for Current Plans, Less so for Future Plans .................................... 7
Figure 6. Size of Participant Benefit Losses Increases in Future Plans ......................................................... 7
Figure 7. Average Benefit Accrual Rate ($) by Industry for Study Data Set .................................................. 9
Figure 8. Percent of Participants by Benefit Accrual Rate Group for Study Data Set ................................. 10
Figure 9. Benefit Accrual Rates are Higher in Future Plans for Study Data Set .......................................... 10
Figure 10. Percent of Plan Participants Expecting or Experiencing a Benefit Reduction by Plan Median
Benefit Accrual Rate within Study Data Set ................................................................................................ 11
Figure 11. Illustration of Application of the Guarantee to the Monthly Accrual Rate ............................... 12
Tables
Table 1. Guarantee Levels for Various Combinations of Credited Service and Accrual Rates ................... 13
1
Executive Summary
Recent PBGC publications have discussed the growing stress on the multiemployer (ME) retirement system and on PBGC’s ME guarantee program for participants in insolvent plans. PBGC’s 2014 Annual Report showed the deficit for the ME program rising from less than $1 billion in 2009 to more than $40 billion.1 PBGC’s 2013 Projections Report2 stated that “Plan insolvencies — possibly affecting more than a million of the ten million people in multiemployer plans — are now both more likely and more imminent than in our last report.” The size of the projected increase in the deficit for the program leads to the question of the effectiveness of the program as a safety net for participants in failing plans.
This report provides a starting point to examine how the ME guarantee has affected and is likely to affect the benefits of plan participants in insolvent plans. It is based on a data set of participant records in two statuses, determined based on the status used for PBGC’s 2013 Annual Report 3:
1. Insolvent plans currently receiving financial assistance from PBGC (“Current Plans”) and 2. Terminated plans which have not started receiving financial assistance from PBGC, though they
are expected to in the future (“Future Plans”).
The results of the study are illustrated in Figure 1 and detailed below:
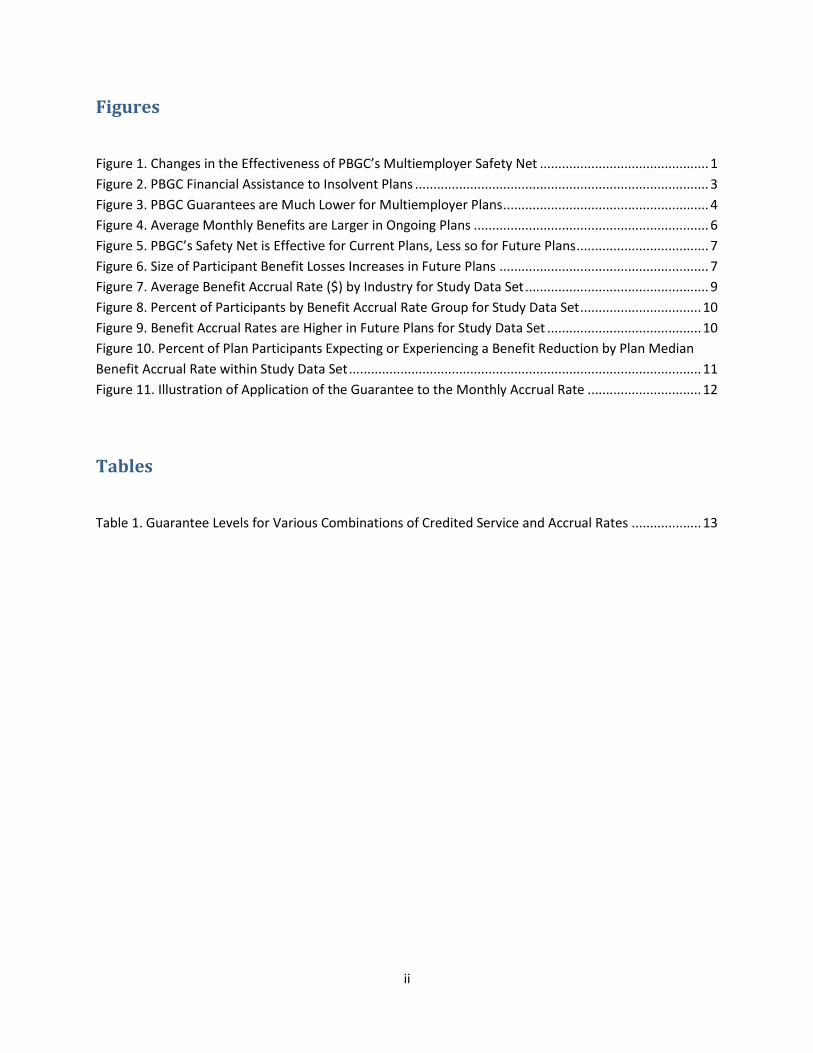
Figure 1. Changes in the Effectiveness of PBGC’s Multiemployer Safety Net
To date, the multiemployer program has provided full-coverage somewhat less often than the single-employer guarantee program. Twenty-one percent of multiemployer participants in Current Plans experienced a reduction in benefits versus 16 percent of participants in our most recent study of single-employer plans.4
The risk and magnitude of benefit loss increases dramatically when we look at the plans that are projected to require financial assistance in the future and apply the guarantee.
1 PBGC’s 2014 Annual Report, page 24, available at: http://pbgc.gov/documents/2014-annual-report.pdf.
2 The 2013 Projections Report is available at: http://www.pbgc.gov/about/projections-report.html.
3 For additional detail on these statuses see pg. 85 of PBGC’s 2013 Annual Report.
4 “PBGC's Guarantee Limits -An Update” is available at: http://www.pbgc.gov/documents/guaranteelimits.pdf.
79.2%
12.8%
6.8% 0.3% 0.9%
48.7%
23.8% 23.5%
1.3% 2.8%
0.0%10.0%20.0%30.0%40.0%50.0%60.0%70.0%80.0%90.0%
None Less than 10% 10% - 19% 20% - 29% 30% or Greater
Per
cen
tage
of
Par
tici
pan
ts
Reduction
Benefit Guarantees for Participants --Current & Future
Left Column - Current Plans , Right Column - Future Plans

2
This report was largely compiled before the enactment of legislation5 which provides certain multiemployer plans with additional ability to restructure benefit provisions at a level in excess of the PBGC guarantee amount, if doing so would maintain plan solvency. Except with respect to pre-retirement survivor benefits, the legislation did not change the amount of the PBGC guarantee; thus the findings of this report, which compare the guarantee to plan benefits, remain unchanged.
Understanding Financial Assistance for the Multiemployer System PBGC pays financial assistance to multiemployer plans in the form of loans in the event of plan insolvency. New multiemployer legislation also changes and expands PBGC’s ability to pay financial assistance to plans seeking to merge or partition so that the plan can avoid insolvency. Financial assistance takes two forms:
Periodic payments to pay guaranteed benefits to plan participants and cover the administrative expenses of the plan and
A one-time or other non-periodic payment to purchase annuities or to facilitate merger of the plan with a healthier plan.
Plans may receive one or both types of financial assistance. While about half of all plans that received financial assistance over time got some type of non-periodic assistance, the amount paid represents less than 20 percent of financial assistance expenditures over the history of the program.6 Most financial assistance is periodic and pays for guaranteed benefits and plan administrative expenses.7 As shown in Figure 2, the number of plans receiving periodic financial assistance has grown steadily over time, while the amount of total periodic financial assistance has risen sharply since 2005. PBGC projections show continued and significant growth in the amount of projected financial assistance as plans near insolvency run out of money over the next few years.
5 The Multiemployer Pension Reform Act of 2014.
6 Approximately 60 percent of non-periodic financial assistance relates to a single plan. Excluding financial
assistance for that plan, non-periodic assistance is less than 10 percent of aggregate financial assistance. Some non-periodic payments are to assist a plan to purchase annuities, eliminating future periodic payments. 7 A summary of PBGC’s financial assistance payments over time is set forth in Table M-4 of PBGC's 2012 Databook.
Periodic assistance payments include payments following a plan partition.

3
Figure 2. PBGC Financial Assistance to Insolvent Plans
Multiemployer Benefit Structures and Guarantees (Compared to Single-Employer)
The 2013 Projections Report highlighted differences between PBGC’s single-employer and multiemployer programs in the magnitude of the guarantees and in the degree to which guarantees cover all or only a portion of the vested benefit. As illustrated in Figure 3, the benefit level at which PBGC provides 100 percent coverage for multiemployer plans is very low — for an individual with 10 years of service, PBGC guarantees 100 percent of the pension benefit only up to $1,320 per year; for an individual with 30 years of service, the amount PBGC guarantees at 100 percent is less than $4,000 per year.8
PBGC guarantees 75 percent of benefits in excess of that level, but the overall guaranteed payment amount is limited to $12,870 per year for an individual with 30 years of service. By comparison, under the single-employer program, the guaranteed annual benefit for 2015 for a retiree receiving a straight-
8 PBGC guarantees 100 percent of a benefit up to $11 per month per year of service, which equates to $3,960 per year for an individual with 30 years of service. PBGC partially guarantees (at a 75 percent level) the next $33 per month per year of service, so that the maximum amount PBGC will pay to a participant with 30 years of service is $12,870. The structure of the guarantee requires that individuals receiving the maximum payout will have a reduction of at least 18 percent in the benefit promise and potentially much more for plans with benefit accrual rates in excess of $44 per month per year of service.
0
5
10
15
20
25
30
35
40
45
50
$0.0
$20.0
$40.0
$60.0
$80.0
$100.0
$120.0
19
81
19
85
19
90
19
95
19
96
19
97
19
98
19
99
20
00
20
01
20
02
20
03
20
04
20
05
20
06
20
07
20
08
20
09
20
10
20
11
20
12
Plan
s Fi
nan
cial
Ass
ista
nce
PBGC Financial Assistance to Insolvent Plans -- Periodic Payments (1981-2012)
Plans Amount of Periodic Payments ($ millions)

4
life annuity at age 65 is $60,136. While neither program guarantees more than the vested benefit under a plan at termination, Figure 3 illustrates a significant difference in the cap on the amount of guarantee. For more information on the guarantee structure and examples of its application, please refer to the appendix.
Figure 3. PBGC Guarantees are Much Lower for Multiemployer Plans
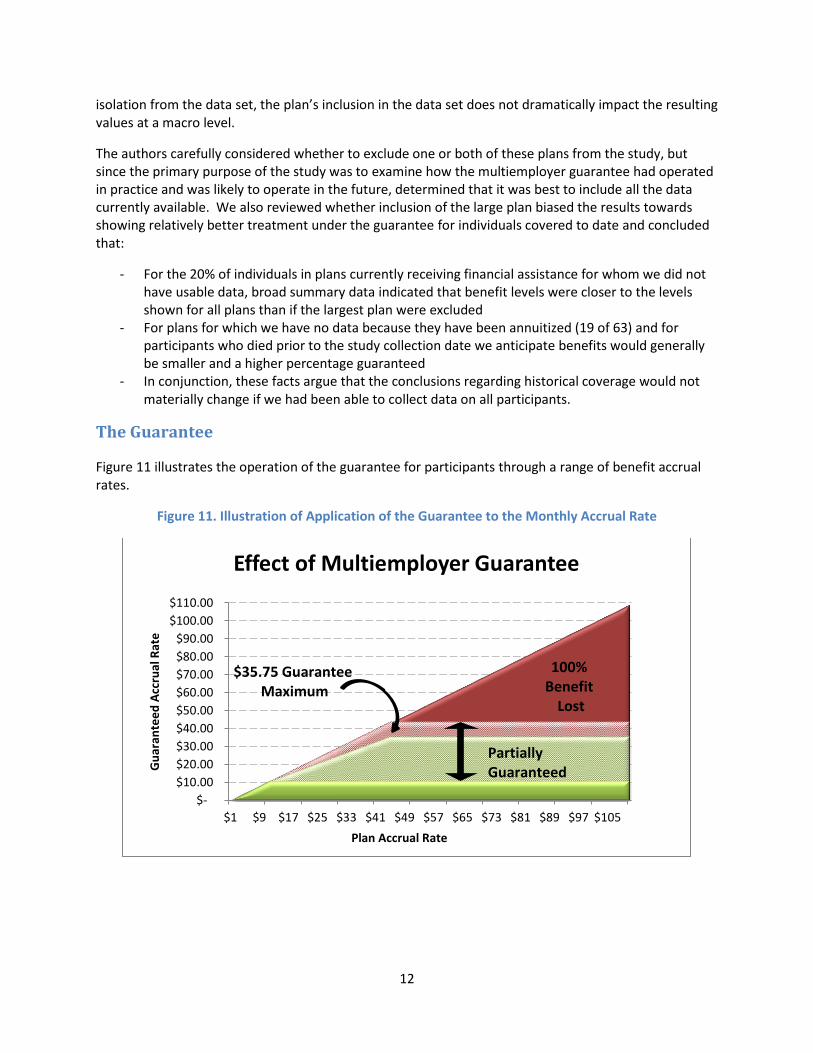
For multiemployer plans, PBGC’s guarantee is limited in two ways: first, the portion of the accrual rate between $11 and $44 is not fully guaranteed, but is cut 25 percent; second, the portion of the accrual rate over $44 is not guaranteed at all. The net effect of these two limits is that the monthly accrual rate paid by the PBGC is at most $35.75 per year of credited service.
There are other key differences between the single-employer and multiemployer guarantees. Unlike the single-employer guarantee,
The multiemployer guarantee is generally smaller.
The multiemployer guarantee is not indexed for inflation and is not adjusted for the age at which benefit payments begin or the form of the benefit payment.
Plan assets are not available to provide non-guaranteed benefits.
Benefit increases that occur in the five years prior to plan termination are excluded rather than phased in over the five years.

5
Study of the Multiemployer Guarantee for Current and Future Plans
This section of the study examines further how the guarantee is working for participants in insolvent plans today and how it may work for participants in plans that become insolvent in the coming years. It is limited to plans that, as of September 30th, 2013, were receiving assistance9 or had terminated, for which we have sufficient data to determine how the guarantee limits affect a participant’s retirement benefit.
The data used in this study was provided by PBGC's Multiemployer Program Division, based on data it has received from plans. It should be noted that, unlike the single-employer program, PBGC does not administer the benefits for the multiemployer program. Thus PBGC does not have immediate access to all the data on plan participant benefit calculations, relying on audits to ensure the correct payment of financial assistance.
We examined participant data for two plan statuses: plans that are insolvent and receiving financial assistance, which we refer to as “Current Plans,” and plans that have terminated and which PBGC believes are likely to require future financial assistance. These statuses were determined based on the categorization of plans in PBGC’s 2013 Annual report and do not reflect subsequent updates for additional plans that have terminated or become insolvent. We refer to the latter status as “Future Plans.” One hundred and nine plans and almost 152,000 participants fall into one of these two statuses. Much of the data received did not include both the plan-specified benefit and the guaranteed amount. After reviewing the data for completeness, the data set was reduced to 78,557 participants deemed to be sufficiently reliable and appropriate for use in the study. It is worth noting that one plan currently receiving financial assistance comprises over 45 percent of the total data set. More detail on this can be found in the “Large Plan Description” section in the Appendix.
9 The majority of, but not all, plans currently receiving financial assistance have terminated.

6
System-wide Benefit Payments
While our study data set includes a majority of Current Plans and a reasonably representative subset of
Future Plans, we looked to other data sources to understand trends and patterns of benefit accrual rates
as a starting point and as a way to validate the study findings. Figure 4 shows the average monthly
benefit for participants currently receiving benefits by plan from recent Form 5500 filing data.
Figure 4. Average Monthly Benefits are Larger in Ongoing Plans
Data is shown for three groups: (1) Future Plans; (2) Ongoing Probable Plans -- plans that are projected
to become insolvent within 10 years10 (“Probable insolvent plan-ongoing future probables” in PBGC’s
Annual Report); and (3) the remaining ongoing plans. All three statuses reflect the categorization of
plans as determined for PBGC’s 2013 Annual Report and do not reflect subsequent events. Plans
currently receiving financial assistance are excluded from this comparison because relevant 5500 data is
not available. Future Plans have a dramatically lower benefit level than the other two groups, with the
“Balance of ME Plans” having the highest benefit in payment. Additionally, some Ongoing Probable
Plans and most plans in the Balance of ME Plans group have the option to increase benefit accrual rates.
Figure 4 suggests that the dollar amount of benefit cuts under the current guarantee structure will likely
increase significantly for ongoing plans that receive financial assistance in the future.
Figure 5 shows a comparison of Current Plans and Future Plans. Participants in Current Plans have
experienced or are projected to experience a benefit reduction about 20 percent of the time. For
participants in Future Plans, this number is projected to be more than 50 percent. This reflects that
benefit levels for Future Plans are generally higher than those for Current Plans.
10
The plans we refer to as Current Plans, Future Plans and Ongoing Probable Plans are the three statuses of multiemployer plans for which PBGC has recorded net liabilities on its financial statements.
$383.33
$546.17
$1,010.44
$-
$200.00
$400.00
$600.00
$800.00
$1,000.00
$1,200.00
Future Plans Ongoing ProbablePlans
Balance of ME Plans
Average Monthly Benefit by Plan Status for Participants in Payment, Form 5500 Data

7
Figure 5. PBGC’s Safety Net is Effective for Current Plans, Less so for Future Plans
Figure 6 shows the difference in the size of the projected loss for participants. Fifty-four percent of the time participants in Future Plans are projected to lose 10 percent or more of their benefit — this compares to 39 percent of the time for participants in Current Plans.
Figure 6. Size of Participant Benefit Losses Increases in Future Plans
Current Plans (59,065 Participants)
79% of Participants Receive Their Full Benefit
21% of Participants Face a Reduction
Future Plans (19,492 Participants)
51% of Participants Face a Reduction
49% of Participants Receive Their Full Benefit
62%
33%
1% 5%
0%10%20%30%40%50%60%70%
Distribution of Losses in Current Plans (for the 21% of participants
with cuts), by Size 46% 46%
3% 5%
0%10%20%30%40%50%60%70%
Distribution of Losses in Future Plans (for the 51% of participants
with cuts), by Size

8
Conclusions
This report is intended to improve the understanding of PBGC guarantees for multiemployer plans by examining how they have affected and will affect the benefits of participants. The report focuses primarily on multiemployer plans that are insolvent or have terminated and are projected to become insolvent.
The study data set covers more than half of the nearly 152,000 participants in plans that, as of September 30th, 2013, were receiving financial assistance or were in terminated plans projected to receive financial assistance (80 percent of current financial assistance participants and 25 percent of participants in terminated plans projected by PBGC to receive financial assistance in the future) The results of this study show:
To date, the multiemployer program has provided full coverage somewhat less often than the single-employer guarantee program. Twenty-one percent of multiemployer participants in current plans experienced a reduction in benefits versus 16 percent of participants in our most recent study of single-employer plans.
The risk and magnitude of benefit loss increases dramatically when we look at the plans that are projected to require financial assistance in the future and apply the guarantee.
o The participant data available for this study show that the effectiveness of PBGC’s safety net will decrease as additional terminated plans become insolvent.
o As shown in Figure 4, the results of expanding the scope of the study beyond plans that have already terminated suggest that the gap between promised benefits and guarantees will further widen.

9
Appendix
Data Set Summary
The data used in the study was provided by PBGC’s Multiemployer Program Division. The data consists of participant information on plan benefit levels, guaranteed benefit payments and/or credited service for participants in Current Plans and Future Plans.
As of the end of fiscal year 2013, there were a total of 109 plans in the two statuses previously described with an estimated participant count of just under 152,000 out of the 1,435 plans and 10.3 million participants in the universe of multiemployer plans.11 Complete data is not available for all plans; once the data was examined for completeness, 78,557 observations were deemed appropriate for use in the study.
The data does not distinguish between different types of benefits (e.g., disability, survivor) which may
affect how the pre- and post-insolvency benefits compare. As a check on how well the subset of plans in
our study represents the two statuses of plans, we examined the average benefit for participants
currently receiving benefits as derived from values reported on the Form 5500 (the basis for the values
reported in Figure 4). In each case, the difference between the value for the subgroup of plans and that
for the whole group was small — roughly one percent for Current Plans and seven percent for Future
Plans.
Figure 7 shows the average benefit accrual rate by industry for the data included in the study. Retail Trade is the only industry to have an average benefit accrual rate below the $11 fully guaranteed level.
Figure 7. Average Benefit Accrual Rate ($) by Industry12 for Study Data Set
11
Figures per PBGC 2012 databook tables M-5 & M-6. 12
The data exclude one large manufacturing plan where there was insufficient data to calculate the figures presented.
$32.32
$14.64
$10.29
$14.53
$22.32
$15.07
$-
$5.00
$10.00
$15.00
$20.00
$25.00
$30.00
$35.00

10
Accrual Rates in our Data Set
The PBGC guarantee is a function of the benefit accrual rate. Therefore, grouping participants by benefit accrual rate sheds light on the benefit cuts participants have received or may receive in the future. As shown in Figure 8, across our data set, roughly 70 percent of the participants have accrual rates less than $11, which means these participants will receive 100 percent of their vested benefit. On the other end of the spectrum, just 2 percent of the participants in the data set currently have accrual rates greater than $44, meaning that for these participants the guaranteed accrual will be capped at $35.75. The remaining participants (28 percent) have accrual rates between $11 and $44, and the corresponding guaranteed accrual rates will be between $11 and $35.75.
Figure 8. Percent of Participants by Benefit Accrual Rate Group for Study Data Set
Figure 9 shows the distribution of accruals in terms of the guarantee level groupings by plan status. Participants in Future Plans are more likely to have higher accruals than participants in Current Plans.
Figure 9. Benefit Accrual Rates are Higher in Future Plans for Study Data Set
$6.09
$17.71
$59.89 0.0%
20.0%
40.0%
60.0%
80.0%
$11 and Below $11 - $44 More than $44Pe
rce
nta
ge o
f P
arti
cip
ants
Benefit Accrual Group
Participant Benefit Accruals (Median Values Shown)
$6.00
$17.59
$57.55
$6.75 $18.23
$67.72
0.0%
10.0%
20.0%
30.0%
40.0%
50.0%
60.0%
70.0%
$11 and Below $11 - $44 More than $44Pe
rce
nta
ge o
f P
arti
cip
ants
Benefit Accrual Group
Participant Benefit Accruals By Plan Status (Median Values Shown)
CurrentPlans
FuturePlans

11
Figure 10 shows the relationship between benefit accrual rates and the prevalence of benefit reductions in another manner by comparing the median benefit accrual rates for the plans in the study data set with the percentage of participants within the plan who experience benefit reductions. Plans with a median accrual rate under the $11 threshold may have participants with accrual rates above this level that would experience a benefit reduction. This produces the irregular pattern to the left of the $11 median in Figure 10. As one would expect given the relationship described above, on average the more generous the plan benefit, the higher the risk of benefit cuts.
Figure 10. Percent of Plan Participants Expecting or Experiencing a Benefit Reduction by Plan Median Benefit Accrual Rate within Study Data Set
Large Plan Description
There are two plans within the data set that make up a disproportionate share of both their industry and the data set as a whole. One plan in the manufacturing industry contributes 82 percent to the industry participant count and more than 45 percent to the data set participant count. Another plan in retail trade contributes 59 percent and 13 percent to their industry and the data set totals, respectively. That concentrates nearly 58 percent of the data set within these two plans.
The data of both of these plans was compared within its industry and to the data set. The plan in the manufacturing industry has a benefit accrual rate that is significantly lower than the plans of the industry and the data set. This plan has a benefit accrual rate of $5.77 whereas the rest of the industry has a benefit accrual rate of $14.64 (giving the industry a benefit accrual rate of $9.68 when taken as a whole). Excluding this plan from the data set would generate a benefit accrual rate of $15.07. All of this plans’ participants receive their full benefit amount which may distort the value of the guarantee as described in this study due to the limited size of the historical data set used. If one were to ignore this plan the share of participants in Current Plans who receive their full benefit would fall to 47 percent. Regardless of which coverage level one chooses to focus on, each coverage level would indicate either a low level of benefits or an eroding level of participants receiving their full benefits once a plan receives financial assistance from PBGC.
The second largest plan is within the retail trade industry. This plan has a higher benefit accrual rate than the rest of the industry, having a mean and median of $18.13 and $10.05 respectively; compared to $11.71 and $8.05 for the rest of the industry. While the average values are different when taken in
0.0%10.0%20.0%30.0%40.0%50.0%60.0%70.0%80.0%90.0%
100.0%
$3
.28
$4
.10
$5
.01
$5
.93
$6
.98
$7
.64
$8
.23
$9
.00
$9
.21
$1
2.9
7
$1
8.0
0
$1
8.9
3
$1
9.3
5
$2
0.5
6
$2
4.0
5
$2
5.7
2
$3
1.3
6
$4
0.0
0
$4
6.8
0
$7
8.0
1
Median Benefit Accrual Rate
12
isolation from the data set, the plan’s inclusion in the data set does not dramatically impact the resulting values at a macro level.
The authors carefully considered whether to exclude one or both of these plans from the study, but since the primary purpose of the study was to examine how the multiemployer guarantee had operated in practice and was likely to operate in the future, determined that it was best to include all the data currently available. We also reviewed whether inclusion of the large plan biased the results towards showing relatively better treatment under the guarantee for individuals covered to date and concluded that:
- For the 20% of individuals in plans currently receiving financial assistance for whom we did not have usable data, broad summary data indicated that benefit levels were closer to the levels shown for all plans than if the largest plan were excluded
- For plans for which we have no data because they have been annuitized (19 of 63) and for participants who died prior to the study collection date we anticipate benefits would generally be smaller and a higher percentage guaranteed
- In conjunction, these facts argue that the conclusions regarding historical coverage would not materially change if we had been able to collect data on all participants.
The Guarantee
Figure 11 illustrates the operation of the guarantee for participants through a range of benefit accrual rates.
Figure 11. Illustration of Application of the Guarantee to the Monthly Accrual Rate
$-
$10.00
$20.00
$30.00
$40.00
$50.00
$60.00
$70.00
$80.00
$90.00
$100.00
$110.00
$1 $9 $17 $25 $33 $41 $49 $57 $65 $73 $81 $89 $97 $105
Gu
aran
tee
d A
ccru
al R
ate
Effect of Multiemployer Guarantee
Plan Accrual Rate
Partially Guaranteed
100% Benefit
Lost
$35.75 Guarantee Maximum

13
Table 1 shows the guaranteed annual benefit (and the percentage of vested earned benefit covered) for several combinations of credited service and monthly accrual rates. For example, a participant with an accrual rate of $70 and 20 years of credited service would receive $8,580 in annual benefits which is 51 percent of her earned benefit of $16,800. The earned benefit for this example is calculated as 20 × $70 × 12 = $16,800 and the guarantee benefit level calculation is{[0% × ($70 − $44) × 20] +[75% × ($44 − $11) × 20] + [(100% × $11 × 20)} × 12 = $8,580.
Table 1. Guarantee Levels for Various Combinations of Credited Service and Accrual Rates
Years of Credited Service
Monthly Accrual Rate
$10 $30 $50 $70 $90
10 $1,200 $3,030 $4,290 $4,290 $4,290
(100%) (84%) (72%) (51%) (40%)
20 $2,400 $6,060 $8,580 $8,580 $8,580
(100%) (84%) (72%) (51%) (40%)
30 $3,600 $9,090 $12,870 $12,870 $12,870
(100%) (84%) (72%) (51%) (40%)
40 $4,800 $12,120 $17,160 $17,160 $17,160
(100%) (84%) (72%) (51%) (40%) Guarantee varies based on each participant's years of service and the plan's monthly benefit accrual rate. The amounts shown above assume that plan benefits are determined by multiplying a plan-specified benefit accrual rate by years of service (as is the case for almost all multiemployer plans).
This table applies only to plans that became insolvent on or after December 31, 2000.