pbt trend monitoring: measuring lead in suspended
TRANSCRIPT

The Washington State Departments of Ecology (Ecology) and Health developed a
chemical action plan in 2009 to identify the toxic effects of lead, describe its occur-
rence in the environment, and recommend ways to reduce exposure to humans and
wildlife (Ecology and WDOH, 2009).
Ecology began a long-term monitoring program in 2008 to assess temporal changes
of lead levels in rivers and streams in Washington. The primary objectives of the
program were to (1) establish baseline levels of lead in the freshwater environment,
and (2) measure spatial and temporal trends in environmental lead levels as reduc-
tion strategies are implemented.
As part of the monitoring program, Ecology collects suspended particulate matter
(SPM) samples from 15 monitoring sites throughout Washington for analysis of
total lead. Samples are collected twice in the spring and twice in the fall at each
site. Monitoring sites (shown in Figure 1) cover a range of watershed size, land use,
and potential lead sources. Roberts et al. (2011) discuss the potential lead sources
in Washington. This report summarizes results from the fifth year of sampling
(2012).
Andy Bookter and Callie Mathieu, Environmental Assessment Program
PBT Monitoring Program website: www.ecy.wa.gov/programs/eap/toxics/pbt.html
Lead Chemical Action Plan website: www.ecy.wa.gov/programs/swfa/pbt/lead.html
For More Information
July 2013 Publication No. 13-03-030
2012 Highlighted Findings
Elevated Lead Levels in
the Spokane River and
Upper Columbia River
High Lead Concentra-
tions in Urban Streams,
Compared to Other
Streams and Rivers
Increasing Lead Levels
in the Middle Columbia
River from 2008 to 2012
Why Lead?
Ecology monitors lead in
Washington State rivers and
streams because of concern
over its toxic and persistent
properties. While lead is a
naturally occurring element,
human activities have spread
environmental contamina-
tion. Lead affects humans
and wildlife by harming
developing nervous systems,
as well as other bodily
systems. There are many
sources of lead exposure
from the indoor and outdoor
environment, and even
minor exposures may cause
some harm.
PBT Trend Monitoring: Measuring Lead in
Suspended Particulate Matter, 2012 Results
Project Overview
Figure 1. SPM Lead Monitoring Sites in Washington, 2012.
2
Field Methods: SPM samples were collected following Ecology’s standard operating procedure (SOP) for collection of
suspended particulates using in-line filtration (Meredith, 2008). Ambient water temperature, pH, and conductivity were
measured following Ecology’s SOP for collection and analysis of pH (Ward, 2007).
Laboratory Methods: Ecology’s Manchester Environmental Laboratory analyzed lead in the SPM samples following
Environmental Protection Agency Method 200.8 (ICP-MS). Total suspended solids (TSS) were estimated as dried SPM
weight on sample filters divided by filtrate volume. Standard TSS analyses are conducted using 1.5 m pore-size filters.
This study used 0.45 m pore-size filters.
Data Quality: Laboratory and field quality control (QC) tests met measurement quality objectives (MQO) set for this
project (Meredith and Furl, 2008). One field blank contained lead above the reporting limit (0.05 g/filter). That field
blank, performed at Huge Creek during the second spring sampling, contained 0.06 g/filter of lead. The lead concen-
tration of the corresponding Huge Creek field sample was below the reporting limit. Detailed quality assurance
information is available on request.
Methods
Results
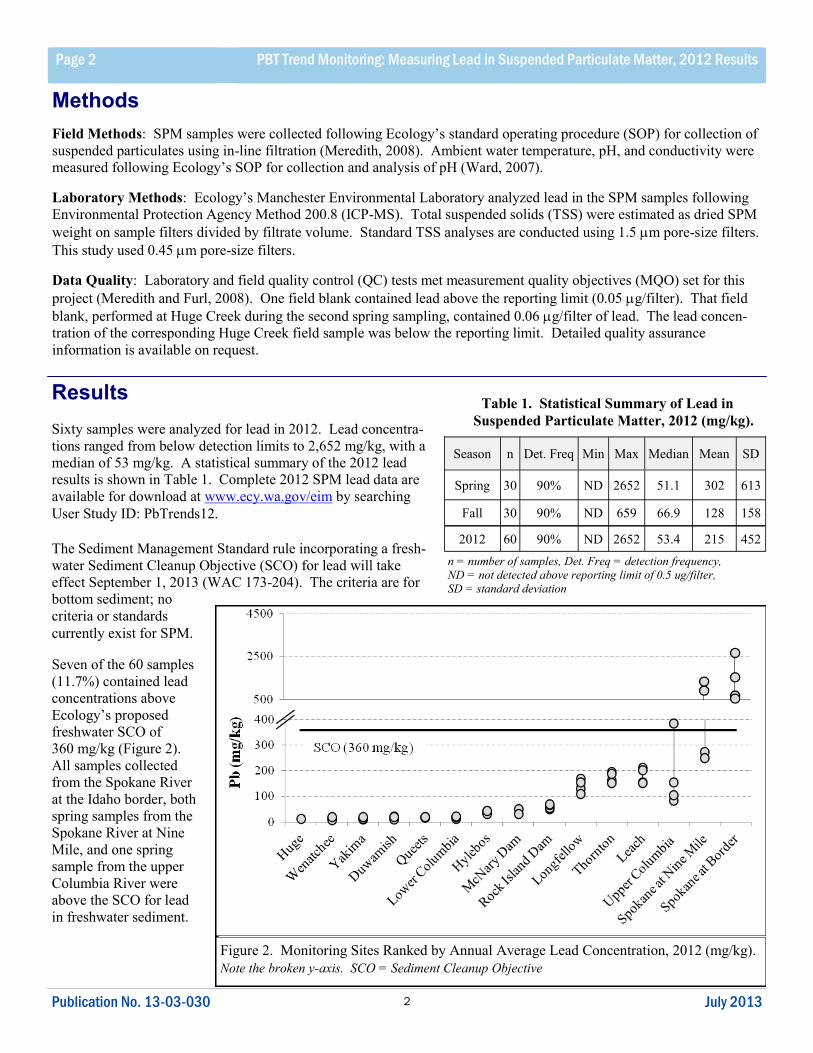
Sixty samples were analyzed for lead in 2012. Lead concentra-
tions ranged from below detection limits to 2,652 mg/kg, with a
median of 53 mg/kg. A statistical summary of the 2012 lead
results is shown in Table 1. Complete 2012 SPM lead data are
available for download at www.ecy.wa.gov/eim by searching
User Study ID: PbTrends12.
The Sediment Management Standard rule incorporating a fresh-
water Sediment Cleanup Objective (SCO) for lead will take
effect September 1, 2013 (WAC 173-204). The criteria are for
bottom sediment; no
criteria or standards
currently exist for SPM.
Page 2 PBT Trend Monitoring: Measuring Lead in Suspended Particulate Matter, 2012 Results
Publication No. 13-03-030 July 2013
Table 1. Statistical Summary of Lead in
Suspended Particulate Matter, 2012 (mg/kg).
n = number of samples, Det. Freq = detection frequency,
ND = not detected above reporting limit of 0.5 ug/filter,
SD = standard deviation
Season n Det. Freq Min Max Median Mean SD
Spring 30 90% ND 2652 51.1 302 613
Fall 30 90% ND 659 66.9 128 158
2012 60 90% ND 2652 53.4 215 452
Seven of the 60 samples
(11.7%) contained lead
concentrations above
Ecology’s proposed
freshwater SCO of
360 mg/kg (Figure 2).
All samples collected
from the Spokane River
at the Idaho border, both
spring samples from the
Spokane River at Nine
Mile, and one spring
sample from the upper
Columbia River were
above the SCO for lead
in freshwater sediment.
Figure 2. Monitoring Sites Ranked by Annual Average Lead Concentration, 2012 (mg/kg).
Note the broken y-axis. SCO = Sediment Cleanup Objective
3
Loading
Page 3 PBT Trend Monitoring: Measuring Lead in Suspended Particulate Matter, 2012 Results
Publication No. 13-03-030 July 2013
Daily particulate lead loads were estimated for each sampling site, except Hylebos Creek, using daily mean flow (cfs)
and lead concentrations per volume filtered (ug/L). Streamflow data were provided by the U.S. Geological Survey,
U.S. Army Corps of Engineers, and the City of Seattle.
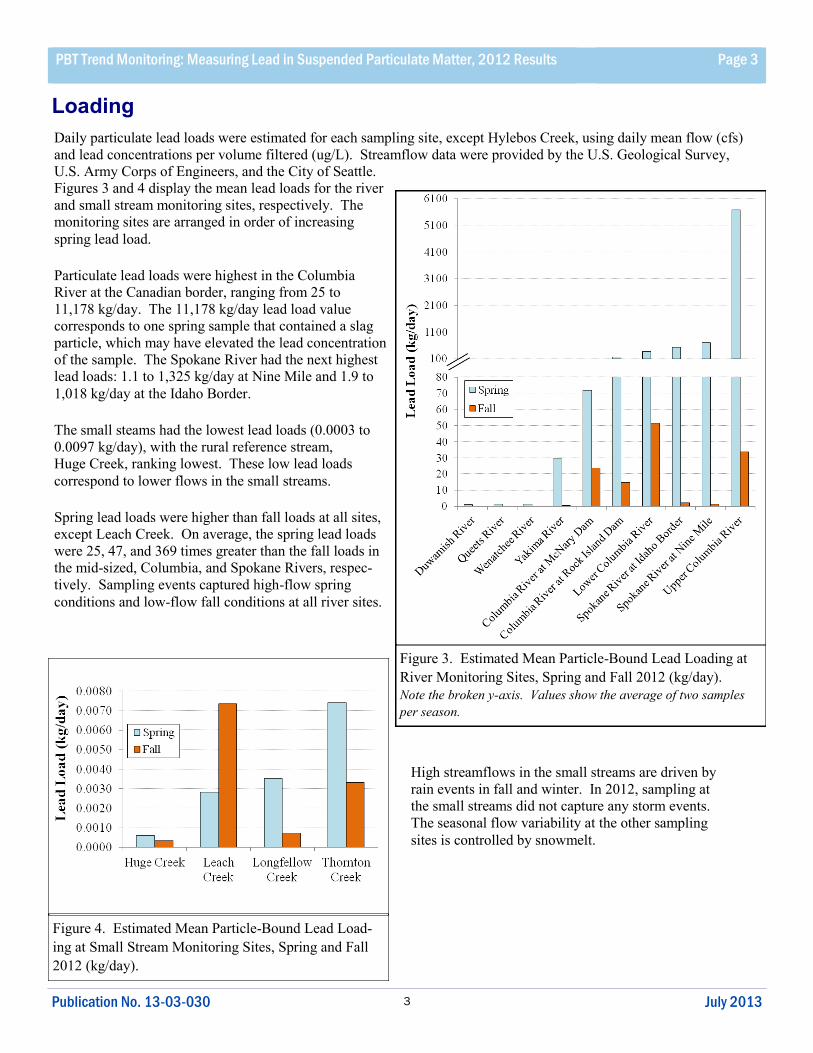
Figures 3 and 4 display the mean lead loads for the river
and small stream monitoring sites, respectively. The
monitoring sites are arranged in order of increasing
spring lead load.
Particulate lead loads were highest in the Columbia
River at the Canadian border, ranging from 25 to
11,178 kg/day. The 11,178 kg/day lead load value
corresponds to one spring sample that contained a slag
particle, which may have elevated the lead concentration
of the sample. The Spokane River had the next highest
lead loads: 1.1 to 1,325 kg/day at Nine Mile and 1.9 to
1,018 kg/day at the Idaho Border.
The small steams had the lowest lead loads (0.0003 to
0.0097 kg/day), with the rural reference stream,
Huge Creek, ranking lowest. These low lead loads
correspond to lower flows in the small streams.
Spring lead loads were higher than fall loads at all sites,
except Leach Creek. On average, the spring lead loads
were 25, 47, and 369 times greater than the fall loads in
the mid-sized, Columbia, and Spokane Rivers, respec-
tively. Sampling events captured high-flow spring
conditions and low-flow fall conditions at all river sites.
Figure 3. Estimated Mean Particle-Bound Lead Loading at
River Monitoring Sites, Spring and Fall 2012 (kg/day).
Note the broken y-axis. Values show the average of two samples
per season.
Figure 4. Estimated Mean Particle-Bound Lead Load-
ing at Small Stream Monitoring Sites, Spring and Fall
2012 (kg/day).
High streamflows in the small streams are driven by
rain events in fall and winter. In 2012, sampling at
the small streams did not capture any storm events.
The seasonal flow variability at the other sampling
sites is controlled by snowmelt.
4
As of 2012, five years of SPM lead data have been col-
lected at 11 of the monitoring sites. It may not be possible
to draw conclusive statistical trends from only five years
of data. However, some general patterns can be observed.
The following sections describe patterns in lead levels
observed at the monitoring sites between 2008 and 2012.
We used least squares linear regression and the Mann-
Kendall test to evaluate the data for temporal trends.
Linear regression is a parametric model. The better the
model fit, the closer the resultant R2 value is to 1. Mann-
Kendall is a non-parametric rank test for identifying trends
in time- series data. Mann-Kendall compares the relative
magnitudes of sample data rather than the data values
themselves. If the resultant tau value is 0, then no
consistently increasing or decreasing pattern is evident.
Negative tau values indicate a decreasing trend, and
positive values indicate an increasing trend. Data below
detection limits were excluded from the analyses.
Temporal Trends
Page 4 PBT Trend Monitoring: Measuring Lead in Suspended Particulate Matter, 2012 Results
Publication No. 13-03-030 July 2013
Spokane River
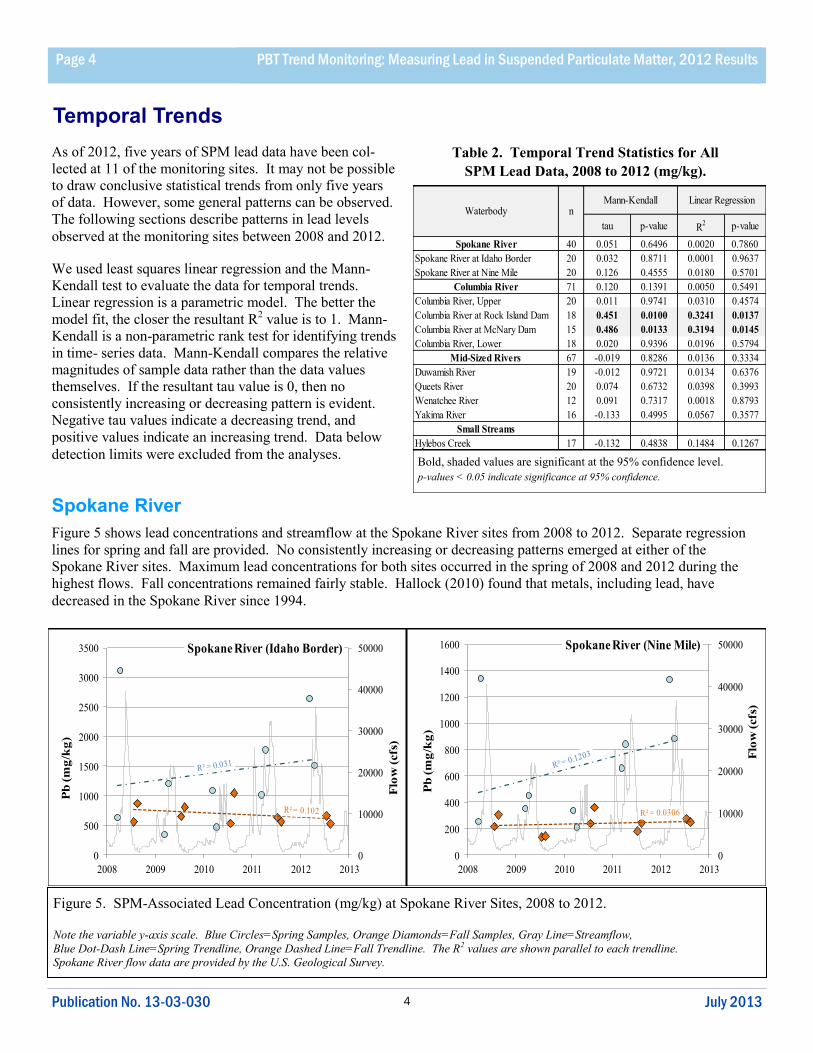
Figure 5 shows lead concentrations and streamflow at the Spokane River sites from 2008 to 2012. Separate regression
lines for spring and fall are provided. No consistently increasing or decreasing patterns emerged at either of the
Spokane River sites. Maximum lead concentrations for both sites occurred in the spring of 2008 and 2012 during the
highest flows. Fall concentrations remained fairly stable. Hallock (2010) found that metals, including lead, have
decreased in the Spokane River since 1994.
Table 2. Temporal Trend Statistics for All
SPM Lead Data, 2008 to 2012 (mg/kg).
Bold, shaded values are significant at the 95% confidence level.
p-values < 0.05 indicate significance at 95% confidence.
tau p-value R2 p-value
Spokane River 40 0.051 0.6496 0.0020 0.7860
Spokane River at Idaho Border 20 0.032 0.8711 0.0001 0.9637
Spokane River at Nine Mile 20 0.126 0.4555 0.0180 0.5701
Columbia River 71 0.120 0.1391 0.0050 0.5491
Columbia River, Upper 20 0.011 0.9741 0.0310 0.4574
Columbia River at Rock Island Dam 18 0.451 0.0100 0.3241 0.0137
Columbia River at McNary Dam 15 0.486 0.0133 0.3194 0.0145
Columbia River, Lower 18 0.020 0.9396 0.0196 0.5794
Mid-Sized Rivers 67 -0.019 0.8286 0.0136 0.3334
Duwamish River 19 -0.012 0.9721 0.0134 0.6376
Queets River 20 0.074 0.6732 0.0398 0.3993
Wenatchee River 12 0.091 0.7317 0.0018 0.8793
Yakima River 16 -0.133 0.4995 0.0567 0.3577
Small Streams
Hylebos Creek 17 -0.132 0.4838 0.1484 0.1267
Waterbody nMann-Kendall Linear Regression
Figure 5. SPM-Associated Lead Concentration (mg/kg) at Spokane River Sites, 2008 to 2012.
Note the variable y-axis scale. Blue Circles=Spring Samples, Orange Diamonds=Fall Samples, Gray Line=Streamflow,
Blue Dot-Dash Line=Spring Trendline, Orange Dashed Line=Fall Trendline. The R2 values are shown parallel to each trendline.
Spokane River flow data are provided by the U.S. Geological Survey.
0
10000
20000
30000
40000
50000
0
500
1000
1500
2000
2500
3000
3500
2008 2009 2010 2011 2012 2013
Flo
w (cfs
)
Pb
(m
g/k
g)
Spokane River (Idaho Border)
0
10000
20000
30000
40000
50000
0
200
400
600
800
1000
1200
1400
1600
2008 2009 2010 2011 2012 2013
Flo
w (cfs
)
Pb
(m
g/k
g)
Spokane River (Nine Mile)

5
Page 5 PBT Trend Monitoring: Measuring Lead in Suspended Particulate Matter, 2012 Results
Publication No. 13-03-030 July 2013
Figure 6 displays the Columbia River lead concentrations and streamflow from 2008 to 2012, with separate regression
lines for spring and fall.
The Mann-Kendall test and linear regression both indicated increasing lead levels for the Columbia River at the Rock
Island and McNary Dam sites from 2008 to 2012 (Table 2). Spring lead concentrations increased more than fall
concentrations (Figure 6). The increasing lead trends are statistically significant for the spring data and all of the lead
data combined. The fall data did not show significant patterns.
The upward trend in SPM lead at the middle Columbia River sites may be due to increased streamflow carrying more
suspended sediment. Streamflow had a slight, yet statistically significant, increase at both of the middle Columbia River
sites from 2008 to 2012. In addition, TSS values are positively correlated with flow at both the Rock Island and McNary
Dam sites. The spring samples were collected during high flows and show the greatest increase in lead concentration.
The above correlation and streamflow trend analysis results are available upon request.
No statistically significant trends were found for the upper or lower Columbia River sites from 2008 to 2012. The lower
Columbia River lead levels remained fairly stable throughout the sampling period. The highest lead concentrations at
the upper Columbia River site were measured in spring of 2008 and 2012, during rising spring flows when streambed
and bank erosion increase the suspended sediment load of the river.
Columbia River
Figure 6. SPM-Associated Lead Concentrations (mg/kg) at Columbia River Sites, 2008 to 2012.
Note the variable y-axis scale. Blue Circles=Spring Samples, Orange Diamonds=Fall Samples, Gray Line=Streamflow, Blue Dot-Dash
Line=Spring Trendline, Orange Dashed Line=Fall Trendline. The R2 values are shown parallel to each trendline. Bold R2 values are significant
at the 95% confidence interval. Columbia River flow data are provided by the U.S. Geological Survey and U.S. Army Corps of Engineers.
0
50000
100000
150000
200000
250000
300000
0
50
100
150
200
250
300
350
400
450
2008 2009 2010 2011 2012 2013
Flo
w (cf
s)
Pb
(m
g/k
g)
Upper Columbia River
0
50000
100000
150000
200000
250000
300000
350000
0
10
20
30
40
50
60
70
80
2008 2009 2010 2011 2012 2013
Flo
w (cf
s)
Pb
(m
g/k
g)
Columbia River (Rock Island Dam)
0
100000
200000
300000
400000
500000
600000
0
10
20
30
40
50
60
70
2008 2009 2010 2011 2012 2013
Flo
w (cf
s)
Pb
(m
g/k
g)
Columbia R iver (McNary Dam)
0
100000
200000
300000
400000
500000
600000
700000
0
5
10
15
20
25
30
2008 2009 2010 2011 2012 2013
Flo
w (cf
s)
Pb
(m
g/k
g)
Lower Columbia River

6
Page 6 PBT Trend Monitoring: Measuring Lead in Suspended Particulate Matter, 2012 Results
Publication No. 13-03-030 July 2013
The mid-sized rivers sampled for this study include the Duwamish, Queets, Wenatchee, and Yakima. Figure 7 displays
the SPM lead concentration and streamflow data for these rivers from 2008 to 2012. Separate regression lines for spring
and fall are provided.
No consistently increasing or decreasing patterns emerged for the mid-sized rivers, except the Queets. Queets River
lead concentrations significantly increased in the spring samples and generally decreased in the fall samples, although
low levels were recorded in both seasons. No significant temporal change was found when all data were combined
(Table 2). The Queets River site is included in this study as a reference stream, representing a mid-sized river with few
roads and very little development.
Lead concentrations have generally been very low at all of the mid-size river sites, reflecting baseline levels. Spring
lead levels show a very stable pattern at the Duwamish and Wenatchee River sites. Fall lead levels at those rivers were
more erratic with no apparent pattern. The Yakima River lead levels show no apparent pattern in either spring or fall.
Mid-Sized Rivers
Figure 7. SPM-Associated Lead Concentration (mg/kg) at Mid-Sized River Sites, 2008 to 2012.
Note the variable y-axis scale. Blue Circles=Spring Samples, Orange Diamonds=Fall Samples, Gray Line=Streamflow,
Blue Dot-Dash Line=Spring Trendline, Orange Dashed Line=Fall Trendline. The R2 values are shown parallel to each trendline.
Bold R2 values are significant at the 95% confidence interval. Flow data for the mid-sized rivers provided by the U.S. Geological Survey.
R² = 0.0024
0
2000
4000
6000
8000
10000
0
20
40
60
80
100
120
2008 2009 2010 2011 2012 2013
Flo
w (cf
s)
Pb
(m
g/k
g)
Duwamish River
0
5000
10000
15000
20000
25000
0
10
20
30
40
50
60
2008 2009 2010 2011 2012 2013
Flo
w (cf
s)
Pb
(m
g/k
g)
Wenatchee River
0
15000
30000
45000
60000
75000
90000
0
5
10
15
20
25
30
35
40
2008 2009 2010 2011 2012 2013
Flo
w (cf
s)
Pb
(m
g/k
g)
Queets River
0
5000
10000
15000
20000
25000
30000
0
5
10
15
20
25
30
2008 2009 2010 2011 2012 2013
Flo
w (cf
s)
Pb
(m
g/k
g)
Yakima River
7
Small Streams
Lead concentrations in Leach, Longfellow, and Thornton Creeks were consistently higher than levels at most other
monitoring sites. The Spokane and upper Columbia River sites had lead levels similar to or greater than levels in the
urban streams. Hylebos Creek lead concentrations were not as high as in Leach, Longfellow, and Thornton Creeks.
The Huge Creek lead levels were less than 30% of the lead measured from all other sites sampled for this project.
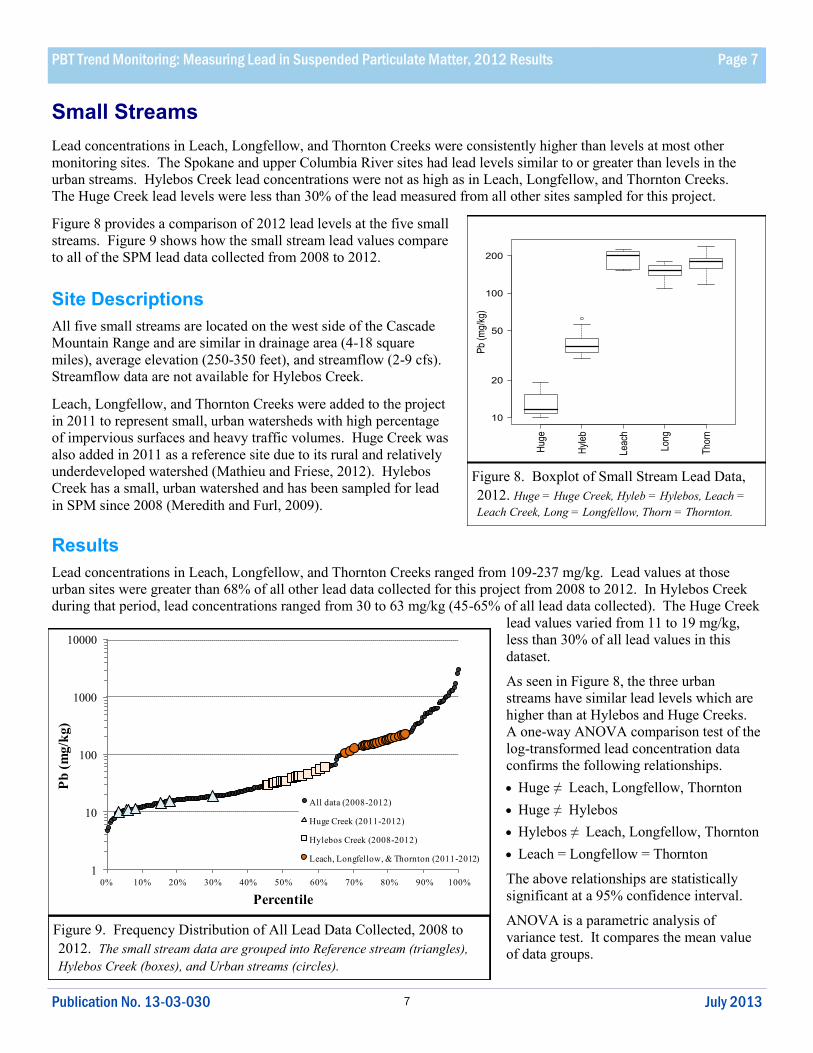
Figure 8 provides a comparison of 2012 lead levels at the five small
streams. Figure 9 shows how the small stream lead values compare
to all of the SPM lead data collected from 2008 to 2012.
Page 7 PBT Trend Monitoring: Measuring Lead in Suspended Particulate Matter, 2012 Results
Publication No. 13-03-030 July 2013
Hug
e
Hyl
eb
Leac
h
Long
Tho
rn
10
20
50
100
200
Pb
(mg/
kg)
Figure 8. Boxplot of Small Stream Lead Data,
2012. Huge = Huge Creek, Hyleb = Hylebos, Leach =
Leach Creek, Long = Longfellow, Thorn = Thornton.
Site Descriptions
All five small streams are located on the west side of the Cascade
Mountain Range and are similar in drainage area (4-18 square
miles), average elevation (250-350 feet), and streamflow (2-9 cfs).
Streamflow data are not available for Hylebos Creek.
Leach, Longfellow, and Thornton Creeks were added to the project
in 2011 to represent small, urban watersheds with high percentage
of impervious surfaces and heavy traffic volumes. Huge Creek was
also added in 2011 as a reference site due to its rural and relatively
underdeveloped watershed (Mathieu and Friese, 2012). Hylebos
Creek has a small, urban watershed and has been sampled for lead
in SPM since 2008 (Meredith and Furl, 2009).
Results
Lead concentrations in Leach, Longfellow, and Thornton Creeks ranged from 109-237 mg/kg. Lead values at those
urban sites were greater than 68% of all other lead data collected for this project from 2008 to 2012. In Hylebos Creek
during that period, lead concentrations ranged from 30 to 63 mg/kg (45-65% of all lead data collected). The Huge Creek
lead values varied from 11 to 19 mg/kg,
less than 30% of all lead values in this
dataset.
As seen in Figure 8, the three urban
streams have similar lead levels which are
higher than at Hylebos and Huge Creeks.
A one-way ANOVA comparison test of the
log-transformed lead concentration data
confirms the following relationships.
Huge ≠ Leach, Longfellow, Thornton
Huge ≠ Hylebos
Hylebos ≠ Leach, Longfellow, Thornton
Leach = Longfellow = Thornton
The above relationships are statistically
significant at a 95% confidence interval.
ANOVA is a parametric analysis of
variance test. It compares the mean value
of data groups.
Figure 9. Frequency Distribution of All Lead Data Collected, 2008 to
2012. The small stream data are grouped into Reference stream (triangles),
Hylebos Creek (boxes), and Urban streams (circles).
1
10
100
1000
10000
0% 10% 20% 30% 40% 50% 60% 70% 80% 90% 100%
Pb
(m
g/k
g)
Percentile
All data (2008-2012)
Huge Creek (2011-2012)
Hylebos Creek (2008-2012)
Leach, Longfellow, & Thornton (2011-2012)

8
Page 8 PBT Trend Monitoring: Measuring Lead in Suspended Particulate Matter, 2012 Results
This report summarizes results from the fifth year of a long-term study to evaluate the spatial and temporal trends in
environmental levels of lead in Washington State waterbodies. A total of 60 suspended particulate matter (SPM)
samples from 15 rivers and streams were analyzed for lead in 2012. Results of this study support the following
conclusions:
Samples from the Spokane River at the Idaho border contained the highest lead concentrations, followed by
samples from the Spokane River at Nine Mile. Lead levels were also elevated at the three urban streams
(Leach, Thornton, and Longfellow Creeks) and the upper Columbia River near the Canadian border.
Seven out of 60 samples (11.7%) contained lead levels above Ecology’s proposed freshwater Sediment
Cleanup Objective (SCO) of 360 mg/kg. All samples collected from the Spokane River at the Idaho border,
both the spring samples from the Spokane River at Nine Mile, and one spring sample from the upper Colum-
bia River were above the SCO for lead. The 360 mg/kg SCO for lead is for freshwater sediment, not SPM.
Temporal analysis for lead samples measured from 2008 to 2012 indicated few consistently increasing or
decreasing trends in lead levels. The two mid-section Columbia River sites (Rock Island and McNary Dams)
had statistically significant increases in lead concentrations. This increase may be due to a slight increase in
streamflow over the same period.
Particulate lead concentrations (mg/kg) measured at the urban streams were consistently higher than at other
monitoring sites, with the exception of the Spokane and upper Columbia Rivers. Mean lead concentrations
were significantly higher at the three urbanized streams than Huge Creek, the reference stream. Hylebos
Creek, an urban stream where substantial wetland restoration efforts have been carried out, contained lead
concentrations significantly greater than the reference stream, but less than the other urban streams.
Particulate lead loading (kg/day) was greatest in the Columbia and Spokane Rivers. The Columbia River at
the Canadian border had the highest lead load value. The lowest lead loads were found in the small streams.
Conclusions
Recommendations
Results from the 2012 study support the following recommendations:
1) Increase sampling frequency. Additional samples throughout the year may better highlight temporal patterns.
Collecting more samples throughout the year will provide the opportunity to sample a wider range of the
flow regime. Spring lead levels have increased at some sites, whereas fall levels have not. Samples
collected in summer and winter may indicate if lead levels are increasing during the rest of the year.
Studies with a longer record for the Spokane River have seen a decline in levels of toxic metals. Filling in
seasonal gaps in our data record and increasing the number of data points may elucidate these or other
trends in particulate lead levels.
The middle reaches of the Columbia River show increasing particulate lead concentrations. Additional
samples throughout the year may help determine if spring samples are the primary driver of this trend.
2) Add more small streams to the monitoring site list. The lead levels in small, urban streams are likely to be the
most dynamic as Chemical Action Plan reduction strategies are implemented.
3) Discontinue sampling from the mid-sized rivers, with the exception of the reference site, Queets River. Reallocate
the freed-up resources for additional seasonal and small stream sampling. The mid-sized rivers did not reveal any
trends after five years of data. Instead, the levels measured from these sites are reflective of baseline conditions.
Trends are more likely to be seen in smaller streams or lead-impacted rivers.
Publication No. 13-03-030 July 2013

9
Page 9 PBT Trend Monitoring: Measuring Lead in Suspended Particulate Matter, 2012 Results
Authors: Andy Bookter and Callie Mathieu
Environmental Assessment Program
P.O. Box 47600
Olympia, WA 98504-7600
Communications Consultant
Phone: (360) 407-6764
Washington State Department of Ecology - www.ecy.wa.gov/
Headquarters, Olympia (360) 407-6000
Northwest Regional Office, Bellevue (425) 649-7000
Southwest Regional Office, Olympia (360) 407-6300
Central Regional Office, Yakima (509) 575-2490
Eastern Regional Office, Spokane (509) 329-3400
This report is available on the Department of Ecology’s website at
https://fortress.wa.gov/ecy/publications/SummaryPages/1303030.html
Data for this project are available at Ecology’s Environmental Information Management
(EIM) website www.ecy.wa.gov/eim/index.htm. Search User Study ID, PbTrends12.
Hallock, D., 2010. River and Stream Water Quality Monitoring Report: Water Year 2010. Washington State
Department of Ecology, Olympia, WA. Publication No. 11-03-037.
https://fortress.wa.gov/ecy/publications/SummaryPages/1103037.html
Meredith, C., 2008. Standard Operating Procedure for Collecting Freshwater Suspended Particulate Matter Samples
using In-line Filtration. Washington State Department of Ecology, Olympia, WA. SOP Number EAP041.
www.ecy.wa.gov/programs/eap/quality.html.
Meredith, C. and C. Furl, 2008. Addendum #1 to Quality Assurance Project Plan: A Trend Monitoring Component for
Organic PBTs in the Washington State Toxics Monitoring Program. Washington State Department of Ecology,
Olympia WA. Publication No. 07-03-104ADD1.
https://fortress.wa.gov/ecy/publications/SummaryPages/0703104add1.html
Meredith, C. and C. Furl, 2009. PBT Trend Monitoring: Lead in Suspended Particulate Matter, 2008.
Washington State Department of Ecology, Olympia WA. Publication No. 09-03-020.
https://fortress.wa.gov/ecy/publications/SummaryPages/0903020.html
Mathieu, C. and M. Friese, 2012. PBT Trend Monitoring: Lead in Suspended Particulate Matter, 2011.
Washington State Department of Ecology, Olympia WA. Publication No. 12-03-031.
https://fortress.wa.gov/ecy/publications/SummaryPages/1203031.html
Roberts, T., D. Serdar, J. Maroncelli, and H. Davies, 2011. Control of Toxic Chemicals in Puget Sound Phase 3:
Primary Sources of Selected Toxic Chemicals and Quantities Released in the Puget Sound Basin.
Washington State Department of Ecology, Olympia, WA. Publication No. 11-03-024.
https://fortress.wa.gov/ecy/publications/SummaryPages/1103024.html
WAC 173-204. Sediment Management Standards. Washington Administration Code. Chapter 173-204.
http://apps.leg.wa.gov/wac/default.aspx?cite=173-204 and
https://fortress.wa.gov/ecy/publications/summarypages/1309043.html
Ward, W., 2007. Standard Operating Procedures for the Collection and Analysis of pH Samples. Washington State
Department of Ecology, Olympia WA. SOP Number EAP031. www.ecy.wa.gov/programs/eap/quality.html.
References
If you need this
document in a format
for the visually
impaired,
call 360-407-6764.
Persons with hearing
loss can call 711 for
Washington Relay
Service.
Persons with a
speech disability can call 877-833-6341.
Department of Ecology Contacts
Publication No. 13-03-030 July 2013

10