p.c cncrete
TRANSCRIPT

8/3/2019 p.c cncrete
http://slidepdf.com/reader/full/pc-cncrete 1/14
2003 ECI Conference on Advanced Materials for Construction
of Bridges, Buildings, and Other Structures III % FILE:
/main/production/doc/data/journals/services.bepress.com/advanced materials/assets/location.in
Switzerland% FILE:
/main/production/doc/data/journals/services.bepress.com/eci/assets/proceedings/pdftitlepage.te
(cont)
Editors: % FILE:
/main/production/doc/data/journals/services.bepress.com/advanced materials/assets/editors.inc
Mistry, P.E., Office of Bridge Technology, Federal Highway Administration,
USA
Dr. Atorod Azizinamini, Ph.D., P.E., Civil Engineering Department,
University of Nebraska, USA
John M. Hooks, P.E., Office of Infrastructure Research & Development,
Federal Highway Administration, USA
% FILE:
/main/production/doc/data/journals/services.bepress.com/eci/assets/proceedings/defines.tmpl
(cont)
Year Paper
Seismic Performance of Precast
Column-Foundation Connection Assembled by
Post-Tensioning
Minehiro Nishiyama∗ Fumio Watanabe†
8/3/2019 p.c cncrete
http://slidepdf.com/reader/full/pc-cncrete 2/14
Seismic Performance of Precast
Column-Foundation Connection Assembled by
Post-Tensioning
Abstract
In order to develop design recommendations for column-foundation con-nection assembled by post-tensioning in seismic regions, cyclic loading testswere carried out on 14 test units simulating such kind of connections underearthquake loading. The tests were consisted of two series: Series A wasmainly for comparison between precast reinforced and precast prestressedconcrete column-foundation connections, and Series B for investigating dif-
ferences between test units with grouted and ungrouted tendons. The mainexperimental parameter other than the above was an axial load level.
∗Kyoto University†
Kyoto University
http://services.bepress.com/eci/advanced materials/5
Copyright c2005 by the authors.
8/3/2019 p.c cncrete
http://slidepdf.com/reader/full/pc-cncrete 3/14
SEISMIC PERFORMANCE OFPRECAST COLUMN-FOUNDATION CONNECTION
ASSEMBLED BY POST-TENSIONING
Minehiro Nishiyama and Fumio Watanabe
Built Environment Materials and Structural Systems
Department of Urban and Environmental Engineering
Kyoto University
Kyoto 606-8501, JAPAN
T & F: 81-75-753-5747; E: [email protected]
ABSTRACT
In order to develop design recommendations for column-foundation connectionassembled by post-tensioning in seismic regions, cyclic loading tests were carried
out on 14 test units simulating such kind of connections under earthquake loading.
The tests were consisted of two series: Series A was mainly for comparison between
precast reinforced and precast prestressed concrete column-foundation connections,
and Series B for investigating differences between test units with grouted and
ungrouted tendons. The main experimental parameter other than the above was an
axial load level.
INTRODUCTION
Post-tensioned precast construction has been getting popular in Japan because
of the following advantages over conventional cast-in-situ construction: 1) Easier
framing and less concrete casting at construction sites. 2) Shear transfer at the
interface between members which are connected is easily achieved by friction due
to prestressing force. 3) Full depth crack opening at the beam-column interface
under cyclic loading at a large inelastic deformation, which may result in pinched
hysteresis curves, is suppressed by prestress. 4) Permanent displacement after
major earthquakes is smaller than that for ordinary reinforced concrete.
One type of the post-tensioned connections used in practice is a column-foundation
connection. Ordinary precast reinforced concrete system is also often used. InJapan non-prestressed precast columns are more popular than prestressed ones.
However, from the viewpoint of construction and restriction of construction time,
there is a case that precast prestressed concrete system may be a better solution.
In Japan use of unbonded tendons for primary seismic resistant members like
girders, columns and structural walls had been prohibited. This year the code has
been revised and now unbonded tendons can be used for structural members if a
kind of displacement-based design different from the currently used allowable stress
based design is utilized, and some measures is taken against tendon fracture:
protection for girders from falling down.
1Nishiyama and Watanabe: Seismic Performance of Precast Column-Foundation Connection Assem
Produced by The Berkeley Electronic Press, 2011
8/3/2019 p.c cncrete
http://slidepdf.com/reader/full/pc-cncrete 4/14
In this paper, two series of loading tests are reported. One is Series A in which
dual-phase composite prestressing steel bars are used, and reinforced concrete
precast column-foundation connections are compared with prestressed ones in
terms of seismic performance. The other is Series B for investigating differences
in seismic performance between test units assembled by grouted and ungrouted
tendons.
EXPERIMENTAL WORK
The experimental work is divided into two test series; in Series A dual-phase
composite prestressing steel bars were used to assemble precast column-foundation
connections. Ordinary precast reinforced concrete column-foundation connections
were also constructed and tested. In addition, three test units were assembled
using ordinary prestressing steel bars. Test series B was planned for investigatingdifferences between precast prestressed column-foundation connections with
grouted and ungrouted tendons.
Series A
Dual-Phase Composite Prestressing Steel Bars
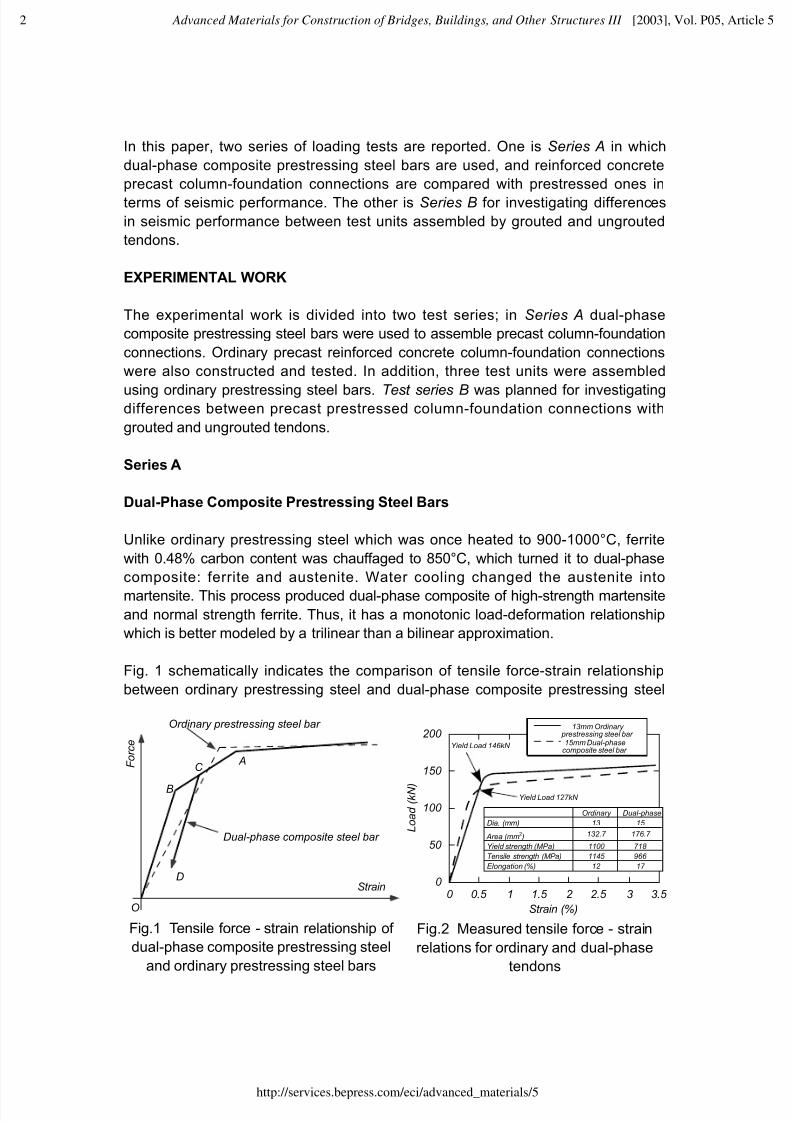
Unlike ordinary prestressing steel which was once heated to 900-1000°C, ferrite
with 0.48% carbon content was chauffaged to 850°C, which turned it to dual-phase
composite: ferrite and austenite. Water cooling changed the austenite into
martensite. This process produced dual-phase composite of high-strength martensite
and normal strength ferrite. Thus, it has a monotonic load-deformation relationship
which is better modeled by a trilinear than a bilinear approximation.
Fig. 1 schematically indicates the comparison of tensile force-strain relationship
between ordinary prestressing steel and dual-phase composite prestressing steel
Fig.1 Tensile force - strain relationship of
dual-phase composite prestressing steel
and ordinary prestressing steel bars
0
50
100
150
200
0 0.5 1 1.5 2 2.5 3 3.5
13mm Ordinary prestressing steel bar
15mm Dual-phasecomposite steel bar
L o a d ( k N )
Strain (%)
Dual-phaseOrdinary
15 13Dia. (mm)
176.7 132.7 Area (mm2 )
718 1100 Yield strength (MPa)
966 1145 Tensile strength (MPa)
17 12 Elongation (%)
Yield Load 127kN
Yield Load 146kN
Fig.2 Measured tensile force - strain
relations for ordinary and dual-phase
tendons
O
A
B
C
Dual-phase composite steel bar
Ordinary prestressing steel bar
Strain
F o r c e
D
Advanced Materials for Construction of Bridges, Buildings, and Other Structures III [2003], Vol. P05, Article 5
http://services.bepress.com/eci/advanced_materials/5

8/3/2019 p.c cncrete
http://slidepdf.com/reader/full/pc-cncrete 5/14
bar. Since dual-phase composite steel bar should have a larger sectional area than
ordinary prestressing steel to have approximately the same yield tensile force, the
sectional area and the elastic stiffness of the dual-phase composite steel are larger
than the ordinary prestressing steel. In the dual-phase composite prestressing steel
bar the second point of change in stiffness (Point A) occurs when the high-strength
part (martensite) yields. Thefi rst point of change in stiffness (Point B) is used tomodel the nonlinear behavior due to yielding of the ordinary strength part (ferrite).
Initial prestress is expected to be introduced to a stress (Point C) between the
two points. Hysteresis loops between the two points contribute to the hysteresis
energy dissipation. Tensile force-strain curves obtained from the tensile tests of the
prestressing steel bars are shown in Fig. 2. They have approximately the same yield
tensile force. Therefore, the dual-phase bar has a larger sectional area, and larger
elastic stiffness than the ordinary bar.
Test Units
Eight precast column-to-foundation connections were constructed. Three of themwere conventionally reinforced by non-prestressed ordinary strength steel. The
other units were post-tensioned by prestressing steel bars. Their specifi cations are
summarized in Table 1. A typical post-tensioned test unit is illustrated in Fig.3.
The introduced prestress corresponded to the stress larger than the fi rst yield point
of the dual-phase composite prestressing steel bar. Thus, the dual-phase composite
prestressing steel bar was expected to be effective for hysteresis energy dissipation
in the early stage of loading. Effective prestressing forces at the time of testing were
426.7kN, 411.4kN, 418.9kN, 348.1kN and 356.5kN for PC1, PC2, PC3, PC4 and
Fig.3 Prestressed concrete test unit of Series A
25mmThick Plate
Column section
Longitudinal
Steel Bars
25mmThick Plate
4- 13PrestressingTendons
15mmMortar Joint
800
LoadingPoint
250
4- 9
15
φ
φ
50
250
150 50
D6 Ties
4- 13 PrestressingTendons
φ
(UNIT:mm)
D 6 @ 3 0
4- 9 Steel Barsφ
1 0 0
4 0 0
5 0 0
1 0 0
2 5 0
5 0
5 0
1 5 0
3Nishiyama and Watanabe: Seismic Performance of Precast Column-Foundation Connection Assem
Produced by The Berkeley Electronic Press, 2011

8/3/2019 p.c cncrete
http://slidepdf.com/reader/full/pc-cncrete 6/14
PC5, respectively. Immediately after introduction of prestress grout was injected into
the sheath. W/C ratio of the grout was 45%. The compressive strength of the grout
attained 38.0MPa.
The compressive strength of concrete used for the columns and the foundations
of the test units were 35.7MPa and 38.8MPa, respectively. The joint mortar at the
interface of the foundation and the column had a compressive strength of 56.9MPa.
Table 1 Test units in Series A
Test unit Longitudinal rebars Column axial load (kN)
RC1
8-D13 (SD395)
550 (0.25)*
RC2 980 (0.45)*
RC3 -224 (-0.46)**
PC1 Ordinary prestressing steel bars
4-φ13 (SBPR930/1080)
550 (0.25)*PC2 980 (0.45)*
PC3 -224 (-0.38)**
PC4 Dual-phase composite prestressing
steel bars 4-φ15
550 (0.25)*
PC5 -224 (-0.44)**
*(): N/f' c A
g , N : axial load, f'
c : concrete compressive strength, A
g : column sectional area
**(): N/f y A
s, f
y : yield strength of longitudinal rebar, A
s: total area of rebars
Testing Methods
After the specifi ed axial load was applied, horizontal load was quasi-staticallyapplied to the top of the column. The fi rst loading cycle was up to the fi rst cracking
load which was detected by a observer. Then, the load was reversed to the negative
direction to as large displacement as the positive loading. This loading cycle was
followed by a series of defl ection controlled cycles comprising two full cycles to each
of the column rotation angles of ±1/200, ±1/100, ±1/50, ±1/33 and ±1/25.
General Behavior of Test Units
Figure 4 shows the horizontal defl ection at the top of the column plotted against the
corresponding load of the column for each unit. The horizontal load plotted in Fig. 4
includes horizontal component of the axial load. All test units was able to be loaded
to the last loading cycles to the column rotation angle of 1/25.
Prestressed Concrete vs. Reinforced Concrete
The prestressed concrete test unit PC1 showed narrower hysteresis loops than the
reinforced concrete unit RC1. They were subjected to 550kN (0.25f’ c A
g ). Prestressing
force was equivalent to the axial compressive load of 0.19 f’ c A
g if loss of prestress
due to column shortening was not considered. Equivalent viscous damping of
each specimen is calculated and shown in Fig. 5. PC1 dissipated 1.58 times larger
Advanced Materials for Construction of Bridges, Buildings, and Other Structures III [2003], Vol. P05, Article 5
http://services.bepress.com/eci/advanced_materials/5

8/3/2019 p.c cncrete
http://slidepdf.com/reader/full/pc-cncrete 7/14
hysteresis energy than RC1 at the column rotation angle of 1/100, but equivalent
damping factor of RC1 is larger than that of PC1 at the larger displacement: 48%
larger at 1/50 and 71% at 1/25 in the column rotation angle.
For the test units under the axial load of 980kN, PC2 and RC2, both units were
able to be loaded to a column rotation angle of 1/25. The hysteresis loops obtained
are stable without pinching and large capacity reduction. RC2 dissipated larger
hyseresis energy than PC2. Comparison of equivalent damping factor shows 21%
larger equivalent damping at 1/100 and 31% at 1/25 of RC2 than PC2.
For the test units subjected to tensile axial load, RC3 and PC3, less pinching of
PC3 had been expected because of prestressing force which connected the column
and foundation tightly. However, the actual hysteresis loops of PC3 are pinched
and narrow. This is not because of slip at the interface between the column and thefoundation or at the joint mortar. Displacements measured at the interface indicate
larger transverse displacement in RC3 than in PC3. One of the possible reasons
may be a stress-strain relationship of prestressing steel. Stiffness reduction due
-150
-100
-50
0
50
100
150
-30 -20 -10 0 10 20 30
L o a d ,
P ( k N )
1/100 1/50
Deflection, d (mm)
RC3
Axial load = -224kN (-0.46 f y As )Ordinary RC
-150
-100
-50
0
50
100
150
-30 -20 -10 0 10 20 30
L o a d ,
P ( k N )
1/100 1/50
Deflection, d (mm)
Axial load = -224kN (-0.38f y As )Ordinary ps steel bars
PC3
-150
-100
-50
0
50
100
150
-30 -20 -10 0 10 20 30
L o a d ,
P ( k N )
1/100 1/50
Deflection,d (mm)
Axial load = -224kN (-0.4 4f y As )Graded composite ps steel bars
PC5
-200
-100
0
100
200
-30 -20 -10 0 10 20 30
L o a d ,
P ( k N )
1/100 1/50
Deflection,d (mm)
Axial load = 550kN (0.25f'cAg)Ordinary RC
RC1
-200
-100
0
100
200
-30 -20 -10 0 10 20 30
L o a d ,
P ( k N )
1/100 1/50
Deflection,d (mm)
Axial load = 980kN (0.45f'cAg)Ordinary RC
RC2
-200
-100
0
100
200
-30 -20 -10 0 10 20 30
L o a d ,
P ( k N )
1/100 1/50
Deflection,d (mm)
PC1
Axial load = 550kN (0.25f'cAg)Ordinary ps steel bars
-200
-100
0
100
200
-30 -20 -10 0 10 20 30
L o a d ,
P ( k N )
1/100 1/50
Deflection,d (mm)
Axial load = 980kN (0.45f'cAg)Ordinary ps steel bars
PC2
-200
-100
0
100
200
-30 -20 -10 0 10 20 30
L o a d ,
P ( k N )
1/100 1/50
Deflection, d (mm)
Axial load = 550kN (0.25f'cAg)Graded composite ps steel bars
PC4
0.45f'cAg RC2 PC2
0.25f'cAg RC1 PC1 PC4
-0.46-0.38RC3 PC3 PC5
fyAs
RC Ordinary Dual-phase
Fig.4 Measured horizontal load - defl ection curves
5Nishiyama and Watanabe: Seismic Performance of Precast Column-Foundation Connection Assem
Produced by The Berkeley Electronic Press, 2011

8/3/2019 p.c cncrete
http://slidepdf.com/reader/full/pc-cncrete 8/14
to Baushinger effect may have occurred in the early stage of an unloading path to
negative (compressive) direction when the load was reversed in the post-yield range.
This sort of stiffness reduction in ordinary strength steel occurs on an unloading path
in the negative stress region. In high-strength steel like prestressing steel this may
occur in the earlier stage of unloading path even in the positive stress region.
Effect of Dual-Phase Composite Prestressing Steel Bar
PC4 with dual-phase composite prestressing bars has the least equivalent damping
factor in the displacement range of 1/100 to 1/25 among the test units subject to thecompressive axial load. At 1/200 its factor is slightly larger than that of PC1. PC5
subjected to tensile axial load indicates pinched hysteresis similar to PC3. Equivalent
damping factor of PC5 is as large as that of PC3 and 25% of RC3 at a column
rotation angle of 1/25, which were also subjected to tensile axial load. Therefore,
dual-phase composite prestressing steel bar was not effective for improving
hysteresis energy dissipation. However, hysteresis loops in the less displacement
range than 1/100 in a column rotation angle should have been examined in detail
during loading.
Series B
Test Units
Six test units were constructed. Three of them were assembled by post-tensioning
using grouted prestressing steel bars. The other three were post-tensioned by
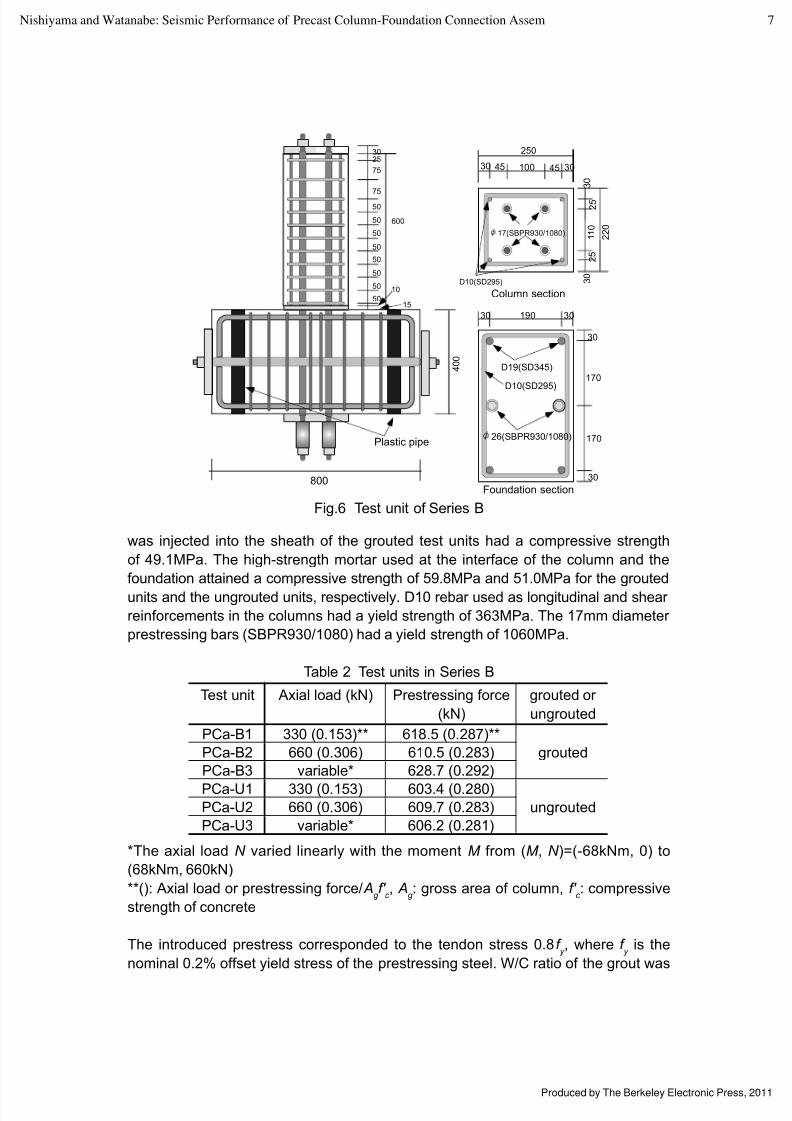
ungrouted tendons. The test units in Series B are summarized in Table 2. A typical
test unit is illustrated in Fig.6. The column section is slightly smaller than that of
Series A. This is because of the loading setup used.
The concrete compression strength measured was 39.2MPa. The grout which
0
0.1
0.2
0.3
0 0.01 0.02 0.03 0.04
RC1
P C 1
P C 4
RC2
P C 2
RC 3
P C 3
P C 5
E q u i v a l e n
t d a m p i n g f a c t o r
Rotation angle (rad)
RC2 PC2
RC1 PC1 PC4
RC3 PC3 PC5
Fig.5 Equivalent damping factors for
Series A test units
Advanced Materials for Construction of Bridges, Buildings, and Other Structures III [2003], Vol. P05, Article 5
http://services.bepress.com/eci/advanced_materials/5
8/3/2019 p.c cncrete
http://slidepdf.com/reader/full/pc-cncrete 9/14
was injected into the sheath of the grouted test units had a compressive strength
of 49.1MPa. The high-strength mortar used at the interface of the column and the
foundation attained a compressive strength of 59.8MPa and 51.0MPa for the grouted
units and the ungrouted units, respectively. D10 rebar used as longitudinal and shear
reinforcements in the columns had a yield strength of 363MPa. The 17mm diameter
prestressing bars (SBPR930/1080) had a yield strength of 1060MPa.
Table 2 Test units in Series B
Test unit Axial load (kN) Prestressing force
(kN)
grouted or
ungrouted
PCa-B1 330 (0.153)** 618.5 (0.287)**
groutedPCa-B2 660 (0.306) 610.5 (0.283)
PCa-B3 variable* 628.7 (0.292)
PCa-U1 330 (0.153) 603.4 (0.280)ungroutedPCa-U2 660 (0.306) 609.7 (0.283)
PCa-U3 variable* 606.2 (0.281)
*The axial load N varied linearly with the moment M from (M , N )=(-68kNm, 0) to
(68kNm, 660kN)
**(): Axial load or prestressing force/ Ag f'
c , A
g : gross area of column, f'
c : compressive
strength of concrete
The introduced prestress corresponded to the tendon stress 0.8f y , where f
y is the
nominal 0.2% offset yield stress of the prestressing steel. W/C ratio of the grout was
30 100 304545
3 0
1 1 0
3 0
2 5
17(SBPR930/1080)
D10(SD295)
30 190 30
30
170
170
30
D19(SD345)
D10(SD295)
26(SBPR930/1080)
250
2 2 0
75
50
75
50
50
50
50
50
50
50
25
10
15
30
600
800
Plastic pipe
Column section
Foundation section
2 5
4 0 0
Fig.6 Test unit of Series B
7Nishiyama and Watanabe: Seismic Performance of Precast Column-Foundation Connection Assem
Produced by The Berkeley Electronic Press, 2011
8/3/2019 p.c cncrete
http://slidepdf.com/reader/full/pc-cncrete 10/14
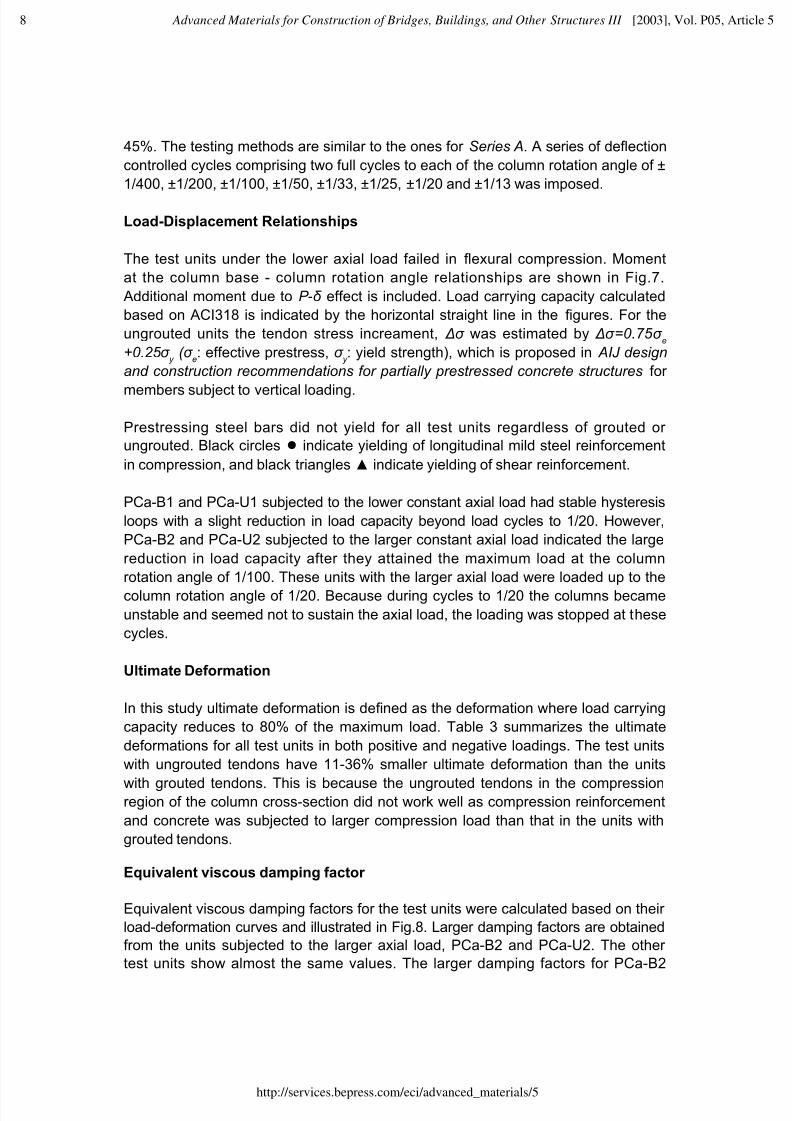
45%. The testing methods are similar to the ones for Series A. A series of defl ection
controlled cycles comprising two full cycles to each of the column rotation angle of ±
1/400, ±1/200, ±1/100, ±1/50, ±1/33, ±1/25, ±1/20 and ±1/13 was imposed.
Load-Displacement Relationships
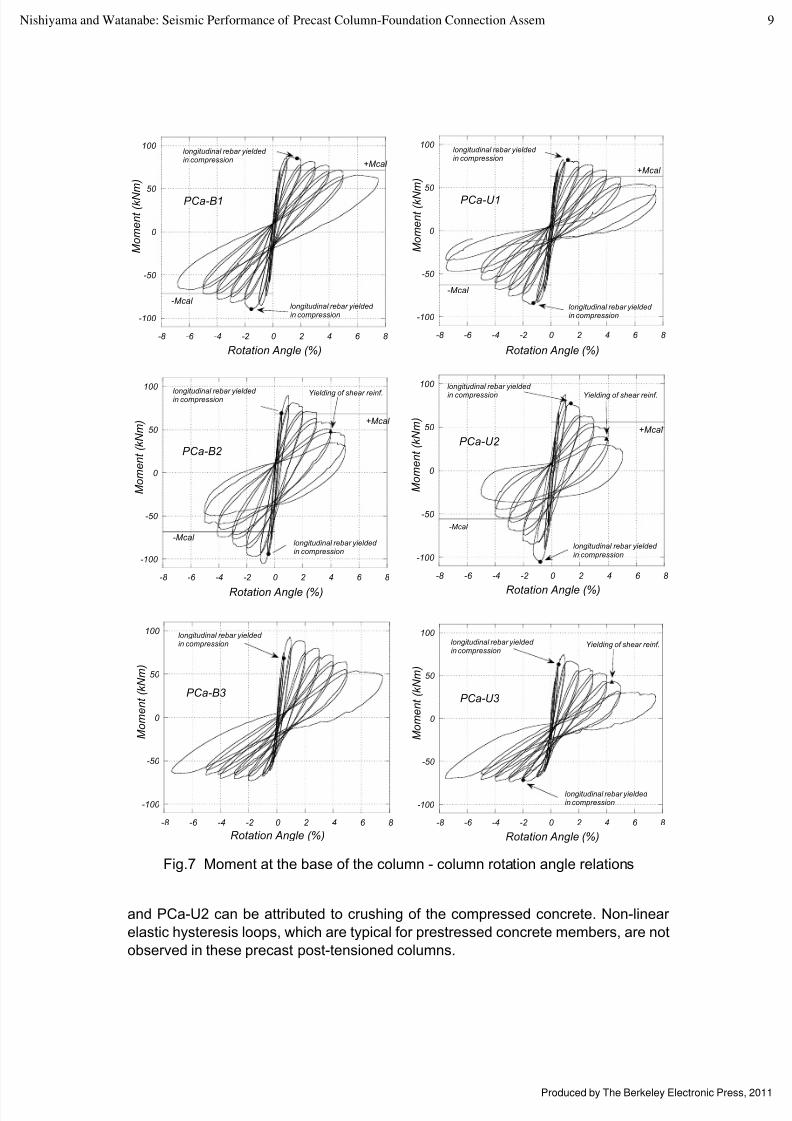
The test units under the lower axial load failed in fl exural compression. Moment
at the column base - column rotation angle relationships are shown in Fig.7.
Additional moment due to P -δ effect is included. Load carrying capacity calculated
based on ACI318 is indicated by the horizontal straight line in the fi gures. For the
ungrouted units the tendon stress increament, ∆σ was estimated by ∆σ =0.75 σ e
+0.25 σ y
( σ e: effective prestress, σ
y : yield strength), which is proposed in AIJ design
and construction recommendations for partially prestressed concrete structures for
members subject to vertical loading.
Prestressing steel bars did not yield for all test units regardless of grouted or
ungrouted. Black circles ● indicate yielding of longitudinal mild steel reinforcement
in compression, and black triangles▲ indicate yielding of shear reinforcement.
PCa-B1 and PCa-U1 subjected to the lower constant axial load had stable hysteresis
loops with a slight reduction in load capacity beyond load cycles to 1/20. However,
PCa-B2 and PCa-U2 subjected to the larger constant axial load indicated the large
reduction in load capacity after they attained the maximum load at the column
rotation angle of 1/100. These units with the larger axial load were loaded up to the
column rotation angle of 1/20. Because during cycles to 1/20 the columns became
unstable and seemed not to sustain the axial load, the loading was stopped at these
cycles.
Ultimate Deformation
In this study ultimate deformation is defi ned as the deformation where load carrying
capacity reduces to 80% of the maximum load. Table 3 summarizes the ultimate
deformations for all test units in both positive and negative loadings. The test units
with ungrouted tendons have 11-36% smaller ultimate deformation than the units
with grouted tendons. This is because the ungrouted tendons in the compressionregion of the column cross-section did not work well as compression reinforcement
and concrete was subjected to larger compression load than that in the units with
grouted tendons.
Equivalent viscous damping factor
Equivalent viscous damping factors for the test units were calculated based on their
load-deformation curves and illustrated in Fig.8. Larger damping factors are obtained
from the units subjected to the larger axial load, PCa-B2 and PCa-U2. The other
test units show almost the same values. The larger damping factors for PCa-B2
Advanced Materials for Construction of Bridges, Buildings, and Other Structures III [2003], Vol. P05, Article 5
http://services.bepress.com/eci/advanced_materials/5
8/3/2019 p.c cncrete
http://slidepdf.com/reader/full/pc-cncrete 11/14
Fig.7 Moment at the base of the column - column rotation angle relations
-100
-50
0
50
100
-8 -6 -4 -2 0 2 4 6 8
Rotation Angle (%)
PCa-B3
M o m e n t ( k N m )
longitudinal rebar yielded in compression
-100
-50
0
50
100
-8 -6 -4 -2 0 2 4 6 8
Rotation Angle (%)
+Mcal
-Mcal
PCa-B2
M o m e n t ( k N m )
longitudinal rebar yielded in compression
longitudinal rebar yielded in compression
Yielding of shear reinf.
-100
-50
0
50
100
-8 -6 -4 -2 0 2 4 6 8
Rotation Angle (%)
+Mcal
-Mcal
PCa-B1
longitudinal rebar yielded in compression
M o m e n t ( k N
m )
longitudinal rebar yielded in compression
and PCa-U2 can be attributed to crushing of the compressed concrete. Non-linear
elastic hysteresis loops, which are typical for prestressed concrete members, are not
observed in these precast post-tensioned columns.
-100
-50
0
50
100
-8 -6 -4 -2 0 2 4 6 8
Rotation Angle (%)
PCa-U3
Yielding of shear reinf.
M o m e n t ( k N m )
longitudinal rebar yielded in compression
longitudinal rebar yielded in compression
-100
-50
0
50
100
-8 -6 -4 -2 0 2 4 6 8
Rotation Angle (%)
+Mcal
-Mcal
PCa-U2
Yielding of shear reinf.
M o m e n t ( k N m )
longitudinal rebar yielded in compression
longitudinal rebar yielded in compression
-100
-50
0
50
100
-8 -6 -4 -2 0 2 4 6 8
Rotation Angle (%)
+Mcal
-Mcal
PCa-U1
M o m e n t ( k N
m )
longitudinal rebar yielded in compression
longitudinal rebar yielded in compression
9Nishiyama and Watanabe: Seismic Performance of Precast Column-Foundation Connection Assem
Produced by The Berkeley Electronic Press, 2011

8/3/2019 p.c cncrete
http://slidepdf.com/reader/full/pc-cncrete 12/14
0
0.1
0.2
0.3
0.4
0 1 2 3 4 5 6
PCa-B1 (grouted, 0.15f'cAg)PCa-B2 (grouted, 0.31f'cAg)PCa-B3 (grouted, variable axial load)PCa-U1 (ungrouted, 0.15f'cAg)PCa-U2 (ungrouted 0.31f'cAg)
PCa-U3 (ungrouted, variable axial load)
E q u i v a l e n t d a m p i n g f a c t o r
Rotation Angle (%)
Fig.8 Equivalent damping factors for Series B test units
Table 3 Ultimate deformation of Series B test units
Test unit Loading
direction
Ultimate
rotation angle
(%)
Average
(%)
PCa-B1+ve 4.48
4.57-ve 4.66
PCa-B2+ve 2.10
2.42
-ve 2.74PCa-B3
+ve 3.363.36
-ve -
PCa-U1+ve 4.34
4.07-ve 3.80
PCa-U2+ve 1.84
1.87-ve 1.89
PCa-U3+ve 2.16
2.16-ve -
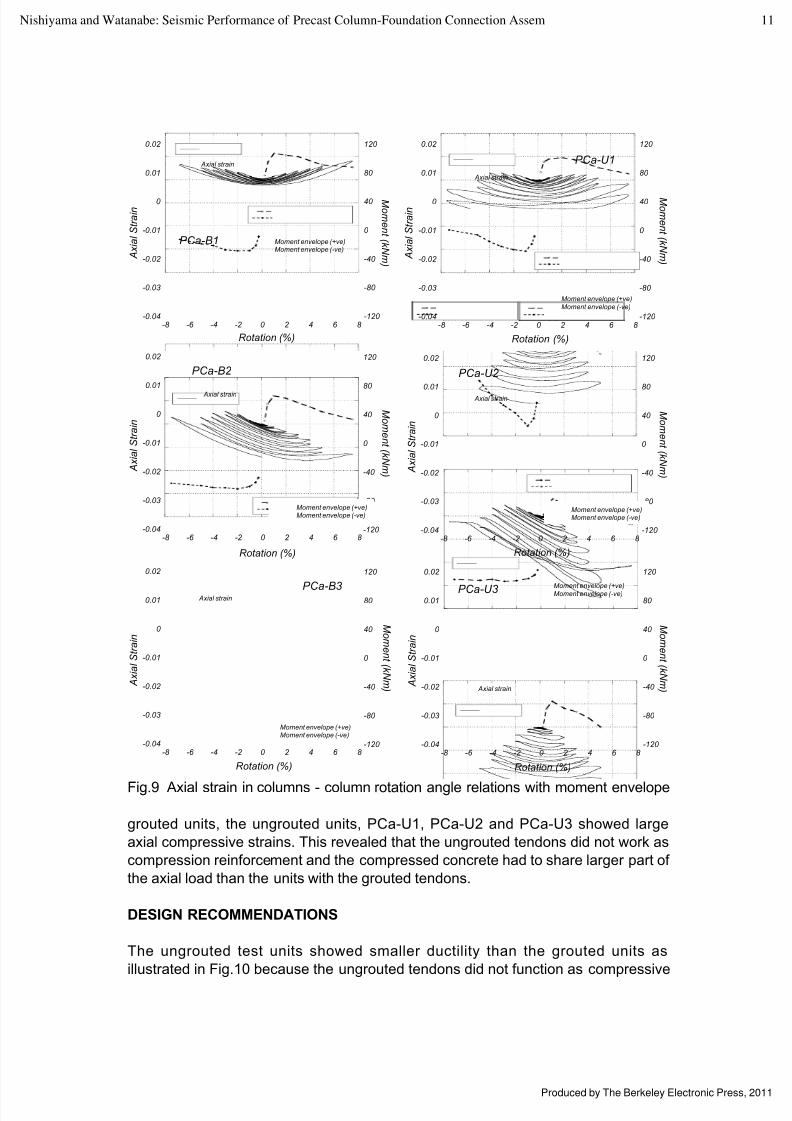
Axial strain at the centroid
Axial strain at the center of the column section - column rotation angle relationshipsare shown in Fig.9. The axial strain was obtained from the measurements in the
column hinge region whose length corresponded to the column hight, 250mm.
The moment-column rotation envelope curves are also plotted in the fi gures. In
PCa-B1 subjected to the lower axial load, the axial strain measured was almost
in tension. In PCa-U1 under the lower axial load and with ungrouted tendons, the
axial compressive strain increased rapidly after the loading cycles to 4%. This
corresponds to the ultimate deformation which is defi ned as the deformation where
the load carrying capacity reduced to 80% of the maximum load. For the test units
subjected to the larger axial load, PCa-B2 and PCa-U2, the axial compressive
strain started to increase at the loading cycles to 1.5-2.0%. Compared with the
0 Advanced Materials for Construction of Bridges, Buildings, and Other Structures III [2003], Vol. P05, Article 5
http://services.bepress.com/eci/advanced_materials/5
8/3/2019 p.c cncrete
http://slidepdf.com/reader/full/pc-cncrete 13/14
-0.04
-0.03
-0.02
-0.01
0
0.01
0.02
-120
-80
-40
0
40
80
120
-8 -6 -4 -2 0 2 4 6 8
Axial strain
Moment envelope (+ve)Moment envelope (-ve)
A x i a l S t r a i n
M om en t ( k Nm )
Rotation (%)
PCa-U3
-0.04
-0.03
-0.02
-0.01
0
0.01
0.02
-120
-80
-40
0
40
80
120
-8 -6 -4 -2 0 2 4 6 8
Axial strain
Moment envelope (+ve)Moment envelope (-ve)
A x i a l S t r a i n
M om en t ( k Nm )
Rotation (%)
PCa-U2
-0.04
-0.03
-0.02
-0.01
0
0.01
0.02
-120
-80
-40
0
40
80
120
-8 -6 -4 -2 0 2 4 6 8
Axial strain
Moment envelope (+ve)Moment envelope (-ve)
A x i a l S t r a i n
M om en t ( k Nm )
Rotation (%)
PCa-B3
-0.04
-0.03
-0.02
-0.01
0
0.01
0.02
-120
-80
-40
0
40
80
120
-8 -6 -4 -2 0 2 4 6 8
Axial strain
Moment envelope (+ve)Moment envelope (-ve)
A x i a l S t r a i n
M om en t ( k Nm )
Rotation (%)
PCa-B2
-0.04
-0.03
-0.02
-0.01
0
0.01
0.02
-120
-80
-40
0
40
80
120
-8 -6 -4 -2 0 2 4 6 8
Axial strain
Moment envelope (+ve)Moment envelope (-ve)
A x i a l S t r a i n
M om en t ( k Nm )
Rotation (%)
PCa-B1
-0.04
-0.03
-0.02
-0.01
0
0.01
0.02
-120
-80
-40
0
40
80
120
-8 -6 -4 -2 0 2 4 6 8
Axial strain
Moment envelope (+ve)Moment envelope (-ve)
A x i a l S t r a i n
M om en t ( k Nm )
Rotation (%)
PCa-U1
Fig.9 Axial strain in columns - column rotation angle relations with moment envelope
grouted units, the ungrouted units, PCa-U1, PCa-U2 and PCa-U3 showed large
axial compressive strains. This revealed that the ungrouted tendons did not work as
compression reinforcement and the compressed concrete had to share larger part of
the axial load than the units with the grouted tendons.
DESIGN RECOMMENDATIONS
The ungrouted test units showed smaller ductility than the grouted units as
illustrated in Fig.10 because the ungrouted tendons did not function as compressive
11Nishiyama and Watanabe: Seismic Performance of Precast Column-Foundation Connection Assem
Produced by The Berkeley Electronic Press, 2011

8/3/2019 p.c cncrete
http://slidepdf.com/reader/full/pc-cncrete 14/14
reinforcements and the larger part of the compressive force on the column had to be
borne by the compressed concrete.
Generally, the higher the axial load is, the more signifi cant the reduction in ductilityis. Equivalent damping factors of the test units with larger axial load are larger
than those of the units with lower axial load as shown in Figs.5 and 8. This energy
dissipation is mainly attributed to concrete crushing in the plastic hinge region. Even
the prestressed concrete test units under large axial load showed as large a energy
disspation as the ordinary reinforced concrete test units. However, It should be
discussed that energy dissipation due to concrete crushing can be justifi ed or not.
0
1
2
3
4
5
0 0.1 0.2 0.3 0.4
grouted ungrouted
M a x i m u m r o t a t i o n a
n g l e ( % )
PCa-U2
Axial load level (N/f' c A
g )
PCa-B2
PCa-B1
PCa-U1
Fig.10 Maximum rotation angle - axial load level relations
CONCLUSIONS
1. The dual-phase composite prestressing steel bars were not effective for
improing hysteresis loops of the precast prestressed concrete column-foundation
assemblies.
2. Hysteresis energy dissipation of the prestressed units under lower axial load
was smaller than that of the reinforced units. However, under larger axial load
the equivalent damping factors increased due to concrete crushing.
3. The ungrouted test units showed smaller ductility than the grouted units because
the ungrouted tendons did not work as compressive reinforcements.
ACKNOWLEDGMENTS
The authors would like to thank Netsuren, Co., Ltd. which provided the prestressing
steel bars used in the experiment.
REFERENCES
1. M Nishiyama, F Watanabe and H Sato, "Precast Connections Post-tensioned
by Graded Composite Steel", Concrete 95 Toward Better Concrete Structures,
Conference Papers Vol.1, Brisbane, Australia, 4-7 September 1995, pp.579-588.
2 Advanced Materials for Construction of Bridges, Buildings, and Other Structures III [2003], Vol. P05, Article 5