pce.ppt
TRANSCRIPT

8/14/2019 pce.ppt
http://slidepdf.com/reader/full/pceppt 1/16
SME Rating Agency of India Ltd

8/14/2019 pce.ppt
http://slidepdf.com/reader/full/pceppt 2/16
Minimise lending risk thru ratings 2
SME Expectations for growth

8/14/2019 pce.ppt
http://slidepdf.com/reader/full/pceppt 3/16
Minimise lending risk thru ratings 3
Challenges faced by lenders
NumerousSMEs
Geographically
Dispersed
Lack of
Reliable InformationMultiple segment –
Multiple Needs
Limited skills in
understanding &
evaluating
Lending
Institutions

8/14/2019 pce.ppt
http://slidepdf.com/reader/full/pceppt 4/16
Minimise lending risk thru ratings 4
Relevance for a rating Agency dedicated for SMEs
• Focused approach towards SMEs
• Strong data & knowledge-base about SMEs
• Different evaluation approach based on size and industry
• Ability to analyze in limited and lesser reliable information• Emphasis on non-financial parameters
TO BRIDGE THE GAP BETWEEN FINANCIERS AND SMEs

8/14/2019 pce.ppt
http://slidepdf.com/reader/full/pceppt 5/16
Minimise lending risk thru ratings 5
SMERA – An Introduction
• Only rating agency dedicated to the SME segment offeringqualitative services at competitive prices.
• Joint initiative of SIDBI, Dun & Bradstreet and 11 leading banksoperating in SME segment.
• Launched on the 5th September 2005 by the Hon. Finance Minister,Shri P Chidambaram.
• Completed around 4800 ratings till date.
• Greater acceptability in banks (MOU with 22 leading banks). 14Banks offer interest rate and security concessions for well ratedSMERA customers.
8/14/2019 pce.ppt
http://slidepdf.com/reader/full/pceppt 6/16
Minimise lending risk thru ratings 6
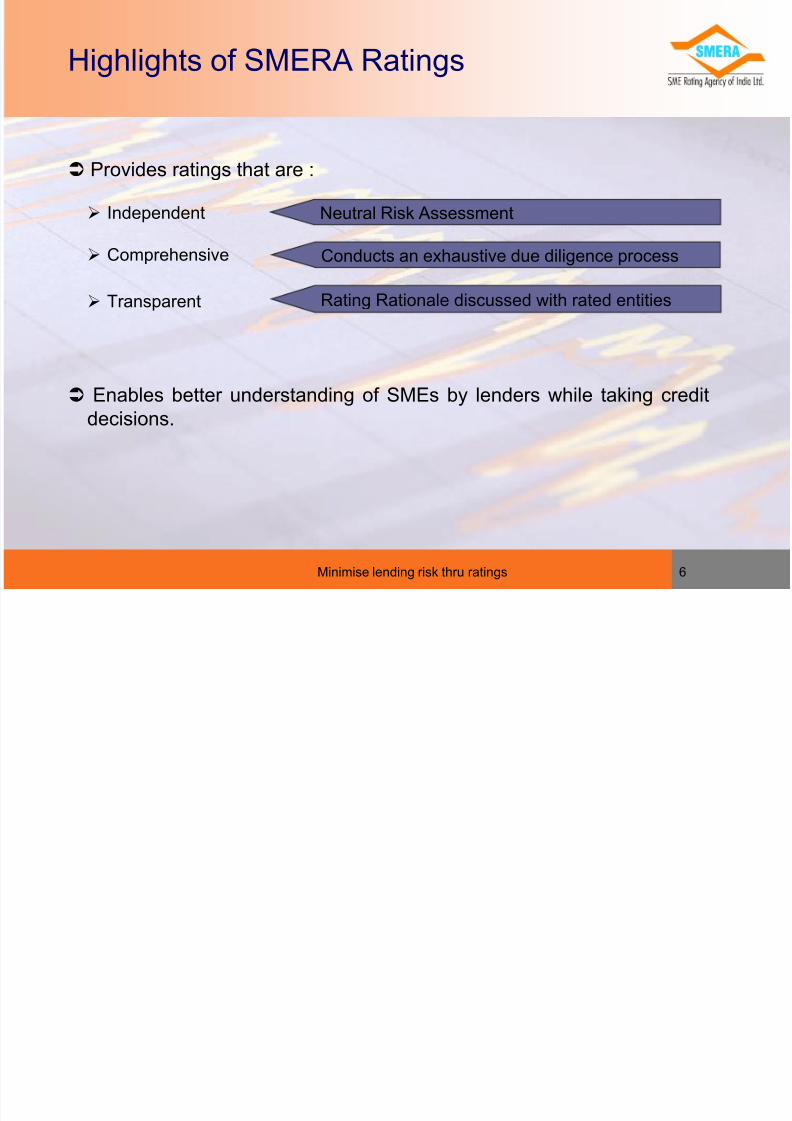
Highlights of SMERA Ratings
Provides ratings that are :
Independent
Comprehensive
Transparent
Enables better understanding of SMEs by lenders while taking credit
decisions.
Neutral Risk Assessment
Conducts an exhaustive due diligence process
Rating Rationale discussed with rated entities

8/14/2019 pce.ppt
http://slidepdf.com/reader/full/pceppt 7/16
Rating Scales
• NSIC
• SMERA

8/14/2019 pce.ppt
http://slidepdf.com/reader/full/pceppt 8/16
NSIC Rating Scale
RATING INDICATOR
Financial Strength
High Moderate Low
Performance
Capability
Highest SE1A SE1B SE1C
High SE2A SE2B SE2C
Moderate SE3A SE3B SE3C
Weak SE4A SE4B SE4C
Poor SE5A SE5B SE5C
8/14/2019 pce.ppt
http://slidepdf.com/reader/full/pceppt 9/16
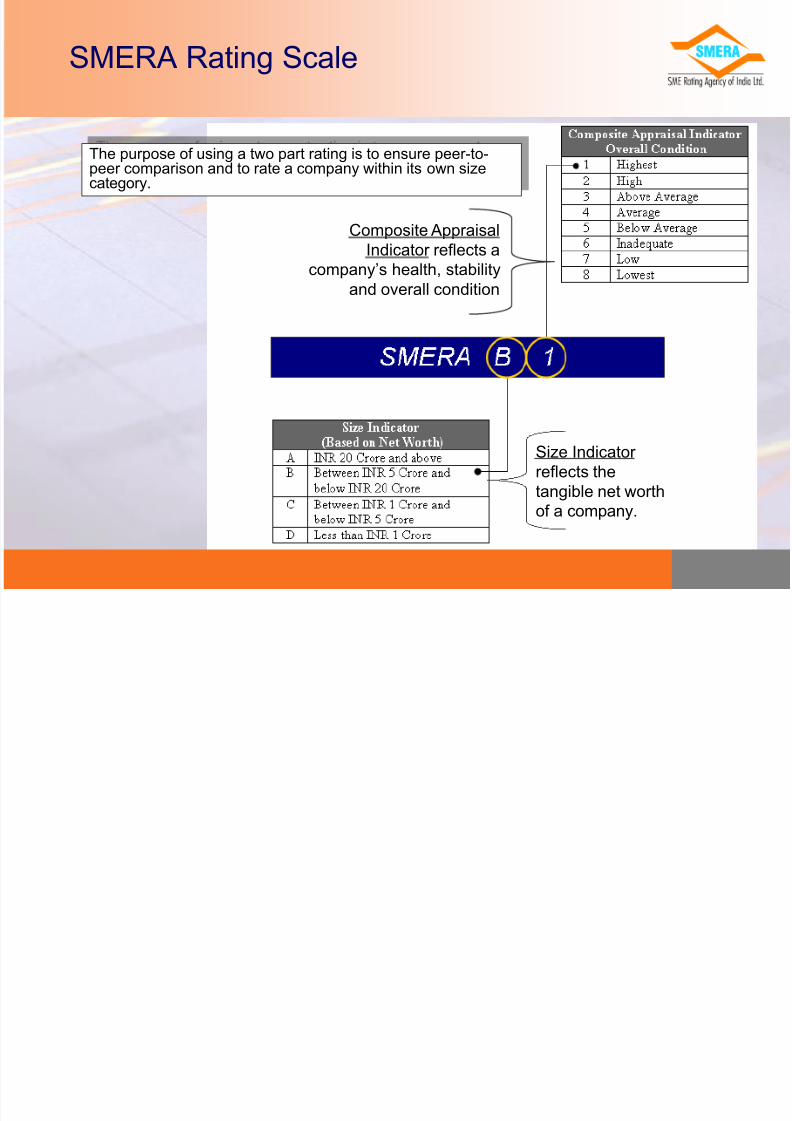
SMERA Rating Scale
The purpose of using a two part rating is to ensure peer-to-peer comparison and to rate a company within its own sizecategory.
Composite Appraisal
Indicator reflects a
company’s health, stabilityand overall condition
Size Indicator
reflects the
tangible net worth
of a company.

8/14/2019 pce.ppt
http://slidepdf.com/reader/full/pceppt 10/16Minimise lending risk thru ratings 10
Rating Process Flow
Request forInterview and
site visit
Rating Request SMERA Site visit Enterprise
Questionnaire
Documents,
audited results
& certified
projections
Site Visit
Assessment
Report
ROC
Information
Rating
Model
Industry Assessment
and Cluster
data
Rating Analyst
Peer Review
Third PartyData – e.g.
Litigation
Information
Conducts site
visit and
interviews
Management
Documents Obtained
External Data
SMERA
Database
Entity RatingFinal Rating

8/14/2019 pce.ppt
http://slidepdf.com/reader/full/pceppt 11/16Minimise lending risk thru ratings 11
Factors considered while rating
Parameters of Rating
Financial Non-Financial
Solvency
Ratios
Liquidity
Ratios
Profitability
Ratios
Activity
Ratio
Management Quality
Location Advantage
Marketing Network
Legal Issues
Industry and Macro-Economic Assessment
e.g. Debt-Equity Current Ratio RONW Asset-
turnover

8/14/2019 pce.ppt
http://slidepdf.com/reader/full/pceppt 12/16Minimise lending risk thru ratings 12
Non-Financial Parameters

8/14/2019 pce.ppt
http://slidepdf.com/reader/full/pceppt 13/16Minimise lending risk thru ratings 14
Benefits of SMERA Rating
• Third party credit rating helps in extending additional comfort for
internal decision making.
• Validation of the internal ratings.
• Intrinsic Strengths of SME units captured as model also considers
qualitative parameters in addition to financial results.
• Strengthening of Credit Portfolio thru rating/review ratings – early
warning signals.
• Impact of industry related cyclical trend considered in rating.
• Cluster centric approach.

8/14/2019 pce.ppt
http://slidepdf.com/reader/full/pceppt 14/16
Minimise lending risk thru ratings 15
Above fees is inclusive of service tax @ 10.3%
NSIC - D&B - SMERA Rating Fee
Category Fees Service Tax Total
Turnover Rs. Rs. Rs.
< 50 Lacs 7,500 772.5 8,272
50 to 200 Lacs 9,000 927 9927
> 200 Lacs 12,000 1,236 13,236

8/14/2019 pce.ppt
http://slidepdf.com/reader/full/pceppt 15/16
Minimise lending risk thru ratings 16
SMERA Rating Fee
Category Fees Service Tax Total
Turnover Rs. Rs. Rs.
< 50 Lacs 30,000 3,090 33,090
50 to 200 Lacs 36,000 3708 39,708
> 200 Lacs 48,000 4,944 52,944

8/14/2019 pce.ppt
http://slidepdf.com/reader/full/pceppt 16/16
Thank YouContact Details
Virendra Goyal-National Sales Manager