pct yearly review 2021 – executive summary
TRANSCRIPT

PCT Yearly Review 2021 – Executive Summary
The International Patent System

This executive brief identifies key trends in the use of the WIPO-administered Patent Cooperation Treaty (PCT). For fuller statistics, see the PCT Yearly Review 2021 – available in English at: www.wipo.int/ipstats

Key numbers for 2020
675,200 (+4.3%)PCT national phase entries
275,900 (+4%)PCT applications filed
125 (–3)Countries in which PCT applications were filed
56.7% (–0.2 percentage point)Share of PCT national phase entries in worldwide non-resident patent application filings
16.5% (+0.8 percentage point)Share of women among PCT inventors
1
Note: The latest available year for PCT national phase entry data is 2019.
2
Statistics on the international phase – PCT applications
Despite the COVID-19 pandemic, a record number of PCT applications was filed in 2020
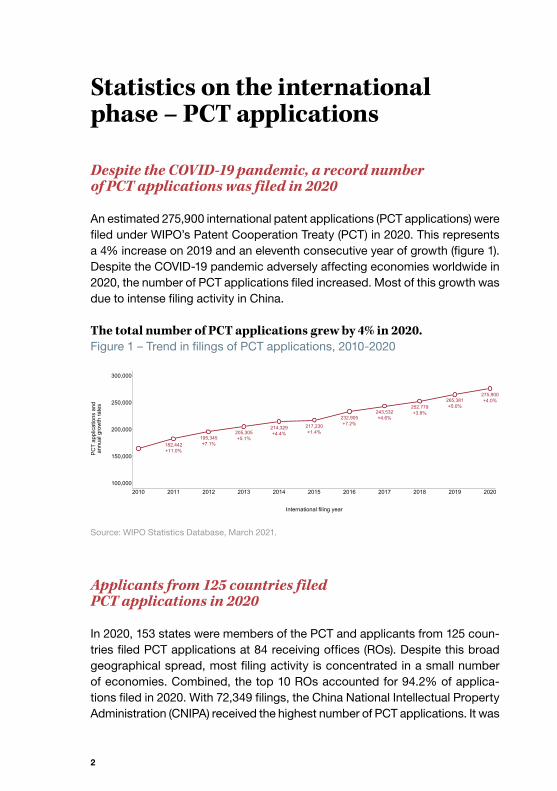
An estimated 275,900 international patent applications (PCT applications) were filed under WIPO’s Patent Cooperation Treaty (PCT) in 2020. This represents a 4% increase on 2019 and an eleventh consecutive year of growth (figure 1). Despite the COVID-19 pandemic adversely affecting economies worldwide in 2020, the number of PCT applications filed increased. Most of this growth was due to intense filing activity in China.
The total number of PCT applications grew by 4% in 2020.Figure 1 – Trend in filings of PCT applications, 2010-2020
Source: WIPO Statistics Database, March 2021.
Applicants from 125 countries filed PCT applications in 2020
In 2020, 153 states were members of the PCT and applicants from 125 coun-tries filed PCT applications at 84 receiving offices (ROs). Despite this broad geographical spread, most filing activity is concentrated in a small number of economies. Combined, the top 10 ROs accounted for 94.2% of applica-tions filed in 2020. With 72,349 filings, the China National Intellectual Property Administration (CNIPA) received the highest number of PCT applications. It was
182,442195,345
205,305214,329 217,230
232,905243,532
252,779265,381
275,900
+11.0%+7.1%
+5.1%+4.4% +1.4%
+7.2%+4.6%
+3.8%+5.0%
+4.0%
100,000
150,000
200,000
250,000
300,000
PC
T ap
plic
atio
ns a
nd a
nnua
l gro
wth
rate
s
2010 2011 2012 2013 2014 2015 2016 2017 2018 2019 2020
International filing year
3
followed by the United States Patent and Trademark Office (USPTO), the Japan Patent Office (JPO), the European Patent Office (EPO), the Korean Intellectual Property Office (KIPO) and the International Bureau (IB) of WIPO.
Applicants from China cemented their position as the largest users of the PCT System
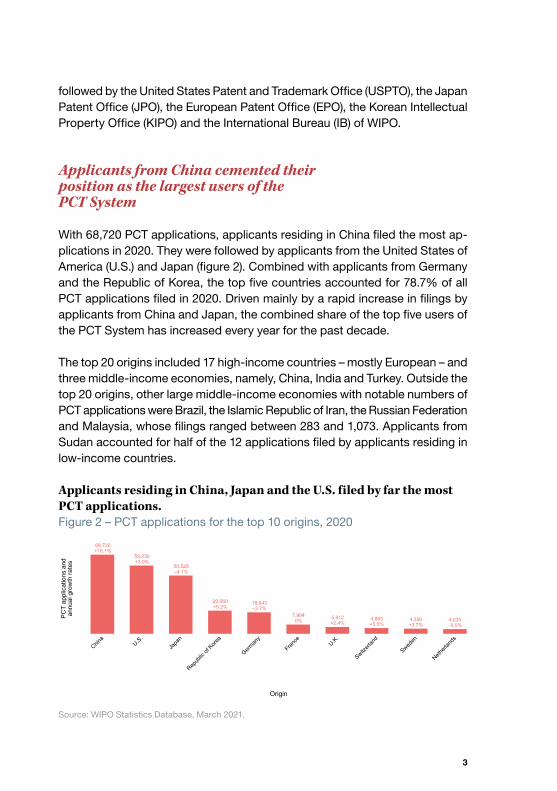
With 68,720 PCT applications, applicants residing in China filed the most ap-plications in 2020. They were followed by applicants from the United States of America (U.S.) and Japan (figure 2). Combined with applicants from Germany and the Republic of Korea, the top five countries accounted for 78.7% of all PCT applications filed in 2020. Driven mainly by a rapid increase in filings by applicants from China and Japan, the combined share of the top five users of the PCT System has increased every year for the past decade.
The top 20 origins included 17 high-income countries – mostly European – and three middle-income economies, namely, China, India and Turkey. Outside the top 20 origins, other large middle-income economies with notable numbers of PCT applications were Brazil, the Islamic Republic of Iran, the Russian Federation and Malaysia, whose filings ranged between 283 and 1,073. Applicants from Sudan accounted for half of the 12 applications filed by applicants residing in low-income countries.
Applicants residing in China, Japan and the U.S. filed by far the most PCT applications.Figure 2 – PCT applications for the top 10 origins, 2020
68,720
59,230
50,520
20,060 18,643
7,904 5,912 4,883 4,356 4,035
+16.1%
+3.0%
–4.1%
+5.2% –3.7%
0% +2.4% +5.5% +3.7% –0.5%
PC
T ap
plic
atio
ns a
nd a
nnua
l gro
wth
rate
s
China
U.S.
Japa
n
Repub
lic of
Korea
German
y
France U.K.
Switzerl
and
Sweden
Netherl
ands
Origin
Source: WIPO Statistics Database, March 2021.
4
The majority of PCT filings originated from Asia
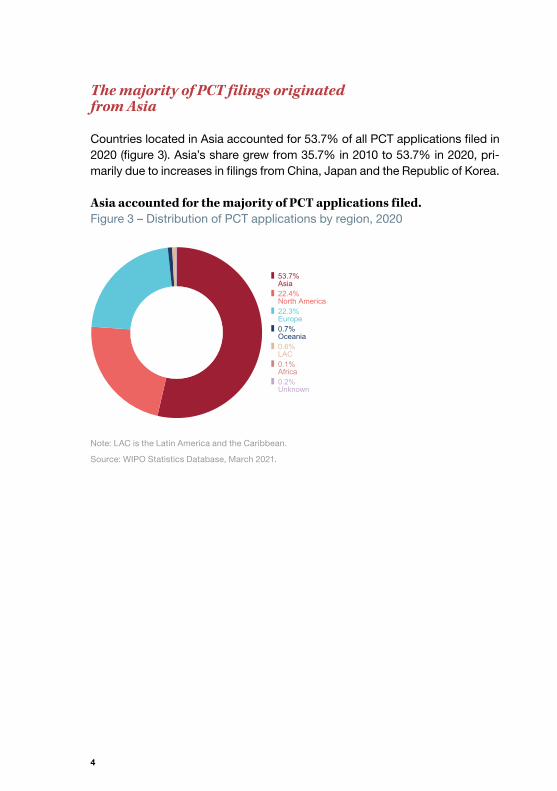
Countries located in Asia accounted for 53.7% of all PCT applications filed in 2020 (figure 3). Asia’s share grew from 35.7% in 2010 to 53.7% in 2020, pri-marily due to increases in filings from China, Japan and the Republic of Korea.
Asia accounted for the majority of PCT applications filed.Figure 3 – Distribution of PCT applications by region, 2020
53.7%Asia22.4%North America22.3%Europe0.7%Oceania0.6%LAC0.1%Africa0.2%Unknown
Note: LAC is the Latin America and the Caribbean.
Source: WIPO Statistics Database, March 2021.

5
The business sector accounted for about 87% of all PCT applications
In 2020, the business sector accounted for 86.7% of all published PCT appli-cations, followed by the university sector (5.8%), individuals (5.5%) and the government and public research organization (PRO) sector (1.9%).
The business sector accounted for the majority of published applications re-ceived from each of the top 20 origins in the high-income group. This sector’s share was especially high for Sweden (97.7%) and Japan (96.2%). Of the top 20 origins from the middle-income category, the business sector accounted for a majority of the published applications in six, while individual applicants filed most applications in eight. Individual applicants accounted for over 80% of applications from Egypt, the Islamic Republic of Iran, Ukraine and Viet Nam.
Huawei remained the top PCT applicant in 2020
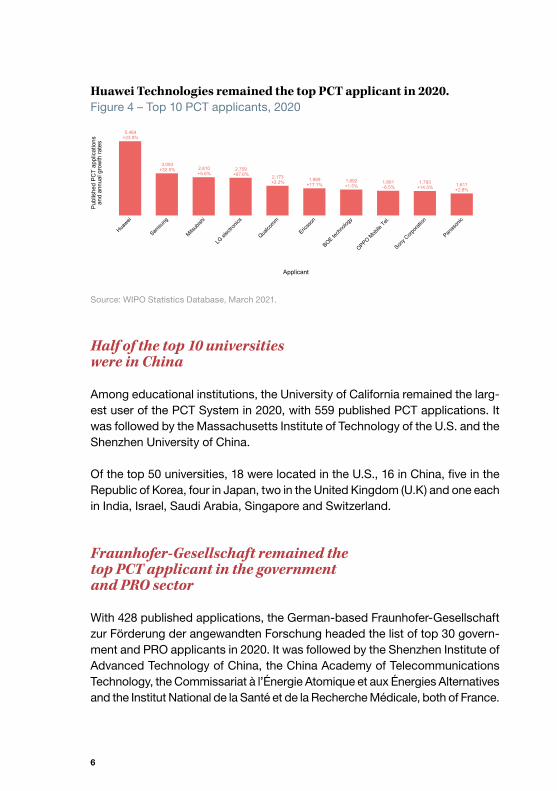
For a fourth consecutive year, China-based telecoms giant Huawei Technologies topped the ranking of PCT applicants, with 5,464 PCT applications published in 2020. With 3,093 applications, Samsung Electronics of the Republic of Korea ranked in second position, followed by Mitsubishi Electric Corp. of Japan, LG Electronics Inc. of the Republic of Korea and Qualcomm Inc. of the U.S (figure 4).
Companies active in digital communication headed the list of top 50 PCT filers in 2020. Of the top 10 applicants, six filed mainly in digital communication.
6
Huawei Technologies remained the top PCT applicant in 2020.Figure 4 – Top 10 PCT applicants, 2020
5,464
3,0932,810 2,759
2,173 1,989 1,892 1,801 1,793 1,611
+23.9%
+32.5%+5.6% +67.6%
+2.2% +17.1% +1.5% –6.5% +14.5% +2.8%
Pub
lishe
d PC
T ap
plic
atio
ns a
nd a
nnua
l gro
wth
rate
s
Huawei
Samsu
ng
Mitsub
ishi
LG el
ectro
nics
Qualco
mm
Ericss
on
BOE tech
nolog
y
OPPO Mob
ile Tel.
Sony C
orpora
tion
Panas
onic
Applicant
Source: WIPO Statistics Database, March 2021.
Half of the top 10 universities were in China
Among educational institutions, the University of California remained the larg-est user of the PCT System in 2020, with 559 published PCT applications. It was followed by the Massachusetts Institute of Technology of the U.S. and the Shenzhen University of China.
Of the top 50 universities, 18 were located in the U.S., 16 in China, five in the Republic of Korea, four in Japan, two in the United Kingdom (U.K) and one each in India, Israel, Saudi Arabia, Singapore and Switzerland.
Fraunhofer-Gesellschaft remained the top PCT applicant in the government and PRO sector
With 428 published applications, the German-based Fraunhofer-Gesellschaft zur Förderung der angewandten Forschung headed the list of top 30 govern-ment and PRO applicants in 2020. It was followed by the Shenzhen Institute of Advanced Technology of China, the China Academy of Telecommunications Technology, the Commissariat à l’Énergie Atomique et aux Énergies Alternatives and the Institut National de la Santé et de la Recherche Médicale, both of France.
7
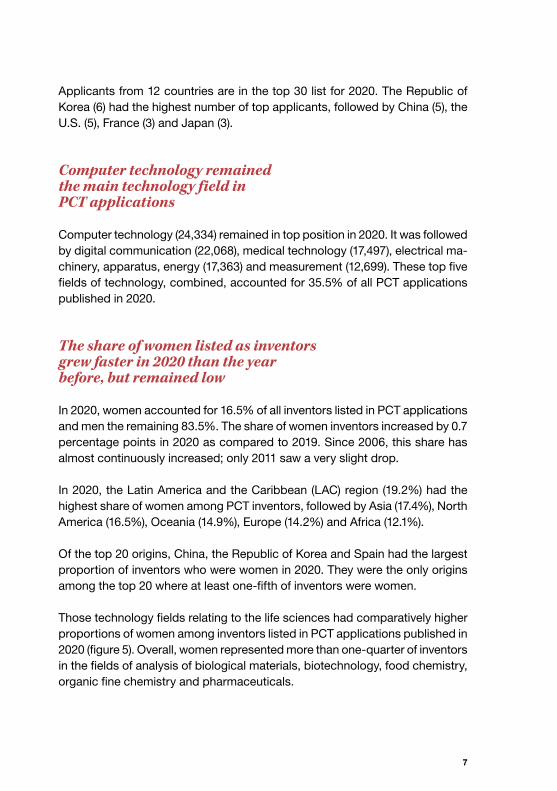
Applicants from 12 countries are in the top 30 list for 2020. The Republic of Korea (6) had the highest number of top applicants, followed by China (5), the U.S. (5), France (3) and Japan (3).
Computer technology remained the main technology field in PCT applications
Computer technology (24,334) remained in top position in 2020. It was followed by digital communication (22,068), medical technology (17,497), electrical ma-chinery, apparatus, energy (17,363) and measurement (12,699). These top five fields of technology, combined, accounted for 35.5% of all PCT applications published in 2020.
The share of women listed as inventors grew faster in 2020 than the year before, but remained low
In 2020, women accounted for 16.5% of all inventors listed in PCT applications and men the remaining 83.5%. The share of women inventors increased by 0.7 percentage points in 2020 as compared to 2019. Since 2006, this share has almost continuously increased; only 2011 saw a very slight drop.
In 2020, the Latin America and the Caribbean (LAC) region (19.2%) had the highest share of women among PCT inventors, followed by Asia (17.4%), North America (16.5%), Oceania (14.9%), Europe (14.2%) and Africa (12.1%). Of the top 20 origins, China, the Republic of Korea and Spain had the largest proportion of inventors who were women in 2020. They were the only origins among the top 20 where at least one-fifth of inventors were women.
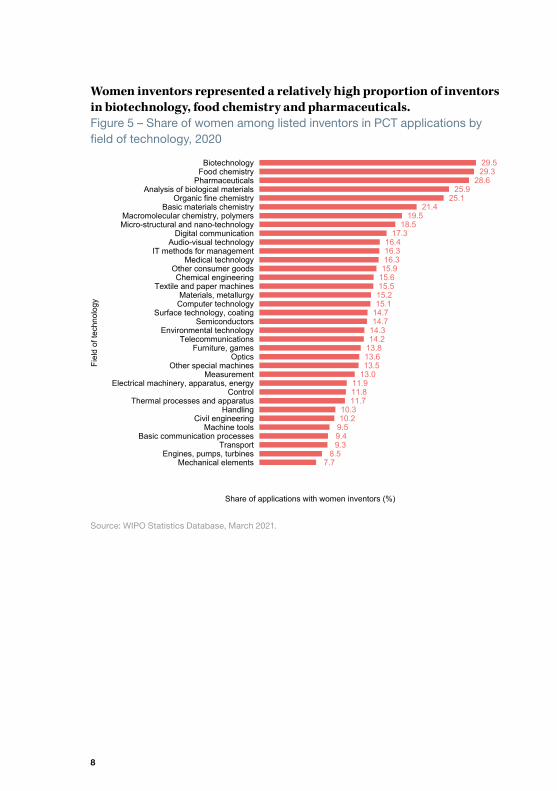
Those technology fields relating to the life sciences had comparatively higher proportions of women among inventors listed in PCT applications published in 2020 (figure 5). Overall, women represented more than one-quarter of inventors in the fields of analysis of biological materials, biotechnology, food chemistry, organic fine chemistry and pharmaceuticals.
8
Women inventors represented a relatively high proportion of inventors in biotechnology, food chemistry and pharmaceuticals. Figure 5 – Share of women among listed inventors in PCT applications by field of technology, 2020
7.78.5
9.39.49.510.210.3
11.711.811.9
13.013.513.613.814.214.314.714.715.115.215.515.615.916.316.316.4
17.318.5
19.521.4
25.125.9
28.629.329.5
Share of applications with women inventors (%)
Mechanical elementsEngines, pumps, turbines
TransportBasic communication processes
Machine toolsCivil engineering
HandlingThermal processes and apparatus
ControlElectrical machinery, apparatus, energy
MeasurementOther special machines
OpticsFurniture, games
TelecommunicationsEnvironmental technology
SemiconductorsSurface technology, coating
Computer technologyMaterials, metallurgy
Textile and paper machinesChemical engineering
Other consumer goodsMedical technology
IT methods for managementAudio-visual technology
Digital communicationMicro-structural and nano-technologyMacromolecular chemistry, polymers
Basic materials chemistryOrganic fine chemistry
Analysis of biological materialsPharmaceuticals
Food chemistryBiotechnology
Fiel
d of
tech
nolo
gy
Source: WIPO Statistics Database, March 2021.

9
The top 50 PCT geographical clusters accounted for the majority of PCT filing activity
Combined, the top 50 PCT clusters represented 58.5% of PCT applications published between 2015 and 2019. Over this period, Tokyo–Yokohama was by far the largest PCT cluster, with its 116,794 PCT applications accounting for 10.8% of all applications. Tokyo–Yokohama was followed by Shenzhen–Hong Kong–Guangzhou and Seoul. San Jose–San Francisco (fourth position) and Paris (11th position) were the highest ranked clusters in North America and Europe, respectively.
10
Statistics on PCT national phase entries
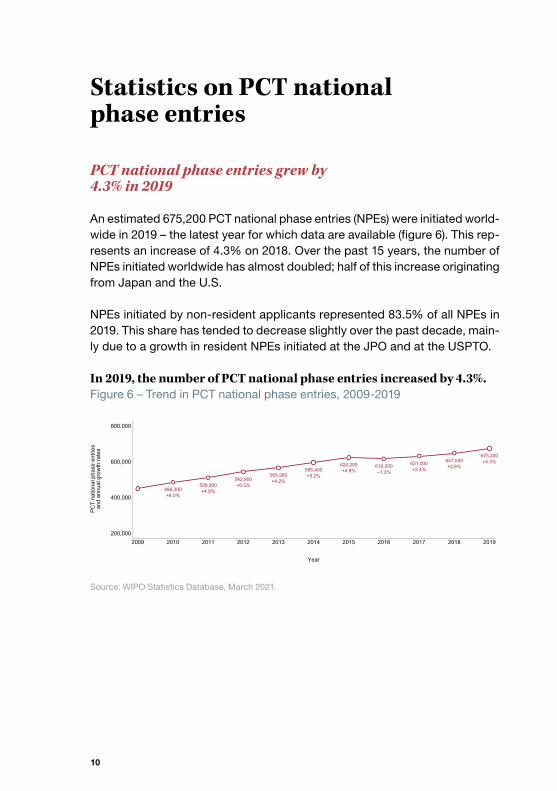
PCT national phase entries grew by 4.3% in 2019
An estimated 675,200 PCT national phase entries (NPEs) were initiated world-wide in 2019 – the latest year for which data are available (figure 6). This rep-resents an increase of 4.3% on 2018. Over the past 15 years, the number of NPEs initiated worldwide has almost doubled; half of this increase originating from Japan and the U.S. NPEs initiated by non-resident applicants represented 83.5% of all NPEs in 2019. This share has tended to decrease slightly over the past decade, main-ly due to a growth in resident NPEs initiated at the JPO and at the USPTO.
In 2019, the number of PCT national phase entries increased by 4.3%.Figure 6 – Trend in PCT national phase entries, 2009-2019
486,300509,900
542,900565,900
595,400624,200 616,200 631,000 647,500
675,200
+8.0%+4.9%
+6.5%+4.2%
+5.2%+4.8% –1.3% +2.4% +2.6%
+4.3%
200,000
400,000
600,000
800,000
PC
T na
tiona
l pha
se e
ntrie
s a
nd a
nnua
l gro
wth
rate
s
2009 2010 2011 2012 2013 2014 2015 2016 2017 2018 2019
Year
Source: WIPO Statistics Database, March 2021.

11
Asia has become the region from which the most PCT NPEs are initiated worldwide
For the first time, applicants from Asia initiated the largest proportion of NPEs in the world, accounting for 35.6% of all NPEs in 2019. Asia’s share has increased sharply since 2009, when it was of 23.6%. Europe (31.7%), which had initiated the most NPEs ever since the late 1990s, moved down to second position in 2019, closely followed by North America (29.4%). The combined share of ap-plicants located in Africa, LAC and Oceania amounted to 2%.
Applicants based in the U.S. initiated the most PCT NPEs worldwide
In 2019, applicants residing in the U.S. initiated 188,806 NPEs. They were fol-lowed by applicants from Japan, Germany, China and the Republic of Korea (figure 7). The U.S. and Japan combined accounted for nearly half of all NPEs initiated worldwide, with 28% and 20.4% of total NPEs, respectively. Aside from the high concentration of NPEs among just a few origins, applicants from approximately 130 countries initiated NPEs in 2019.
Applications originating from the U.S. initiated the most NPEs worldwide. Figure 7 – PCT national phase entries for the top 10 origins, 2019
188,806
137,808
59,45749,664
33,186 26,980 22,078 21,020 17,069 15,081
+3.4%
+4.0%
+0.2%+38.0%
+15.5% –4.2% –7.5% –5.4% –4.4% +10.1% PC
T na
tiona
l pha
se e
ntrie
s a
nd a
nnua
l gro
wth
rate
s
U.S.
Japa
n
German
yChin
a
Repub
lic of
Korea
France U.K.
Switzerl
and
Netherl
ands
Sweden
Origin
Source: WIPO Statistics Database, March 2021.
12
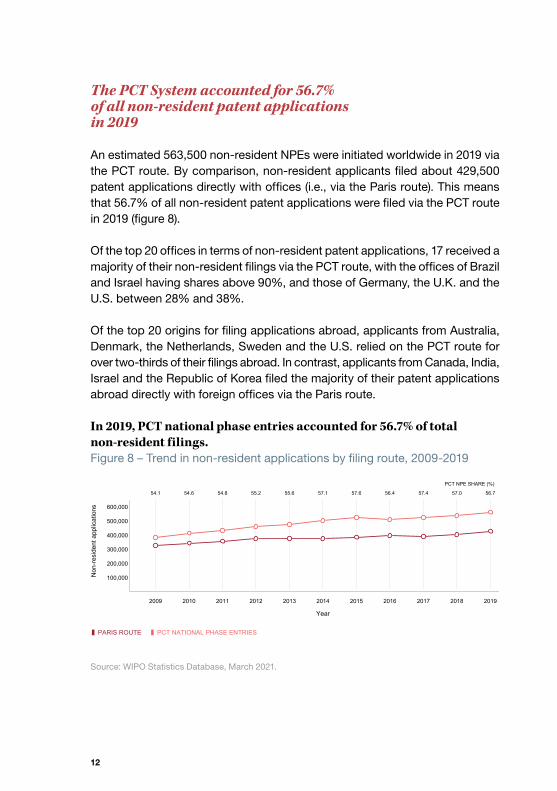
The PCT System accounted for 56.7% of all non-resident patent applications in 2019
An estimated 563,500 non-resident NPEs were initiated worldwide in 2019 via the PCT route. By comparison, non-resident applicants filed about 429,500 patent applications directly with offices (i.e., via the Paris route). This means that 56.7% of all non-resident patent applications were filed via the PCT route in 2019 (figure 8).
Of the top 20 offices in terms of non-resident patent applications, 17 received a majority of their non-resident filings via the PCT route, with the offices of Brazil and Israel having shares above 90%, and those of Germany, the U.K. and the U.S. between 28% and 38%.
Of the top 20 origins for filing applications abroad, applicants from Australia, Denmark, the Netherlands, Sweden and the U.S. relied on the PCT route for over two-thirds of their filings abroad. In contrast, applicants from Canada, India, Israel and the Republic of Korea filed the majority of their patent applications abroad directly with foreign offices via the Paris route.
In 2019, PCT national phase entries accounted for 56.7% of total non-resident filings.Figure 8 – Trend in non-resident applications by filing route, 2009-2019
PCT NPE SHARE (%)
54.1 54.6 54.8 55.2 55.6 57.1 57.6 56.4 57.4 57.0 56.7
100,000
200,000
300,000
400,000
500,000
600,000
Non
-resi
dent
app
licat
ions
2009 2010 2011 2012 2013 2014 2015 2016 2017 2018 2019
Year
PARIS ROUTE PCT NATIONAL PHASE ENTRIES
Source: WIPO Statistics Database, March 2021.

13
Statistics on the performance of the PCT System
The International Bureau
About 44% of all PCT applications were published in English in 2020
In 2020, about 44% of all PCT applications were published in English, while Chinese overtook Japanese to become the second most used language of publication (figure 9). The seven remaining languages of publication, combined, accounted for 16.1% of the total. Overall, the vast majority of PCT applications are published in the language in which they were filed.
About 44% of PCT applications were published in English.Figure 9 – Distribution of PCT applications by language of publication, 2020
44.4%English20.3%Chinese19.2%Japanese6.4%German6.1%Korean2.3%French0.6%Spanish0.4%Russian0.2%Portuguese0.1%Arabic
Source: WIPO Statistics Database, March 2021.

14
Over 16% of PCT applications were filed using ePCT in 2020
In 2020, 71 ROs accepted ePCT-filings and applicants filed 44,514 PCT appli-cations using this online service. This represents an increase of 29.4% on the previous year and corresponds to 16.1% of all PCT applications filed in 2020. Applicants from the U.S. (10,868) filed by far the most applications using ePCT, followed by those from the Republic of Korea (5,104), Italy (1,966), India (1,904) and Canada (1,832).
The receiving offices
Eighteen of the top 20 ROs received more than 90% of applications electronically in 2020
Of the top 20 ROs, Israel, Singapore, Turkey and the U.S. received nearly all PCT applications electronically in 2020. The share of electronic filings exceeded 99% at seven offices and 90% at every top 20 office, except for that of Germany and the Russian Federation.
Finland transmitted all its PCT applications to the IB within four weeks
In 2020, on average, ROs transmitted PCT applications to the IB within 2.6 weeks of the international filing date. Finland transmitted all its applications to the IB within four weeks of the filing date. Among the top 20 ROs, 11 transmitted more than 98% of PCT applications within this timeframe.

15
International Searching Authorities
The CNIPA issued about 23% more ISRs in 2020
In 2020, 266,722 international search reports (ISR) were issued by the 23 ex-isting International Searching Authorities (ISAs). The EPO issued 83,130 ISRs and was followed by the CNIPA and the JPO (figure 10). Combined, these three ISAs accounted for nearly three-quarters of all ISRs issued.
Of all the ISRs that are required to be transmitted to the IB within three months of the date of receipt of the application, 86.1% were transmitted within this timeframe in 2020. As for those required to be transmitted within 9 months of the priority date, 79.1% met this timeframe in 2020.
The European Patent Office issued 83,130 international search reports.Figure 10 – International search reports issued by the top 10 International Searching Authorities, 2020
83,130
64,981
50,347
28,48021,995
3,982 2,378 2,280 1,764 1,659
+3.0%
+22.9%
–2.5%
+4.9%0%
+0.5% –1.9% +1.0% +5.8% +77.2%
Sea
rch
repo
rts a
nd a
nnua
l gro
wth
rate
s
EPOChin
aJa
pan
Repub
lic of
Korea
U.S.
Russia
n Fed
eratio
n
Canad
a
Austra
liaInd
ia
Turkey
International Searching Authority
Source: WIPO Statistics Database, March 2021.


World Intellectual Property Organization34, chemin des ColombettesP.O. Box 18CH-1211 Geneva 20Switzerland
Tel: + 41 22 338 91 11Fax: + 41 22 733 54 28
For contact details of WIPO’s External Offices visit: www.wipo.int/about-wipo/en/offices
© WIPO, 2021
Attribution 3.0 IGO
(CC BY 3.0 IGO)
The CC license does not apply to
non-WIPO content in this publication.
Photo: Getty Images / golubovy
WIPO Reference No. 901/21/ExSum/E