pd/2 final report - eurocontrol · pd/2 final report executive summary doc 97-70-13 version 1.2 5...
TRANSCRIPT

DOC 97-70-13Volume 1 of 2
Rue de la Fusée, 96
B - 1130 Bruxelles
PD/2 FINAL REPORT
PHARE/DLR/PD/2-10.2/SSR;1.2
Prepared by: DLR
Date: February 1998
Version: 1.2
Authors: J. Reichmuth, F. Schick, V. Adam,A. Hobein A. Link, U. Teegen, S. Tenoort

Copyright Statement PD/2 Final Report
DOC 97-70-13 Version 1.2 2February 1998
The information contained in this report is the property of the PHARE Participants*.The report or parts thereof may be published and or reproduced on the condition thatdue acknowledgement of authorship is made by quoting the copyright statement below.The copyright and the foregoing condition on publication and reproduction shall extendto all media in which the information may be embodied.The information contained in this document is provided on an "as-is" basis and thePHARE Participants shall provide no express or implied warranty of any kind and shallaccept no liability whatsoever for or in connection with the use of the informationcontained in the document.
* The PHARE Participants are:
- the EUROCONTROL Agency;
- the CENA (Centre d'études de la navigation aérienne);
- the STNA (Service technique de la navigation aérienne);
- the NLR (Nationaal Lucht- en Ruimtevaartlaboratorium);
- the RLD (Rijksluchtvaartdienst);
- the LVB (Luchtverkeersbeveiliging);
- the DLR (Deutsches Zentrum für Luft- und Raumfahrt e.V.);
- the DFS (Deutsche Flugsicherung GmbH);
- the UK CAA (Civil Aviation Authority);
- the NATS (National Air Traffic Services);
- the DERA (Defence and Evaluation Research Agency)
Copyright statement:
The copyright in this report vests in the European Organisation for the Safety of AirNavigation (EUROCONTROL); the CENA (Centre d'études de la navigation aérienne);the STNA (Service technique de la navigation aérienne); the NLR (Nationaal Lucht- enRuimtevaartlaboratorium); the RLD (Rijksluchtvaartdienst); the LVB(Luchtverkeersbeveiliging); the DLR (Deutsches Zentrum für Luft- und Raumfahrt); theDFS (Deutsche Flugsicherung GmbH); the UK CAA (Civil Aviation Authority); the NATS(National Air Traffic Services) and the DERA (Defence and Evaluation ResearchAgency).
All rights reserved.

PD/2 Final Report
DOC 97-70-13 Version 1.2 3February 1998
Revision history
July 1997 Draft version 0
October 1997 Draft version 1, incorporating VAL and PCC review comments
January 1998 Version 1.1. Minor editorial changes prior to publication
February 1998 Final Version 1.2. Publication version
NAME SIGNATURE DATE
AUTHOR 1 J Reichmuth
AUTHOR 2 F Schick
AUTHOR 3 V Adam
AUTHOR 4 A Hobein
AUTHOR 5 A Link
AUTHOR 6 U Teegen
AUTHOR 7 S Tenoort
PROJECT REVIEW I Wilson
PHARE PROGRAMMEMANAGER
H Schröter

PD/2 Final Report
4 Version 1.2 DOC 97-70-13February 1998
This page is intentionally blank

PD/2 Final Report Executive Summary
DOC 97-70-13 Version 1.2 5February 1998
Executive SummaryThis document is the final report for the PHARE Demonstration 2 (PD/2). It gives a comprehensiveview on the pursuit of the experiment and the results achieved.
As part of the Programme for Harmonised Air Traffic Management Research in EUROCONTROL(PHARE), PD/2 formed the second major real time simulation exercise in a series of three PHAREDemonstrations to support investigations into aspects of the concept of the future European AirTraffic Management System (EATMS). The work programme of PD/2 to design, implement, anddemonstrate the PHARE prototype air and ground computer assistance tools for air trafficmanagement in the extended terminal area (ETMA) was led by the Deutsches Zentrum für Luft-und Raumfahrt (DLR). The participating partners were CENA of France, NATS of UK, NLR of theNetherlands, and the EUROCONTROL Experimental Centre at Brétigny (EEC). The PHAREprogramme is managed by EUROCONTROL Headquarters in Brussels.
The main objectives of PHARE Demonstrations are to determine the effect on controller workloadand traffic throughput by introduction of computer assistance tools from the PHARE AdvancedTools (PATs) programme, in an environment with an increasing proportion of 4D FMS equippedaircraft with full two-way datalink, whilst gaining a degree of controller approval for the advancedtools introduced. In this respect, PD/2 succeeded to produce substantial and meaningful results.
The PD/2 system was demonstrated on DLR’s real-time simulator ATMOS (Air TrafficManagement and Operations Simulator), using 32 controllers from 7 European countries. Thesystem incorporated advanced controller assistance tools with an associated ground human-machine interface (GHMI) designed in the PHARE GHMI project, as well as, by integration of theDLR Advanced Technologies Testing Aircraft System (ATTAS) Experimental Cockpit, simulatedair-ground datalink and 4D experimental flight management systems (EFMS). Six pilotsparticipated in an evaluation of the PD/2 on-board components developed in the PHARE airbornehuman-machine interface (AHMI) project.
A PD/2 airborne demonstration programme using the DLR ATTAS, with the ATTAS ExperimentalCockpit integrated, was successfully accomplished. The ability of an aircraft to fly negotiatedtrajectories in a routine manner while operating on its inbound route down to the Approach Gatewithin continuous 4D tolerances, was convincingly demonstrated.
All participating controllers undertook a controllers training programme of one-week duration.. Thetraining enabled them to work according to their roles in PD/2, in a reference baseline mode withpaper strips based on current practice as well as in the PHARE advanced tools mode.
During more than one hundred hours of simulation a variety of performance and workloadmeasures were recorded. Audio and video documentation, observer logs, debriefing sessions, andquestionnaires were used to accomplish the PD/2 data collection.
The controllers considered the training as adequate and sufficient and appreciated the simulationset-up as being realistic and valid. The PD/2 GHMI gained a high degree of controller approval,with significant acceptance of display principles such as colour coding of aircraft labels, and anequally high acceptance of the interaction principles, such as using the mouse for on-screeninteraction with aircraft labels and pop-up menus.
The quantitative analysis of system performance data revealed various gains from the introductionof the PD/2 PATs and GHMI in terms of traffic throughput and quality of service. Overall, benefitswere achieved for the number of landings per time unit, average flight time of aircraft, inbounddelays, and time precision of delivery particularly under conditions of high traffic load. An analysis

Executive Summary PD/2 Final Report
6 Version 1.2 DOC 97-70-13February 1998
of the wake vortex category separations measured at the Approach Gate showed that thesebenefits were not achieved at the expense of closer separation.
Another general point was that, in parallel to the improvements gained with the advanced system,the variability of the measurements was considerably reduced. The controller team performancesand work styles became more homogeneous, and thus more predictable.
It is concluded that improvements in traffic throughput and quality of service were achievable withthe advanced ground system alone. The introduction of 4D FMS/datalink aircraft whichautomatically followed their negotiated trajectories in two steps of 30 % and 70 % of aircraft in thetraffic samples, resulted in considerably higher percentages of aircraft which were delivered at theApproach Gate exactly on their planned time.
Statistical analysis of controller workload revealed some re-distribution of workload betweentactical controller positions as an effect of the introduction of PD/2 PATs and GHMI. It is importantto note the observed decrease of workload at the Approach Pickup controller position that was theposition with the relatively highest workload under reference baseline condition. Furthermore, theintroduction of 30 % and 70 % 4D FMS/datalink aircraft in the traffic sample showed a stepwisereduction of workload for all tactical controller positions involved.
The effect of releasing the controllers from the duty of transferring ATC instructions gavesignificant reductions in all objective workload measures at all controller working positionsirrespective of traffic volume. It can therefore be concluded that workload from merely guidingtraffic strongly decreased as the proportion of 4D FMS/datalink equipped aircraft increased.
In summary, PD/2 was a major, successful demonstration of the integration of advanced tools, 4DFMS and datalink into an air-ground air traffic management system in an extended terminal areaairspace. Experimental evidence suggests that the PHARE concept of trajectory-based trafficguidance provided by the advanced tools and human/machine interfaces was approved by thecontrollers and pilots, and that it has the potential for improving traffic throughput and quality ofservice, at acceptable or reduced levels of controller workload.

PD/2 Final Report List of Contents
DOC 97-70-13 Version 1.2 7February 1998
DOC 97-70-13 has been produced in two volumes
Volume 1 - MAIN REPORT
LIST OF CONTENTS
1 INTRODUCTION ....................................................................................................................11
1.1 SCOPE.......................................................................................................................11
1.2 CONTEXT ..................................................................................................................11
1.3 PHARE DEMONSTRATION 2 ....................................................................................12
1.4 REPORT STRUCTURE..............................................................................................13
2 AIM OF PHARE DEMONSTRATION 2 ...................................................................................15
3 THE PD/2 SYSTEM................................................................................................................17
3.1 OPERATIONAL CONCEPT........................................................................................17
3.2 PHARE ADVANCED TOOLS......................................................................................19
3.2.1 Trajectory Predictor (TP) ................................................................................19
3.2.2 Conflict Probe (CP) ........................................................................................19
3.2.3 Flight Path Monitor (FPM) ..............................................................................19
3.2.4 Negotiation Manager (NM)..............................................................................20
3.2.5 Arrival Manager (AM) .....................................................................................20
3.3 SIMULATED AIRSPACE ............................................................................................22
3.4 CONTROLLER ROLES ..............................................................................................23
3.5 LIMITATIONS OF THE PD/2 SYSTEM.......................................................................25
3.6 GROUND HUMAN-MACHINE INTERFACE (GHMI) ...................................................26
3.6.1 Plan View Display (PVD) ................................................................................26
3.6.2 Arrival Management Display (AMD)................................................................28
3.6.3 Advisories.......................................................................................................29
4 TRIALS FACILITY..................................................................................................................31
4.1 ATMOS HARDWARE.................................................................................................31
4.2 SOFTWARE...............................................................................................................32
4.3 EXPERIMENTAL COCKPIT .......................................................................................32
4.4 LIVE AIRCRAFT.........................................................................................................33
5 METHODS..............................................................................................................................35
5.1 EXPERIMENTAL DESIGN..........................................................................................35
5.2 MEASUREMENTS .....................................................................................................36
5.2.1 System Performance......................................................................................36
5.2.2 Controller Workload........................................................................................37
5.2.3 Controller Acceptance ....................................................................................38
5.3 RUNNING THE EXPERIMENT ...................................................................................38

List of Contents PD/2 Final Report
8 Version 1.2 DOC 97-70-13February 1998
5.4 CONTROLLERS.........................................................................................................39
6 TRAINING ..............................................................................................................................41
6.1 THE COURSE............................................................................................................41
6.2 CONCLUSIONS FROM THE TRAINING ....................................................................41
7 RESULTS...............................................................................................................................43
7.1 INTRODUCTION ........................................................................................................43
7.2 TRAFFIC THROUGHPUT/QUALITY OF SERVICE ....................................................43
7.2.1 Number of Landings .......................................................................................44
7.2.2 Flight Time .....................................................................................................45
7.2.3 Inbound Delays...............................................................................................45
7.2.4 Precision of Delivery ......................................................................................46
7.2.5 Separation......................................................................................................49
7.2.6 49
7.2.6 Summary Discussion of Traffic Throughput/Quality of Service Results...........49
7.3 WORKLOAD ..............................................................................................................54
7.3.1 Workload Comparison Between ORG 0 and ORG 1.......................................55
7.3.2 Workload Comparison Between ORG 1, ORG 2/ 30%, and ORG 2/ 70% .......57
7.3.3 Planner Controllers' Assessment of Workload of Tactical ApproachControllers......................................................................................................58
7.4 ACCEPTANCE ...........................................................................................................59
7.4.1 Simulation Environment and Training.............................................................59
7.4.2 HMI: Displays, Interaction...............................................................................59
7.4.3 Operational Aspects: Traffic Handling, Procedures.........................................60
7.4.4 Individual Tools and Functions .......................................................................62
7.5 AIRBORNE DEMONSTRATIONS...............................................................................63
8 CONCLUSIONS .....................................................................................................................67
9 ACKNOWLEDGEMENTS.......................................................................................................69
10 GLOSSARY............................................................................................................................71
11 REFERENCES .......................................................................................................................75
LIST OF FIGURES
Figure 1 Transition of Guidance modes in PD/2 ................................................................................... 19Figure 2 Arrival Manager in the PD/2 context ...................................................................................... 20Figure 3 Extended TMA....................................................................................................................... 23Figure 4 Plan View Display (PVD)....................................................................................................... 27Figure 5 Trajectory Presentation at PVD............................................................................................... 28Figure 6 Arrival Management Display Approach................................................................................. 29Figure 7 Working positions of ATMOS during the PD/2 Experiment. .................................................. 31

PD/2 Final Report List of Contents
DOC 97-70-13 Version 1.2 9February 1998
Figure 8 ATTAS Experimental Cockpit ................................................................................................33Figure 9 DLR’s Experimental Aircraft (ATTAS) .................................................................................34Figure 10 PD/2 Trials Configuration.......................................................................................................34Figure 11 Mean number of landings in high traffic scenarios ..................................................................44Figure 12 Mean Flight Time per aircraft in high traffic scenarios, all arrival routes combined ................45Figure 13 Mean Inbound Delay per aircraft in high traffic scenarios, all arrival routes combined ............46Figure 14 Mean precision of delivery in high traffic scenarios, all arrival routes combined .....................47Figure 15 Distributions of precision of delivery in high traffic scenarios .................................................48Figure 16 Mean number of separations smaller than wake vortex categories in high traffic scenarios......49Figure 17 Examples of radar plots of one controller team in high traffic scenarios ..................................52Figure 18 Mean SWAT workload ratings in high traffic scenarios. .........................................................56Figure 19 Mean TLX workload ratings in high traffic scenarios. The planner assessed the workload
of the APP team. .....................................................................................................................56Figure 20 Navigation Display layout: Lateral Display, PLAN mode ........................................................64Figure 21 Navigation Display layout: Vertical Display, PLAN mode.......................................................65
LIST OF TABLES
Table 1 PHARE Projects contributing to PD/2 .....................................................................................13Table 2 Summary of Organisations ......................................................................................................35Table 3 PD/2 Evaluation Criteria, Measurements and Recording .........................................................36Table 4 Supporting organisations for controllers in PD/2 .....................................................................39Table 5 Summary of results: effects on traffic throughput/quality of service .........................................49Table 6 Summary of results: effects on tactical controller workload .....................................................54
Volume 2 - ANNEXES
LIST OF CONTENTS
Annex A Experimental Design and Methods
Annex B Controller Subjects and Training
Annex C Analysis of Traffic Throughput/Quality of Service
Annex D Analysis of Workload
Annex E Analysis of Acceptance
Annex F Airborne Aspects of PD/2
Annex G PD/2 Ground Human-Machine Interface

List of Contents PD/2 Final Report
10 Version 1.2 DOC 97-70-13February 1998
This page is intentionally blank

PD/2 Final Report Introduction
DOC 97-70-13 Version 1.2 11February 1998
1 INTRODUCTION
1.1 SCOPE
This document is the final report for the PHARE Demonstration 2 (PD/2). The report consists oftwo volumes. The main report Volume 1 gives those with little or no experience of the Programmefor Harmonised Air Traffic Management Research in EUROCONTROL (PHARE) an overview overthe achievements of PD/2. For those with closer involvement in the PHARE programme, itprovides a synthesis of the results, presents recommendations, and references the detail availablein the measurement data and in Volume 2. Volume 2 consists of Annexes that provide detaileddescriptions of the PD/2 experiment and results, namely:
Annex A Experimental Design and Methods
Annex B Controller Subjects and Training
Annex C Analysis of Traffic Throughput/Quality of Service
Annex D Analysis of Workload
Annex E Analysis of Acceptance
Annex F Airborne Aspects of PD/2
Annex G PD/2 Ground Human-Machine Interface
1.2 CONTEXT
Estimates of the growth rate of air traffic in Europe continue to predict that the 1993 demand level- when the PD/2 project started - will have doubled by 2010 [European Traffic Forecasts 1980-2010 , Air Traffic Action Group, Geneva, 1996].
Considerable gains in ATS capacity have been achieved during the late 1980s and early 1990s asa result of co-ordinated improvements for example with improved inter-centre communications,and improved radar coverage. However, few changes have been made to the level of externalassistance being provided to controllers. Thus, this growth has for the most part resulted ingreater demands being placed upon controllers alleviated where necessary by modifications to thestructure of the airspace. The potential for further significant gains by these means is becomingsmall and unlikely to be sufficient to meet the forecast demands.
A means has to be found by which controllers can be enabled to handle a larger number of aircraftin a given airspace without significant increase in workload. This will have to be achieved whilstmaintaining or improving system safety. One proposed method is the provision of automatedassistance to support the controller in the resolution of conflicts and in the planning of the efficientuse of airspace using data links to communicate aircraft trajectory predictions.
In providing such support and removing the controller and pilot from certain tasks by means ofdirect computer to computer communication, it is necessary to ensure that the tasks removed fromthe pilot and controller are those which are best executed by computer assistance, and those taskswhich remain their responsibility are best executed using the flexibility and adaptability of humanskills.
The areas where computer support is expected to yield improvements are those that make use oftheir capacity to rapidly calculate accurate predictions of future aircraft profiles, analyse potentialoptions for the resolution of conflicts and sequence aircraft for optimum use of airspace andrunways. To achieve this, detailed aircraft performance data, meteo condition information and

Introduction PD/2 Final Report
12 Version 1.2 DOC 97-70-13February 1998
criteria concerning aircraft operational requirements are needed to be provided using data linkcommunications.
The PHARE programme founded in 1989 has the objective to organise, co-ordinate and conductstudies and experiments aimed at providing and demonstrating the feasibility and merits of afuture air-ground integrated air traffic management system in all phases of flight. The results of theprogramme should help to refine the description of the future Air Traffic System concepts neededto satisfy demand and provide information on the best transition from the current to the newsystem.
In PHARE a number of European research establishments assisted by the authorities concernedcombined their ATC and aeronautics experience and resources. The participants in PHARE are:
• CAA/NATS (with sub-contracts to DRA Bedford & DRA Malvern), United Kingdom
• STNA and CENA, France
• DFS and DLR, Germany
• RLD/LVB and NLR, Netherlands
• EUROCONTROL Agency Headquarters Brussels and EUROCONTROL Experimental Centre,France.
The Commission of the European Communities participates in and supports PHARE. The FAAand Transport Canada are co-operating within the frame of relevant agreements. Within PHARE,the necessary ground and airborne tools are being produced and evaluated initially as prototypecomponents. The culmination of this work is the execution of a series of real time simulationsentitled "PHARE Demonstrations". These will allow the developments to be evaluated not justbased on their individual capabilities but rather to establish how the elements work whencombined.
1.3 PHARE DEMONSTRATION 2
To achieve its objective of demonstrating a fully integrated ATC system, PHARE set up a series ofprojects each led by one of the participating research organisations. These projects eachcontribute to the development of the various elements of the PHARE Operational Concept, whichis to be tested in three major trials - termed demonstrations - of the proposed ATC system.Following the en-route demonstration PD/1 hosted by NATS, the TMA demonstration PD/2 washosted by DLR on its Air Traffic Management and Operations Simulator ATMOS. This real timesimulator is operated by DLRs Institute of Flight Guidance at Braunschweig, Germany.
The subject of PD/2 was the initial demonstration of PHARE concepts in a TMA environment aftertheir evaluation in an en-route environment in PD/1. The results from both demonstrations arebeing used to guide further development and adaptation of facilities which will be evaluated insubsequent PD/3 demonstrations covering the full flight regime.
PD/2 addressed the terminal approach issues by simulating several sectors of an extended TMAand emulating entry and exit conditions of en-route sectors. The PD/2 trials were performed at theend of 1996 and during January/February 1997. To address the airborne aspects in June 1997demonstrations were performed with DLR's Advanced Technology Testing Aircraft System ATTASas a live aircraft.
The DLR PD/2 team was responsible for the successful execution of PD/2 on DLRs simulationsuite. Other PHARE projects contributed advanced tools, methods and expertise to the PD/2demonstration. Table 1 shows how the work was shared among the various PHARE projects:

PD/2 Final Report Introduction
DOC 97-70-13 Version 1.2 13February 1998
PHARE projects Contribution
PHARE Advanced Tools(PATs):
Trajectory Predictor (Trajectory Predictor),Conflict Probe (CP), Flight Path Monitor (FPM),Negotiation Manager (NM) and Arrival Manager(AM)
Ground Human-MachineInterface (GHMI):
GHMI Specification, GHMI Training Tool
Airborne Human-MachineInterface (AHMI)
Navigation Display (ND)
Experimental FlightManagement System(EFMS):
Experimental FMS (EFMS),
Common ModularSimulator (CMS):
Tool Integration Platform (PARADISE),Application Interfaces (API)
Validation Tools (VAL): Experimental Design, Measurements, AnalysisTools
PHARE Demonstration 1(PD/1):
Lessons learnt from En-route Experiments
PHARE Demonstration 2(PD/2):
Integration of Air Traffic Management andOperations Simulator (ATMOS),
PD/2 Ground Human Machine Interface (GHMI),Datalink, Weather Model,
Integration of ATTAS test aircraft andExperimental Cockpit,
Test and Supervision environment,
PD/2 Training System
Table 1 PHARE Projects contributing to PD/2
1.4 REPORT STRUCTURE
The operational concept, the tools, and the GHMI are described in Section 3. A description of theresearch facility is presented in Section 4. An overview of the experimental design and theprimary assumptions used in the analysis is given in Section 5. A description of the controllertraining and its conclusions follow in Section 6. The main results derived from the PD/2 trials aregiven in Section 7. The report’s conclusions are presented in Section 8.

Introduction PD/2 Final Report
14 Version 1.2 DOC 97-70-13February 1998
This page is intentionally blank

PD/2 Final report Aim of PHARE Demonstration 2
DOC 97-70-13 Version 1.2 15February 1998
2 AIM OF PHARE DEMONSTRATION 2
Within the general objectives of PHARE to develop the various elements of the PHAREOperational Concept, and to demonstrate a fully integrated future ATC system that enables thecontroller to handle a larger number of aircraft without significant increase in workload, the specificobjectives of the PD/2 trials were:
1. To assess controller workload and performance of arrival traffic handling in an ETMAenvironment with
• introduction of computer assistance,• computer generated 4D profile-planning and sequencing,• controller support to plan and establish a conflict free trajectory covering all flight phases
from Entry Fix to the Approach Gate of an airport,• an increasing proportion of 4D FMS equipped aircraft with full two-way datalink.
2. To gain a degree of controller acceptance for the introduction of computer assistance.

Aim of PHARE Demonstration 2 PD/2 Final Report
16 Version 1.2 DOC 97-70-13February 1998
This page is intentionally blank

PD/2 Final Report The PD/2 System
DOC 97-70-13 Version 1.2 17February 1998
3 THE PD/2 SYSTEM
This section briefly describes the underlying operational concept of PD/2 and PHARE AdvancedTools together with the specifically designed GHMI used in PD/2.
3.1 OPERATIONAL CONCEPT
PD/2 focused on the management of arrival traffic in an Extended TMA (a Terminal ManoeuvringArea with its adjacent en-route sectors) and envisaged a system to be used in a post 2000timeframe. Therefore it was assumed that the controller working procedures, the workingenvironment and the airspace structure would have no major differences to the current system.The planning and control procedures would still be based on current ATC practices and the humanfunctions of ‘planning’ and ‘tactical’ control were assumed to remain sector-based in PD/2.
The real-time simulations of PD/2 aimed at the comparison of three different modes of operationcharacterised by three organisations, named ORG 0, ORG 1, and ORG 2:
ORG 0:
Org 0 was a reference mode, by which the controller had to handle traffic samples with currentstandard means (radar data, flight plan data, paper flight strips, weather information, radiocommunication, and assistance from an arrival planning system with basic sequencing andscheduling functionality). The reference system emulated a planning system functionality whichwas limited to the calculation of arrival times using flight plan data, radar data, and weatherinformation. It generated and displayed an arrival time sequence, but did not provide anytrajectory information to the controller.
The following organisations made use of a new information element: The Trajectory.
A trajectory is defined as a series of profile and route points defining a 4D–path for an aircraftjoined by straight or curved segments ( 4D or 4 Dimensional is used to denote positions in spacedefined relative to earth and time. These points can be considered as being latitude, longitude,altitude and time).
ORG 1:
Org 1 was an advanced mode with 4D profile planning, detection and resolution of planningconflicts. An arrival planning system (Arrival Manager) resolved most planning conflicts byseparating all arriving aircraft in space and time. The following PATs assisted the ArrivalManager: Trajectory Predictor (Trajectory Predictor), Conflict Probe (CP) and Flight Path Monitor(FPM).
The implementation of 4D trajectories calculated by the ground system was performed byusing conventional radio communication to the aircraft. Advisories1 displayed to the controllerwere generated by the ground system in order to support the controllers in meeting constraints ofthe Arrival Manager.
Deviations of aircraft from the planned trajectory as well as unsolved conflicts between plannedtrajectories (detected by the Conflict Probe) had to be resolved manually by the controller. Thesystem supported the controller in this process by measuring deviations (done by the Flight PathMonitor) and displaying the deviations in time and space against the planned trajectory (calculatedby the Trajectory Predictor).
1 Advisories are control instructions such as "Descend to flight level 100 at 1700 feet per minute"

The PD/2 System PD/2 Final Report
18 Version 1.2 DOC 97-70-13February 1998
Flight strips were not used and thus the controller worked within a stripless environment (neitherpaper nor electronic strips). The interaction between controller and ground system and alsobetween the controllers was supported by direct label interaction mechanisms within the displays.
ORG 2:
In addition to ORG 1, Org 2 introduced an air-ground integrated system. This allowed 4D FMSequipped aircraft to use datalink to negotiate and implement airborne calculated trajectories thatfulfilled the constraints developed by the Arrival Manager in order to implement an arrivalsequence and schedule. For unequipped aircraft, the trajectory support was provided by theground system as in ORG 1.
Thus, the definition of the ORGs led to an operational concept that allowed three guidance modesto be applied:
• An aircraft in class A guidance mode was 4D FMS and datalink equipped and had theclearance to implement its own trajectory automatically.
• A class B guidance mode was available for all aircraft that were guided via R/T, and for whichthe ground system had support in form of a conflict-free trajectory and the associatedadvisories.
• An aircraft in Class M or manual guidance mode was guided via R/T without using trajectoryinformation, as applied in the current systems.
That meant that in ORG 0 only Class M, in ORG 1 Class B and Class M and in ORG 2 Class A, B,and M guidance modes were possible. It should be noted that all guidance modes of the lowerORGs were further supported in the higher ORGs. It is an important result of PD/2 that definitionsof operational scenarios for the higher ORGs could be found without the requirement of arevolutionary change when moving toward more advanced organisations. The compatibility withlower guidance levels down to Class M solves the problem of connections to or transitionsbetween areas with different levels of capability. Another advantage is that lower guidance modescan be used as safety net in case of failure of the higher guidance modes.
Figure 1 shows the transitions between guidance modes that were modelled in the PD/2 trials.Controllers monitored the flight progress of a Class A aircraft. If no problem was detected theseaircraft flew without R/T communications other than ‘initial call’ when entering and ‘frequencychange’ when leaving the sector. However, every time controllers saw the necessity to intervene,e.g. due to safety reasons, they could guide the aircraft via R/T. The first heading, speed or levelchange command given via R/T to Class A aircraft implied that this aircraft was guided further viaR/T. A negotiated contract between air and ground via datalink was no longer valid after theimplementation of the R/T command and the status of aircraft automatically changed from Class Ato Manual mode as the system was updated about the tactical intervention by GHMI input. As arule R/T communication always had priority over datalink communication.
An aircraft once degraded to Class B or Class M mode could not get back to Class A because are-negotiation procedure was not implemented in PD/2. Whereas a transition between Class Mand Class B guidance was always possible depending on the deviation of an aircraft from its 4Dposition on the planned trajectory as detected by the FPM.
With Class B guidance the 4D guidance of the aircraft along its trajectory was achieved by theTactical Controller passing the advisories generated by the ground system to the aircraft by R/T.

PD/2 Final Report The PD/2 System
DOC 97-70-13 Version 1.2 19February 1998
Figure 1 Transition of Guidance modes in PD/2
Transitions from Class M or Class B guidance modes back to a Class A guidance mode for 4DFMS by air-ground re-negotiation via datalink or voice as well as a Class B guidance via datalinkmessages from the ground were not exercised in PD/2 measured trials. However, these areoptions compatible with the operational concept that was developed for PD/2.
3.2 PHARE ADVANCED TOOLS
The PHARE Advanced Tools (PATs) provided the ground based support tools and functions toassist controller productivity. The following sections describe the subset of PATs that wereintegrated in PD/2.
3.2.1 Trajectory Predictor (TP)
For the ground system the Trajectory Predictor provided the trajectory as the new basicinformation entity extending the flight plan information in use today (for the airborne part an 4DFMS and datalink equipped aircraft can provide this information).
The Trajectory Predictor generated the trajectory information for each aircraft. In PD/2 only thearrival part of the trajectory was used, equivalent to about 30 minutes flying time including the topof descent from cruise level until the Approach Gate (10 NM from runway threshold). Alltrajectories were generated using standard arrival routes (STARs).
3.2.2 Conflict Probe (CP)
The Conflict Probe compared the new trajectory of an aircraft entering the simulation with alltrajectories already stored within the flight database of the ground system. Any violation ofseparation criteria like radar separation or wake vortex separation was identified and displayed inspace and time.
3.2.3 Flight Path Monitor (FPM)
The Flight Path Monitor compared each radar position of an aircraft against the 4D position takenfrom the active trajectory stored in the ground system. Deviations in terms of distance in spaceand time were produced with the surveillance update rate, for further processing by the supportingtools like the Arrival Manager, and for being displayed to the controllers.

The PD/2 System PD/2 Final Report
20 Version 1.2 DOC 97-70-13February 1998
3.2.4 Negotiation Manager (NM)
In PD/2 the Negotiation Manager took care of the air-ground exchange of information with respectto trajectories. The Negotiation Manager controlled the interface between the ground-based toolset and the 4D FMS equipped aircraft which were connected via the air-ground datalink system.
3.2.5 Arrival Manager (AM)
The Arrival Manager formed the central tool in the PD/2 environment. The tool worked overmultiple sectors of an extended TMA in order to provide optimised scheduling and sequencingadvisories for all arriving aircraft. Basic Arrival Manager functionality is in use in current daysystems already; it is based on arrival time prediction which is typically integrated in those toolsusing flight plan information, for instance COMPAS. In the advanced concept of PD/2 this basicfunctionality of arrival management was extended and based on trajectory information, eithergenerated by airborne systems within 4D FMS, or by a ground based trajectory predictor.
In addition for PD/2 the Arrival Manager generated the route, profile, speed and arrival timeadvisories based on the information from the trajectory, and these were then transferred to theGHMI. The AM also provided the functionality to update constraints either by deviation eventsgiven by the FPM or by controller inputs that affected the contracted trajectory status.
Figure 2 Arrival Manager in the PD/2 context
Figure 2 shows how the Arrival Manager was embedded in the tool set of the PD/2 system. Onthe left the tools available in current day ATC systems are represented by the CMS platform. Onthe right the advanced tools used for processing the trajectory information on the ground are listed.The information was exchanged with the airborne systems via the controllers R/T or via datalink.A connection to a Runway Operations Manager shown at the bottom was not implemented inPD/2, but was included in the AM concept.
The Arrival manager of PD/2 was composed of four main components: Arrival Time Predictor,Sequencer, 4D Descent Manager and Approach Problem Solver.
PD/2 Final Report The PD/2 System
DOC 97-70-13 Version 1.2 21February 1998
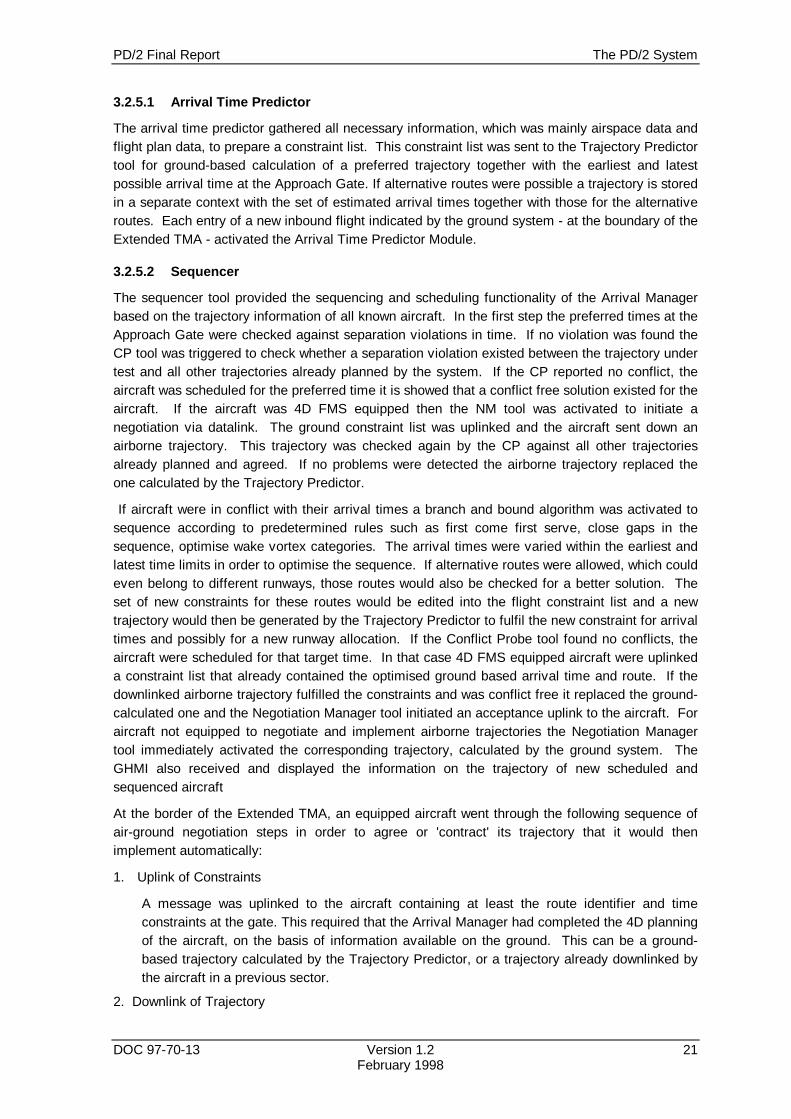
3.2.5.1 Arrival Time Predictor
The arrival time predictor gathered all necessary information, which was mainly airspace data andflight plan data, to prepare a constraint list. This constraint list was sent to the Trajectory Predictortool for ground-based calculation of a preferred trajectory together with the earliest and latestpossible arrival time at the Approach Gate. If alternative routes were possible a trajectory is storedin a separate context with the set of estimated arrival times together with those for the alternativeroutes. Each entry of a new inbound flight indicated by the ground system - at the boundary of theExtended TMA - activated the Arrival Time Predictor Module.
3.2.5.2 Sequencer
The sequencer tool provided the sequencing and scheduling functionality of the Arrival Managerbased on the trajectory information of all known aircraft. In the first step the preferred times at theApproach Gate were checked against separation violations in time. If no violation was found theCP tool was triggered to check whether a separation violation existed between the trajectory undertest and all other trajectories already planned by the system. If the CP reported no conflict, theaircraft was scheduled for the preferred time it is showed that a conflict free solution existed for theaircraft. If the aircraft was 4D FMS equipped then the NM tool was activated to initiate anegotiation via datalink. The ground constraint list was uplinked and the aircraft sent down anairborne trajectory. This trajectory was checked again by the CP against all other trajectoriesalready planned and agreed. If no problems were detected the airborne trajectory replaced theone calculated by the Trajectory Predictor.
If aircraft were in conflict with their arrival times a branch and bound algorithm was activated tosequence according to predetermined rules such as first come first serve, close gaps in thesequence, optimise wake vortex categories. The arrival times were varied within the earliest andlatest time limits in order to optimise the sequence. If alternative routes were allowed, which couldeven belong to different runways, those routes would also be checked for a better solution. Theset of new constraints for these routes would be edited into the flight constraint list and a newtrajectory would then be generated by the Trajectory Predictor to fulfil the new constraint for arrivaltimes and possibly for a new runway allocation. If the Conflict Probe tool found no conflicts, theaircraft were scheduled for that target time. In that case 4D FMS equipped aircraft were uplinkeda constraint list that already contained the optimised ground based arrival time and route. If thedownlinked airborne trajectory fulfilled the constraints and was conflict free it replaced the ground-calculated one and the Negotiation Manager tool initiated an acceptance uplink to the aircraft. Foraircraft not equipped to negotiate and implement airborne trajectories the Negotiation Managertool immediately activated the corresponding trajectory, calculated by the ground system. TheGHMI also received and displayed the information on the trajectory of new scheduled andsequenced aircraft
At the border of the Extended TMA, an equipped aircraft went through the following sequence ofair-ground negotiation steps in order to agree or 'contract' its trajectory that it would thenimplement automatically:
1. Uplink of Constraints
A message was uplinked to the aircraft containing at least the route identifier and timeconstraints at the gate. This required that the Arrival Manager had completed the 4D planningof the aircraft, on the basis of information available on the ground. This can be a ground-based trajectory calculated by the Trajectory Predictor, or a trajectory already downlinked bythe aircraft in a previous sector.
2. Downlink of Trajectory
The PD/2 System PD/2 Final Report
22 Version 1.2 DOC 97-70-13February 1998
If the aircraft accepted the uplinked constraints it downlinked a trajectory which fulfilled theconstraints based on the current weather information obtained. If the aircraft could not fulfil theconstraints it downlinked a message indicating that it was unable to fulfil the constraints. Theaircraft was then guided via Radio-Telephony (R/T), as for an unequipped aircraft. Eachdownlink of a trajectory caused a new check of the trajectory against all other active systemplans on the ground in terms of conflicts and constraints.
3. Uplink Clearance
If, as normally expected, there was no conflict with a downlinked trajectory that met theconstraints, a "contract given" message is exchanged.
3.2.5.3 Approach Problem Solver
In case of problems such as conflicts found by the Conflict Probe the Arrival Manager variedaltitude and time constraints on other route points before the Approach Gate in order to obtain aconflict free trajectory. This capability included in the PD/2 Arrival Manager was limited because ittook into account only the trajectories of the arrivals, but no departures and overflights.
If no conflict free trajectory solution could be found the scheduled time in the arrival sequence wasmaintained but the trajectory was marked as ‘in conflict’ on the controllers display. The ArrivalManager would still provide an arrival slot for those aircraft but could not provide a conflict-freesolution. It was then the controllers' task to find a solution. This was normally easy to achievesimply by vectoring the aircraft off from its route to avoid the predicted conflict.
3.2.5.4 4D Descent Manager
The task of the 4D Descent Manager module was to support the implementation of eachscheduled trajectory. This was done by translating the trajectory representation into advisoriesapplicable as control commands via R/T. Those advisories were generated for turns, descents,descent rates, and speeds. In addition, the position and time that the specific advisory should beapplied was produced. This information was transferred to the GHMI before expected executiontime to allow an advanced indication to the controllers of the application of advisories. Deviationmessages were given regularly by the Flight Path Monitor were used by the 4D Descent Managerto decide whether the guidance mode of an aircraft had to be changed.
3.3 SIMULATED AIRSPACE
PD/2 addressed the terminal approach issues by simulating several sectors of an extended TMAand by emulating entry and exit conditions at en-route sectors. Figure 3 shows schematically theairspace used to model an extended TMA for arrival traffic. The organisation of the airspace wasstill assumed to be as it is today. The basic layout was taken from the Frankfurt TMA. Adjacent tothe TMA were three en-route sectors, each controlled by an area control centre (ACC).
At the centre of figure 3 the parallel runway system (25L and 25R) is located. In contrast toFrankfurt, these were wake vortex independent. The dotted lines pointing to each of the parallelrunways indicate the extended centrelines of an ILS. The arrival route structure is shown as solidlines. Inbound traffic entered the TMA via the metering fixes Rüdesheim RUD, Gedern GED, andSpessart PSA. Traffic from north was planned to land on the northern runway (25R), traffic fromsouth on the southern (25L). However, arrivals from the West could be routed either on asouthbound or northbound STAR to the allocated runways. The arrival traffic was handed over tothe tower controller (this position is not simulated in PD/2) about 10 NM from threshold at the so-called Approach Gate (shortened to 'Gate' in the following text). The Gate position corresponds toan altitude of 3000 ft. On Figure 3 the Gate is marked as blue line perpendicular to the extendedcentreline marks.

PD/2 Final Report The PD/2 System
DOC 97-70-13 Version 1.2 23February 1998
FEEDER
PICKUPPLANNER
TC-WEST
ACC -WEST
ACC -NORTH
ACC -SOUTH
TMA
RUD
GED
PSA
Figure 3 Extended TMA
3.4 Controller Roles
In the PD/2 simulation four different controller working positions were responsible to guide thearrival traffic (see figure 4).
En-route controllers
In PD/2 only the Area Control Sector West (ACC-W) was staffed with one Tactical Controller (TC-W). The other ACC sectors North and South were simulated automatically as if an ideal controllerteam was working there. The Tactical Controller ACC Arrival West (TC-W) controlled the arrivaltraffic and overflights (traffic from and to other airports) within the West Sector.
In PD/2 the TC-W also performed the task of the Planning Controller West (PC-W) because onlythe co-ordination with the adjacent TMA sector was modelled.
Approach controllers
Approach (APP) controllers controlled the TMA sector.
Two working positions for tactical controllers, a TC-P (for Tactical Controller APP Pickup) and aTC-F (for Tactical Controller APP Feeder) were needed working within the same airspace but ondifferent R/T frequencies.
The team of the two tactical controllers was completed by a Planning Controller Approach (PC-A).
The three APP controllers sat alongside each other and shared their displays, supporting thenecessary close teamwork and co-ordination between them in a very flexible and natural way.
Planning Controller Approach (PC-A)
The Planning Controller Approach had the following tasks:
• Identification and assessment of potential conflicts between aircraft offered into the sector byuse of flight-plan/trajectory information, AM data, FPM and CP messages and Radar data, too.

The PD/2 System PD/2 Final Report
24 Version 1.2 DOC 97-70-13February 1998
• Notification to the TC-P and TC-F on any special conditions about the traffic before enteringthe sector.
• Co-ordination with TC-P and TC-F when a Class A to Class B aircraft planned change was tobe applied.
• Co-ordination with PC/TC of adjacent sectors when entry and exit conditions had to bechanged.
Tactical Controller Pickup (TC-P)
The main tasks of TC-P were to establish the AM landing sequence and to prepare a safe andefficient runway allocation for the TC-F.
In close co-operation with TC-F the TC-P was responsible for ensuring conflict-free passage ofaircraft (minimum separation: vertical 1000 ft; lateral 3 NM, for Wake Vortex relevantcombinations of aircraft up to 6 NM) through the TMA airspace. The TC-P had the following tasks:
• performing R/T Communication with aircraft (At least initial contact confirmation and frequencychange command to initiate handover to TC-F for arrivals and to other ACC TCs foroverflights),
• checking if aircraft have got the latest weather information,
• surveillance of aircraft using the radar information
• application of guidance and control commands in order to avoid separation conflicts,
• application of guidance commands until the transfer region (vicinity of extended centre-line forarrivals where the transfer to TC-F took place, Exit Fix for Overflights) in order to fulfil AMschedule and sequence using the AM display and 4D advisories for Class B arrival aircraft,
• updating the ground system with the guidance commands given,
• negotiation with TC-F and TCs (and/or PCs) of adjacent sectors when standing agreements hadto be changed,
• holding aircraft within the sector if necessary, either on request of TC-F or in case of any doubton the status of standing agreements.
Tactical Controller Feeder (TC-F)
The main task of TC-F was to guide the aircraft without conflicts (minimum separation: vertical1000 ft; lateral 3 NM, for wake vortex relevant combinations of aircraft up to 6 NM) to theextended centreline. TC-F gave ILS clearances and to established separation over the thresholdby speed commands up to the Outer Marker (4 NM from threshold).
The transfer of communication to the Tower Controller normally took place near the approachgate..
The TC-F had the following tasks:
• performing R/T Communication with aircraft (At least initial contact confirmation, ILS clearanceand a frequency change command to initiate handover to tower controller for arrivals),
• surveillance of aircraft using the radar display and weather display,
• application of guidance and control commands for deconfliction,
• guidance of the aircraft to the approach gate to meet the Arrival Manager schedule andsequence using the Arrival Manager display and the 4D advisories for Class B arrival aircraft,

PD/2 Final Report The PD/2 System
DOC 97-70-13 Version 1.2 25February 1998
• updating the ground system if an aircraft had to be guided manually, if the AM guidancesupport can not be applied,
• giving clearance for allocated ILS,
• establishing separation on ILS,
• informing PC-A and TC-P when a sequence cannot be met,
• negotiating with TC-P and Tower Controller when standing agreements had to be changed,
• updating the electronic system when changes in aircraft status and applied commands were notin agreement with the recommended advisories from the 4D Guidance support system.
3.5 Limitations of the PD/2 System
Every real-time simulation has to make simplifications and idealisations as compared to a realsystem. In the interpretation of the results the following limitations of the system underinvestigation have to be taken into account:
For the periods of data collection stable operational conditions applied:
• No weather changes, no runway direction changes, no missed approaches, and noholdings were modelled.
The plans developed by the system were not changed within the TMA:
• No trajectory updates, therefore no re-negotiation and no recovery of Class A status waspossible,
• no controller induced plan updates were allowed.
Co-ordination between sectors was simplified:
• Only the West sector was staffed. Traffic from the ACC South and ACC North sectorswere simulated automatically, as if the traffic would be delivered by ideal controller teamsin accordance with the computer generated plan (especially for ORG 0 this was a veryoptimistic assumption).
• The co-ordination tasks between ACC sectors were neglected, no further feeding ACCsectors were modelled.
• The airport to TMA interaction was excluded, therefore no Tower position was simulated.
The system worked under the assumption of de-coupled traffic streams:
• Departure traffic was assumed to be independent from arrivals. No departure traffic wassimulated.
• Some overflight traffic was simulated as background traffic, but the PD/2 tools wereprimarily designed for inbound traffic for their calculations (no en-route – arrival interactionmodelled).
• The staffed ACC sector had no trajectory-based tools specifically for handling of en-routetraffic (as e.g. the HIPS2 in PD/1)
PD/2 did not model short-term collision warning systems either on ground or in the air:
• No effect of airborne TCAS systems was modelled.
2 HIPS - Highly Interactive Problem Solver.

The PD/2 System PD/2 Final Report
26 Version 1.2 DOC 97-70-13February 1998
• No short-term conflict alert system was available for the controllers.
PD/2 was designed for a specific TMA with:
• only one airport within the TMA,
• a Parallel runway system that was assumed to be independent, and
• no obstacles or restricted areas were modelled
PD/2 worked on IFR procedures only:
• No VFR procedures were included
• ILS approaches only
3.6 Ground Human-Machine Interface (GHMI)
The GHMI used in PD/2 was designed within the PHARE GHMI project and provided a prototypeof a paperless system for approach controlling the advanced Organisations (ORG 1 and ORG 2).This section focuses on a short illustration of the principal elements of the GHMI. A detaileddescription is given in Annex G. The GHMI consisted of a multi-window environment that could beconfigured with the help of a GHMI administration tool to allocate the different tools (windows) tothe different screens at the controller working position. For ORG 0 a reduced mode of this systemwas used, together with paper strips for flight plan information which served as controllers'scratchpad. The sequence of arrivals was indicated on a time ladder of the Arrival ManagementDisplay (AMD). The Plan View Display (PVD) simulated a conventional radar system with a two-line label at each target that showed callsign, altitude/flight level, and ground speed.
The main elements available on each working position were the Plan View Display for the Radarinformation together with a Conflict Risk Display (CRD) in case of conflicts between trajectories onthe large screen and an Arrival Management Display for the planning controllers on the smallerscreen. For the ACC controllers additional Sector Inbound List windows were shown on the PVDin order to provide the flight plan information in advance for selectable entry and exit fixes. Also inthe ACC-position an additional Vertical View Display (VVD) window provided a vertical view of thetraffic over fixes where holding patterns were normally located. However, note that holdingpatterns were not used in the PD/2 simulations.
3.6.1 Plan View Display (PVD)
The PVD showed the plan view of the airspace together with the labelled radar targets (Figure 4).A radar tool box window allowed the controller to select the centre, the scale, the number of historydots displayed together with the radar targets as well as the airspace elements to be shown andthe label deconfliction method. In case of a planning conflict, the Conflict Risk Display (CRD)popped up on the PVD. In this window the callsigns of the conflicting aircraft were listed togetherwith an indication of the time ahead of a conflict (minutes) and the minimum distance at conflicttime (nautical miles). Optionally the labels of the associated aircraft were highlighted on both thePVD and AMD. Please note that no short-term conflict alert was included in the PD/2 system.

PD/2 Final Report The PD/2 System
DOC 97-70-13 Version 1.2 27February 1998
Figure 4 Plan View Display (PVD)
3.6.1.1 Aircraft Label
The aircraft labels provided the main interaction mechanism for the advanced Organisations. Acontroller selected a label simply by moving the mouse cursor over the label. Selection wasindicated automatically by a background field containing the label lines in reverse colour. The labelcolours grey, pink and white indicated whether the aircraft was under the control of anothercontroller, was in a transfer status, or was under the sector's control. Transfer could be initiated byclicking a transfer field in the upper left corner of each label. Pop-up menus from the labels werealso available to input flight level, airspeed, and rate of descent/climb values. A heading changecould be input by clicking on the 'heading' field to pop-up an arrow that could be dragged aroundthe radar target by the mouse, helping to select a heading value which was also indicatednumerically. Inputs were always carried out with the left mouse button whereas outputs extendingthe label data, such as destination airport or weight class, were obtained with the right mousebutton. The same label interaction was also available on AMD and VVD by moving the mousepointer over the callsign indicator of an aircraft.
The aircraft symbol showed the equipment level of an aircraft. A square indicated 4D equipment(datalink and 4D FMS), a circle indicated non-4D equipped aircraft. Class A aircraft with a clearedcontract were shown as a filled square and Class B aircraft, with ground trajectory support onlywere indicated as outlined circle or square. If an aircraft was guided manually by the controller thetarget became yellow.

The PD/2 System PD/2 Final Report
28 Version 1.2 DOC 97-70-13February 1998
3.6.1.2 Trajectory representation
Figure 5 shows the PVD representation with selected label and complete trajectory on the exampleof SAS171 arriving on a northern route via metering fix Gedern to RWY 25R on the left bottom ofthe figure.
Figure 5 Trajectory Presentation at PVD
The trajectory information is visible on the PVD graphically as a blue line along the whole route foreach aircraft individually. The planned position of an aircraft is marked as a blue cross at thetrajectory line. Another option was available to make only the future planned path for all aircraftvisible as blue lines starting with a cross at the planned present position. The length of this ‘future-line’ was selectable (in steps of 1 minute).
3.6.2 Arrival Management Display (AMD)
Sequence and scheduled time calculated by the AM was represented on a time scale (timeladder), with progression from top to bottom. Figure 6 shows the AM display layout for theApproach Controllers. Here the time for the Approach Gate is the reference time. For ACC Westthe time over metering fix RUD is the reference time.

PD/2 Final Report The PD/2 System
DOC 97-70-13 Version 1.2 29February 1998
Figure 6 Arrival Management Display Approach
The input buttons shown at the right inform the Arrival Manager about significant changes ofcertain constraints such as RWY direction change, necessity to insert a slot, or change of theminimum separation in use. In order to keep the traffic demand during the experimentsunchanged this functionality was not used in PD/2.
The aircraft labels in the AM Display of the Approach indicate the runway allocation, 25Left or25Right. They are framed in different colours showing the different arrival routes (blue = north,yellow = south, green = west).
Aside of each label frame the angle of the 'delay pointer' shows the deviation in time as measuredby the FPM. A pointer deflected downwards indicates an aircraft that is early, a pointer deflectedupwards indicates a delay, whereas a horizontal tail line indicates no delay.
3.6.3 Advisories
In the complex approach environment control of aircraft by R/T can never follow a trajectory asaccurately as a 4D – FMS. There will also be differences between the ground meteorologicalmodel and the actual weather. For these reasons, the end of the trajectory was marked with an Xto indicate the desired position of the aircraft. Controllers were then at liberty to modify the R/Tadvisories as required to maintain the aircraft on its trajectory.
Special markers on the displayed trajectories indicated significant positions when the aircraft statewould undergo changes such as start/end of descent or speed changes. Written at those markersin two lines were the previous and new target values. In addition for class B aircraft, yellow

The PD/2 System PD/2 Final Report
30 Version 1.2 DOC 97-70-13February 1998
markers showed where to apply the next advisories. An outlined square was used for a heading, atilted cross for altitude and an upright cross for speed advisory positions. These markersdisappeared when the controller confirmed the advisory.
The advisories of the Arrival Manager were displayed in orange colour in a third label line foradvised altitude/flight level, airspeed, heading, rate of descent, and were preceded by a tickmarker field that could be clicked on by the controller when the R/T command was activated. Inthat case the third line showed the last cleared FL if the aircraft had not reached it. The orangeadvisories disappeared automatically when the time of application was passed.

PD/2 Final Report Trials Facility
DOC 97-70-13 Version 1.2 31February 1998
4 TRIALS FACILITY
The PD/2 trials were conducted on the Air Traffic Management and Operations Simulator ATMOSof DLR. The airborne demonstrations included the experimental cockpit and DLR's ATTAS. Thissection provides a brief overview of the facilities and their configurations for the trials.
The picture below gives an impression of the ATMOS environment and the controller workingpositions.
Figure 7 Working positions of ATMOS during the PD/2 Experiment.
4.1 ATMOS HARDWARE
The ATMOS hardware for PD/2 consisted of the following elements:
• a network of Pentium PCs serving the Sony PVD and 19’’ AM Displays, providing thecontrollers with an interface to the system
• a DEC 3200 workstation supporting the basic ATC simulation
• 6 pseudo pilot terminals connected to the DEC 3200 workstation by serial lines
• an DLR developed R/T system providing simulated R/T channels between controllers andpseudo-pilot as well as live R/T channels for use with the ATTAS aircraft
• a cluster of three Sun workstations supporting the PATs set in a CMS environment
• 4 Silicon Graphics Workstations supporting a datalink simulation, the interface between basicATC simulation and CMS/PATs system, a data server for the GHMI data, and the trials datastorage and pre-analysis

Trials Facility PD/2 Final Report
32 Version 1.2 DOC 97-70-13February 1998
• An additional Pentium PC was used for the GHMI supervision and configuration control
• a connection to the ATTAS simulation environment, providing access to the EFMS either by aground link based on Ethernet, or to the ATTAS aircraft by using a telemetry datalink
• Input devices for subjective workload assessments (SWAT)
• 6 video cameras with three video recorders for storing the trials on video together with theaudio signals
For the training system some parts of the ATMOS hardware was duplicated:
• a network of PCs serving BARCO 2500 and 19’’ Displays, providing controllers with aninterface to the ATMOS training system and the PC-based GHMI training tools
• a DEC 3200 Workstation supporting the basic ATC simulation without pseudo-pilot terminals
• a Sun workstation, supporting the PATs/CMS tools
• 2 Silicon Graphics Workstation supporting the interface between basic ATC simulation andCMS/PATs system and holding a data server for the GHMI data
4.2 SOFTWARE
The major software components of ATMOS were:
• PATS tool set embedded in the CMS platform PARADISE
• a ground human-machine interface (GHMI)
• a multi-aircraft simulator model
• a surveillance and tracking system
• a datalink simulation with an interface to a telemetry datalink
• a flight plan and traffic generator
• a traffic simulation for unstaffed sectors
• a weather model
• supporting databases
• analysis tools for stored experimental data
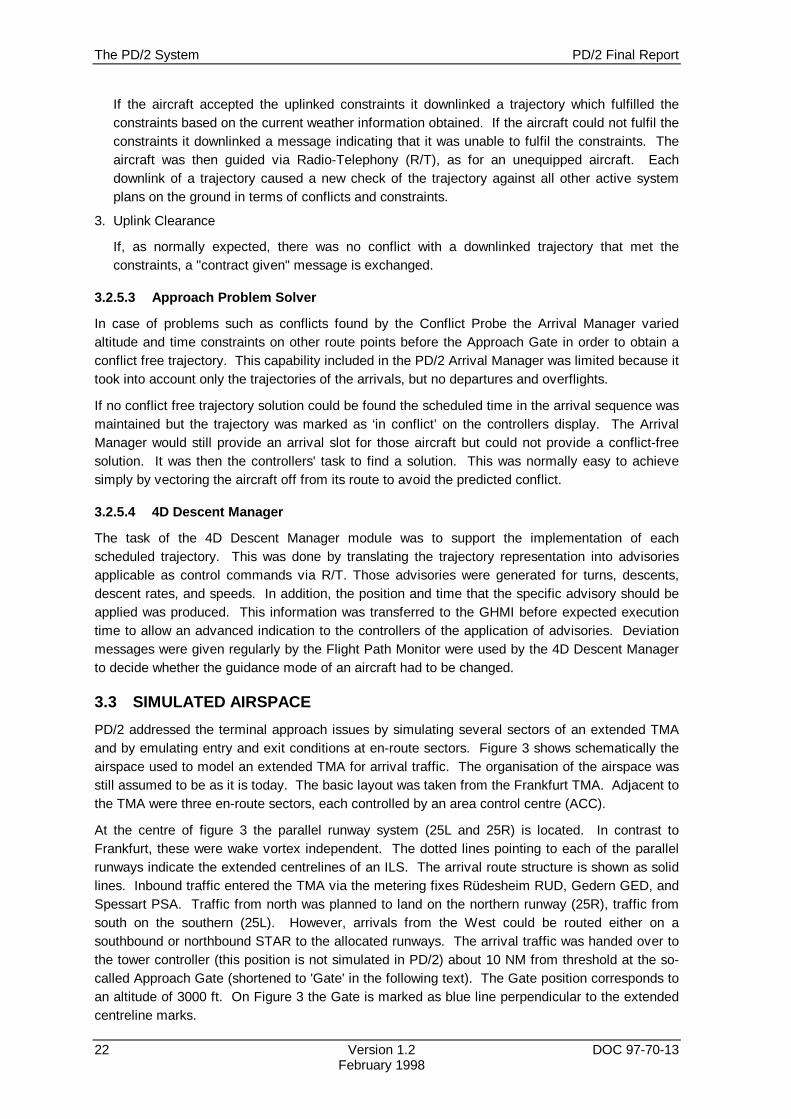
4.3 ATTAS EXPERIMENTAL COCKPIT
For one run in each week of the PD/2 trials the ATTAS Experimental Cockpit, operating as a fixed-base cockpit simulator of DLR’s ATTAS aircraft, was introduced into the simulated traffic scenario(Figure 8). The controllers handled the simulated ATTAS aircraft in the same way as the othersimulated aircraft. The pilot was enabled to communicate with ATC by connection to thesimulated R/T communication network. Also, due to the equipment of the Experimental Cockpitwhich allowed direct control of the ATTAS when fitted to the aircraft, the pilot was able to operatethe Experimental Cockpit as Class A or B aircraft. Data link communication between the PD/2ground system and the Experimental Cockpit, i.e. the EFMS as part of the cockpit environment,was realised by TCP/IP and Ethernet.
AHMI evaluation trials were performed with the Experimental Cockpit in the laboratory utilising theequipment described above. Six pilots participated in the experimental evaluation which focusedon the Navigation Display layout as well as the interaction with EFMS by means of touch pad inputas cursor control device for the Navigation Display. For purpose of these AHMI evaluation trials a
PD/2 Final Report Trials Facility
DOC 97-70-13 Version 1.2 33February 1998
Data Link Dialogue Test Facility replaced the ATMOS connection to the EFMS and simulation, toensure pre- and in-flight modification and re-negotiation of constraint list and trajectory. However,the connection was realised also via TCP/IP and Ethernet.
Figure 8 ATTAS Experimental Cockpit
4.4 LIVE AIRCRAFT
For demonstration and evaluation runs during the PD/2 demonstration week in June 1997, DLR’sATTAS aircraft was introduced into the simulated traffic scenario as live 4D FMS aircraft (Figure9). Aircraft control responsibility was allocated to the pilot seated in the Experimental Cockpit thatin this case was fitted to the aircraft. For data link I/O, the pilot utilised the Control Display Unit ofthe EFMS or the AHMI, i.e. the interactive Navigation Display for planning the flight.
The aircraft was handled by the controllers in the same way as the other simulated aircraft, butwith the trajectory negotiation process being conducted directly between the planning controllerworking position of the PD/2 ground system and the EFMS installed in the aircraft. The data linkcommunication between the PD/2 ground system and the EFMS was conducted over DLR’stelemetry data link system. A voice communication system enabled the pilot to follow ATCadvisories in case of a downgrade of the ATTAS aircraft class from Class A.
The demonstration runs were performed in the local Braunschweig/Hannover area, a requirementthat resulted from utilisation of the DLR telemetry data link system. However, for the experimentalpilot the Frankfurt approach situation was simulated by means of an area offset calculationperformed on-board the aircraft.
Whilst, in the majority of demonstration runs, the ATTAS was operated as a full 4D FMS aircraft(class A aircraft), two demonstration runs were performed with the ATTAS representing a Non 4DFMS aircraft, i.e. an aircraft without 4D FMS and data link. The controllers handled the liveaircraft using R/T advisories in the same way as the other simulated Non-4D FMS aircraft.

Trials Facility PD/2 Final Report
34 Version 1.2 DOC 97-70-13February 1998
The configuration details of the simulation facility during the trials are shown Figure 10.
Figure 9 DLR’s Experimental Aircraft (ATTAS)
SupervisorPosition
ATMOS PD2 GroundSystem Telemetry
Live DatalinkSystemLive Air-Ground
Data
SimulatedSurveillance Data
ControllerHMIPseudo-Pilot
HMI
ACC West Planner Pick-Up
Simulated RadioCommunications
Live RadioCommunications
Live VoiceCommunications
System
Simulated Air-GroundDatalink
ATTASExp. Cockpit
ATTAS
4D-FMS
4-D FMS
Feeder
Controller working Positions
Figure 10 PD/2 Trials Configuration
PD/2 Final Report Methods
DOC 97-70-13 Version 1.2 35February 1998
5 METHODS
This chapter describes the experimental design, the methods used for collecting data, and theparticipating controller teams in the PD/2 trials. A more detailed description is given in Annex A.
5.1 EXPERIMENTAL DESIGN
Two independent variables were defined in PD/2: system organisation and traffic volume. Threedifferent organisations (ORGs) were used:
• a baseline system (ORG 0), which corresponded to a typical strip-oriented ATC system withlimited planning aids like those actively used today (e.g. COMPAS),
• an advanced system (ORG 1), in which the PHARE Advanced Tools and a new GHMI wereimplemented to assist controllers,
• ORG 2/ 30% and ORG 2/ 70% that had the same functionality as ORG 1, but additionally30%, or 70% of 4D FMS and datalink equipped aircraft were introduced.
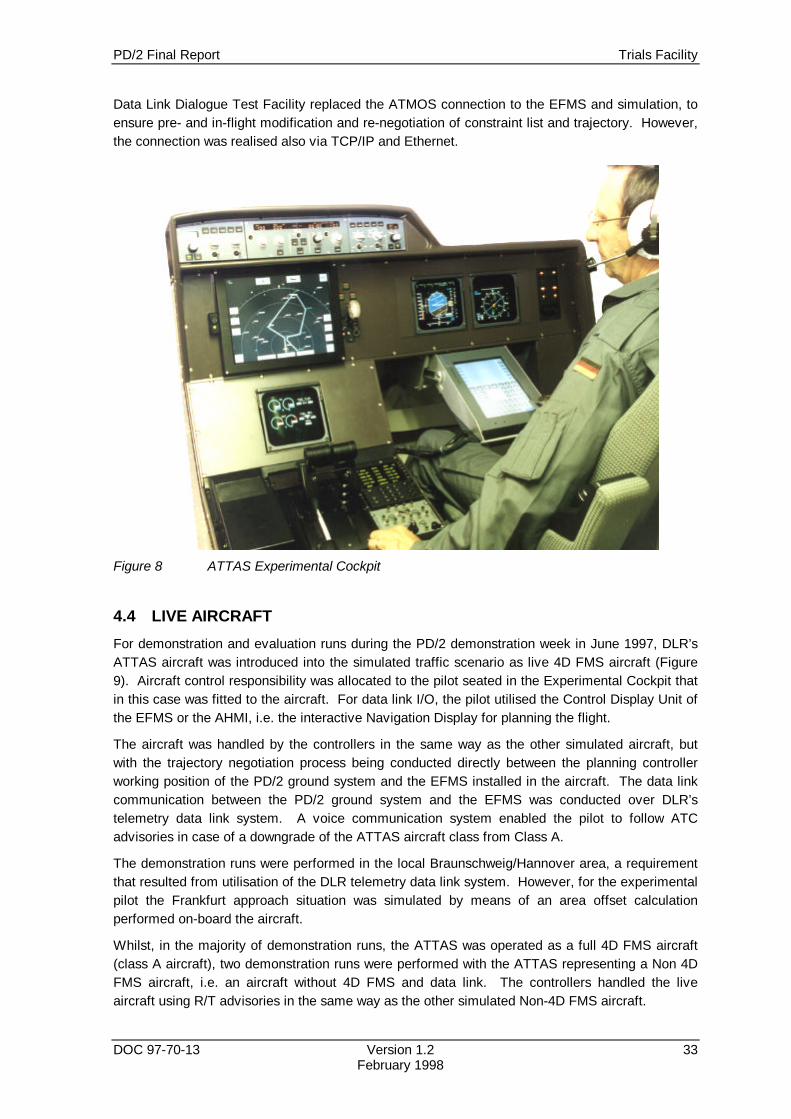
Table 2 below summarises the differences and conformities of the different ORGs, respectivelyand shows how they related to the objectives of PD/2. Analysis of ORG 0 against ORG 1 datafocused differences due to effects of introducing computer assisted tools (PATs) and GHMI.Whereas the effects of increasing proportions of 4D FMS/datalink aircraft were shown by acomparison of ORG 1 data against ORG 2/ 30%, and a further comparison against ORG 2/ 70%data.
ORG 0 ORG 1 ORG 2/ 30% ORG 2/ 70%
PATS Conventionalplanning
PATS trajectorybased planning
PATS trajectorybased planning
PATS trajectorybased planning
GHMI Referencesystem withpaper strips
Advanced, nopaper strips
Advanced, nopaper strips
Advanced, nopaper strips
4D FMSdatalink
None None 30 % of a/c intraffic sample
70 % of a/c intraffic sample
Table 2 Summary of Organisations
Two traffic samples were developed:
a ‘medium traffic‘ sample in which traffic volume, mix of aircraft weight categories, and distributionover the arrival routes were tuned to represent a typical today’s situation of Approach controllerworkload in peak traffic periods, and,
a ‘high traffic’ sample with an increase of more than one third of the 'medium' traffic. Actually, thesample had 37% more aircraft, with linear increases of both the number of aircraft per weightcategory and the number of aircraft on different arrival routes.
By using the two traffic samples in each ORG two different volumes of inbound traffic wereemployed:
O RG 0 vs. O R G 1 :E f f e c t o f P A TS andG H M I i n t r o d u c t i o n
O R G 1 v s . O R G 2 :Ef f e ct o f i n creasingp r o p o r t i o n o f 4 - D F M Sa n d d a t a l i n k e q u i p p e d a / c

Methods PD/2 Final Report
36 Version 1.2 DOC 97-70-13February 1998
• 'medium', corresponding to a traffic demand of 48 inbound aircraft per hour, and
• 'high', corresponding to an increased demand of 66 inbound aircraft per hour.
These figures were not further varied because the aim of PD/2 was not to increase runwaycapacity but to determine the effect of introducing computer assistance tools and 4DFMS/datalink. The experiment was based on repeated measurements of eight teams with fourcontrollers in each team. All teams performed the same experimental programme. Four differentORGs, each performed under high and medium traffic load, resulted in eight measured runs perteam.
The sequences of runs were balanced between teams, which meant that the order of the tasks wassystematically varied to avoid any bias by learning, fatigue, or other order effects. Within a team'strials the Approach Pickup and Feeder controller rotated their positions, in conjunction withalternating between high and medium traffic volume in consecutive runs. This kind of repeatedmeasurement design allowed a quantitative analysis of data that was supported by statisticalsignificance tests of non-parametric statistics using matched pairs of observations. The chosensignificance criterion for the statistical tests was p≤ 0.05. Full details of the experimental designand the data analysis are given in Annex A.
5.2 MEASUREMENTS
Early in the PHARE programme, a guideline entitled "Template of Measurements to be used inPHARE Demonstrations" identified the overall objectives of PHARE Demonstrations as beingrelated to the criteria of system performance, controller workload, and acceptance. It defines a setof agreed, mandatory measurements and recordings that were to be applied throughout all PHAREDemonstrations. The table below gives an overview.
Criteria Measurements and Recording
System Performance • Planned Traffic Data• Actual Traffic Data
Controller Workload • ATC instructions issued• Subjective Workload Measures
Controller Acceptance • Questionnaires• Debriefings
Table 3 PD/2 Evaluation Criteria, Measurements and Recording
The data listed in the table were recorded directly from the simulation system and from controllerresponses. They were complemented by video-/audio-recordings of controller activities takensimultaneously from the four working positions during all the simulation runs, and by observer’snotes logged by two PD/2 staff observers on each run. In this way, objective and subjective datawere collected.
5.2.1 System Performance
The key measurements of system performance which were produced from the recorded data arethe following:
• Number of Landings
• Flight Time

PD/2 Final Report Methods
DOC 97-70-13 Version 1.2 37February 1998
• Inbound Delays
• Precision of Delivery
• Separation
The performance domain refers to measurements of traffic throughput as well as quality of servicebecause of the close relationship between the quantity of traffic throughput and the quality ofservice provided to airspace users. For instance, for a constant traffic sample as was applied in allORGs of PD/2, the number of aircraft served per time unit (in PD/2 the number of landings perhour) which is often used as the most straightforward indicator of throughput. This valuecorrelates with the average flight time in the TMA and average flight time is immediately relevantfor an airline’s perception of quality of service, since it affects delays, fuel consumption, etc.
Inbound delay was calculated in PD/2 as the difference between the actual time of Gateoverflight and the estimated time of an aircraft’s Gate overflight. The estimated, or preferred, timeis computed at the early stage of an aircraft’s entry into simulation and refers to its time over theApproach Gate if there were no other inbound aircraft and it could therefore follow its preferredtrajectory. This preferred trajectory corresponded to the initial trajectory an aircraft sent down tothe ATC and took into consideration not only an environmental flight-path but also the airlinesoperational procedures.
Precision of delivery was calculated from the difference between actual time over Gate andplanned time over Gate. Note that the planned time over gate may already include an inbounddelay because the planning algorithm has to account for the overall traffic situation either by usingmerely arrival time estimates in ORG 0, or by using conflict-free trajectories in ORG 1 and ORG 2.Precision of delivery was considered to be a useful indicator of how precisely the tools-generatedplans were actually implemented.
Finally, separation over gate was chosen as an indicator to check whether potential benefits (interms of flight time, delays, etc.) were achieved at the expense of reduced minimum separations.
5.2.2 Controller Workload
Workload was stated as one of the crucial elements of the PHARE demonstrations. To measurethe effect of the PHARE operational concept on controller workload objective and subjectivesources of data were analysed in PD/2:
Objective Workload Indicators
• Number of ATC instructions issued
• Frequency of R/T calls
• Percentage of simulation time spent for R/T communication
Three different parameters of workload indicating the activity of the tactical controllers while givingATC instructions, respectively how much radio/telephony (R/T) communication is necessary forthis, were calculated. These operational measures are often referred to as objective workloadindicators.
Subjective Workload Estimates
• SWAT (Subjective Workload Assessment Technique)
• NASA-TLX (Task Load Index)
Subjective workload estimates were collected during the course of simulation runs using SWAT,and by using the NASA-TLX method after completion of each run.
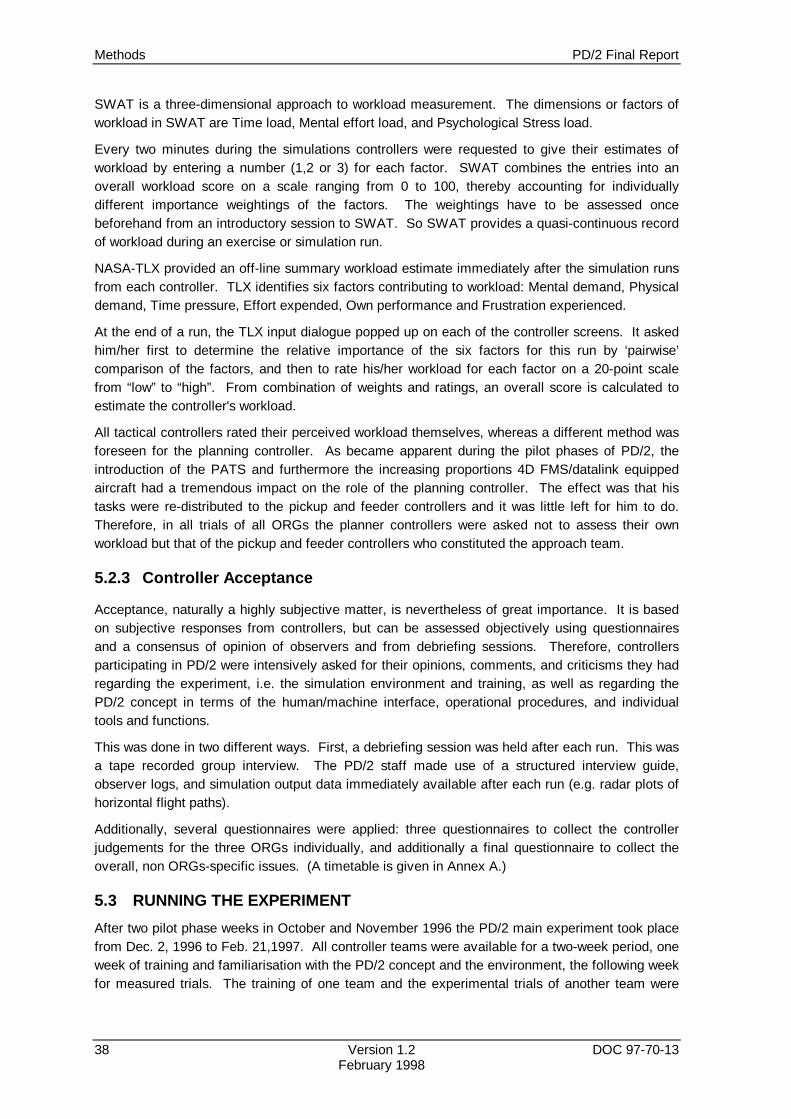
Methods PD/2 Final Report
38 Version 1.2 DOC 97-70-13February 1998
SWAT is a three-dimensional approach to workload measurement. The dimensions or factors ofworkload in SWAT are Time load, Mental effort load, and Psychological Stress load.
Every two minutes during the simulations controllers were requested to give their estimates ofworkload by entering a number (1,2 or 3) for each factor. SWAT combines the entries into anoverall workload score on a scale ranging from 0 to 100, thereby accounting for individuallydifferent importance weightings of the factors. The weightings have to be assessed oncebeforehand from an introductory session to SWAT. So SWAT provides a quasi-continuous recordof workload during an exercise or simulation run.
NASA-TLX provided an off-line summary workload estimate immediately after the simulation runsfrom each controller. TLX identifies six factors contributing to workload: Mental demand, Physicaldemand, Time pressure, Effort expended, Own performance and Frustration experienced.
At the end of a run, the TLX input dialogue popped up on each of the controller screens. It askedhim/her first to determine the relative importance of the six factors for this run by ‘pairwise’comparison of the factors, and then to rate his/her workload for each factor on a 20-point scalefrom “low” to “high”. From combination of weights and ratings, an overall score is calculated toestimate the controller's workload.
All tactical controllers rated their perceived workload themselves, whereas a different method wasforeseen for the planning controller. As became apparent during the pilot phases of PD/2, theintroduction of the PATS and furthermore the increasing proportions 4D FMS/datalink equippedaircraft had a tremendous impact on the role of the planning controller. The effect was that histasks were re-distributed to the pickup and feeder controllers and it was little left for him to do.Therefore, in all trials of all ORGs the planner controllers were asked not to assess their ownworkload but that of the pickup and feeder controllers who constituted the approach team.
5.2.3 Controller Acceptance
Acceptance, naturally a highly subjective matter, is nevertheless of great importance. It is basedon subjective responses from controllers, but can be assessed objectively using questionnairesand a consensus of opinion of observers and from debriefing sessions. Therefore, controllersparticipating in PD/2 were intensively asked for their opinions, comments, and criticisms they hadregarding the experiment, i.e. the simulation environment and training, as well as regarding thePD/2 concept in terms of the human/machine interface, operational procedures, and individualtools and functions.
This was done in two different ways. First, a debriefing session was held after each run. This wasa tape recorded group interview. The PD/2 staff made use of a structured interview guide,observer logs, and simulation output data immediately available after each run (e.g. radar plots ofhorizontal flight paths).
Additionally, several questionnaires were applied: three questionnaires to collect the controllerjudgements for the three ORGs individually, and additionally a final questionnaire to collect theoverall, non ORGs-specific issues. (A timetable is given in Annex A.)
5.3 RUNNING THE EXPERIMENT
After two pilot phase weeks in October and November 1996 the PD/2 main experiment took placefrom Dec. 2, 1996 to Feb. 21,1997. All controller teams were available for a two-week period, oneweek of training and familiarisation with the PD/2 concept and the environment, the following weekfor measured trials. The training of one team and the experimental trials of another team were

PD/2 Final Report Methods
DOC 97-70-13 Version 1.2 39February 1998
mostly conducted in parallel. Having a stand-alone training system enabled this approach andtherefore there was no interference between trials and training sessions.
During each week of trials, eight measured runs of 90 minutes duration had to be performed. Themeasured runs were performed in blocks of two runs of ORG 0 and ORG 1, and four runs of ORG2. The order of the blocks was varied systematically across teams. Each block was preceded bya warm-up run. After completion of the measured runs of ORG 2 a demonstration run wasperformed in which a live aircraft (ATTAS) was included in an additional ORG 2 traffic scenario.This produced a programme with 12 runs per week.
The demonstrations of the AHMI in the ATTAS Experimental Cockpit were carried out in a periodbetween May 2 and June 15, 1997. Six pilots (one per day), with backgrounds as airline or testpilots, participated in the demonstration programme which consisted of a series of simulated flighttasks including FMS and datalink simulation. They evaluated the AHMI during five different flighttasks including on-board generation, negotiation, and implementation of 4D trajectories. Themethod of evaluation was to use structured interviews in which the following areas wereaddressed: the operational philosophy, display modes and functions, the interaction device andedit functions.
5.4 CONTROLLERS
The PD/2 trials were generously supported by many national organisations that supplied theircontrollers. 32 controllers participated in the trials, from 7 European countries. They representedall kinds of backgrounds in military and civil ATC, and a wide range of computer experience.There were teams that used to work together in their home unit over years as well as teams whosemembers had never met before PD/2. A mixed military/civil controller team was also involved.The table below gives an overview of the participants.
PD/2 Pilot Phase
one team of 4 military controllers from UK
PD/2 Main Phase
32 controllers (eight teams) from
• France (ADP) • Romania (ROMATSA)
• Germany (DFS) • Sweden (LFV)
• Italy (SICTA) • United Kingdom (NATS)
• Netherlands (MilATCC)
Table 4 Supporting organisations for controllers in PD/2

Methods PD/2 Final Report
40 Version 1.2 DOC 97-70-13February 1998
This page is intentionally blank
PD/2 Final Report Training
DOC 97-70-13 Version 1.2 41February 1998
6 TRAINING
Before the trials each controller team participated in a one-week training phase.
The objectives of the training were:
− introduction of the PD/2 concept
− GHMI familiarisation
− getting hands on experience in learning to use the PD/2 system in a profitable manner
The controllers had to be enabled to take part in the PD/2 trials with full understanding of thesystem handling and philosophy. All details of the conducted training and of lessons learned canbe reviewed in Annex B.
6.1 THE COURSE
From December 1996 until February 1997 eight controller teams from seven European countriestook part in the PD/2 training. The training course was conducted as a five-day training course,one week in advance of the measured trials.
To be able to conduct the training in parallel with the measured runs, a specially built stand-alonetraining system was used. The PD/2 training course was conducted in one large training room thatprovided a sufficient training environment for three tactical and one planning controller. Theequipment included one workstation, three PC’s, an overhead projector and screen, a conferencetable and chairs. All PD/2 related training was conducted in this facility.
Specific training material, covering the overall concept, the simulated airspace, and the handlingof the GHMI was provided.
To satisfy the controllers' technical and operational questions and concerns, the instructor teamconsisted of an experienced Frankfurt controller and a technical trainer with system knowledge.The trainers mainly provided assistance in system handling and airspace management while thecontrollers were free to use their own choice of control practices.
See Annex B for a detailed description of the training course.
6.2 CONCLUSIONS FROM THE TRAINING
The PD/2 training programme succeeded in meeting the training objectives. The experience ofthe controller teams in the handling of today's PC systems differed a lot. However, due to theirflexible approach to the training, all participating controller teams reported they were well preparedfor the measured runs. Although the training programme was standardised, the PD/2 trainerssucceeded in adjusting the programme in accordance with the individual crews' performances byvarying the way the training was conducted. The results of the questionnaires (Annex B) reflectthe good quality of the training programme and show that all participants fulfilled the above statedobjectives.
During the training, some controllers did not use the stand-alone part of the system to their fullbenefit. Reading text written in a foreign language (English) and explaining a new and complexconcept was tiring some of the teams and they initially failed in assimilating all lessons of thestand-alone training. These ‘gaps’ had to be filled during the training runs afterwards. Instructorsshould closely monitor how stand-alone training is being conducted by their trainees. It isimportant to ensure that there is always an instructor available, even if only needed for somesimple translation assistance.

Training PD/2 Final report
42 Version 1.2 DOC 97-70-13February 1998
Aiming for a mixture of operational and technical knowledge in choosing the appropriateinstructors seems to be the right way to ensure that all operational and technical questions andconcerns of the controllers are being answered in a competent manner.
The training system should be a one-to-one copy of the main system. Due to the missing pseudopilot interface at the PD/2 training system, the R/T communication could only be ‘simulated’ duringtraining. Nevertheless, the ‘warm-up’ runs conducted before each measured run, proved to besufficient enough to get familiar with the pseudo-pilot communication while handling the system.
The PD/2 team makes the following recommendations for future system trials:
• Some teams needed more training to get used to the specific TMA airspace and air traffic load,others needed additional lessons in PC handling (usage of mouse, menus, clicking, etc.).Therefore, the training course should be conducted in the most flexible way to accommodatefor differences in knowledge and experience of controllers
• The course should provide a combination of operational and technical expertise
• A computer based training (CBT) course in advance of the main training activity would be ofbenefit, e.g. to provide controllers with CBT to use at their home base
• If possible, controllers with basic computer experience should be chosen for trials of advancedsystems.

PD/2 Final Report Results
DOC 97-70-13 Version 1.2 43February 1998
7 RESULTS
7.1 INTRODUCTION
The objectives of the PD/2 trial were to determine the effect on traffic throughput and controllerworkload by introducing PATs and 4D FMS equipped aircraft, as well as gaining a degree ofcontroller approval for the concept and tools. The results are presented in detail in Annex C:Analysis of traffic throughput/quality of service-, in Annex D: Analysis of workload -, and in AnnexE: Analysis of acceptance. This section summarises the major results presented therein.
PD/2 was a demonstration of the PHARE operational concept (section 3.1). It was not designed asa pre-operational system, going into service soon, but instead was meant for experimental andevaluative purposes. Therefore it is emphasised that the results presented in this section and inthe annexes cannot be transferred directly to a situation or system used in reality. However,significant positive effects of introducing the PD/2 system identify a benefit that might occur in areal system. The absolute magnitude of effects that can be expected in real systems will certainlydepend further on the actual characteristics of ETMA regions, route structures, and localoperational constraints.
Finally, it has to be pointed out that a considerable number of class A aircraft were downgradedfrom class A during the simulations as a consequence of controller intervention, or because thePATs were unable to compute conflict-free trajectories in time for some aircraft supposed to beclass A. In the PD/2 trials, there was no functionality to re-negotiate a trajectory and recover classA status (see section 2.1 of the Main Report for the mechanisms of transition between a/cclasses). Therefore, the actual proportions of class A aircraft, i. e. those aircraft who kept theirclass A status throughout the ORG 2 simulation runs, were smaller than the defined ratios of 30%and 70%. In fact, the results reported for ORG 2 refer to the following overall ratios actuallyachieved at the Gate:
High traffic scenarios
ORG 2 (30%): 19% class A; 81% non-class A,
ORG 2 (70%): 39% class A; 61% non-class A.
Medium traffic scenarios
ORG 2 (30%): 21% class A; 79% non- class A,
ORG 2 (70%): 52% class A; 48% non-class A.
7.2 TRAFFIC THROUGHPUT/QUALITY OF SERVICE
This section summarises the results of the statistical analysis of the traffic-related data recordedduring PD/2. Aspects of traffic throughput and aspects of quality of service are treated togetherhere, because in the TMA a close relation between the quantity of traffic throughput and thequality of service provided to airspace users can be assumed to exist. For instance, the number ofaircraft passing through an airspace per time unit which is often seen as the most straightforwardindicator of throughput, can be expected to correlate highly with the average flight time of aircraft.Flight time is immediately relevant for an airline’s perception of quality of service, since it affectsdelays, fuel consumption, etc.
PD/2 analysis extracted the following parameters from the simulation traffic data: number oflandings, flight time, inbound delays, precision of delivery, and separation.

Results PD/2 Final report
44 Version 1.2 DOC 97-70-13February 1998
Generally, under medium traffic-load, none of these measures were significantly influenced by thedifference in the organisations. There was a generally relaxed atmosphere prevailing in themedium traffic-load simulation runs, as indicated by the notes of the observers and comments ofthe controllers. The controllers succeeded in deploying their basic skills in ORG 0 in such a waythat an equivalent or sometimes even slightly more efficient guidance of inbound aircraft resultedthan in the advanced ORGs with strict observance of the system-generated advisories andconsequent strict adherence to the system trajectories.
In distinct contrast to that, under the high traffic load conventional sequence planning reached itslimits under ORG 0, and higher traffic demand was handled more smoothly with the PD/2advanced ORGs. As a consequence this chapter will concentrate on the results obtained underhigh traffic load. Annex C of the report provides full details of the results.
7.2.1 Number of Landings
In the figures which follow in this section the dots represent arithmetical means (M) of the eightscores obtained from the eight teams, vertical bars indicate the standard deviations (SD) of theeight scores, and thus the variability between teams.
The number of inbound aircraft that completed their flights through the simulated airspace of PD/2and were brought in to land on either of the two parallel runways was analysed as a first overallindicator of traffic throughput.
In the ORG 0 reference mode an average number of 62.2 landings per hour was measured underhigh traffic load. As can be seen from Figure 11 that shows the total means and standarddeviations per ORG over all eight teams, the average number of landings was noticeably higher inthe advanced ORGs. 64.6 landings per hour in ORG 1 showed a significant (p ≤ 0.05) increaseover ORG 0. Under the same traffic demand more than two aircraft more per hour were achievedto land.
ORG 2/ 70%ORG 2/ 30%ORG 1ORG 0
mea
n nu
mbe
r of l
andi
ngs/
h
70
65
60
55
traffic demand
Figure 11 Mean number of landings in high traffic scenarios
Two more things can be seen from Figure 11. First, mean landing rates of ORG 1, ORG 2/ 30 %,and ORG 2/ 70 % were nearly equal with no significant difference between them. In all advancedORGs conditions the average landing rate was higher than in the ORG 0 reference mode, nomatter if any, or how many class A aircraft were involved. Second, the standard deviations of theeight teams’ landing rates, as they are indicated by the deviation bars, were highest in ORG 0. Thestandard deviations that characterise the variability between the teams were smaller in alladvanced ORGs.

PD/2 Final Report Results
DOC 97-70-13 Version 1.2 45February 1998
7.2.2 Flight Time
The time that inbound aircraft took for their way through the simulation illustrated the closerelationship with the data for landing rates: shorter flight times coincided with higher landing rates.Figure 12 shows for the pooled data over all arrival routes that the average flight time observedunder reference conditions (25.2 minutes in ORG 0) decreased to 24.4 minutes in ORG 1 wherethe PD/2 PATs and GHMI support was introduced. The difference, which is equivalent to aboutthree per cent of flight time, was statistically significant (p < .05), whereas no such significantdifference of overall flight time was found when ORG 1 and ORG 2 were compared. Again, thevariability between teams was considerably smaller with the PD/2 advanced system.
Under the same traffic demand, the flight time in the approach sector could be reducedsignificantly when the PD/2 advanced tools and GHMI support was used. Even more important isthe reduction in the variability, which means that arrival times became more predictable (as shownfurther in sections 7.2.3 and 7.2.4)
ORG 2/ 70%ORG 2/ 30%ORG 1ORG 0
mea
n fli
ght t
ime
per a
/c [m
in]
27
26
25
24
Figure 12 Mean Flight Time per aircraft in high traffic scenarios, all arrivalroutes combined
7.2.3 Inbound Delays
Inbound delays, as measured by differences of preferred against actually observed time over theApproach Gate, are depicted in Figure 13. The pattern of results looks very much like that of flighttime (Figure 13), thus indicating a benefit at first glance, i.e. a reduction of delays from reference(ORG 0) down to a lower level under the advanced ORGs, and again showing no further benefitfrom introducing class A aircraft. But, other than for flight time, in the pooled data over all arrivalroutes no significance was found for the ORG 0/ORG 1 difference of about 35 seconds,presumably due to the high variability among the eight teams which could be observed againparticularly under ORG 0. An important observation is that again variability was considerablysmaller in the advanced ORGs.

Results PD/2 Final report
46 Version 1.2 DOC 97-70-13February 1998
ORG 2/ 70%ORG 2/ 30%ORG 1ORG 0
mea
n in
boun
d de
lay
[sec
]150
100
50
0
-50
Figure 13 Mean Inbound Delay per aircraft in high traffic scenarios, all arrivalroutes combined
7.2.4 Precision of Delivery
Since flight time and inbound delays reported so far are, in principle, common products of both theplanning tools’ performance and the controllers’ performance, precision of delivery is consideredas a useful indicator of how precisely the tools-generated plans were actually implemented.
Precision of delivery is calculated from the observed differences between actual time over Gateand planned time over Gate. Note that the planned time over Gate may already include a delaybecause the planning algorithm accounts for the overall traffic situation either by using merelyarrival time estimates in ORG 0, or by using conflict-free trajectories in ORG 1 and ORG 2.
As aircraft can be delivered earlier or later than exactly at planned time, positive and negativedeviations might cancel each other when averaged. To avoid this, precision of delivery wasmeasured by the absolute magnitude of the time difference between planned and actual Gateoverflight of an aircraft (Equation 1).
(1)n
meanabsolutett pa∑ −
=
where ta = an aircraft’s actual time over Gate,
tp= an aircraft’s planned time over Gate,
n = number of aircraft.
Precision of delivery is shown in Figure 14. Again, the introduction of PD/2 PATs and GHMI had asignificant effect. The average precision of 91 seconds measured in ORG 0 improved to 21seconds in ORG 1. This was significant beyond p ≤ .05. The enormously high deviations from theplanned times as they were registered in ORG 0 resulted from frequent changes of arrivalsequences. As there were no control advisories available in the reference system (ORG 0) theentirely manual guidance with it’s inherent larger variability often resulted in ad-hoc decisions torearrange initially planned sequences later on.
For the effect of having class A aircraft in the sample, Figure 14 shows the improvement inprecision of delivery with increasing proportions of class A aircraft. The ORG 1 mean of 21seconds decreased to 15 seconds in ORG 2/ 30 % and to 11 seconds in ORG 2/ 70 %. This effectwas also statistically significant at the required level of p ≤ .05 .

PD/2 Final Report Results
DOC 97-70-13 Version 1.2 47February 1998
ORG 2/ 70%ORG 2/ 30%ORG 1ORG 0
abso
lute
mea
n pr
ecis
ion
of d
eliv
ery
[sec
]
200
150
100
50
0
Figure 14 Mean precision of delivery in high traffic scenarios, all arrival routescombined
Figure 15 provides more detailed information. For the interval of +/- 60 seconds deviation fromplanned time the distributions of precision of delivery are shown for the different ORGs. Each barrepresents the interval between the tick marks (e.g. the bar above 0 corresponds to the intervalfrom –5 to +5 sec).
Note that, by definition of class A and class B, all aircraft exceeding a +/- 15 seconds precision ofdelivery interval must have been guided manually.
The two graphs on top of Figure 15 illustrate the transition from ORG 0 to ORG 1. With thereference (ORG 0) type of arrival sequence planning which provided no further information to thecontroller about which control strategy to select for implementing the plan, a flat distribution over awide range of plan deviations emerged. With support of trajectory-based PATs planning and thePD/2 GHMI in ORG 1 more than 10 % of the aircraft were delivered exactly on time.
The two bottom graphs display what happened when 4D FMS/datalink aircraft entered the game.Larger portions of aircraft were delivered perfectly on time. In ORG 2/ 30 % more than 35 percent of all aircraft in the traffic sample were delivered on time. In ORG 2/ 70 % about 62 per centof all aircraft were delivered on time.
Broadening the view onto an interval of no more than ten seconds early or late delivery at theGate (which of course includes delivery exactly on time) shows that
- 16% of all aircraft were delivered within +/- 10 seconds in ORG 0,
- 60% of all aircraft were delivered within +/- 10 seconds in ORG 1,
- 71% of all aircraft were delivered within +/- 10 seconds in ORG 2/30%,
- 79% of all aircraft were delivered within +/- 10 seconds in ORG 2/70%.

Results PD/2 Final report
48 Version 1.2 DOC 97-70-13February 1998
ORG 0
0
10
20
30
40
50
60
70
80
-60
-45
-30
-15 0 15 30 45 60
difference in sec.
perc
enta
ge o
f a/c
ORG 1
0
10
20
30
40
50
60
70
80
-60
-45
-30
-15 0 15 30 45 60
difference in sec.
perc
enta
ge o
f a/c
ORG 2/ 30%
0
10
20
30
40
50
60
70
80
-60
-45
-30
-15 0 15 30 45 60
difference in sec.
perc
enta
ge o
f a/c
ORG 2/70%
0
10
20
30
40
50
60
70
80
-60
-50
-40
-30
-20
-10 0 10 20 30 40 50 60
difference in sec.
perc
enta
ge o
f a/c
Figure 15 Distributions of precision of delivery in high traffic scenarios

PD/2 Final Report Results
DOC 97-70-13 Version 1.2 49February 1998
7.2.5 Separation
Separation over the Approach Gate was taken as an indicator of whether potential benefits interms of reduced flight time or reduced delays were possibly achieved at the expense ofseparations less than published wake vortex separation standards. The average numbers ofseparations less than standard are displayed in Figure 16.
ORG 2/ 70%ORG 2/ 30%ORG 1ORG 0
Mea
n #
of s
epar
atio
ns <
wak
e vo
rtex
cat.
per h 12
10
8
6
4
2
0
Figure 16 Mean number of separations smaller than wake vortex categoriesin high traffic scenarios
A significant (p < .05) decrease of the number of separations less than standard was found forORG 1, as compared to ORG 0. There was a trend of further decrease in ORG 2 but this was notstatistically significant.
However, it can be excluded that positive effects of the PD/2 concept on traffic throughput wereachieved at the expense of separation. Quite the reverse appears to be true. With the advancedsystem there was even less need to separate aircraft closer than the published standards.
7.2.6 Summary Discussion of Traffic Throughput/Quality of Service Results
Table 5 compiles the results of the statistical tests of the parameters analysed under both, highand medium traffic load. The '=' indicates that there was no statistically significant difference of ananalysed parameter between compared ORGs, whereas the '+' indicates a significant positiveeffect.
medium traffic high traffic
From ORG 0to ORG 1
From ORG 1to ORG 2
From ORG 0to ORG 1
From ORG 1to ORG 2
Number of landings = = + =
flight time = = + =
Inbound delays = = = =
Precision of delivery + + + +Separation = = + =
Variability betweenteams
= = + =
Table 5 Summary of results: effects on traffic throughput/quality of service

Results PD/2 Final report
50 Version 1.2 DOC 97-70-13February 1998
This table summarises the data in total whereas Figure 17 exemplifies typical patterns of trafficguidance that were observed in singular simulation runs. The radar plot examples given in Figure17 illustrate horizontal flight paths of aircraft in all ORGs of PD/2. They were taken from onecontroller team’s measured runs under high traffic load. They are displayed here to visualisedirectly some of the effects that are discussed below.
The reference, or baseline, ORG 0 system represented the functionality of today’s ATC systemwith paper strips and conventional arrival sequence planning. Transition to ORG 1 introduced as akey element ground-based 4D trajectory planning of inbound traffic. The system supported thecontroller by generating 4D advisories and by providing a stripless GHMI for interacting with thesystem.
As a general observation found from nearly all measured parameters, the highest variance was inthe data of ORG 0, indicating that work styles differed largely between controller teams. This wasnot a surprise when the type of ORG 0 planning support is considered. The proposed arrivalsequences were displayed, but no information on particular tactical control measures how toimplement the planned sequences was provided. In ORG 1, with control advisories generated thatapplied to individual trajectories, the variance between the teams’ data was generally smaller.Work styles and performances of the different controller teams became more homogeneous, andthus more predictable.
Apart from this, various gains of the PD/2 concept were found when compared to the ORG 0baseline. Significant benefits for the number of landing per hour, average flight time of aircraft,precision of delivery, and separation were reported. It should be noted that the positive effectswere mainly present under high traffic load. Whereas the data obtained under medium traffic loadsuggested that the controllers could make use of their basic skills in such a way that an equivalent,or sometimes even slightly more efficient guidance of inbound traffic resulted than withobservance of the system-generated advisories in ORG 1.
Under the higher traffic load which was in the PD/2 simulations equivalent to increasing the trafficvolume by about one third, the ORG 0 type planning reached its limits, and advantage could betaken from introducing the PATs and GHMI in ORG 1. The radar plots Figure 17 include a typicalexample for the transition from ORG 0 to ORG 1 (It is worth mentioning that the ORG 1 simulationrun in this particular week was made at the beginning, the ORG 0 run at the end of the week;therefore any learning or practising effects in favour of ORG 1 can be excluded). Nearly alltraffic throughput and quality of service parameters were better than in ORG 0. Theimprovements were statistically significant, only the observed reduction of inbound delay failed toreach the five per cent significance level.
In summary, it can be concluded that a benefit of the introduction of PATs and GHMI in ORG 1could be observed such that particularly higher traffic demand could be handled more smoothlyand more efficiently. That efficiency gain was achieved without any detrimental effect onseparation. There was even a significant positive effect on separation by the ORG 1 introductionof tools.
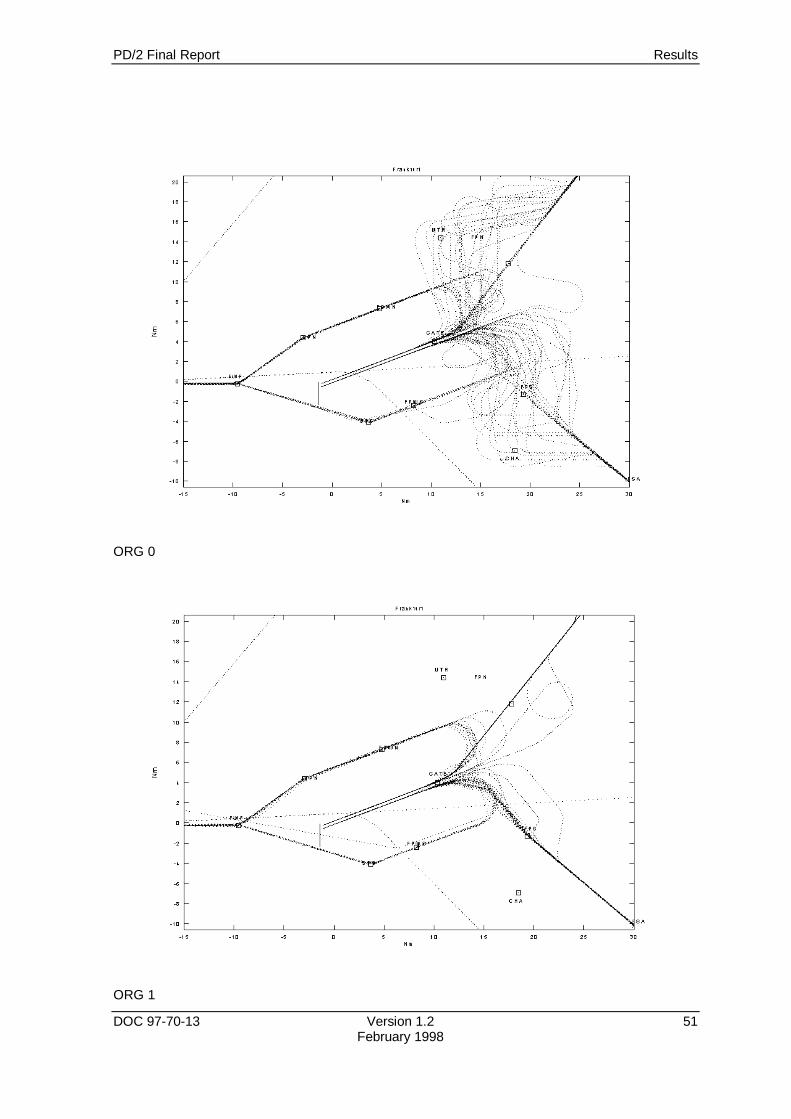
PD/2 Final Report Results
DOC 97-70-13 Version 1.2 51February 1998
ORG 0
ORG 1

Results PD/2 Final report
52 Version 1.2 DOC 97-70-13February 1998
ORG 2/ 30%
ORG 2/ 70%
Figure 17 Examples of radar plots of one controller team in high traffic scenarios

PD/2 Final Report Results
DOC 97-70-13 Version 1.2 53February 1998
The transition from ORG 1 to ORG 2, with its increasing proportions of class A aircraft, did notchange anything about the functionality of the PD/2 system. The basic principles of tools andGHMI support remained unchanged, the difference was in the use of mixed class A and non-classA traffic in ORG 2. While all traffic in ORG 1 was handled as non-class A, in ORG 2 someportions of aircraft in the traffic sample were supposed to make use of on-board 4D FMS/datalinkequipment and thus to proceed automatically along their trajectories which had been establishedupon entry into simulation. The controllers’ only interaction with that aircraft was to assumecontrol, establish initial radio contact, and transfer them later to the next sector, or the tower.Without any control advisories the aircraft followed their plan and arrived at the Gate exactly attheir scheduled time, by definition in the simulation. In case of a tactical intervention of acontroller, such an aircraft lost its class A status.
The main question was, did throughput and quality of service in the ETMA, for the traffic sampleas a whole, benefit from having class A aircraft in that traffic sample? The simulation resultsshowed significant gains in precision of delivery of the aircraft at the Approach Gate. All otherimprovements over the baseline system were achieved by the controllers using the advanced toolsin the PD/2 system, in both cases, regardless of how many 4D FMS/datalink aircraft wereinvolved.
This needs some further explanation. By nature of the PD/2 trials the 'optimal' traffic guidance willtheoretically be reached when all aircraft (class A and class B) follow their trajectories in a perfectmanner. Then the actual mix of class A and class B aircraft would not matter at all; no furtherbenefit could be expected since all aircraft adhere strictly to their 4D trajectories. The simulationdata suggest that already under ORG 1, with trajectory-based guidance entirely implemented viacontrollers' R/T advisories a result close to that optimum could be achieved. Of course, thisoptimum is very specific for the trajectories actually used in PD/2, and it does not tell anythingabout how optimal those trajectories were. Without any doubt there is still room for furtherimprovement of trajectories, for example by using parallel routes and shortcuts, by calculatinggenerally for higher airspeeds, or by increasing the inbound traffic flow rate through reducingminimum separation. All these measures would lead towards a capacity gain. However, it must beemphasised that those capacity issues were not within the scope of PD/2.
Moreover, restricting the tools to work only for a fixed route structure as in PD/2 makes theproblem-solving task more difficult and often leads to sub-optimal solutions. This is because toolsworking on the basis of fixed routes will follow the standing agreements used by the humans in thecontrol-loop. On the other hand, although advanced tools will probably find easier and moreoptimal solutions in a free route environment, the solutions may be less easy to understand by thehuman controllers in the loop.
Another question of utmost relevance to aircraft operators is whether some specific benefit couldbe expected for class A aircraft from using their on-board 4D FMS/datalink capabilities. Theanswer from the PD/2 simulations to that question is clear but perhaps too simplistic. Of coursethere is a benefit, the precision of delivery in Figure 15 has illustrated this impressively. However,by nature of the simulations, for class A aircraft which frequently were downgraded from class Athere was no re-negotiation. The lack of system functionality to allow recovery of the class Astatus certainly underestimates the potential benefit of 4D FMS/datalink equipment. Therefore,more research is necessary to fully address this question and to quantify that benefit exactly.

Results PD/2 Final report
54 Version 1.2 DOC 97-70-13February 1998
7.3 WORKLOAD
Several objective and subjective indicators for the workload of controllers were analysed. Allthese measures are closely related to each other, which is confirmed by considerable high positiveand throughout significant correlation among them. The lower, still significant, correlation wasfound among the subjective and the objective workload indicators. This is an indication thatcertain elements immanent to the simulation additionally contributed to workload than the merecontrolling air traffic by transferring of ATC commands. It is assumed that the impact of theintroduction of a new ATC concept with new procedures and tools, with a certain degree ofautomation is twofold. Firstly, every new system has workload associated with it that was notpresent before due to different tasks to be performed and the lack of routine with using the newtools. Secondly, there is increased mental demand through monitoring what the system is doing.These effects are nearly always present as long as controllers are not totally familiar with a newsystem. Thus, any potential of a beneficial effect on workload when introducing a new system iscounteracted by the costs of novelty. This has to be considered when interpreting the summary ofresults in Table 6.
All three objective workload indicators (number of ATC instructions issued per minute, frequencyof radiotelephony (R/T) contacts per hour, and percentage of simulation time spent for R/T)correlated highly with each other and showed a very uniform pattern of results. Therefore, thesummary of results presented in Table 6 applies to all three objective workload indicators, whereassubjective indicators are presented separately. For more details on each of these measures referto Annex D. This table is a compilation of the statistical tests conducted on the various workloadindicators analysed under high and medium traffic load. Again the '=' indicates that there was nostatistically significant difference between compared ORGs, whereas the 'ì' and 'î' symbolsindicate significant increases and decreases of workload, respectively. The brackets indicate thatthe results missed the significance criterion (p≤ 0.05), but a trend was apparent (p≤ 0.10).
medium traffic high traffic
From ORG 0to ORG 1
From ORG 1to ORG 2
From ORG 0to ORG 1
From ORG 1to ORG 2
Objective indicatorsPickup î î î îFeeder = î = îACC ì î ì î
SWATPickup = = (î) =Feeder = î = =ACC = = = (î)
TLXPickup = = = (î)Feeder ì (î) = îACC ì = = =
Table 6 Summary of results: effects on tactical controller workload

PD/2 Final Report Results
DOC 97-70-13 Version 1.2 55February 1998
7.3.1 Workload Comparison Between ORG 0 and ORG 1
ORG 0 corresponds to a typical strip-oriented ATC system with limited planning aids such as thosewhich are actively used in arrival management today (e.g. COMPAS). Compared to this baseline,ORG 1 is a move towards a stripless system with more advanced computer assisted planningtools (PATs) and associated new ATC procedures. Furthermore, ORG1 includes the introductionof a novel computerised human-machine interface with the mouse now being the main interactiondevice.
In general, the introduction of the PATs alone had tremendous impact on the task allocation andresponsibilities at the different working positions. This has to be considered when interpreting thefindings of the various workload indicators. In the baseline system the planning controllers wereactively supporting the pickup position next to them by pre-sorting the flight strips according to thedisplayed Arrival Manager sequence, and occasionally by helping with strategic advice. Underspecial consideration of the limitations in the simulations, the planning controllers literally lost theirtask when the PATs entered the field, especially in medium traffic scenarios. This becameapparent in the pilot phases and was finally the reason to create a job-enrichment for the plannerposition by assigning to him additional responsibility for the workload estimates (SWAT, TLX) ofthe tactical approach team. Most importantly, the loss of the planners' tasks caused a shift in thetasks of the other TMA controllers, mainly that of the pickup controller and to a lesser extent of thefeeder position. The pickup took on the planner's tasks and also became responsible for a morestrategic control in planning and sequencing inbound traffic.
Therefore, the results of the workload measures were not uniform and were strongly dependent onthe controller working positions. When comparing the different objective workload measures, thepickup controllers were the ones who could profit most from the introduction of the advanced tools.In general, it was at this working position that the highest objective workload of all controllers wasfound in the baseline condition. Under high traffic load all objective measures were considerablyand significantly reduced when moving from ORG 0 to ORG 1. The conclusion is that the PATsdid support the pickup controllers in several ways. The pickup controllers could accomplish theirtask of establishing the landing sequence much better, were able to cope with additional dutiesassumed from the planner and had much less work keeping separation and flow of inbound traffic.
Furthermore, the PATs caused a positive change in work-style or influence of skill at this controllerposition. In ORG 0 the pickup controllers' expertise had great impact on the quality of their work.This was supported by a large variability of number of ATC instructions and of R/T frequencybetween the eight different teams' scores. In fact the highest number of ATC instructions underORG 1 was about the same as was the lowest number under ORG 0. It is evident that in theadvanced ORGs this variability was greatly reduced through the support of the tools.
The positive effect of an advanced ORG 1 for the pickup controllers was partly supported bysubjective workload measures. Only under high traffic the SWAT ratings tended to show areduction from ORG 0 to ORG 1, whereas for TLX scores no effect was found (compare Figure 18and Figure 19).

Results PD/2 Final report
56 Version 1.2 DOC 97-70-13February 1998
Mea
n S
WA
T ra
ting
ORG 0
ORG 1
ORG 2/ 30%
ORG 2/ 70%ACCAPP TEAMFEEDERPICKUP
40
30
20
10
0
Figure 18 Mean SWAT workload ratings in high traffic scenarios.
Mea
n TL
X s
core
ORG 0
ORG 1
ORG 2/ 30%
ORG 2/ 70%ACCAPP TEAMFEEDERPICKUP
70
60
50
40
30
20
10
0
Figure 19 Mean TLX workload ratings in high traffic scenarios.The planner assessed the workload of the APP team.
At the feeder position neither subjective nor objective workload measures revealed a differencebetween ORG 0 and ORG 1. Observations suggest that the flight-time of inbound a/c was simplytoo short to benefit from the advanced tools. In the simulated airspace of PD/2, aircraft werehanded over to him when they were on downwind or on base leg. He was then responsible forturning them onto finals, issuing an ILS clearance and reducing their speed for the final staggeringbetween aircraft on right and left runways. This gave him about five minutes in control, comparedto the approximately 10 minutes of controlling done before by pickup controllers. Hence, theperformance of the pickup had a strong influence on the feeder's work. If inbound traffic wasalready pre-sequenced in accordance with the Arrival Manager, well staggered and at anconvenient altitude when handed over to the feeder, there was a lower load put on him.Therefore, he had less need for additional computerised tool support.
On the other hand, in depth analysis on type of control commands revealed that the feedercontrollers did indeed benefit through introduction of the PATs. Their main task was to guideaircraft to the extended centre-line and to give ILS clearance, and therefore the feeder controllerswere using mostly heading commands. The PATs supported this task well as this type ofcommand was significantly reduced but at the expense of (non significantly) increasing thenumber of altitude commands, and thus resulting in no overall effect.

PD/2 Final Report Results
DOC 97-70-13 Version 1.2 57February 1998
The workload of the ACC controllers was overall the lowest of all controllers, irrespective whetherobjective or subjective measures were concerned. Furthermore there were no obvious differencesin the pattern of results between medium and high traffic scenarios. The statistically significantincrease of some objective workload indicators, i.e. number of ATC instructions and R/Tfrequency, is therefore considered not to be operationally of great consequence, but to remainwithin acceptable limits.
The increasing number of issued ATC instructions, and a rising R/T frequency at the ACCcontroller position when moving from ORG 0 to ORG 1 reflect the fact that the quality of the toolswas in some respects sub-optimal. They were not specifically designed for the needs of en-routesector control as in PD/1. Thus, the provided tools did not fit with the usual work style of the ACCcontrollers or the requirements of airspace and route structure. From observations during the trialsand a closer look at the raw data it became apparent that in ORG 0 sector controllers had atendency to let aircraft fly without intervention, if possible, until close to metering fix RUD, i.e. justbefore entering the TMA. Only then did they issue descent and speed reduction commands.Contrary to that procedure, controllers reported in debriefings that when they were supported bythe PATs in the advanced ORGs a number of advisories generated were unnecessary or evenunrealistic, e.g. multiple descent and speed advisories instead of one continuous descent or asingle speed reduction. Overall these advisories caused more commands to be issued andconsequently increased R/T activity. This burden was confirmed in a tendency to highersubjective workload ratings in ORG 1; though only one of these results became statisticallysignificant (TLX, medium traffic).
7.3.2 Workload Comparison Between ORG 1, ORG 2/ 30%, and ORG 2/ 70%
The change from ORG 1 to ORG 2 corresponds to the introduction of different proportions of 4DFMS and datalink equipped aircraft. These aircraft offered full utilisation of the advanced toolsand they were able to follow an optimal trajectory without controller intervention. The effect ofreleasing the controllers from the duty of transferring ATC instructions showed significantreductions in all objective workload measures at all controller working positions irrespective oftraffic volume. The only exception was for the R/T frequency of the pickup controller in mediumtraffic, which was only close to significance. Therefore, it can be concluded that R/T workloadassociated with traffic guidance decreased strongly with increasing proportions of 4D FMS/datalinkequipped aircraft.
For the subjective workload ratings this finding is less distinctive. Even though the SWAT ratingsshowed a clear tendency of reducing with increasing proportions of class A aircraft, not all of thestatistics supported the significant results of the objective indicators. When comparing TLX scoresa virtual reduction was found if 70% class A aircraft were involved but the overall effect failed toprove significant. Only if single comparisons were conducted between ORG 1 and ORG 2/ 70%,representing the minimum and maximum proportion of class A traffic in PD/2, significantdifferences were found at some controller positions.
What might be the reasons for such a distinction between the objective and subjective workloadparameters? The lower correlation among objective and subjective workload estimates indicatethat in addition to the mere traffic guidance via R/T, other factors contributed to perceivedworkload. Subjective workload estimates like SWAT and TLX are indicators for the overall load acontroller experiences, whereas objective measures represent only partial aspects of workload.Apart from the amount of ATC instructions the R/T load, the associated cognitive load forcontinuously monitoring the traffic and for selecting appropriate instructions is hidden to objectiverecordings. If correlation among objective and subjective workload estimates are calculated an

Results PD/2 Final report
58 Version 1.2 DOC 97-70-13February 1998
implicit assumption is made that both are proportional to each other. This need not always be thecase, hence the correlation among subjective and objective workload measures were lower thanamong equivalent workload estimates.
Further indications arose through comments during debriefings. Approach controllers reportedabout a higher need for co-ordination, especially in tight approach sequences, when mixtures ofclass A and class B aircraft were involved in the simulation. Controllers were instructed to refrain,if possible, from interacting with class A aircraft in order to avoid a downgrading of the aircraft’status, because only as class A would they fly absolutely precisely in space and time. When therewere only 30% class A traffic simulated, these 'automatic' aircraft were the minority in thesimulations, but nevertheless, they affected the manually guided aircraft majority. For instance, ifthe arrival manager tool scheduled a class B aircraft between two of class A, controllers wereforced to guide this class B in an extremely precise manner in order to avoid separationinfringements. This was an exacting task because, as in reality, controllers could not anticipatethe precise timing of the class B 'pilot's responses to R/T commands. When 70% datalinkedaircraft were involved the relationship between rule and exception was reversed, and it thenseemed to be a less demanding task to guide the fewer class B aircraft between the class Amajority. Still controllers preferred "...if class A aircraft are involved a 100% would be best..." toovercome these difficulties of traffic mixture. But this issue raised discussion about operationalaspects more deeply addressed in section 7.4.3.
7.3.3 Planner Controllers' Assessment of Workload of Tactical ApproachControllers
Every controller except the planner had to assess his/her own workload in every run using twosubjective assessment methods (NASA-TLX and SWAT). For the planner a different method wasforeseen. The reason was that during pilot phase of PD/2 it had become apparent that within thelimitations of the simulation the introduction of the PD/2 advanced system caused a shift in taskresponsibilities of the approach controllers (planner, pickup, and feeder). This shift was such thatthe planner controllers literally lost their tasks. Therefore, no differentiating results could beexpected for the planner controllers' workload ratings during the main phase (the statistical term is'floor effect'). For this reason it was decided to let the planner assess not his own workload but theworkload of the two tactical approach controllers as a joint team score.
The planners assessment of the APP team's workload yielded only two significant results. Thesewere comparison of SWAT ratings between ORG 0 and ORG 1 in high traffic scenarios andcomparison of SWAT ratings between ORG 1 and ORGs 2 in medium traffic scenarios. aninformation gain was only achieved with the first of these results. That means the significant resultof the planners' APP team assessment has no equivalent result at pickup and feeder positions.This was mainly due to somewhat higher ratings of the planner under ORG 0 than those of pickupand feeder which resulted in a clearer decrease when moving to ORG 1. The generally higherSWAT ratings of the planner (compare Figure 18) mirrors what several observers noted during thetrials. Some pickup and feeder controllers gave rather lower SWAT ratings than could beexpected by the commensurate amount of traffic. This is of course a highly subjective impressionof the observers but it shows a tendency that some approach controllers possibly rated theirworkload lower due to an effect of social desirability or to prove their capability. For these cases,to overcome the dangers of subjectively bias, it proved to be useful to have workload ratings froma less personally involved observer with the same experience as the tactical controllers.
To statistically check for concurrence of the planners' workload ratings of the APP team with thoseof the approach controllers themselves correlation (Spearman's ρ) among the workload ratings of

PD/2 Final Report Results
DOC 97-70-13 Version 1.2 59February 1998
the different controller positions were computed. Most correlation proved to be significant, thoughhigher correlation were uncovered for the SWAT ratings both under high and medium trafficscenarios than within TLX scores. Especially low correlation was found for TLX scores undermedium traffic volume (ρ ≤ .21), the only non-significant correlation. The reason for bettercorrespondence in SWAT ratings between planner and tactical approach than in TLX scores wasthat the instantaneous assessments of workload were based on much more information directlyavailable to the planner, like the radar, traffic flow, amount of radiotelephony, voice (pitch andspeed). TLX on the other hand has sub-scales of factors for which the answers of the tacticalcontrollers were not as reasonable and sensible as the planner's. These are the factors not relatedto the actual task but rather to the subject, like 'Own Performance', 'Effort', and 'Frustration'.
7.4 ACCEPTANCE
After each completion of an ORG, controllers were presented questionnaires to collect theirjudgements on the three ORGs individually. At the end of trials weeks a final questionnaire waspresented to collect the overall, non ORGs-specific issues. The questionnaires consisted of morethan 70 individual questions. The results are summarised below, covering the different sections ofthe questionnaires individually. For further in depth analysis refer to Annex E.
7.4.1 Simulation Environment and Training
In general the work environment (lighting, seating etc.) was not a matter of major complaints.Responding to the SWAT was accepted by most of the controllers.
All the training issues addressed in the final questionnaire achieved significant positive controllerresponses. The training which the participants received in the week before their trials was nearlyunanimously accepted as being sufficient to get familiar with the PD/2 airspace and routestructure, with the HMI tools and functions, as well as with the controller roles and tasks.
Traffic samples and the way in which feed sectors were simulated were significantly well accepted.When controllers judged their interaction with the pseudo pilots, they significantly agreed in sayingthe pseudo pilots were adequately trained. Nevertheless, adverse effects caused by thecontrollers themselves were not clearly excluded, particularly during traffic peaks when controllersput a high R/T load on the pilots.
Distractions/disturbances from other activities in the control room were not a matter of concern,the responses were significantly positive. Obviously, this includes the presence of observers, ascontrollers clearly negated that these had any influence on their work.
The results altogether, and the many positive responses, support the conclusion that thesimulation environment and the training provided in PD/2 had been accepted sufficiently well bythe participating controllers and were highly approved as being realistic and valid. This is also animportant factor for credibility of the simulation results in general.
7.4.2 HMI: Displays, Interaction
This section deals with aspects of interacting with the PD/2 system, display characteristics andsome general HMI aspects, which apply mainly for the PD/2 advanced ORGs.
The mouse was significantly accepted as a suitable device for interacting with radar labels andpop-up menus, but sometimes an overloaded simulation system caused problems and thesubsequent slow response times sometimes made it difficult to select specific elements.

Results PD/2 Final report
60 Version 1.2 DOC 97-70-13February 1998
Controllers generally agreed with the screen layout and size, as well with the readability of text,and there were no problems with the abbreviations used. Also, the concept of colour coding of thelabels, for indication of the control status, was regarded as being very easily understood anduseful. Together with the indication of the actual mode of guidance (class A, class B, or manuallyguided) which was given by the aircraft symbol, these were significantly well accepted by thecontrollers.
The options of changing the displayed length of the trajectory prediction and changing the trackhistory which enabled controllers to have a look on the past and the future of any aircraft’s flightpath, were highly appreciated.
7.4.3 Operational Aspects: Traffic Handling, Procedures
Several items of the questionnaires addressed particular aspects of the controllers' practical work,and to get insight into their views of the operational concept as a whole.
The proportion of controllers saying that data link reduced their workload was highly significant.This is in parallel to the SWAT and NASA-TLX results where workload estimates were found todecrease - at least in tendency - at higher percentages of class A aircraft. Similarly, and thusappearing as a logical consequence of this, a significant proportion of controllers indicated theywould prefer all aircraft to be 4D FMS equipped. However, in the debriefing sessions controllersfrequently raised some important issues beyond mere workload. Assuming a hundred percentclass A aircraft scenario, many controllers could see themselves acting in a monitoring role only,sometimes characterised as "underloaded" or even "boring", and with detrimental effects on theirjob satisfaction. Moreover, retention of basic control skills was addressed as a problem in thiscontext that might even become a safety issue in case of a system breakdown or unforeseenemergency events.
In general, there was significant acceptance by controllers that 4D FMS equipped aircraft followingtheir previously cleared trajectory, should do so without having further clearances transmitted tothem. Controllers apparently agreed with this because it reduces much of the communicationworkload. Additional comments indicated that the controllers’ readiness to accept this procedure isincreased with the ease of access to trajectory information through the GHMI.
Differentiated per ORG, the controllers were asked about safe handling of traffic. In all threeorganisations the controllers agreed significantly in saying that the traffic could be handled safely,and they disagreed with suggestions that it was difficult to handle the traffic by using the toolsprovided. Closely related is the question about keeping aircraft well separated. Controllerresponses were significantly positive under ORG 0 and ORG 1, but only in tendency positiveunder ORG 2. Debriefing sessions and written comments revealed two reasons for somecontrollers’ perception that it was more difficult to keep separation in a mixture of class A andclass B aircraft as it was given in ORG 2 only. A reason quoted by some approach (Pickup andFeeder) controllers, was that in a tight approach sequence, a class B aircraft planned between twoclass A aircraft had to be guided in an extremely precise manner between the "automatic" class Aaircraft to avoid separation infringements. The other reason was that particularly ACC tacticalcontrollers sometimes observed in their view unrealistic speed behaviour of inbound class Aaircraft, such that they felt "... some trajectories were dubious in the way that they kept aircraftapart ..." and reported that "... several times I had to intervene in order to keep separation ...".They claimed further that this kind of difficulties could be alleviated by having more flexibility inrouting the trajectories, i.e. by using more than one track for all west inbound traffic up to the RUDfix.

PD/2 Final Report Results
DOC 97-70-13 Version 1.2 61February 1998
Nevertheless, significant positive responses were given for all ORGs, regarding "maintaining thepicture", and that the controllers always felt in control of the system. The system’s support forconflict detection and conflict resolution was rated much less favourably, the least favourable forORG 0, because "... there wasn’t a tool ..." to provide conflict resolution. Acceptance of theadvanced ORG’s support was considerably better. Although the majority of controllers agreed withthe support given to detect conflicts they disagreed with the support given to solve these conflicts.Obviously, a better acceptance was prevented by some shortcomings of the CRD that will bediscussed in the tools and functions section below.
Did the system also allow the controllers to work according to their personal work styles? ORG 0received significant approval, as it was closest to the today’s operational procedures andconventional work style. ORG 1 was approved in tendency only. Some controller commentsindicated that they missed the ability to choose between laterally separated trajectories. Overall,ORG 2 was rated as being relatively least in line with controllers' personal work styles. However,there was nearly a complete balance between positive and negative responses. Again presumablybecause of the mixture of class A and class B aircraft in ORG 2, where controllers were compelledto handle class B a/c to conform to the prerequisites of class A traffic. Another reason asmentioned above, was the controllers' concern about automation leaving them in a monitoring roleand losing their skills.
However, despite their work-style preferences, in total controllers clearly and significantlyestimated that they could have handled even more traffic under each ORG. The ACC controllersthought they could do this best under ORG 0, whereas approach (pickup/feeder) controllersestimated more clearly that they could do this under the advanced ORGs.
An item related to the support of controllers was the efficacy of the advisories. Controllers wereasked whether the advisories (for class B aircraft) generated by the system were alwaysappropriate. Although a small majority of approach controllers agreed that they were alwaysappropriate, a similar small majority of ACC controllers disagreed. However, none of theresponses was significant. There was a lot of discussion on this issue in the debriefings which canbe summarised as follows: a major area of discussion was that controllers frequently encounteredapparent shortcomings of trajectory generation, and thus of the advisories to implement thetrajectories. Most of these problems could be overcome by introducing one or more additionaltrajectory updates (see Section 3.5 about the limitations of PD/2). More generally, this point wasalso about controllers’ perception of what was appropriate. Many controllers felt, even when theyadmitted that all of the current system’s trajectories and advisories were consistent, conflict-free,and always appropriate, that they would sometimes have done the job in a different way., Forexample not strictly following the Standard Arrival Routes. The feeling was summed up by thequote "...[it is] as if the system and the human are like two controllers working on the same area.You would never do this in reality ...". Despite this discussion, controllers reported significantly andclearly that there were no problems with the PD/2 concept of how and when to interact with thedifferent classes of aircraft.
Many issues in this section were raised in discussions during debriefings because the controllersbecame aware of the limitations of the PD/2 system. They were regarded as major items offurther investigation to improve future developments of ATC concepts and associated tool support.

Results PD/2 Final report
62 Version 1.2 DOC 97-70-13February 1998
7.4.4 Individual Tools and Functions
In order to assess controller views on the tools and functions that were provided to them by thePD/2 system, a set of seven questionnaire items was used to evaluate the tools. The toolsevaluated were: the Arrival Management Display (AMD) and the Conflict Risk Display (CRD),which were available to both ACC and Approach controllers, as well as the Vertical View Display(VVD) and the Sector Inbound List (SIL), which were specifically dedicated to the ACC position.
The controller responses that were obtained for the AMD reflected different views about thebenefit of this tool, dependent on the controller working positions. Approach controllersappreciated the AMD far more than their ACC colleagues did. The majority of approach tacticaland planning controllers reported that they used the AMD frequently, it was relevant for their work,they found it helpful for avoiding conflicts, it reduced their workload, and also that the kind ofinteraction with the AMD was suitable to their personal work styles. In particular, they appreciatedthe capability to have the same interaction with aircraft labels on the AMD as on the PVD.Opposite tendencies for all the above matters were found in the ACC controller judgements. Thisunderlines the differing relevance of the AMD for different positions, once forcefully put by an ACCcontroller as "... it was good for APP controllers but not helpful for ACC ...".
Overall, there were no significant positive responses given at all on the Conflict Risk Display(CRD). As mentioned earlier, this indicated some shortcomings of the CRD, which wereextensively commented by the controllers. In total, controller approval was significantly negativeregarding frequent use of the CRD and its relevance for controller work. The automatic pop-up ofthe CRD on all PVDs at the same time was severely criticised, mainly because controllers oftenfound the CRD displayed conflicts were not relevant in their sector. It was observed during thesimulations that controllers frequently closed the CRD window immediately after it was displayed.Presumably, there would have been more acceptance of the CRD if, as controllers suggested, ithad been modified so that it only appeared on the display of the sector concerned. Theassessment of the CRD’s helpfulness for avoiding conflicts showed no clear indication of approvalor disapproval. The criticism here was that "... it is useful to detect the conflict but not to solveit..". Tactical controllers would have appreciated some advisories to solve conflicts. No clearindications were found in their judgements about the CRD’s usefulness for reducing their workload.
Only ACC controllers were asked to assess the Vertical View Display (VVD) and the SectorInbound List (SIL). They commented that in principle they appreciated the VVD as an excellentmeans to provide a side-view of vertical stacks as a useful supplement to the PVD. Whereas theyregarded the VVD as very helpful in a holding situation, they did not feel that it was an importanttool if there was a normal flow of traffic. Since in the PD/2 simulations there were no aircraft heldin stacks, the VVD was not used for its designed purpose. Therefore, no indications could beobtained from the questionnaire of its frequent use, relevance for work, helpfulness for avoidanceof conflicts or workload reduction.
In contrast to this, many more ACC controllers reported they used the SIL frequently. It was ofessential relevance for their work because "... in a stripless environment it’s the only way to haveinformation about incoming a/c." Whilst this was an expected response, the other potentialbenefits of the SIL for avoiding conflicts, or reducing workload can not be deducted from thequestionnaire responses.
PD/2 Final Report Results
DOC 97-70-13 Version 1.2 63February 1998
In summary, the questionnaire results about tools and functions, as compared to the much morepositive results of the sections before, indicated that the controllers differentiated well betweengood acceptance of the PD/2 concept and HMI. Although they saw some need for furtherdevelopment and improvement of the tools and functions to better support their work under thisconcept.
7.5 AIRBORNE DEMONSTRATIONS
As was described in section 4.4, DLR’s ATTAS aircraft (see Figure 9) was employed as a liveaircraft in demonstration runs of the PD/2 trials. The airborne demonstration element is fullydescribed in Annex F. This section summarises the results.
The PD/2 airborne demonstration programme was very successful, confirming the ability of a 4DFMS equipped aircraft to agree conflict-free 4D trajectories with ATC and to fly them, whileoperating within continuous 4D tolerances. Specifically, the demonstration flights confirmed that:
• a digital data link enabled detailed information on flight status, proposed trajectories andimposed 4D constraints to be transmitted between the aircraft and an ATC arrival planningsystem
• the airborne system was sufficiently flexible to be able to implement revised trajectories tocomply with altitude and time constraints imposed by the arrival planning system
• live aircraft were able to follow the trajectories very precisely within continuous 4Dtolerances
• guidance accuracy was remarkably high. The cross track error was within 0.03 nauticalmiles. Altitude error was within 20 ft in level flight, within 300 ft in en-route descent andwithin 100 ft in TMA descent
• time control was also very accurate. The arrival time error at a Metering Fix and anapproach gate was in the order of +/- 5 seconds
• accurate weather forecasting and engine performance models are essential if the aircraft isto fly close to its optimal thrust setting and calibrated airspeed (CAS) schedule
The results of the AHMI evaluation trials performed in the fixed-base Experimental Cockpit (seeFigure 8) can be summarised as follows:
• Display Layout –
The basic display organisation incorporating a horizontal and vertical display for both Plan andMonitor mode was appreciated by all pilots (Figure 20 and Figure 21 show the Lateral andVertical Display layout, both for PLAN mode). In addition, button realisation, menu and sub-menu organisation as well as constraint list, trajectory, and contract representation wereappreciated, in general. However, the mechanisms for selection and display of differentconstraint lists were rejected.
• Input Characteristics –
Whereas touch-pad size and the corresponding cursor dynamics as well as cursorrepresentation on the screen were appreciated, the location of the touch-pad stimulated severalproposals for improvement. Additionally, two of the pilots requested ‘hot-spot’ activation forsome of the functions.

Results PD/2 Final report
64 Version 1.2 DOC 97-70-13February 1998
Input Philosophy –
The function-oriented display was well accepted. Pilot action requests initiated either by data-link or by system-generated messages were favoured.
• Operational Aspects –
Due to the missing control display unit (CDU) within the experimental set-up, a large amount ofincompatibilities between conventional CDU input strategy and navigational display (ND) inputsequences were revealed by the pilots.
• PHARE Trajectory Negotiation Concept –
The strategic trajectory negotiation procedures were accepted by all pilots. However, a largeamount of pilot comments referred to the integration of tactical aircraft operation and strategicplanning.
N33
30
24
21S
15
12
E
06
03
W
DLRDLR
N33
30
24
21S
15
12
E
06
03
W
-+
EDIT
INS
DEL
ATTR
MDEL
INS
COPY
MOVE
GENERATE NEGOTIATE ACTIVATE
RANG
MAP
DISP
LBE-1
20AMLUH
LBE
ULSEN
Figure 20 Navigation Display layout: Lateral Display, PLAN mode

PD/2 Final Report Results
DOC 97-70-13 Version 1.2 65February 1998
DLR
-160 -80 0 80 160
000
10: 24: 24
060
120
180
240
10:00 10:30
ULSEN174
CEL100
AMLUH231
NOM039
ENTRY072
LBE231
NIE223
RW09003
P1025
CEL2139
300
-+
EDIT
INS
DELH
INSH
MODH
GENERATE NEGOTIATE ACTIVATE
RANG
MAP
DISP
Figure 21 Navigation Display layout: Vertical Display, PLAN mode

Results PD/2 Final report
66 Version 1.2 DOC 97-70-13February 1998
This page is intentionally blank

PD/2 Final Report Conclusions
DOC 97-70-13 Version 1.2 67February 1998
8 CONCLUSIONS
As part of the Programme for Harmonised Air Traffic Management Research in EUROCONTROL(PHARE), PD/2 formed the second major real time simulation exercise in a series of three PHAREDemonstrations of an advanced concept which was jointly developed by research organisationsfrom four European nations.
The PD/2 system was demonstrated on DLR’s real-time simulator ATMOS (Air TrafficManagement and Operations Simulator), using 32 controllers from 7 European countries. Thesystem incorporated advanced controller assistance tools developed by the PHARE AdvancedTools project, with an associated ground human-machine interface (GHMI) designed in thePHARE GHMI project. The DLR Advanced Technologies Testing Aircraft System (ATTAS)Experimental Cockpit, simulated air-ground datalink and 4D experimental flight managementsystems (EFMS) were integrated into this System. Six pilots participated in an evaluation of thePD/2 on-board components developed in the PHARE airborne human-machine interface (AHMI)project.
A PD/2 airborne demonstration programme using DLR’s ATTAS Aircraft, with the ATTASExperimental Cockpit integrated, was successfully accomplished. The ability of an aircraft to fly,in a routine manner, negotiated trajectories while operating on its inbound route down to theApproach Gate within continuous 4D constraints was convincingly demonstrated.
All participating controllers completed a controllers’ training programme of one week that enabledthem to work according to their roles in PD/2. They worked both in reference baseline mode withpaper strips, similar to current environments, as well as in the PHARE advanced tools mode.
The controllers considered the training as being adequate and sufficient and they appreciated thesimulation set-up as being realistic and valid. The PD/2 GHMI gained a high degree of controllerapproval including significant acceptance of display principles such as colour coding of aircraftlabels, and an equally high acceptance of the interaction principles such as using the mouse foron-screen interaction with aircraft labels and pop-up menus.
Although the fundamental PD/2 concept was unanimously well accepted, some details of theoperational concept which related to particular properties of the computer assistance tools andfunctions, received a mixed degree of controller approval. The controllers identified a need fordeveloping individual tools and functions further, to better support controller work under thisconcept. Particular areas addressed in that context were the support provided by the tools todetect and solve conflicts, the introduction of trajectory update capability, and the capability toadapt better to personal work styles. A similar situation applied to the findings from the on-boardcomponents demonstration: a high degree of pilot approval of the demonstrated 4D FMS/datalinkconcept emerged, while at the same time valuable comments from pilots, to optimise generation,negotiation, and monitoring of 4D trajectories, were obtained. This requirement to develop toolsand functions further was to be expected, since the PD/2 system was experimental rather thanpre-operational.
The quantitative analysis of system performance data revealed various gains of the PD/2 PATsand GHMI introduction, in terms of traffic throughput and quality of service. Particularly underhigh traffic-load overall benefits were achieved for the number of landings per time unit, averageflight time of aircraft, inbound delays, and time precision of delivery. An analysis of the wakevortex categories separations measured at the Approach Gate suggested that the above benefitswere not achieved at the expense of closer separation.

Conclusions PD/2 Final Report
68 Version 1.2 DOC 97-70-13February 1998
Another general point was that, in parallel to the improvements gained with the advanced system,the variability of the measurements was considerably reduced. The controller team performancesand work styles became more consistent, and thus more predictable.
It is concluded that improvements in traffic throughput and quality of service were achievable withthe advanced system alone. The 4D FMS/datalink aircraft that automatically followed theirnegotiated trajectories were introduced in two steps of 30 % and 70 % of aircraft in the trafficsamples. Their introduction resulted in considerably higher percentages of aircraft being deliveredat the Approach Gate exactly on their planned time.
Statistical analysis of controller workload revealed, as an effect of the PD/2 PATs and GHMIintroduction, some re-distribution of workload between tactical controller positions. Important tonote is an observed decrease of workload at the Approach Pickup controller position which underreference baseline condition was the position with the relatively highest workload.. Furthermore,the introduction of 30 % and 70 % 4D FMS/datalink aircraft in the traffic sample produced astepwise reduction of workload for all tactical controller positions.
The effect of releasing the controllers from the duty of transferring ATC instructions showedsignificant reductions in all objective workload measures at all controller working positionsirrespective of traffic volume. We can therefore conclude that workload regarding the mere trafficguidance was strongly reduced by increasing proportion of 4D FMS/datalink equipped aircraft.
In summary, PD/2 was a major, successful demonstration of the integration of air and ground airtraffic management using advanced tools, 4D FMS, and datalink, in an extended terminal areaairspace. Experimental evidence suggests that the PHARE concept of trajectory-based trafficguidance provided by the advanced tools and human/machine interfaces was approved by thecontrollers and pilots, and that it has the potential for improving traffic throughput and quality ofservice, at acceptable levels of controller workload.

PD/2 Final Report Acknowledgements
DOC 97-70-13 Version 1.2 69February 1998
9 ACKNOWLEDGEMENTS
A collaborative work programme like PHARE PD/2 would not be possible without the close co-operation of the PHARE partners in the research establishments: CENA of France, DLR ofGermany, EUROCONTROL, NATS of the UK and NLR of the Netherlands. Everyone whocontributed in the execution of the PD/2 project shares in its success.
Special acknowledgements go to:
• all the controllers and pilots who participated. It was a great pleasure to co-operate with suchqualified and highly motivated personnel.
• the authorities and organisations who supported the PD/2 trials.
• the Flugabteilung of DLR for their participation in the ATTAS flight programme.
• the PHARE cell members for their co-ordination effort.
A special thank is addressed to the British controllers Alison Rhodes, Roger Goodwyn and TerrySymmans for their constructive comments and effective support during the pilot phases, and fortheir assistance in the demonstration phases of PD/2.

Acknowledgements PD/2 Final Report
70 Version 1.2 DOC 97-70-13February 1998
This page is intentionally blank

PD/2 Final Report Glossary
DOC 97-70-13 Version 1.2 71February 1998
10 GLOSSARY
25L Runway 25 Left
25R Runway 25 Right
4D Four Dimensional (latitude, longitude, altitude, and time)
4D FMS Four Dimensional Flight Management System
a/c Aircraft
ACC Area Control Centre
ADP Aéroports de Paris
AHMI Airborne Human-Machine Interface
AMD Arrival Management Display
ANOVA Analysis of Variance
API Application Interface
ATC Air Traffic Control
ATMOS Air Traffic Management and Operations Simulator
ATS Air Traffic Services
ATTAS Advanced Technologies Testing Aircraft System
CAS Calibrated Airspeed
CDU Control Display Unit
CENA Centre d'Etudes de la Navigation Aérienne
CLASS A Aircraft in Automatic guidance mode (4D FMS/datalink equipped aircraftwith clearance to implement its own trajectory)
CLASS B Aircraft guided via R/T, ground system support through conflict-freetrajectory and advisories
CLASS M Aircraft in Manual guidance mode (via R/T) without a valid trajectory
CMS Common Modular Simulator
COMPAS Computer Oriented Metering, Planning and Advisory System
CP Conflict Probe
CRD Conflict Risk Display
d.f. Degrees of Freedom
DFS Deutsche Flugsicherung GmbH
DLR Deutsches Zentrum für Luft- und Raumfahrt e.V.
EEC EUROCONTROL Experimental Centre
EFMS Experimental Flight Management System
ETMA Extended Terminal Manoeuvring Area
FL Flight Level

Glossary PD/2 Final Report
72 Version 1.2 DOC 97-70-13February 1998
FMS Flight Management System
FPM Flight Path Monitor
GED Metering Fix Gedern
GHMI Ground Human-Machine Interface
H0 Null Hypothesis
H1 Alternative Hypothesis
ILS Instrument Landing System
LFV Luftfartsverket (Swedish Civil Aviation Administration)
MilATCC Military Air Traffic Control Centre
n Number of Subjects
n.s. Not Significant
NATS National Air Traffic Services
ND Navigation Display
NLR Nationaal Lucht- en Ruimtevaartlaboratorium
NM Negotiation Manager
NM Nautical Mile
ORG Organisation
PATs PHARE Advanced Tools
PD/2 PHARE Demonstration 2
PHARE Programme for Harmonised Air traffic management Research inEUROCONTROL
PSA Metering Fix Spessart
PVD Plan View Display
R/T Radio Telephony
RMS Root Mean Square
ROMATSA Romanian Air Traffic Services Administration
RUD Metering Fix Rüdesheim
RWY Runway
SICTA Sistemi Innovativi per il Controllo del Traffico Aereo
STAR Standard Arrival Route
SWAT Subjective Workload Assessment Technique
TLX NASA Task Load Index
TMA Terminal Manoeuvring Area

PD/2 Final Report Glossary
DOC 97-70-13 Version 1.2 73February 1998
Trajectory A trajectory is defined as a series of profile and route points defining a 4D–path for an aircraft joined by straight or curved segments ( 4D or 4Dimensional is used to denote positions in space defined relative to earthand time. These points can be considered as being latitude, longitude,altitude and time).
Trajectory Predictor Trajectory Predictor
VAL Validation Tools Project
VVD Vertical View Display

Glossary PD/2 Final Report
74 Version 1.2 DOC 97-70-13February 1998
This page is intentionally blank
PD/2 Final Report References
DOC 97-70-13 Version 1.2 75February 1998
11 REFERENCES
Within PHARE numerous documents have been produced in preparation of the PHAREDemonstration 2, that represent sources for the PD/2 Final Report.
NATS Ltd.'PD/1 Final Report Vol. 1', EUROCONTROL DOC96-70-24 Vol. 1.
NATS Ltd.'PD/1 Final Report Vol. 2: Annexes', EUROCONTROL DOC 96-70-24 Vol. 2.
'PD/2 Operational Specification', EUROCONTROL DOC 94-70-03.
'PD/2 Facility Specification', EUROCONTROL DOC 94-70-24.
'PD/2 Demonstration Project Plan', EUROCONTROL DOC 94-70-31.
'PD/2 Operational Scenario', EUROCONTROL DOC 95-70-11.
'Template of measurements to be used in PHARE Demonstrations',EUROCONTROL DOC 94-70-07.
‘Trajectory Negotiation in a Multi-Sector Environment’ EUROCONTROL DOC 97-70-14