pdf: buy-to-let index quarterly report - march 2018 · buy-to-let index report ... reports,...
TRANSCRIPT
1+44 (0)20 7118 1900 | lendinvest.com | Two Fitzroy Place, 8 Mortimer Street, London, W1T 3JJ
Buy-to-Let Index Quarterly ReportWith special feature 'House price growth slowdown'
March 2018
020 7118 1900 | lendinvest.com | Two Fitzroy Place, 8 Mortimer Street, London, W1T 3JJ
2+44 (0)20 7118 1900 | lendinvest.com | Two Fitzroy Place, 8 Mortimer Street, London, W1T 3JJ
Buy-to-Let Index Report
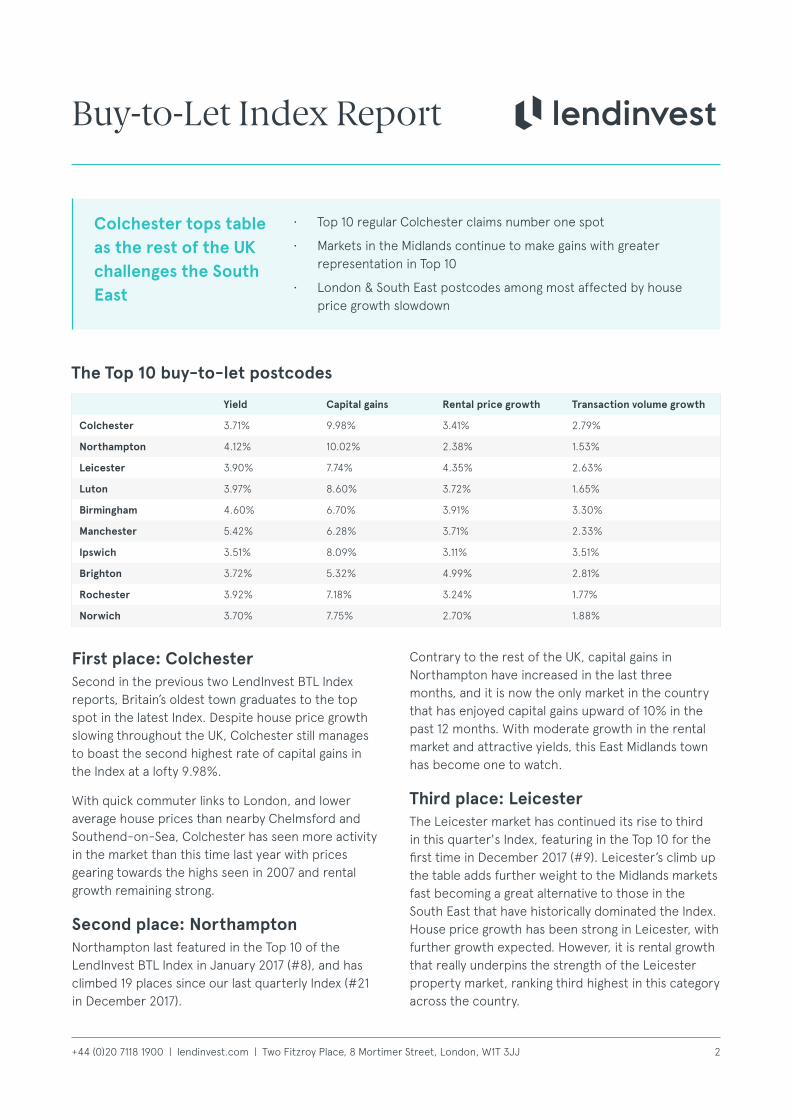
First place: ColchesterSecond in the previous two LendInvest BTL Index reports, Britain’s oldest town graduates to the top spot in the latest Index. Despite house price growth slowing throughout the UK, Colchester still manages to boast the second highest rate of capital gains in the Index at a lofty 9.98%.
With quick commuter links to London, and lower average house prices than nearby Chelmsford and Southend-on-Sea, Colchester has seen more activity in the market than this time last year with prices gearing towards the highs seen in 2007 and rental growth remaining strong.
Second place: NorthamptonNorthampton last featured in the Top 10 of the LendInvest BTL Index in January 2017 (#8), and has climbed 19 places since our last quarterly Index (#21 in December 2017).
• Top 10 regular Colchester claims number one spot
• Markets in the Midlands continue to make gains with greater representation in Top 10
• London & South East postcodes among most affected by house price growth slowdown
Colchester tops table as the rest of the UK challenges the South East
The Top 10 buy-to-let postcodes
Yield Capital gains Rental price growth Transaction volume growth
Colchester 3.71% 9.98% 3.41% 2.79%
Northampton 4.12% 10.02% 2.38% 1.53%
Leicester 3.90% 7.74% 4.35% 2.63%
Luton 3.97% 8.60% 3.72% 1.65%
Birmingham 4.60% 6.70% 3.91% 3.30%
Manchester 5.42% 6.28% 3.71% 2.33%
Ipswich 3.51% 8.09% 3.11% 3.51%
Brighton 3.72% 5.32% 4.99% 2.81%
Rochester 3.92% 7.18% 3.24% 1.77%
Norwich 3.70% 7.75% 2.70% 1.88%
Contrary to the rest of the UK, capital gains in Northampton have increased in the last three months, and it is now the only market in the country that has enjoyed capital gains upward of 10% in the past 12 months. With moderate growth in the rental market and attractive yields, this East Midlands town has become one to watch.
Third place: LeicesterThe Leicester market has continued its rise to third in this quarter's Index, featuring in the Top 10 for the first time in December 2017 (#9). Leicester’s climb up the table adds further weight to the Midlands markets fast becoming a great alternative to those in the South East that have historically dominated the Index. House price growth has been strong in Leicester, with further growth expected. However, it is rental growth that really underpins the strength of the Leicester property market, ranking third highest in this category across the country.
3+44 (0)20 7118 1900 | lendinvest.com | Two Fitzroy Place, 8 Mortimer Street, London, W1T 3JJ
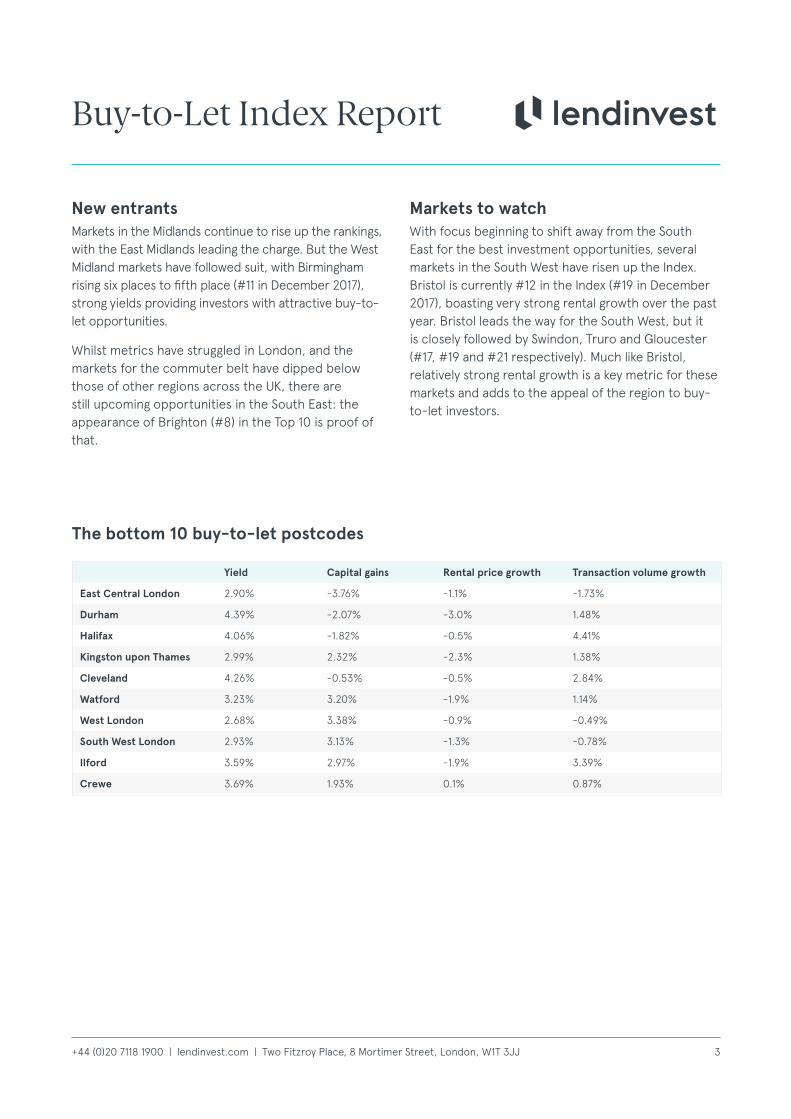
New entrants Markets in the Midlands continue to rise up the rankings, with the East Midlands leading the charge. But the West Midland markets have followed suit, with Birmingham rising six places to fifth place (#11 in December 2017), strong yields providing investors with attractive buy-to-let opportunities.
Whilst metrics have struggled in London, and the markets for the commuter belt have dipped below those of other regions across the UK, there are still upcoming opportunities in the South East: the appearance of Brighton (#8) in the Top 10 is proof of that.
Markets to watchWith focus beginning to shift away from the South East for the best investment opportunities, several markets in the South West have risen up the Index. Bristol is currently #12 in the Index (#19 in December 2017), boasting very strong rental growth over the past year. Bristol leads the way for the South West, but it is closely followed by Swindon, Truro and Gloucester (#17, #19 and #21 respectively). Much like Bristol, relatively strong rental growth is a key metric for these markets and adds to the appeal of the region to buy-to-let investors.
The bottom 10 buy-to-let postcodes
Yield Capital gains Rental price growth Transaction volume growth
East Central London 2.90% -3.76% -1.1% -1.73%
Durham 4.39% -2.07% -3.0% 1.48%
Halifax 4.06% -1.82% -0.5% 4.41%
Kingston upon Thames 2.99% 2.32% -2.3% 1.38%
Cleveland 4.26% -0.53% -0.5% 2.84%
Watford 3.23% 3.20% -1.9% 1.14%
West London 2.68% 3.38% -0.9% -0.49%
South West London 2.93% 3.13% -1.3% -0.78%
Ilford 3.59% 2.97% -1.9% 3.39%
Crewe 3.69% 1.93% 0.1% 0.87%
Buy-to-Let Index Report
4+44 (0)20 7118 1900 | lendinvest.com | Two Fitzroy Place, 8 Mortimer Street, London, W1T 3JJ
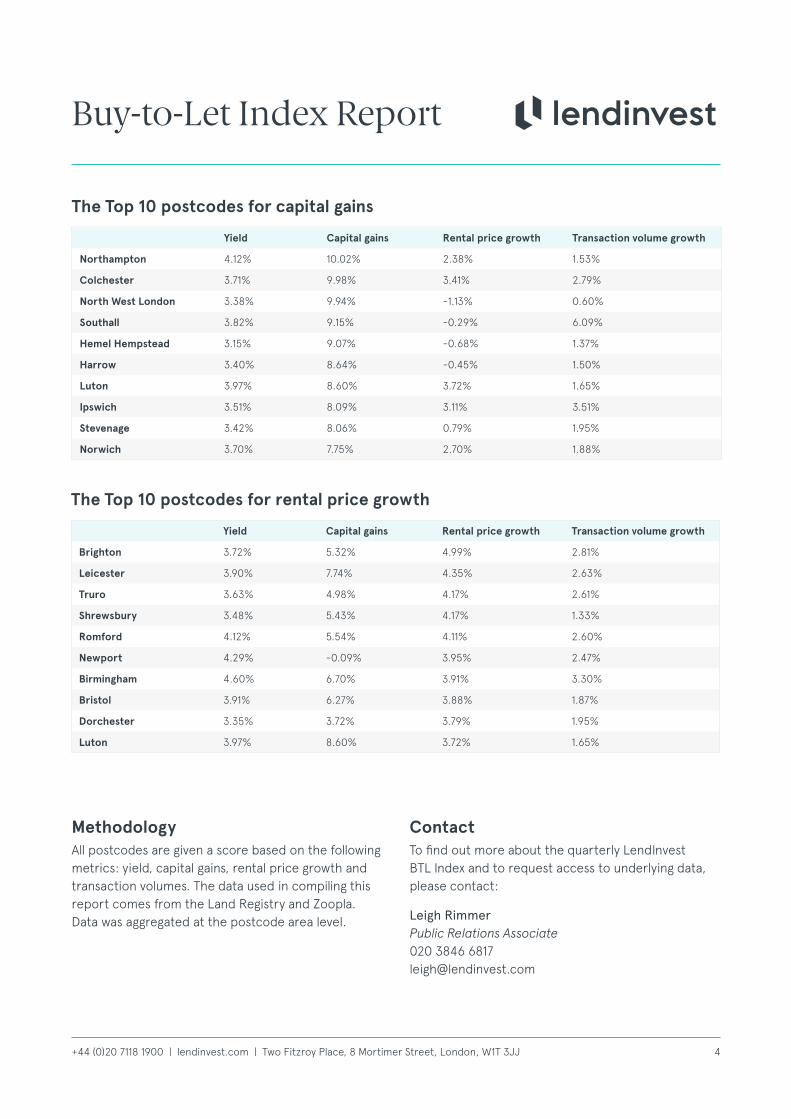
The Top 10 postcodes for rental price growth
Yield Capital gains Rental price growth Transaction volume growth
Brighton 3.72% 5.32% 4.99% 2.81%
Leicester 3.90% 7.74% 4.35% 2.63%
Truro 3.63% 4.98% 4.17% 2.61%
Shrewsbury 3.48% 5.43% 4.17% 1.33%
Romford 4.12% 5.54% 4.11% 2.60%
Newport 4.29% -0.09% 3.95% 2.47%
Birmingham 4.60% 6.70% 3.91% 3.30%
Bristol 3.91% 6.27% 3.88% 1.87%
Dorchester 3.35% 3.72% 3.79% 1.95%
Luton 3.97% 8.60% 3.72% 1.65%
Methodology All postcodes are given a score based on the following metrics: yield, capital gains, rental price growth and transaction volumes. The data used in compiling this report comes from the Land Registry and Zoopla. Data was aggregated at the postcode area level.
Contact To find out more about the quarterly LendInvest BTL Index and to request access to underlying data, please contact:
Leigh Rimmer Public Relations Associate 020 3846 6817 [email protected]
The Top 10 postcodes for capital gains
Yield Capital gains Rental price growth Transaction volume growth
Northampton 4.12% 10.02% 2.38% 1.53%
Colchester 3.71% 9.98% 3.41% 2.79%
North West London 3.38% 9.94% -1.13% 0.60%
Southall 3.82% 9.15% -0.29% 6.09%
Hemel Hempstead 3.15% 9.07% -0.68% 1.37%
Harrow 3.40% 8.64% -0.45% 1.50%
Luton 3.97% 8.60% 3.72% 1.65%
Ipswich 3.51% 8.09% 3.11% 3.51%
Stevenage 3.42% 8.06% 0.79% 1.95%
Norwich 3.70% 7.75% 2.70% 1.88%
Buy-to-Let Index Report
5+44 (0)20 7118 1900 | lendinvest.com | Two Fitzroy Place, 8 Mortimer Street, London, W1T 3JJ
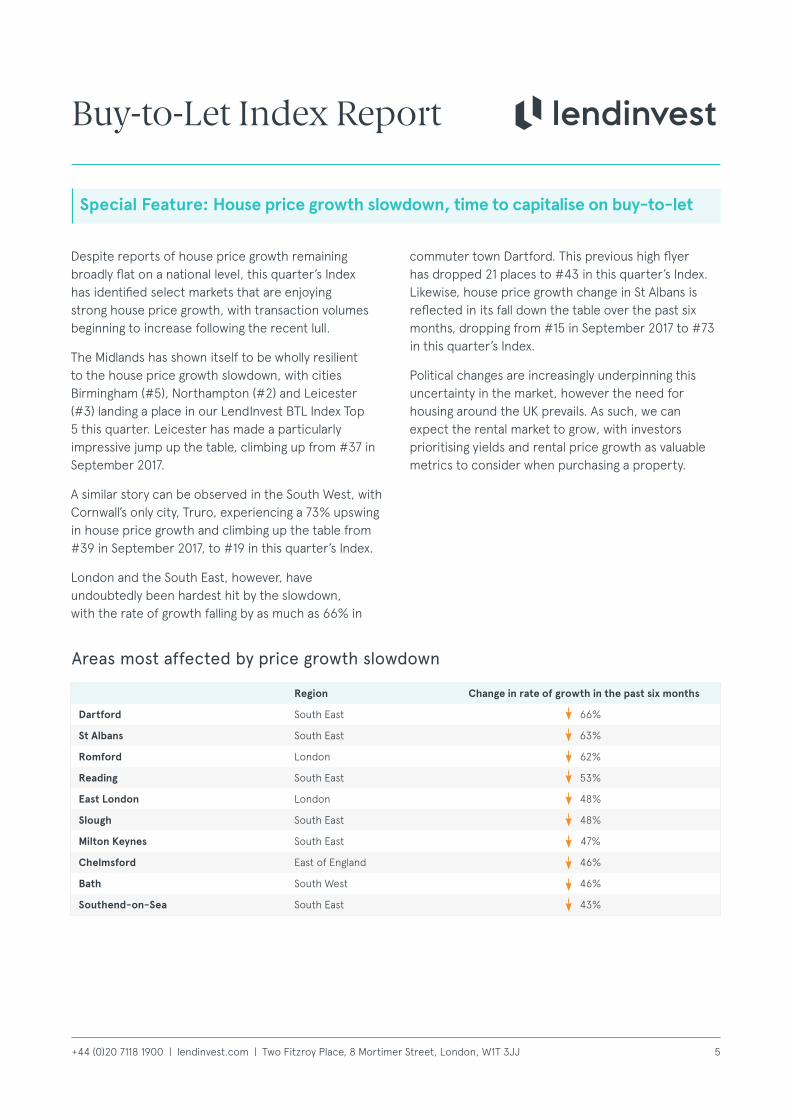
Areas most affected by price growth slowdown
Despite reports of house price growth remaining broadly flat on a national level, this quarter’s Index has identified select markets that are enjoying strong house price growth, with transaction volumes beginning to increase following the recent lull.
The Midlands has shown itself to be wholly resilient to the house price growth slowdown, with cities Birmingham (#5), Northampton (#2) and Leicester (#3) landing a place in our LendInvest BTL Index Top 5 this quarter. Leicester has made a particularly impressive jump up the table, climbing up from #37 in September 2017.
A similar story can be observed in the South West, with Cornwall’s only city, Truro, experiencing a 73% upswing in house price growth and climbing up the table from #39 in September 2017, to #19 in this quarter’s Index.
London and the South East, however, have undoubtedly been hardest hit by the slowdown, with the rate of growth falling by as much as 66% in
commuter town Dartford. This previous high flyer has dropped 21 places to #43 in this quarter’s Index. Likewise, house price growth change in St Albans is reflected in its fall down the table over the past six months, dropping from #15 in September 2017 to #73 in this quarter’s Index.
Political changes are increasingly underpinning this uncertainty in the market, however the need for housing around the UK prevails. As such, we can expect the rental market to grow, with investors prioritising yields and rental price growth as valuable metrics to consider when purchasing a property.
Special Feature: House price growth slowdown, time to capitalise on buy-to-let
Region Change in rate of growth in the past six months
Dartford South East 66%
St Albans South East 63%
Romford London 62%
Reading South East 53%
East London London 48%
Slough South East 48%
Milton Keynes South East 47%
Chelmsford East of England 46%
Bath South West 46%
Southend-on-Sea South East 43%
Buy-to-Let Index Report
6+44 (0)20 7118 1900 | lendinvest.com | Two Fitzroy Place, 8 Mortimer Street, London, W1T 3JJ
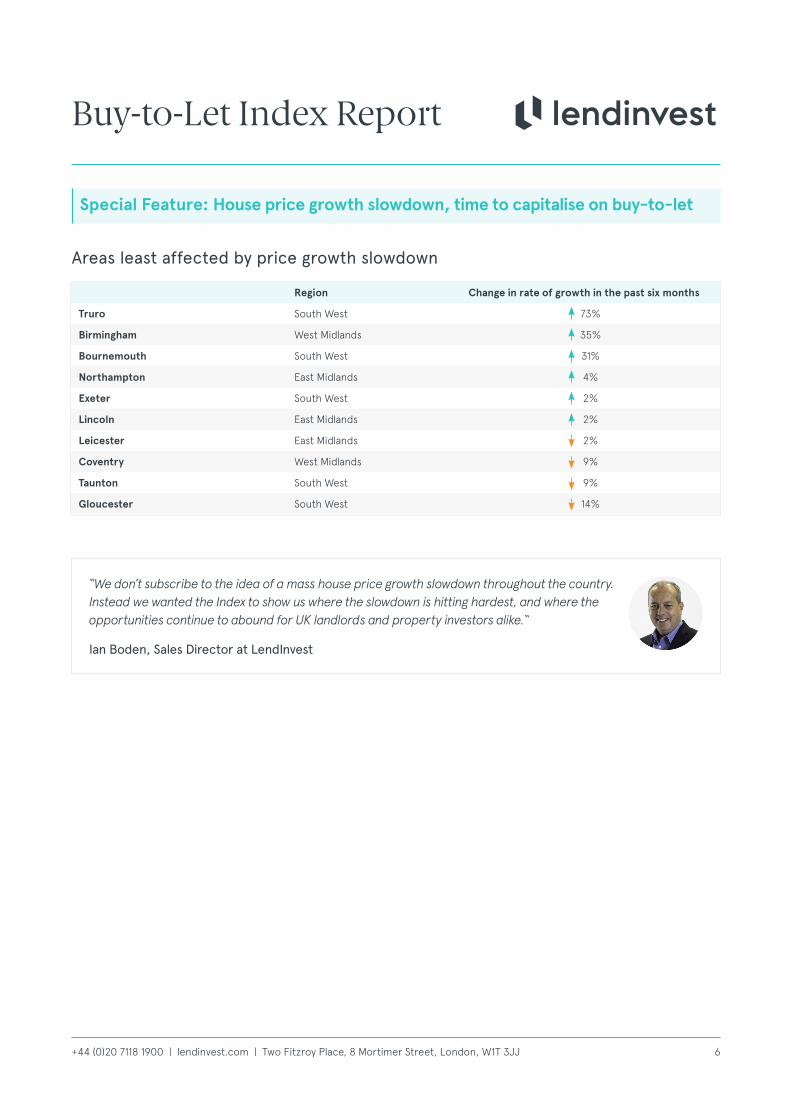
Areas least affected by price growth slowdown
Special Feature: House price growth slowdown, time to capitalise on buy-to-let
Region Change in rate of growth in the past six months
Truro South West 73%
Birmingham West Midlands 35%
Bournemouth South West 31%
Northampton East Midlands 4%
Exeter South West 2%
Lincoln East Midlands 2%
Leicester East Midlands 2%
Coventry West Midlands 9%
Taunton South West 9%
Gloucester South West 14%
Buy-to-Let Index Report
“We don’t subscribe to the idea of a mass house price growth slowdown throughout the country. Instead we wanted the Index to show us where the slowdown is hitting hardest, and where the opportunities continue to abound for UK landlords and property investors alike.“
Ian Boden, Sales Director at LendInvest