pdf (chapter 4 -- experimental techniques and results in flash pyrolysis)
TRANSCRIPT

39
Chapter 4
EXPERIMENTAL TECHNIQUES AND RESULTS IN FLASH PYROLYSIS
4.1 EXPERIMENTAL TECHNIQUES
As set out in the general introduction, the survey of experimental results will
be confined to flash pyrolysis at the exclusion of slow pyrolysis or carbonization.
Flash pyrolysis poses three experimental difficulties that need careful considera
tion: (i) control and measurement of the temperature-time history of the coal par
ticles (ii) suppression of secondary reactions (iii) quantitative collection of
products.
The temperature-time history of the coal particles generally consists of a
heating period, a period at approximately constant temperature and a cooling or
quenching period. While isothermal operation permits the easiest kinetic analysis
of the results, the reaction occurring during the heating and cooling times is often
significant. The kinetic analysis of the data in this case must take into account
the full temperature-time history. Whether or not the pyrolysis occurs isotherm
ally, the measurement of the coal particles' temperature is not trivial. In many
cases the temperature cannot be directly measured but must be calculated from a
heat transfer model. The other two experimental problems,the suppression of
secondary reactions and the collection of products, depend on the reactorgeometry and flow pattern and are best discussed separately for the entrained
flow and the captive sample techniques.
4.1.1. The entrained flow technique
In this experimental set-up shown schematically in Fig. 4.1, coal particles
20-100 ~m are carried by a primary stream of an inert gas through a water-cooled
injector at the axis of a vertical furnace. A secondary and larger stream of
inert carrier gas flows downward alonQ the furnace under laminar flow to assure
that the particles are not dispersed radially to the furnace walls. Particles
and volatile products are collected by a water-cooled probe of special design
ensuring representative samples. The reaction time is adjusted by the flowrate
of the secondary stream and the axial location of the probe. Heating elements
around the furnace produce a uniform wall temperature in the middle zone of the
furnace. The secondary gas stream is pre-heated to decrease the heating time.
A system of this type has been used by several workers (refs. 55-59). Kobayashi
et al. (ref. 57) discuss in detail the experimental aspects of the technique and
provide an analysis of the heating history of the particles including the effect
of injector geometry and the mixing between primary and secondary gas streams.
Their calculations indicate heating times in the range 5-50 ms. The times required
for 40% weight loss of a bituminous coal varied in the range 10-100 ms as the

40
furnace temp~rature ranged from 2,100 to 1,500 o K. Since the pyrolysis could not
be assumed to occur at constant temperature, the kinetic analysis of the data in
corporated suitable heat transfer calculations.
Pre heater
rSecondary Stream
Furnace
t Primary Stream(cool + carrier gas)
Sampling Probe
To Gas Ana lysis
F~eJ
Fig. 4.1. Schematic of an entrained flow pyrolysis furnace. (source: ref. 59).
A second area of concern in the entrained flow technique is the secondary re
actions suffered by the volatile reaction products during their residence in the
furnace. These reactions make the mechanistic interpretation of product distrib
ution somewhat doubtful but are of no great concern in combustion studies where
the primary information required is weight loss and perhaps elemental composition
of the volatiles.
The third experimental aspect of the entrained flow technique that requires
careful consideration is the collection and analysis of products. In the afore
mentioned investigation (ref. 57) the weight loss was determined both directly
and indirectly. The direct technique consited of simply weighing the char collected
in the probe. It was independently shown by cold flow experiments that the col
lection efficiency of char particles was 95 to 98%, suggesting similar accuracy
in the measurements of the weight loss. The indirect technique employed the coal
ash as a tracer. The results from this technique are independent of collection
efficiency but are subject to some error due to vaporization of mineral matter

41
components.
In addition to the weight loss, certain of the gases (CO,COZ,SOZ,NOx) were de
termined by on-line continuous analyzers (ref. 59) or by gas chromatography (ref.
57). In some studies the solid char was characterized by Fourier-transform
infrared spectroscopy (ref. 59). However, products of molecular weight above ZOO,
usually classified as tar, could not be collected quantitatively. Condensation on
the probe, the filter, the char, the walls of the gas collection vessel or the
walls of the furnace itself preclude a quantitative analysis.
The furnace, injector, probe etc. described in references 57 and 59 represent
the most careful and up-to-date designs. Earlier investigations using the en
trained flow technique include that of Badzioch and Hawksley (ref. 56) who also
used laminar flow conditions and that of Eddinger et al. (ref.55) ~ho used both
laminar and turbulent flow conditions. The last st~dy emplcyed a large coal-to-
gas mass flow ratio to provide sizeable tar samplc~. The increaspd amount of
solids, however, interferred with the temperature measurements and increased the
extent of secondary reactions.
4.1.Z The captive sample technique
A good description of this technique can be found in Anthony et al. (ref. 60).
A small sample (5-Z00 mg) of ground coal is placed between the folds of a wire
cloth screen (see Fig. 4.2a) heated by a DC or AC current I(t). The resistive
assembly is attached inside a metal shell containing an inert gas or hydrogen.
The gas pressure-can be varied from vacuum to 100 at. In addition to providing
the inert atmosphere at the desired pressure, the metal shell serves as a product
collection vessel.
The coal sample is placed at the center of the screen where the temperature
profile is relatively uniform. Near the electrodes the temperature drops due to
conductive losses. A fast response (low mass) thermocouple serves to measure
the temperature-time history. The sample size is chosen as a compromise of two
considerations. A large sample minimizes the effect of coal inhomogeneity and
generates a sufficient quantity of products for analysis. At the same time,
however, a large sample of particles creates some irreproducibility because of
possible rearrangement of the particles on the screen during heating. Samples
of about 200-500 mg have been used by Solomon and Colket (ref.61) and Gavalas
and Wilks (ref.62) allowing heating rates as high as 500°C/s and final tempera
tures as high as lZOO°C. In the experiments of Anthony et al. (ref.60) the sample
size was 5-10 mg producing heating rates up to 10,000°C/s with final temperatures
as high as lZOO°C.

T
0)
T T,
Fig. 4.2. The captive sample technique: (a) pyrolysis apparatus (b) single
pulse T-t response (c) double-pulse T-t response.
The temperature-time history T(t) experienced by the coal sample depends on
the current input I(t), the geometry of the resistive assembly and surroundingshell and the nature and pressure of the surrounding gas. For given sample size
and gas pressure, and for constant current I, the sample temperature reaches a
steady state Ts=f(I) at which the resistive heat input balances losses by conduction, convention and radiation (Fig. 4.2b). The time required to reach the
steady temperature is usually on the order of seconds; therefore, constantcurrent inputs are not suitable for producing large heating rates. To circumvent
this problem, Anthony et al. (ref.60) applied current inputs consisting of two

43
consecutive pulses of constant current. If IZ is the current required to produce
the steady temperature TZ' then switching from II to IZ approximately when thetemperature has reached Tz, produces the response shown schematically in Fig. 4.Zc.The heating rate is thus limited only by the maximum current II of the power supply.
Upon switching from II to IZ' the temperature overshoots slightly before settlingto a constant level TZ(Fig. 4.Zc). The overshoot can be minimized by a proper
choice of the current II and the switching time. After being held at TZ for thedesired time, the sample is cooled by turning the current off. While the cooling
period may last for a couple of seconds, after the first ZOO ms or so the temperature
becomes too low for the pyrolysis reactions to continue.The most important items in product analysis are weight loss (total volatiles)
and tar yield. The weight loss is determined by weighing the coal sample before
and after pyrolysis. The tar condenses on aluminum foils lining the walls of
the vessel. These foils can be removed and weighed after the completion of anexperiment. The tar can be subsequently dissolved in a suitable solvent, e.g.
tetrahydrofuran, for elemental analysis or nmr spectroscopy. Because of the short
duration of each experiment the pyrolysis vessel remains cold (T <50°C in most
cases) and the recovery of tar on the aluminum foils is quite high. A small amountof tar remaining in the gas volume as vapors or aerosol can be collected by
flowing the vessel contents through a filter (refs.63,64).The gaseous products can be analyzed directly from the vessel or after collect
ing in suitable cold traps. Direct collection was used with sample sizes of 100
ZOO mg producing measurable concentrations of gases in the vessel (refs.61,6Z,65).
Some experiments (ref.65) indicated that a nonnegligible fraction of the hydrocarbon gases were retained in solution in the tar deposited on the aluminum foilor on various surfaces in the vessel. To recover the gases quantitatively, it
was found necessary after each pyrolysis run to heat the vessel to about 150-Z00°Cand thus drive the hydrocarbIDn gases to the gas phase. The heating in this case
was accomplished by a mobile oven sliding on rails (ref.65). A disadvantage ofthis technique is that at 150-Z00°C a certain fraction of light products in the
tar would also enter the gaseous phase but would not be detected by the gas chromatographic procedure employed. The indirect technique of gas collection was developed by Suuberg (refs. 63,64) to concentrate the products derived from small
sample sizes (about 10 mg). The contents of the vessel were flown through two
cold traps packed with Porapak Q. The first trap maintained at room temperatureretained intermediate products such as benzene, toluene and xylene. The second,
maintained at -196°C by liquid nitrogen retained all gases except HZ. The productswere recovered by warming the traps at Z40 and 100°C respectively.
In both the direct and the indirect technique the gaseous products were anal
yzed by gas chromatography employing a thermal conductivity detector for CO, COZ'

44
H2
, H20 and a flame ionization detector for hydrocarbons. The determination of
water caused persistent difficulties. One difficulty was the uncontrolled adsorp
tion-desorption of water from pyrolysis or from the atmosphere on vessel walls
and gas lines. The other difficulty involved the integration of the broad and
distorted chromatographic peak. Solomon and Colket (ref. 61) used a different
and somewhat more reliable procedure for water determination.The overall efficiency of product collection has varied among the various
experimental setups employed. The best results seem to have been obtained by
Suuberg, who reported (refs. 63,64) a 95% total mass balance and 90% balance on
carbon and hydrogen. The largest analysis error is in water, as much as 40%, the
lowest in hydrocarbon gases, 5-10%.An interesting version of the captive sample technique has been described by
JUntgen and van Heek (ref. 66). The main features of the experimental setup was
direct connection of the pyrolysis vessel with a time-of-flight mass spectrometer
permitting direct on-line analysis of gaseous pyrolysis products and a facility
for movie-camera recording of physical changes of the coal particles. A controlled
power supply provided a linear temperature-time profile with heating rates up to
3,000°C/s.
4.1 .3 The" pyroprobe "
In a variation of the captive sample technique, the coal sample is placed in a
heated probe, the "pyroprobe", directly connected to the injection port of a gas
chromatograph. The commercially available pyroprobe consists of a platinum ribbon
as the heating element with associated power supply and control circuitry. Using
coal samples .of less than 5 mg, the heating element can supply heating rates up
to 20,000°C/s and final temperatures up to 2,000°C. A helium or other inert
carrier sweeps the pyrolysis products through a short line into the chromatographic
column.
Among the reaction products, gases and compounds of intermediate volatility can
be analyzed by using suitable separation columns. For example, capillary columns
permit the elution of compounds as heavy as naphthalene and phenol. Heavy tars
condense on tube walls or column packing and cannot be analyzed. The char residue
is weighed at the conclusion of each experiment. Applications of the pyroprobehave been reported in refs. 67 and 68.
To conclude this section we summarize the relative merits of the three tech
niques described. The entrained flow technique is suitable for high temperature
and short residence time pyrolysis where it provides the best temperature control
and rapid quenching. The steady state operation allows the processing of a large
quantity of coal to smooth sample inhomogeneity. Although gas and char collection
is straightforward, tar collection is difficult. The captive sample technique
involves much simpler apparatus and allows arbitrary pressure (including vacuum) and

45
residence time. Except at the highest temperatures, it allows good control of
temperature and heating rates. However, high heating rates can be achieved only
with small samples (- 10 mg) exacerbating the problem of sample inhomogeneity.
Product collection is good, although the milligram quantity tar collected in the
case of small coal samples is insufficient for chemical characterization. Com
pared to the standard version of the captive sample technique, the pyroprobe
arrangement is limited by small sample size and operation at close to atmospheric
pressure. In addition, the pyroprobe does not allow the collection of heavy
products. However, the direct injection of products into the chromatographic
column is a very convenient feature and greatly reduces the turnaround time for
an experiment. A more detailed discussion of the operating characteristics of
various experimental arrangements is given in a recent comprehensive report by
Howard et al. (ref. 69).
4.2 EXPERIMENTAL RESULTS AND DISCUSSION
This section contains a survey of data on weight loss, product distribution
and product composition as functions of temperature and pyrolysis time. The
bulk of the data reported here derive from essentially isothermal experiments,
small particle size and low pressure (vacuum to 1 at). Limited results involving
variations in the heating rate and temperature-time history will be discussed in
conjunction with the kinetic modeling in chapter 6. Pressure and particle size
are variables which affect the rate of transport processes, therefore they will
be discussed i~ chapter 5 on heat and mass transfer. The results discussed in
the present chapter relate to conditions which mimimize interferences by trans
port phenomena and the concommitant secondary reactions. Our survey of experi
mental data is selective rather than extensive, emphasizing recent comprehensive
work and altogether omitting earlier or more narrowly focussed studies. For a
broader experimental survey the report of Howard et al. (ref. 69) is highly rec
ommended.
4.2.1 \~eight loss
Although only an overall measure of the reaction's progress, the weight loss
or total yield of volatiles displays a complex temperature dependence. To facil
itate the discussion we introduce a few terms:
cumulative yield:
instantaneous yield:
fraction or percentage of the weight of a product
evolved during the period of pyrolysis relative to
the weight of coal on an "as received" or dry ash
free basis; the cumulative yield is generally a func
tion of temperature and time.
the derivative with respect to time of the cumulative
yield.
46
yield:
ultimate yield:
the term yield will be used as a short-cut for
cumulative yield.
at fixed temperature the cumulative yield asymp
totically reaches a maximum value, within exper
mentally reasonable times; this maximum value will
be called the ultimate yield and is generally a
function of temperature.
B
The ultimate yield defined above has relative rather than absolute significance.
Consider for example two first order parallel and independent reactions with the
same product,k1A ---~ Pk2
---~ PIf Ao' Bo are the initial amounts of A,B, the yield is
A B~ (l_e-kl t ) + ~ (1_e-k2t )W Wand the theoretical ultimate yield is (Ao+Bo)/W. Suppose, however, that k2 has
a much higher activation energy than k1 such that at low temperatures k2«k1.
Then if the pyrolysis time is limited for practical reasons, the ultimate yield
at low temperatures will be Ao/W. At sufficient high temperatures, however, the
constant k2 will be significant and the ultimate yield will reach its theoretical
value. Since pyrolysis involves a large number of reaction steps with a wide
range of activation energies,the (apparent) ultimate weight loss is an increasing
function of temperature. In principle,the ultimate weight loss also depends on
the temperature-time history because of the coupled nature of the chemical reactions.
However, the dependence on the temperature-time history is rather weak as will be
discussed in Chapter 6.
Representative weight loss data from an entrained flow system and a captive
sample system are shown in Fig. 4.3 and Figs. 4.4, 4.5 respectively. Figure 4.3
shows the weight loss obtained by the entrained flow technique at high temperatures
and short residence times (ref. 57). The data points represent cumulative weight
loss corresponding to the pyrolysis time under question. Each point, therefore,
corresponds to a distinct experiment employing a different sample of coal particles.
The scatter in the data, as high as 20%, is due to measurement error as well as
sample variation. Another noteworthy feature is the inflection point at the early
stages of pyrolysis, indicating an initial acceleration of the reaction rate.
Since the data have been corrected for the effect of heating time, this initial
acceleration which has also been observed in other studies seems to be related
either to the presence of consecutive reactions or to intraparticle mass trans-
fer retardation.

47
To prevent secondary reactions o~ t~r vaoors on particle surfaces influencing
the weight loss, it is necessary to kee~ very low rarticle density in the en
trained flow reactor. Secondary reactions on the reactor walls would still takeplace but would only affect the product distribution and not the weight loss.
80,..----------------------,Lignite
LL«o
Bituminous Cool
~ 80.----------------------,o
.r::..? 60
Q)
~
20 40 60 80 150 200
Reoction time (ms)
Fig. 4.3. Weight loss vs. pyrolysis time at various furnace
temperatures (source: ref. 57).
Solomon and collaborators (refs. 61,70) have studied the pyrolysis of a largenumber of coals under vacuum (20-60 mm Hg) by the captive sample technique. Figures 4.4,4.5 are representative samples of Solomon's results showing the total
weight loss as a function of pyrolysis temperature for two different residencetimes, 20s and 80s. The weight loss (cumulative) has considerable scatter, some
of which may be due to sample variability but a major fraction is probably due
to fluctuations in the sample temperature and loss of fine coal fragments from the
screen. The solid curves were calculated by a kinetic model discussed in Chapter 6.

48
�oo,---_--.,--_-,---_,____--,-----_-_-~
80
u..«o-oe 60
20
t:. 205o 80S
o ';-;30"'0;--~--;5~0:;;0-~--c;70!c0;---~-9CCO~0,----~--I--l,0~0-~-~1-l300
Pyrolysis temperature (OC)
Fig. 4.4. Weight loss vs. temperature for a hvc bituminous
coal "Ohio No.2" (source: ref. 70).
100
{; 2050 80S
80
u.. 0 0«0
<t 60
~
5!
~ 400-
~
20 {;
0300 500 700 900 1100 1300
Pyrolysis temperature IOe I
Fig. 4.5. Weight loss vs. temperature for a hva bituminous
coal "Lower Kitanning" (source: ref. 70).

49
The results of Figure 4.4 exhibit some important trends. Above about 700°C
the weight loss at 20 and 80s is the same, within experimental error, indicating
that 20s is adequate to attain the ultimate asymptotic value. At temperatures
below 700°C the deviation between the results at the two residence times is sig
nificant indicating that 20s is insufficient for achieving the ultimate weightloss.
Figure 4.5 presents the weight loss for a bituminous coal with the rank "high
volatile A". The main difference with Figure 4.5 is in the ultimate weight loss
which seems to change very little with temperature above 900°C. This difference
will be explained below in the discussion of individual product yields.
4.2.2 Product distribution
The product distribution is the most essential Information relative to tne
commercial utilization of pyrolysis and at the same time sheds considerable light
on reaction mechanisms. Representative experimental data are shown in Figs. 4.6
4.8 taken from Solomon's work (ref. 70). They present the cumulative yields of
tar, H20,C02,CO,H2 and hydrocarbon gases at residence times of twenty seconds.
The balance is the residual solid, char. The label T + Mdenotes tar and "missing"
material that escaped the collection procedure and is estimated only by an overall
mass balance. This missing material probably consists largely of tar whence
lumped with the collected tar. The solid lines again represent results of model
fitting. Despite the cumulative nature of the product yields, the scatter in the
data is considerable demonstrating the difficulties inherent in such measurements.
Measuring the instantaneous (or differential) yields in this experimental setup
is cl early impracti ca1.
The products can be classified into two groups relative to the temperature de
pendence of the yields. Tar, water and carbon dioxide evolve at lower temperatures
with ultimate yields that are essentially independent of temperature above 700°C.
The second group of products consisting of gaseous hydrocarbons, carbon monoxide
and hydrogen evolve at higher temperatures. The ultimate yield of these products
continues increasing with temperature up to 1 ,OOO°C or higher.Coal rank is a very important factor in the distribution and temperature de
pendence of various products. In bituminous coals, tar makes up 50-80% of the
weight loss, the remaining consisting of hydrocarbon gases, water and carbon oxides.
In subbituminous coals,water and carbon oxides are produced at increased yields,
as much as 60% of the weight loss, while tar contributes only 25-40%. In lignites
tar is even lower and gases higher as illustrated in Fig. 4.6.

50
5.0
+ ++ +
4.0 ""- o CO2Water
<l + Waler0 o Tor. M/20
;/. o HCl3 +li. eO/5
.c 3.0 "V Hydrogen CO,O'
.0;3
:2 OHC/3
" 2.0.>'
u V~ Hydrogen"00 0a: 10
TOr + M/20
0
0300 1100 1300
Fig. 4.6. Product yields vs. temperature for a Montana ligniteat 20s pyrolysis time (source: ref. 70).
5.or-~----''-~--'-+~~======I::=-;;~1Water
;: 4.0<lo
~ 3.0.0;3
"0
";., 2.0
u~
"0oa:
10
o CO 2
+ Walero Tor+M/20o HC/3t::. eO/5V Hydrogen
+
++
CO/2
~_.....,~HC/3
Fig. 4.7. Product yields vs. temperature for a hvc bituminouscoal "Ohio No.2" at 20s pyrolysis time (source: ref. 70).

51
The variation of the relative distribution of tar and gases among coals of
different rank explains the previously observed temperature dependence of the
ultimate yield. In bituminous coals where the weight loss is dominated by tar,the ultimate yield appears to increase very little beyond 700 0e. In subbituminous
coals and lignites, where a considerable fraction of the volatiles consists of eo
and hydrocarbon gases, the ultimate weight loss continues increasing with temperature even beyond 1,0000e.
Tar is the most abundant and commercially valuable product from the pyrolysis
of bituminous coals. It is a mixture of many compounds with molecular weights
mainly in the range 200-1200. At the temperature of pyrolysis it is produced asa vapor but at room temperature it becomes a viscous liquid or solid. The tar
liquids consist largely of dimers of smaller fragments generated by the primary
bond dissociation reactions.
In an ideal experimental setup, once released from the coal particles the tar
molecules are removed from the high temperature region escaping secondary reactions.The captive sample and entrained flow techniques approximate this desirable oper
ation. Figure 4.9 shows the cumulative tar yield at two pyrolysis times, 20s and
80s, as a function of temperature. Despite the large scatter in the data, theultimate yield (80s) is clearly independent of temperature above 500 0e. As a
matter of fact, the yield at 80s seems to slightly decline when the temperature
exceeds 800 0e. This behavio~ which has been observed with several other coals,seems to arise from secondary reactions which are more pronounced at higher
temperatures and longer reaction times. It is also observed that the 80s yieldexceeds the 20s yield up to about 700 0e where they become practically indistinguishable. This indicates that at 700 0 e (perhaps even lower) a pyrolysis time of
20s is sufficient for the attainment of the ultimate yield of tar.
The temperature-time behavior of the yield of hydrocarbon gases, also shownin Fig. 4.9, is considerably different from that of tar. The ultimate yield
increases with temperature in the whole range studied. Moreover, the 80s curve
considerably exceeds the 20s curve up to about 9000e indicating the generally
higher activation energy of the respective rate determining steps.Another detailed study of individual product yields was conducted by Suuberg
et al., also using the captive sample technique (refs. 63,64,71,72). Because
the experiments employed nonisothermal temperature pulses, the measurements donot permit the ready visualization of the dependence on time and temperature,
although they are amenable to kinetic analysis as will be discussed in the next
chapter. Other results concerning product distribution in flash pyrolysis can
be found in refs. 65,67,73-75.

52
5.0
4.0 0 CO, He /3u.<[ + Waler0 0 Tm'M/20 00'- o HCi3
{:, CO
.c. 3.0 'V Hydrogen
'"~
± Water+ 0
~ Tar·'¥1120m 2.0.;:'
cou~
."0a: 1.0
Hydrogen
'Y
k;--e:::::~~:::::~::~~~~2!:J~=~=~:::::=c~o~'_J0 300 500 700 900 1100 1300
Pyrolysis temperature (OC)
Fig. 4.8. Product yields vs. temperature for a hva bituminous coal "Lower
Kittaning" at 20s pyrolysis time (source: ref. 70).
100
21 ~<[0
,205 i!'80 80S 18
U. .c.<[ '"0 16 m
i!'~
60 ~
.c.c
0 12 0
'" 0 "''" ~ 0 0~ u
0
u 40 9 ."
m .c..;:'
~
0 if-
20au0;
0;:
300 500 700 900 1100
Pyrolysis temperature (OC)
Fig. 4.9. Yields of tar and gaseous hydrocarbons vs. temperature at
two pyrolysis times for a hva bituminous coal "Lower Kittaning" (source:
ref. 70).
53
4.2.3. Char and tar composition; distribution of sulfur and nitrogen.
In the previous subsection we presented data on the yields of tar, char and
several gaseous compounds. In this subsection we discuss the elemental composi
tion and certain other properties of char and tar with an eye towards their
mechanistic significance. We also summarize data about the partition of sulfur
and nitrogen among tar, char and gases, which is important to the utilization
of these pyrolysis products as fuels.
Figure 4.10 and 4.11 display the elemental composition of char and tar as
functions of pyrolysis temperature for a high volatile bituminous coal studied
by Solomon (ref. 70). The effect of temperature on hydrogen, oxygen and carbon
is quite predictable. Increasing temperature is accompanied by a sharp decrease
in the fractions of oxygen and hydrogen due to the evolution of water, carbon
oxides and light hydrocarbons, all of which possess OIC or HIC ratios higher than
the parent coal. The sulfur content in the char is almost always lower than in
the parent coal. However, the temperature dependence of the sulfur varies with
the coal examined, probably due to the different amounts of inorganic and organic
forms. The nitrogen content in the char is somewhat higher than in the parent
coal.
The elemental composition of tar (Fig. 4.11) follows rather different trends.
Compared to the parent coal, tar is moderately enriched in hydrogen and sulfur,
considerably depleted in oxygen and approximately unchanged in carbon and nitro
gen. With increasing temperature, hydrogen decreases slightly, while carbon remains
essentially constant. The temperature dependence of oxygen is erratic, perhaps
due to the error involved in determination by difference. With some exceptions,
the sulfur content is higher than in the parent coal but the temperature depend
ence is erratic and varies from coal to coal. The content of nitrogen is gener
ally similar to that in the parent coal and shows no noticeable temperature trend.
The distribution of sulfur in the pyrolysis products can be examined in more
detail in Fig. 4.12 (ref. 70) which gives organic and total sulfur normalized
with respect to the composition in the parent coal. All of the sulfur in the
tar is, of course, organic. The normalized organic sulfur is below one in both
tar and char, evidently due to the decompositon of reactive sulfur forms like
mercaptans and sulfides with the formation of gaseous products, mainly hydrogen
sulfide. In some coals with high pyritic content, the organic sulfur content
increases with temperature in both the char and tar due to incorporation in the
organic structure of decomposing pyritic sulfur. In other coals the organic
sulfur shows little temperature trend although it always remains below one. The
total sulfur in the char is somewhat less than unity and slightly declines with
temperature. References 70 and 76 by Solomon provide detailed results and dis
cussion about the evolution of sulfur forms during pyrolysis.

54
2.0'---~-'--~- .....-~---r-~----,--~-,
1.6c
.~
~~ 1.2oE
~
~ 0.8oE~z
0.4
a Carbono Hydrogen6 Oxygen+ NitrogenV Sulf';lr
++ +_+_+ NitrOQen
~ n 0 "':--co,oo.
----===-0.::::::::::::::::::::;;::....oro--.;-- -------- Sulfur
Hydro;.nOX)'Qen
01,,300=--~--;;5~OO:;;--~-...,7;!OO;;,--~--9n.0!;;0---~-""~OO"-~-.,,3.:00
Pyrolysis temperature (OC)
Fig. 4.10. Char composition vs. temperature for a hvc bituminous
coal "Ohio No.2" at 20s pyrolysis time (source: ref. 70).
2.0.---~--,---~--r----,---~---r-~-,
1.6
~~ 0.8oE~z
0.4
o Corbono HydrogenA Oxygen+ NitrogenV Sulfur
0 0 0 0 0 0 02 +__ Hydrogen
~+
*:=a-e --= ~~:~U:n- ~ i:I 'il • Oxy;en
l>Nitrogen
l>
0l,,30"'0:-~--;5~O"'O-~----,7;!0;;;O,-~-,-900;;;;;----~-"";;00"-~-;i.,300
Pyrolysis temperature (OC)
Fig. 4.11. Tar composition vs. temperature for a hvc bituminous coal"Ohio No.2" at 20s pyrolysis time (source: ref. 70).

2.0r--=-..,--~--,--~--r----..,-----,
5G
1.6
1.2
."~ 0.8
E<;z
0.4
o
~8 e0:=:4= ~o 0
o S(Ql chor
o SIT) chort::J. SIT) la,+ SITlgosV S(FeS.)
S(FeS.lSlTlchor
§ ~~:~~~~~r8
Fig. 4.12.
coa1 (Ohi 0
o3';-;0"'0-~----;5c!:OO::-~--<:!:7"'00:<r-~--9:J.0"'0-~-"""c!:0::-0-~-c:'130'O
Pyrolysis temperature (OC)
Distribution of sulfur in pyrolysis products of
No.2) vs. temperature at 30s; 0: organic, FeS :xiron, T: total (source: ref. 70).
2.0r-----,--~--,__-~-_,_-~--,_-~-_,
a hvc bituminous
as sulfide of
===:::=:...>l.--,OQ....-<o,..':::"_-cor-->OL-...J0;L. To,
c 1.6
~~c~ 1.2
.~c
."
".~ 0.8oE<;z
o Charo Tor~ Gas
oo Q.-",,<:>---O--;:;8-- Chor
0.4 Go.
0~30::;O;--.....::==:;;5£OO;::===::::;70~0~~:..---;;9;';;OO"-~-~,,~OO;;-~~-J1300Pyrolysis temperature (OC)
Fig. 4.13. Distribution of nitrogen in pyrolysis products of a hvc bituminous
coal (Ohio No.2) vs. temperature at 30s (source: ref. 70).

56
Figure 4.1~ is an example of the nitrogen distribution in char, tar and gases
(ref. 70). The normalized nitrogen in the tar is close to unity indicating that
evolving tar molecules contain nitrogen functional groups in the same abundance
as in the coal. Char, on the other hand, contains a larger amount of nitrogen
while the gases a correspondingly lower amount.
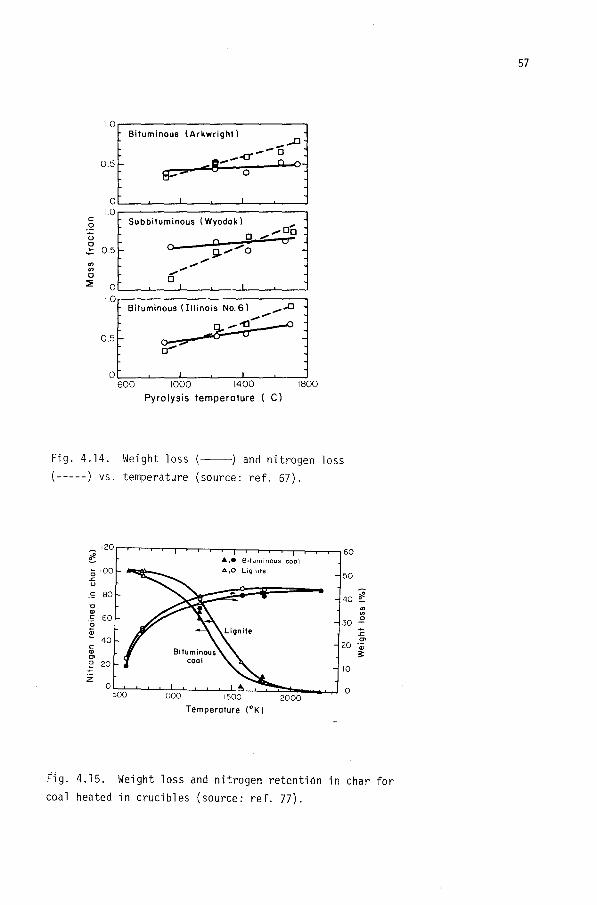
The evolution of nitrogen at higher pyrolysis temperatures typical of pulver
ized combustion has been studied by Blair et al. (ref. 67) and Pohl and Sarofim
(ref. 77). Figure 4.14 shows weight loss and nitrogen loss as a function of temp
erature,clearly indicating the significant decrease in the nitrogen content of
char. Figure 4.15 shows the ultimate weight loss and nitrogen in the char as a
function of temperature for coals heated in crucibles. Although these experiments
involve slow heating they clearly show the nitrogen content to decline to almost
zero as the temperature increases from 1000 to 2000°C.
The interpretation of the results shown in Figs. 14 and 15 is quite straight
forward. Below 1000°C nitrogen evolves only with the tar while the gases are
almost nitrogen free. As a result the char is gradually enhanced in nitrogen.
Above 1000°C various forms of ring nitrogen in the char decompose with the evolu
tion of products such as HCN resulting in a decrease of the nitrogen content.
In addition to the elemental analysis of char and tar, Solomon (ref. 78) and
Solomon and Colket (ref. 79) obtained Fourier transform infrared spectra and
13C_lH cross polarization nmr spectra. Figures 4.16 and 4.17 are reproduced from
this work. An inspection of Figure 4.16 shows the infrared spectra of coal and
tar to be remarkably similar indicating similar types and concentrations of bonds.
Figure 4.17 shows the nmr spectra of coal, tar and low temperature «lOOO°C) char,
in each case the broad peak representing aromatic and the narrow peak aliphatic
carbon. Coal and tar have identical values for the aromaticity fa while char a
somewhat higher value. The spectrum for the liquid product, tar, has considerably
more detail than the spectra for the solid materials.
Further characterization of the chemical structure of tar was carried out by
Gavalas and Oka (ref. 7). Three coals characterized in Table 4.1 were subjected
to pyrolysis under vacuum at 500°C for 30s. The tar collected was separated by
gel permeation chromatography into three molecular weight fractions: L(>lOOO),
M(700-1000) and S(300-700). Each fraction was characterized by lH nmr and elemental
analysis. The results are shown in Table 4.2 along with corresponding results
for tetrahydrofuran extracts of the same coals.
A perusal of Table 4.1 shows coal to be closer in elemental composition to its
tar than its extract especially when the CO 2 evolved at 500°C is deducted when
computing the elemental composition. Tar has essentially the same carbon content
as the coal but somewhat higher hydrogen and slightly lower oxygen contents. The
extracts on the other hand have substantially lower oxygen content.
1.0Bituminous (Arkwright)
_.-0--0<e;"-..a 0 0
s-> 0
I I
SUbbituminous (Wyodok).... 00
0-0 .... a
0-- 9- ........0........--0
0.5
o1.0
cou
~ 0.5
ol-_.L.----,-,,-':::-:-_-L.-~~--'-----:~600 1000 1400 1800
Pyrolysis temperature ( C)
Fig. 4.14. Weight loss (----) and nitrogen loss(-----) vs. temperature (source: ref. 67).
12060
~ A,. Bituminous cool
0 10050.s::
u
c: 80 40 ~"0
'"Ql '"c: 60 30 E'0~ :c
40 C'
c: 20 QlQl
~C'
~ 20 10Z
0
Fig. 4.15. Weight loss and nitrogen retention in char forcoal heated in crucibles (source: ref. 77).
57

3200 2400 1600 800
Wavenumber (em-I)
Fi g. 4.17. Infrared spectra of a hva
bituminous coal, its tar and low temperature char (source: ref. 79).
ref. 79).
58
Cool
40 Cool
30
20
10
fo : 0.73 ~ 0!!...
Tor f1I 50 Tor-c: 40:::I
>- 30- II)
f1I <.J20c: c:
II) 0- .0 10c: ...
0 0f1I.0ct 40 Low-T chor
Low-T chor
<5 (ppm)
Fig. 4.16. 13C_1 H cross-polarization
spectra of a hva bituminous coal, its
tar and low temperature char (source:
Th~ lH nmr data of Table 4.1 reveal that more than two-thirds of the hydrogen
is in aliphatic form. However, the split between Ha(alph~ and HS+(beta or furtherfrom the ring) varies with the rank of the coal. The H
S+ predominates in the
subbituminous coal indicating long chains or hydroaromatic structures while
Har+o' Ha and HS+ are present in about the same amounts in the two bituminouscoals.
The molecular weight data of Table 4.2 show the middle fraction (M) to comprise
about half of tar and extract. At the same time, the heavy fraction (H) is more
abundant in the extract while the light fraction (L) is more abundant in the tar.

59
TABLE 4.1E1 ementa1 composition of coa1s(daf), extracts and pyrolysis products (source:
ref. 7).
C H N S O(diff)
Subbituminous C, c 72 .1 5.00 1.28 0.85 20.7
Hyoming Monarch cc 75.2 5.35 1. 36 0.91 17.2
Seam, e 77 .8 8.75 1.28* 0.85* 11.4
PSOC 241 P 74.8 8.0 1.28* 0.85* 15.1
c 75.7 5.8 1.60 2.89 14.1
HVC Bituminous, cc 76.2 5.85 1. 62 2.93 13.4
Kentucky No.9 Seam e 82.1 7.4 1.60* 2.89* 6.0
p 76.1 7.1 1.60* 2.89* 12.3
c 85.9 5.75 1.48 0.74 6.2
HVB Bituminous, cc 86.0 5.75 1.49 0.74 6.0
H. Virginia e 87.5 7.3 1.48* 0.74* 3.1
P 85.9 7.25 1.48* 0.74* 4.7
c coal, dry-ash-free; cc coal after subtracting CO2 evolved by pyrolysis
at 500°C for 30s; e coal extracts; p coal pyrolysis products.
* Assumed for the purpose of estimating the oxygen content.

60
TABLE 4.2
Elemental analysis, molecular weights and nmr data for extracts and pyrolysates
(source: ref. 7).
Sub- HVC HVB
bitumi nous Bituminous Bituminous
Extract (wt %)a 4.5 8.0 1.6
Pyrolysis (wt %)b 6.0 19.1 10.5
GPC* (%)0 L 32 26 36 20 32 27
M 54 48 48 49 44 42
S 14 26 16 31 24 31
(%)d
H 20 23 32 34 32 371H nmr
exHIH 68 58 40 33 37 31
Har+O 12 19 28 33 31 32
(%)e13C nmr C 42 58ar
Cal 58 42
(%)C 76.1 75.6 81. 3 75.1 85.7 85.8
L H 8.9 8.1 7.8 7.1 6.9 6.7C 77.5 73.7 81.5 76.5 87.6 85.9
M H 8.7 8.3 7.1 7.1 7.6 8.0
C 82.6 76.1 85.5 - 89.5 85.9S H 8.5 7.3 7.4 7.2 6.7-
a~O.5; b.:t:.l . 5; c.:t:.l; d.:t:.2; e.:t:.2
* L,M,S: fractions with molecular weights >1000,700-1000, and 300-700

61
4.2.4 Effects of pretreatment and atmosphere of pyrolysis
Studies of pretreatment involve exposure to some agent at specified tempera
ture and time, followed by pyrolysis in an inert gas, as usual. By limiting the
temperature and residence time, the extent of thermal decomposition reactionsduring pretreatment can be minimized. Howard (ref. 80) has reviewed several
early publications on pretreatment by nitric oxide, steam and oxygen. Pretreat
ment by nitric oxide at about 3000 C (ref, 81) led to a modest loss of hydrogen,a modest gain in oxygen and nitrogen and a substantial loss in the proximate
volatile matter. The swelling and agglomerating properties of the coal weresignificantly reduced. Nitrous oxide had similar properties while nitrogen
dioxide reacted much faster, even at lower temperatures, and oxidized the coalmore extensively.
Pretreatment by steam has not shown any noteworthy effects. Heating a ligniteat about 3000 C in the presence of steam (ref. 80) produced slight decrease of
weight loss and slight change of product distribution from the subsequent
pyrolysis.
Pretreatment in oxygen has long been studied as a means of reducing the
swelling and agglomerating properties of coal and is, in fact, a necessary step
in some of the gasification processes currently under development. Howard(ref. 80) has summarized early studies showing that pretreatment by oxygen
increases the yield of carbon oxides and water formed in the subsequent pyrolysiswhile it decreases the yield of tar and reduces or eliminates swelling and
agglomeration. The last effect was attributed principally to a change in the
surface of the coal which prevented particle agglomeration even when the particle
interior passed through a plastic phase. Forney et ale (ref. 82) found thattreatment with a gas containing Oe2% oxygen at 400-425 0 C for five minutes drasti
cally reduced swelling and eliminated agglomeration of a caking coal. Underthese conditions, substantial devolatilization could not be avoided, McCarthy
(ref. 83) found that pretreatment in an atmosphere of 2-10% oxygen at 4000 C for
a few seconds similarly greatly reduced agglomeration of a caking bituminous
coa 1.
A comprehensive study of the effect of preoxidation on subsequent pyrolysis
and the properties of the resulting char was conducted by Mahajan et al. (ref.84). A strongly caking coal was heated in air at 120-2500 C for a few minutes
to four hours. The weight gain during this treatment increased with temperature
and time, not exceeding 6.5% under the most drastic conditions. Figure 4.18 showsthe weight loss of coal at different levels of prexidation as a function of
pyrolysis temperature. The level of preoxidation was in all cases fully characterized by the percentage weight gain without reference to temperature and dura
tion of the oxidative pretreatment. Below 4500 C the level of preoxination has

62
40.-----------------,
30
-:.e°~
CIICII
E 20-.t:.coCII
~
10
Ol--"~-.L_....L-_..L-_L..----L_.....L.._...L----I
200 400 600 800 1000
Pyrolysi 5 temperature (OC)
Fig. 4.18. Pyrolysis weight loss vs. preoxidationlevel for a caking bituminous coal psoe 337; weightgain during preoxidation (%) • none, 0 0.45,. 0.75,o 1.4, &2.4,6. 7.0 (source: ref. 84).
little effect on the weight loss of pyrolysis but above 4500 e the weight loss
decreases with the preoxidation level. The results shown in Fig. 4.18 are by
no means representative of all caking coals. Working with another caking coal,the authors found a more complex dependence of the pyrolysis weight loss on the
level of preoxidation. At pyrolysis temperai:ures less than 5000 e, the weight
loss increased ~/ith the level of preoxidation but above 5000e the variation
became erratic. The complex dependence of weight loss was attributed to thefollowing competing factors. Addition of oxygen produces functional groups,
such as carboxyl, which during pyrolysis evolve carbon oxides and water making
a positive contribution to the weight loss. At the same time, the production ofcarboxyl and other oxygenated groups reduces the amount of hydrogen that would
otherwise be available for tar generation. To this explanation, one must add that
increased water evolution during pyrolysis increases the degree of crosslinking
leading again to lower tar yield. In addition to the changes in the weight loss,
the chars of preoxidized coals had more open structure, sharply higher e02 surface area, and moderately higher reactivity in oxygen.
The pyrolysis experiments discussed until now were all obtained either under
vacuum or under an inert gas such as nitrogen or helium. Pyrolysis in a hydrogen
atmosphere - hydropyrolysis - is important in its own right and will be examined
separately in chapter 7. Pyrolysis in an oxygen atmosphere is an important

63
part of combustion. It is generally believed that oxygen does not affect the
primary devolatilization reactions, although it rapidly oxidizes the volatiles
in the surrounding gas provided tiie temperature is sufficiently high as in a
combustion furnace. Only subsequent to the rapid volatile release, is oxygen
able to reach and oxidize til? cliQr particles. The effect of oxygen at lower
particle temperatures or when the surrounding gas is cold has not been studied
as such.Pyrolysis in H20 and CO2 is of some interest but has received very little
attention. Jones et al. (ref. 85) compared the fluidized pyrolysis of a wet
(20% moisture) or predried subbituminous coal in nitrogen or steam with the
results shown in Table 4.3. The term "liquor" in the table indicates the
aquous phase containing the chemical water of pyrolysis along with small amounts
of phenolic compounds.
TABLE 4.3
Effect of moisture and fluidizing gas on product yields from the pyrolysis of
a subbituminous coal at 14000 F in a fluidized bed (ref. 85).
As received Dried at 3000 F
Feed moisture % 20 20 0 0Fluidized gas N2 H2O N2 H2OYields (% dry basis)
Char 54 0 6 53 0 56.0 53.1
Tar 1l.8 11.0 0.0 9.7
Liquor 7.0 8.7 9.6 11.4
Gas 26.6 27.3 25.4 25.8
The results of Table 4.3 indicate that the tar yield is slightly higher from
the moist (as received) coal irrespective of the fluidizing gas. The total
weight loss is slightly higher for the moist coal or when steam was the fluid
lZlng gas. Although the differences are small and subject to some scatter, onemight venture the following conclusion. Drying coal induces changes in the
pore structure or the chemical structure that reduce tar and gas production in
subsequent pyrolysis. The observed increase in the yield of liqu"id (chemical
water) when steam is the fluidizing gas is rather puzzling and might be due to
errors in the material balances. The nature of the fluidizing gas seems to have
little effect on the yields of tar and gases suggesting little effect on secondary
tar-cracking reactions. Further discussion on the possible effects of H20 orCO2 on secondary reactions will be given in a subsequent subsection dealing with
the pyrolysis process of the Occidental Research Corporation.
64
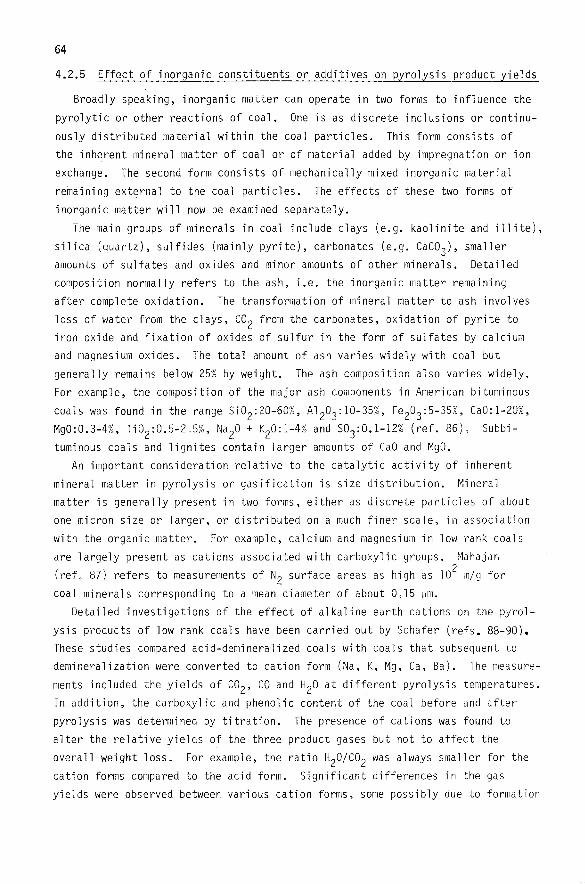
4.2.5 Effect of inorganic constituents or additives on pyrolysis product yields
Broadly speaking, inorganic matter can operate in two forms to influence the
pyrolytic or other reactions of coal. One is as discrete inclusions or continu
ously distributed material within the coal particles. This form consists of
the inherent mineral matter of coal or of material added by impregnation or ion
exchange. The second form consists of mechanically mixed inorganic material
remaining external to the coal particles. The effects of these two forms of
inorganic matter will now be examined separately.
The main groups of minerals in coal include clays (e.g. kaolinite and illite),
silica (quartz), sulfides (mainly pyrite), carbonates (e.g. CaCO~), smallerJ
amounts of sulfates and oxides and minor amounts of other minerals. Detailed
composition normally refers to the ash, i.e. the inorganic matter remaining
after complete oxidation. The transformation of mineral matter to ash involves
loss of water from the clays, CO 2 from the carbonates, oxidation of pyrite toiron oxide and fixation of oxides of sulfur in the form of sulfates by calcium
and magnesium oxides. The total amount of ash varies widely with coal but
generally remains below 25% by weight. The ash composition also varies widely.
For example, the composition of the major ash components in American bituminous
coals was found in the range SiOZ:ZO-60%, A1 Z03:10-35%, Fe Z03:5-35%, CaO:1-Z0%,
MgO:O.3-4%, TiOZ:O.5-Z,5%, NaZO + KZO:1-4% and S03:0.1-1Z% (ref. 86), Subbi
tuminous coals and lignites contain larger amounts of CaO and MgO.
An important consideration relative to the catalytic activity of inherent
mineral matter in pyrolysis or gasification is size distribution. Mineral
matter is generally present in two forms, either as discrete particles of about
one micron size or larger, or distributed on a much finer scale, in association
with the organic matter. For example, calcium and magnesium in low rank coals
are largely present as cations associated with carboxylic groups. Mahajan
(reL 87) refers to measurements of NZ surface areas as hi gh as 102 m/ g for
coal minerals corresponding to a mean diameter of about 0 0 15 ~m.
Detailed investigations of the effect of alkaline earth cations on the pyrol
ysis products of low rank coals have been carried out by Schafer (refs. 88-90).These studies compared acid-demineralized coals with coals that subsequent todemineralization were converted to cation form (Na, K, Mg, Ca, Ba). The measure
ments included the yields of COZ' CO and HZO at different pyrolysis temperatures.
In addition, the carboxylic and phenolic content of the coal before and afterpyrolysis was determined by titration. The presence of catlons was found to
alter the relative yields of the three product gases but not to affect the
overall weight loss. For example, the ratio H20/COZ was always smaller for the
cation forms compared to the acid form. Significant differences in the gas
yields were observed between various cation forms, some possibly due to formation

65
of cyanide compounds by reactions of the cation with the carrier nitrogen. Com
parisons between the COZ' CO evolved and acidic content of the coal led to the
conclusion that CO2 derives from carboxyl groups and CO derives from phenolic
grou~s. Water was presumed to derive from some unidentified oxygen group
associated with carboxylic groups. These conclusions are at some variance withthe work of Brooks et al. (ref. 46) discussed in section 3,7. In a subsequent
investigation of the flash pyrolysis of various low rank coals Tyler and Schafer
(ref. 91) found that the presence of cations had profound effect on the yieldsof tar, C1-C3 hydrocarbons and total volatile matter. Removal of cations present
in the coals by acid wash increased the yield of tar by ao much as a factor of
two but had small effect on the yield of hydrocarbon gases. Conversely, addi
tion of calcium ions to the acid-form led to decreased tar and total volatile
matter. The fact that the change of the tar yield is not accompanied by a cor
respondfng change of the yield of gases suggests that the effect of cations is
not manifested via secondary tar-cracking reactions. Instead it was suggested
that the cations might supress tar evolution either by restricting the micropore
structure, or by catalyzing the recombination of metaplast molecules beforevolatilization could take place.
Mahajan and \Jalker (ref. 9Z) studied the effect of demineralization by acid
treatment on the NZ and COZ surface areas of a number of coals and their carbon
ization chars. Very divergent trends were observed among the various coals with
the surface areas in some cases increasing, in others decreasing and with NZ and
CO2 areas not necessarily changing in the same direction. Changes in the porousstructure can certainly affect tar evolution but the evidence to date is clearly
insufficient for firm conclusions. The alternative explanation based on thechemical role of mineral components is certainly plausible, especially consider
ing that the acid treatment of coal to remove cations could also remove or
modify the acidity of clay minerals. Such clays might play some role in tar
forming reactions via carbonium ion mechanisms. Further work to delineate the
pyrolytic behavior of cation exchanged coals is desirable especially in viewof the potential use of cations as catalysts or sulfur scavengers for gasifica
tion and combustion.
The effect of inorganic additives in the form of powders mechanically mixed
with coal has also been examined. Yeboah et al. (ref. 93) studied the product
yields from a bituminous coal and a lignite pyrolyzed in a fluidized bed in the
presence of calcined dolomite particles, The presen~e of the dolomite resulted
in decreased tar yield and increased gas yield in all cases. These changes are
clearly due to secondary tar cracking reactions on the surface of the dolomite
particles.
A different mode of introduction of inorganic additives was investigated by
66
Franklin et al. (ref. 94). A Pittsburgh No.8 bituminous coal was demineralizedby extraction with a HF-HCl solution and co-slurried in water for for 24 hours
with extremely fine particles (0.1 ~m) of calcium carbonate or calcium oxide andcalcium carbonate. This pretreatment led to the incorporation of about 20%
calcium carbonate. While the form of the added material was not determined, itprobably consisted of particles coating the surface or penetrating the larger
pores of the coal with smaller amounts incorporated on a finer scale by associa
tion with th~ acidic functional groups of coal. The demineralized coal and thecalcium-treated coal were sJbjected to rapid pyrolysis by the captive sample
procedure with the follow~,~g results. Addition of calcium resulted in substantially lower tar yield (20% versus 30%) and lower yield of light hydrocarbon
gases, especially at temperatures above 11000 K. At the same time, calcium
treated coals gave considerably higher yields of carbon monoxide, carbon dioxideand water. The overall weight loss in the calcium treated coal was decreased
at temperatures above 900 0 K. The decreased yield of tar was attributed tosecondary reactions of cracking and repolymerization catalyzed by the calcium
additive. Such reactions would normally increase the yield of light hydrocarbons.
That the yield of these hydrocarbons actually decreased, could be explained by
the calcium additive catalyzing the further cracking of methane, ethane, etc.
to carbon and hydrogen. Much of the increase in the yield of carbon dioxidewas shown to result from the decomposition of calcium carbonate to calcium
oxide, a reaction catalyzed by the carbon surface. On the other hand, the in
creased yield of carbon monoxide was attributed to the decomposition of phenolic
groups in the coal structure.
4.2.6 Miscellaneous techniques and results
In this subsection we review some additional pyrolysis studies which did notfit properly in the previous sections, A number of early studies employed thermo
gravimetric analysis with very low heating rates, a few degrees per minute. The
other group of studies employed heating by light, laser light, or plasma arc
achieving very high heating rates.A thermal balance is an apparatus providing continuous measurement of the
weight of a static sample under the flow of a carrier gas and linearly risingtemperature. Waters (ref, 95) described some early thermal balances and dis
cussed weight loss curves from coal pyrolysis, van Krevelen et al. (ref. 96)
used a thermal balance of the torsion type to correlate weight loss with plastic
properties. Figure 4.19 shows some typical weight loss curves obtained with a
low volatile bituminous coal. The chief features of these curves are (i) The S
shape of the cumulative weight loss. The initial acceleration of the curve,
observed also in section 4.2.1, could be due to consecutive reactions or the
solubility of some pyrolysis products in the coal melt. (in The temperature

67
of maximum devolatilization rate increases with increasing heating rate. More
recently, Ciuryla et al. (ref. 97) employed a modern thermobalance to study theweight loss of coals of different ranks under heating rates 40-1600/min. As
in earlier studies, maximum rate of devolatilization increased with heating
rate. The cumulative yield ata final temperature of laaaoC was found inde
pendent of the heating rate, in agreement with the studies reviewed in theprevious subsections. The weight loss data were fitted successfully by the
Pitt-Anthony model of distributed activation energies.
The principal advantage of the thermogravimetric technique is the continuous
and accurate weight measuremento Its chief disadvantages is the inability tooperate at high heating rates and constant temperatures and the difficulty to
measure accurately the sample temperature. Isothermal operation must always be
II 0.11
~a ~
~ 9.~-° ~u
III 7 ~o......III :§aeE 0.6
5 0.8 --- 1.2 c:.s:::. 2.5 ~ III0> 4.9 ~ III
"Qi 3 6.8~ 0--:t °C/min:!::a
0.01
400 500 600 400 500 600
Temperature (Oe l Temperature (Oel
Fig. 4.19. Thermogravimetric analysis of a 10 volatilebituminous coal. Cumulative (a) and differential (b)weight loss v~. temperature at different heating rates(source: ref. 96).
preceded by a period of slow linear heating. With current commercial models,
the sample size can be varied from a few milligrams to about a gram. With largesample size, the sample t~mperature is uncertain and secondary reactions may
become important. Using a small sample size and a sweep gas minimizes secondary
reactions but renders product analysis difficult. In fact, none of the aforementioned studies measured individual product yieldso Combination of continuous
and accurate weight measurement with continuous analysis of gaseous products by
infrared and flame ionization detectors seems a most promising technique despite
the restriction to low heating ratesoThe kinetic feature of constant and slow heating rates has been employed
without the gravimetric capability, simply by placing the coal sample in afurnace under the flow of a sweep gas. Using a suitably large sample, of the

68
order of one gram, it is relatively straightforward to measure the instantaneous
rate of generation of individual gaseous species at the cost, of course, of
allowing secondary reactions on the particle surface. Experiments of this type
have been carried out by Fitzerald and van Krevelen (ref. 98) and Juntgen and
van Heek (ref, 66).
Investigation of pyrolysis in the context of pulverized combustion requires
very high heating rates in the range of 20,000 - 100,000 °C/s. One experimental
technique for achieving such rates in a small scale apparatus is the irradiation of
coal with ordinary or laser light. Sharkey et al. (ref. 99) irradiated coal
in the form of 3/8" cubes or a fine powder with light from a xenon lamp or a
ruby laser operating at specified power levels. The coal temperature attained
under these conditions could not be determined but was estimated to be in excess
of 10000 C. The product yields obtained under irradiation compared to those
obtained under ordinary carbonization showed much higher contents of acetylene
(absent in carbonization) and carbon oxides and sharply lower content of methane.
These results were attributed to the higher temperatures prevalent under irradia
tion" However, the yields of hydrocarbons other than methane and acetylene
exhibited irregular and on the whole obscure variations. Evidently, secondary
reactions in the gas phase, as well as in the solid phase, are responsible for
the overall product distribution.
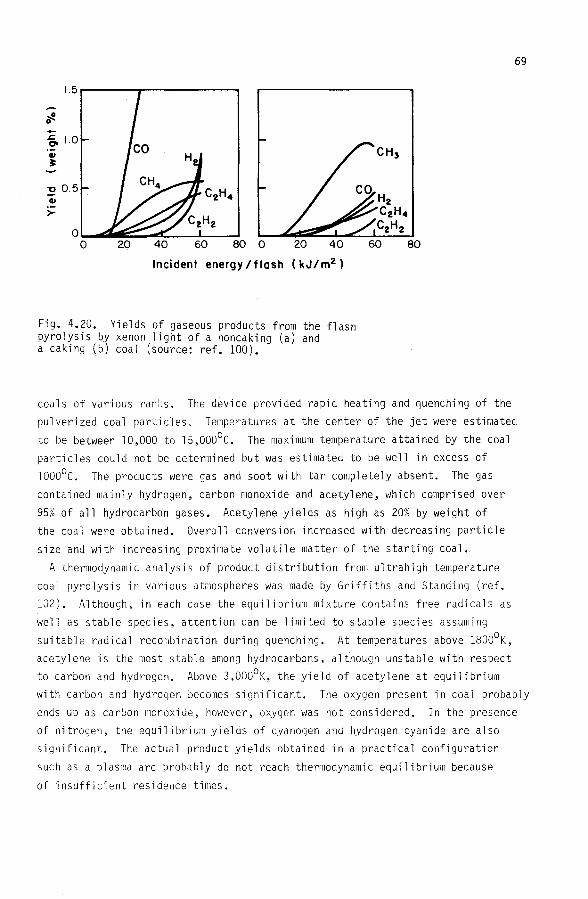
Granger and Ladner (ref. 100) analyzed the gaseous products of several coals
under irradiation from a xenon lamp with and without a filter to remove the UV
component of the light. Their small scale apparatus allowed variation of the
incident energy and their analysis included gaseous products, i.e. carbon oxides
and light hydrocarbons. Water was not determined and tar was estimated rather
crudely. Figure 4.20 shows the major pyrolysis products versus total incident
energy. The principal feature of the results is the rapid increase in hydrogen,
acetylene and carbon monoxide with increasing light intensity. The rapid
increase in carbon monoxide is easily accounted by the fact that this gas is the
only oxygen-containing product after the evolution of carbon dioxide has been
completed in the initial phases of pyrolysis. The latter gas was actually
absent, evidently being converted to carbon dioxide and carbon at the high tem
peratures of the experiment. The yield of tar was found to pass through a
maximum as a result of secondary cracking reactions. The results of Fig. 4.20
were obtained using UV-filtered radiation, Unfiltered light resulted in decreased
yields of olefins and paraffins and increased yields of carbon monoxide, hydrogen,
acetylene and soot. These changes indicate the presence of photochemical crack
ing reactions in the gas phase.
A technique for heating coals at very high temperatures and heating rates is
the plasma arc. Bond et al. (ref. 101) used an argon plasma jet to pyrolyse
69
1.5
~
::.e0-.c. 1.0C'
CI>~
"00.5CI>
>-
o~lII:IIII~~~----:ll:---:l.o 20 40 60 80 0 20 40
Incident energy / flash (kJ/m2 )
Fig. 4.20. Yields of gaseous products from the flashpyrolysis by xenon light of a noncaking (a) anda caking (b) coal (source: ref. 100).
coals of various ranl:s. The device provided rapid heating and quenching of the
pulverized coal particles, Temperatures at the center of the jet were estimated
to be between 10,000 to 15,0000C. The maximum temperature attained by the coal
particles could not be determined but was estimated to be well in excess of
10000C. The products were gas and soot with tar completely absent. The gas
contained mainly hydrogen, carbon monoxide and acetylene, which comprised over
95% of all hydrocarbon gases. Acetylene yields as high as 20% by weight of
the coal were obtained. Overall conversion increased with decreasing particle
size and with increasing proximate volatile matter of the starting coal.
A thermodynamic analysis of product distribution from ultrahigh temperature
coal pyrolysis in various atmospheres was made by Griffiths and Standing (ref.
102). Although, in each case the equilibrium mixture contains free radicals as
well as stable species, attention can be limited to stable species assuming
suitable radical recombination during quenching. At temperatures above 1800oK,
acetylene is the most stable among hydrocarbons, although unstable with respectto carbon and hydrogen. Above 3,OOOoK, the yield of acetylene at equilibrium
with carbon and hydrogen becomes significant. The oxygen present in coal probably
ends up as carbon monoxide, however, oxygen was not considered. In the presence
of nitrogen, the equilibrium yields of cyanogen and hydrogen cyanide are also
significant. The actual product yields obtained in a practical configuration
such as a plasma arc probably do not reach thermodynamic equilibrium because
of insufficient residence times.

70
4.3 PYROLYSIS PROCESSES
Pyrolysis is 'the simplest means of upgrading coal to higher quality fuels.
Merely by heating, coal decomposes to gases, tar liquids and char. The gases
can be readily burned in an industrial furnace. The tar is the most valuable
product because it can be hydrotreated to clean liquid fuels. The char must be
utilized in an industrial or utility furnace or gasified to a low Btu or synthesis
gas. Because of its low content of volatiles char has poor ignition character
istics and may' require special burners or some other means of maintaining flame
stability. It can always be burned in a fluidized furnace.The simplicity of the basic flow sheet of pyrolysis as a coal conversion proc
ess obscures a number of mechanical difficulties that have slowed down its commer
cial development. Chief among these difficulties is the caking and agglomer
ating properties of high volatile bituminous coals upon heating. Those very
coals are also the most interesting for their high yield of tar liquids. Rapid
heating of coal in a configuration that limits the extent of secondary reactions
is another difficulty that has not been entirely overcome. Finally,collecting
tar liquids and removing suspended fine solids is also a problem, common to other
coal conversion processes. The two processes discussed below have at least par
tially overcome the mechanical problems associated with rapid heating and agglom
eration.
4.3.1 The COED process (refs. 103-105)The COED process (Char-Oil-Energy-Development) was developed by FMC corporation
under contract from the office of coal research (subsequently absorbed into ERDA
which in turn was absorbed into the department of energy). The development effort
reached the stage of a 36 ton-per-day pilot plant tested in the period 1971-1973.
Since then, research and development activities were redirected to a related gas
ification process (COGAS) under private sponsorship.
The central part of the process is shown in the schematic diagram of Fig. 4.21.
Coarsely ground coal «1 mm diameter) is dried and fed to fluidized bed I operating
at 600°F with hot combustion gases. The volatiles from I flow to the product re
covery system while the char is carried to fluidized bed II operating at 850°F and
subsequently to fluidized bed III operating at 1000°F. Char from stage III is
carried to fluidized bed IV (1600°F) where it is partially burned with oxygen.
Hot char from stage IV is recycled to stage III to provide part of the required
heating. The effluent gases from stage IV provide additional heating as well as
fluidizing for stage III. The hot product gases from stage III in turn provide
the heating and fluidizing medium for stage II. The gaseous and liquid products
from stages I and II are separated. Part of the gases is burned to provide the
fluidized medium for stage I, the remainder collected as an end product of the

71,.
recycle gas
5to gel 1-+-°"";'-,0,,,-,",,-'-"Ii",o,,,,oc_.J Pra duet
:~~~~~try Recovery I-------~coed gas
cool
'----------oil to hydrotreoting
,----~vent
steam
product char
oxygen recycle gasfrom Stage Iproduct recovery
Fig. 4.21. The COED process flowsheet (source; ref. 103).
process. The product liquids are hydro treated to clean liquid fuels for station
ary or portable powerplants.
Carrying out the pyrolysis in four coupled fluidized beds provides the re
quired heating and at the same time prevents caking and agglomeration. As coal
(or char) progresses through stages I-IV its caking temperature increases due to
the successive loss of volatiles. Thus maintaining the temperature of each stagelower than the caking temperature of the fluidized char prevents its softening
and agglomeration. On the other hand, the prolonged contact of volatiles with
the fluidized char result in extensive secondary reactions. Another adverse
factor in terms of secondary reactions is the relatively large particle size.
Compared to the tars produced in the laboratory reactors described in section 4.1,
the COED liquids are produced at lower yields and have lower boiling points and1ess polar character, whence the term "oil s" •
A ton of high volatile bituminous coal treated by the COED process yields
about 1.4 barrels of oil or about 18% by weight, well below the 30-50% laboratory
yields by the captive sample technique. The other products from one ton of coal
are char, about the same as the ASTM proximate analysis, and 8000-9000 scf of
gases of heating value about 540jscf. The relatively low yield of liquid products

72
is probably the main reason why the COED process has been dropped from the small
list of liquefaction processes scheduled for commercialization.
4.3.2 The Occidental Research Corporation (ORC) process (ref. 106)
The ORC process has been under development since 1969. The original experi
mental work at the laboratory scale was internally funded. Subsequent work util
ized the laboratory unit and a three ton-per-day process development unit which
was tested in· the period 1976-1978 under contract to the department of energy.
A schematic of the ORC process flowsheet is shown in Fig. 4.22. Coal is pul
verized (median size 20-40 ~m), dried and pneumatically transported to the pyroly
sis reactor where it is mixed with hot recycle char. Solids and gases move co
currently downward through the reactor and are collected in a cyclone. The solid
stream from the cyclone is split in two parts. One part is carried to an entrained
flow vessel for partial burning and recycling to the reactor. The remainder is
removed as the product char. The volatiles from the cyclone are rapidly quenched
and separated into a fuel gas and a liquid product which after hydrotreating pro
vides the main process product .
.---------------. Combustion Gas
Air
CoolFeed
CharBurner
,-----Gas
Oil Collection System
Fuel
I---Char ProductDesulfurization Plant
Fig. 4.22. Schematic of the ORC pyrolysis process (source: ref. 106).

73
Some of the key operating parameters in the reactor are temperature (1000
l400°F), pressure (5 psig) and ratio of recycled char to coal, about 10: 1. The
results from the bench scale reactor (BSR) and the pi 1ot plant or "process de-
ve1opment uni t" show some important di fferences and wi 11 be di scussed separately.
The bench scale unit consisted of an externally heated entrained flow reactor.
Recycle char was not used in this system since the main objective was to deter
mine the dependence of product yields on temperature and residence time. Figure
4.23 shows the yields of the major pyrolysis products as functions of temperature
for two residence times, 1.5s and 3s. The mcst interesting feature of the figure
is the maximum in the tar yield at about 1200"F. The maximum yield of about 20%
is twice the amount obtained in the standard Fischer assay. As the temperature
increases beyond 1200"F the tar yield declines, evidently due to secondary re
actions occurring homogeneously or on the reactor walls.
90,-----,-----r--..----,----.----,
-- 1.55---3.05
..................
.... .............. ....
"" .............. Char
'..
80
10
uOJ 20
-0
2a..
LL<J:o 70
if!.
.<: 600'Q)
3- 50-0
OJ 30
OL--~---':-c:--~-_=':_=-----~-~900 1100 1300 1500
Reactor temperature (O F)
Fig. 4.23. Product yields vs. temperature from
the pyrolysis of a subbituminous coal in the BSR
(source: ref. 106).

74
Pyro1yzing the subbituminous coal in the process development unit under simi
lar operating conditions but with hot char recycle gave a surprisingly differentproduct distribution. The tar yield was limited to only about 7-10%, while charand gases were produced in increased quantities. Since the only essential diff
erence between the operation with the BSR and PDU was the presence of the recycle char, the difference in the tar yields was attributed to adsorption and
cracki ng on the char surface. To confi rm thi s exp1 anati on additi ona1 experiments
were performed with increased amounts of recycle char. Changing the char to coal
ratio from 10:1 to 40:1 was found to decrease the tar yield from 10% to 4%.
Continuing efforts to im~I':)ye the tar yield resulted in an unexpected finding.When the inert N2 carrier was replaced by CO2 or H20, the maximum tar yield fromthe PDU operation increased to 18-22%, a level identical to that obtained with
the BSR. This important and surprising result was attributed to the adsorption
of CO2 and H20 on the active sites of the char's surface which would otherwise
catalyze the cracking of tar molecules. In other words, CO2 and H20 competewith tar for the same active sites on the char's surface.
40
I.L<ta 30::!0-.z=C'Q)
20~
"0Q)
>-... 100I-
00 5.0
Residence
Fig. 4.24. Tar yield vs. residence time from the pyrolysis of abituminous coal in the PDU (source: ref. 106).

75
The results discussed up to this point concern the pyrolysis of a subbituminous
coal. PDU experiments were also performed with a high volatile bituminous coal
(hvc, Kentucky No.9). Figure 4.24 shows the yield of tar as a function of temp
erature at two residence times. The maximum yield of about 38% would be quiteattractive on a commercial scale. The decline of the yield with increasing res
idence time is again due to secondary reactions. Surprisingly, the tar yield forthe bituminous coal was found to be essentially independent of the carrier gas(N2,C02,H20). The strikingly different behavior of the two coals has not beenexplained and certainly deserves systematic study.
At this point we return to an earlier observation that the caking and agglomerating properties of coal constitute the chief technical difficulty in the
commercialization of pyrolysis. The ORC process has approached the difficult
problems of coal agglomeration by a special design of the top part of the PDUreactor where the mixing of coal and recycle char takes place (see Fig. 4.25).Pulverized coal is injected by a jet of carrier gas in a surrounding stream of
hot recycle char descending downwards from a shallow fluidized region. It is
vital that the coal particles are heated rapidly to complete their caking phasebefore reaching the reactor walls. Small particle size and large char to coal
ratio are necessary for this purpose.
Char
t
1::::::::;==-Fluidizing Gas
Fig. 4.25. Device for injecting and mixing of coal and char
in the PDU (source: 106).

76
The reactor ,design shown in Fig. 4.25 was only partially successful. During
operation with the bituminous coal the PDU encountered flow instabilities limit
ing continuous operation to less than one day. A momentary decrease in the char
flow rate would cause the deposition of plastic coal particles on the injector
tip or the reactor walls. The resulting decrease in the cross section would in
turn further reduce the char flow rate and so o~ leading eventually to a complete
flow stoppage. Although improved designs evolved during the testing, a completely
satisfactory operation was not achieved.
Assuming that the mechanical difficulties will eventually be resolved, the
ORC process appears a most promising route to coal liquids by virtue of its
simple flowsheet and the high yield of tar.