pdf (full thesis) - california institute of technology
TRANSCRIPT

Thermoplastic Forming and Related Studies of the Supercooled Liquid Region of Metallic Glasses
Thesis by
Aaron Wiest
In Partial Fulfillment of the Requirements for the Degree of
Doctor of Philosophy
LOGO
California Institute of Technology
Pasadena, California
2010
(Submitted November 16, 2009)

ii
© 2010
Aaron Wiest
All Rights Reserved

iii
Acknowledgments
Dr. Johnson is a one of a kind advisor. He gives his students the freedom to pursue avenues of research that interest them and is always available to visit in his office (or on the roof) and provide valuable insight and scientific breakthroughs. He fosters an atmosphere of invention and trust and happiness and gave me the education I had dreamed of for graduate school. My thesis defense committee (Dr. Fultz, Dr. Ravichandran, Dr. Atwater, Dr. Conner) was thorough and insightful. They gave me good suggestions to improve the presentation of my work and I thank them for their time, knowledge and instruction during my time at Caltech. Many thanks to my fellow group members for sharing their latest breakthroughs and the excitement those discoveries bring. They were always there with equipment expertise, scientific know how and great conversation topics. My family is the best! They were always excited to hear about my work and often provided new ways of thinking about problems that led to the answers I needed. They cheered me on, understood my strange hours and even helped in lots of my midnight jaunts to the lab. Special thanks to my proof reader and best sounding board – my mom.
It has been a great four years!

iv
Abstract
The thermoplastic formability (TPF) of metallic glasses was found to be related to
the calorimetrically measured crystallization temperature minus the glass transition
temperature, Tg - Tx = ΔT. Alloy development in the ZrTiBe system identified a
composition with ΔT = 120 °C. Many alloys with ΔT > 150 °C and one alloy,
Zr35Ti30Be27.5Cu7.5, with ΔT = 165 °C were discovered by substituting Be with small
amounts of fourth alloying elements. The viscosity as a function of temperature, η(T),
and time temperature transformation (TTT) measurements for the new alloy are presented
and combined to create ηTT plots (viscosity time transformation) that are useful in
determining what viscosities are available for a required processing time. ηTT plots are
created for many alloys used in TPF in the literature and it is found that for processes
requiring 60 - 300 s, Zr35Ti30Be27.5Cu7.5 provides an order of magnitude lower viscosity
for processing than the other metallic glasses. Injection molding is demonstrated with
Zr35Ti30Be27.5Cu7.5 and the part shows improved mechanical properties over die cast
specimens of the same geometry. Changes of slope in η(T) measurements were observed
and investigated in some quaternary compositions and found to be present in ternary
compositions as well. Traditionally metallic glasses show a single discontinuity in heat
capacity at the glass transition temperature. Alloys with the changes in slope of η(T)
were found to show two discontinuities in heat capacity with the changes in slope of η(T)
roughly correlating with the observed Tg values. These two Tg values were assumed to
arise from two glassy phases present in the alloy. Further heat capacity analysis found
systematic trends in the magnitude of the heat capacity discontinuities with composition
and the single phase compositions of a metastable miscibility gap were discovered.

v
Microscopic evidence of the two phases is lacking so we must limit our claims to
evidence of two relaxation phenomena existing and can’t definitively claim two phases.
The alloy development led to the discovery of alloys with densities near Ti that
are among the highest strength to weight ratio materials known. Alloys with corrosion
resistances in simulated sea water 10x greater than other Zr based glasses and commonly
used marine metals were discovered. Glasses spanning 6 orders of magnitude in
corrosion resistance to 37% w/w HCl were discovered. Corrosion fatigue in saline
environments remains a problem for these compositions and prevents their utility as
biomaterials despite good evidence of biocompatibility in in vitro and in vivo studies.

vi
Table of Contents Copyright ii Acknowledgments iii Abstract iv Table of Contents vi List of Figures ix List of Tables xv Chapter 1 Introduction . . . . . . . . . . . . . . . . . . . . . . . . . . . . . . . . . . . . . . . . . . . . . . 1.1
1.1 History . . . . . . . . . . . . . . . . . . . . . . . . . . . . . . . . . . . . . . . . . . . . . 1.1
1.2 Physics of Metallic Glasses . . . . . . . . . . . . . . . . . . . . . . . . . . . . . 1.2
1.3 Applied Physics (for processing) in Metallic Glasses . . . . . . . . . 1.11
1.4 Advantages of Thermoplastic Processing and . . . . . . . . . . . . . . . 1.14 State of the Field in 2005
1.5 Alloy Development Strategies . . . . . . . . . . . . . . . . . . . . . . . . . . . 1.20
1.6 What To Do with All These Alloys . . . . . . . . . . . . . . . . . . . . . . 1.24
1.6.1 Biocompatible Beryllium??? . . . . . . . . . . . . . . . . . . . . . . . 1.32
1.7 Introduction Summary . . . . . . . . . . . . . . . . . . . . . . . . . . . . . . . . . 1.37
Chapter 1 References . . . . . . . . . . . . . . . . . . . . . . . . . . . . . . . . . . . . . . . 1.38
Chapter 2 Lightweight Ti-based Bulk Glassy Alloys Excluding . . . . . . . . . . . . . 2.1 Late Transition Metals
Chapter 2 References . . . . . . . . . . . . . . . . . . . . . . . . . . . . . . . . . . . . . . . 2.9
Chapter 3 ZrTi Based Be Bearing Glasses Optimized for High . . . . . . . . . . . . . 3.1 Thermal Stability and Thermoplastic Formability
3.1 Introduction . . . . . . . . . . . . . . . . . . . . . . . . . . . . . . . . . . . . . . . . . . 3.1
3.2 Experimental Method . . . . . . . . . . . . . . . . . . . . . . . . . . . . . . . . . . 3.3
3.3 Results and Discussion . . . . . . . . . . . . . . . . . . . . . . . . . . . . . . . . . 3.5
3.3.1 Quaternary Alloys . . . . . . . . . . . . . . . . . . . . . . . . . . . . . . . . . 3.8
3.4 Conclusion . . . . . . . . . . . . . . . . . . . . . . . . . . . . . . . . . . . . . . . . . 3.13
Chapter 3 References . . . . . . . . . . . . . . . . . . . . . . . . . . . . . . . . . . . . . . . 3.15

vii
Chapter 4 Bulk Metallic Glass with Benchmark Thermoplastic . . . . . . . . . . . . 4.1 Processability
4.1 Experimental Method . . . . . . . . . . . . . . . . . . . . . . . . . . . . . . . . . 4.12
Chapter 4 References . . . . . . . . . . . . . . . . . . . . . . . . . . . . . . . . . . . . . . 4.13
Chapter 5 Injection Molding Metallic Glass . . . . . . . . . . . . . . . . . . . . . . . . . . . . 5.1
Chapter 5 References . . . . . . . . . . . . . . . . . . . . . . . . . . . . . . . . . . . . . . 5.12
Chapter 6 Relaxation Phenomena in the ZrTiBe System . . . . . . . . . . . . . . . . . . 6.1
6.1 Abstract . . . . . . . . . . . . . . . . . . . . . . . . . . . . . . . . . . . . . . . . . . . . . 6.1
6.2 Introduction . . . . . . . . . . . . . . . . . . . . . . . . . . . . . . . . . . . . . . . . . . 6.1
6.3 Experimental Method . . . . . . . . . . . . . . . . . . . . . . . . . . . . . . . . . . 6.3
6.4 Results and Discussion . . . . . . . . . . . . . . . . . . . . . . . . . . . . . . . . . 6.6
6.4.1 Heat Capacity Measurements . . . . . . . . . . . . . . . . . . . . . . . . 6.6
6.4.2 Rheology . . . . . . . . . . . . . . . . . . . . . . . . . . . . . . . . . . . . . . 6.11
6.4.3 Shear Modulus . . . . . . . . . . . . . . . . . . . . . . . . . . . . . . . . . . 6.14
6.4.4 Microscopy . . . . . . . . . . . . . . . . . . . . . . . . . . . . . . . . . . . . 6.16
6.5 Conclusion . . . . . . . . . . . . . . . . . . . . . . . . . . . . . . . . . . . . . . . . . 6.18
Chapter 6 References . . . . . . . . . . . . . . . . . . . . . . . . . . . . . . . . . . . . . . 6.20
Chapter 7 Conclusion . . . . . . . . . . . . . . . . . . . . . . . . . . . . . . . . . . . . . . . . . . . . . . . 7.1
7.1 Future Research Directions . . . . . . . . . . . . . . . . . . . . . . . . . . . . . . 7.3
Chapter 7 References . . . . . . . . . . . . . . . . . . . . . . . . . . . . . . . . . . . . . . . . 7.6
Appendix 1 Corrosion Properties of ZrTiBe + Me Alloys in HCl . . . . . . . . . . . A1.1
A1.1 Abstract . . . . . . . . . . . . . . . . . . . . . . . . . . . . . . . . . . . . . . . . . . . . A1.2
A1.2 Introduction . . . . . . . . . . . . . . . . . . . . . . . . . . . . . . . . . . . . . . . . . A1.3
A1.3 Experimental Method . . . . . . . . . . . . . . . . . . . . . . . . . . . . . . . . . A1.4
A1.4 Results and Discussion . . . . . . . . . . . . . . . . . . . . . . . . . . . . . . . . A1.5
A1.5 Conclusion . . . . . . . . . . . . . . . . . . . . . . . . . . . . . . . . . . . . . . . . A1.10
Appendix 1 References . . . . . . . . . . . . . . . . . . . . . . . . . . . . . . . . . . . . A1.11

viii
Appendix 2 One Year Rabbit Implantation Study of a Zirconium . . . . . . . . . . A2.1 Based Beryllium Bearing Metallic Glass
A2.1 Abstract . . . . . . . . . . . . . . . . . . . . . . . . . . . . . . . . . . . . . . . . . . . . A2.2
A2.2 Introduction . . . . . . . . . . . . . . . . . . . . . . . . . . . . . . . . . . . . . . . . . A2.2
A2.3 Experimental Method . . . . . . . . . . . . . . . . . . . . . . . . . . . . . . . . . A2.4
A2.4 Preliminary Tests and Results . . . . . . . . . . . . . . . . . . . . . . . . . . A2.4
A2.5 Long Term Implantation Study . . . . . . . . . . . . . . . . . . . . . . . . . . A2.9
A2.6 Conclusion . . . . . . . . . . . . . . . . . . . . . . . . . . . . . . . . . . . . . . . . A2.12
Appendix 2 References . . . . . . . . . . . . . . . . . . . . . . . . . . . . . . . . . . . . A2.13
Appendix 3 Corrosion and Corrosion Fatigue of Vitreloy Glasses . . . . . . . . . . A3.1 Containing Low Fractions of Late Transition Metals
Appendix 3 References . . . . . . . . . . . . . . . . . . . . . . . . . . . . . . . . . . . A3.10
Appendix 4 Derivations . . . . . . . . . . . . . . . . . . . . . . . . . . . . . . . . . . . . . . . . . . . . . . A4.1
Derivation 1 Fourier Heat Equation . . . . . . . . . . . . . . . . . . . . . . . . . . A4.1
Derivation 2 Implications of Slope Change in . . . . . . . . . . . . . . . . . . A4.2 Thermodynamic Variables
Derivation 3 Stephan’s Equation for Parallel Plate Viscometer . . . . A4.2
Derivation 4 Vogel-Fulcher-Tammann Viscosity . . . . . . . . . . . . . . . A4.4
Derivation 5 Viscosity of BMG from Potential Energy . . . . . . . . . . A4.4 Landscape Perspective
Derivation 6 Thermoplastic Formability Parameter . . . . . . . . . . . . . A4.6
Derivation 7 Composition Counting . . . . . . . . . . . . . . . . . . . . . . . . . A4.7
Derivation 8 Limiting Cases of Two Phase Liquid Flow . . . . . . . . A4.10
Derivation 9 Modulus of Rupture Equation for . . . . . . . . . . . . . . . A4.14 Rectangular Beam
Appendix 4 References . . . . . . . . . . . . . . . . . . . . . . . . . . . . . . . . . . . . A4.15

ix
List of Figures Page Figure 1.1 DSC scan of Zr44Ti11Cu20Be25 showing heat capacity features 1.3 characteristic of metallic glasses. Inset region on left shows glass transition region and maintains axis units of large plot. Figure 1.2 TTT diagram upon heating () and cooling () for 1.6 Zr41.2Ti13.8Cu12.5Ni10Be22.5. Figure 1.3 Schematic TTT plot shown with high mobility (kinetics) and low 1.6 driving force (thermodynamics) at high temperature and low atom mobility with high thermodynamic driving force at low temperature creating a nose in the TTT curve at intermediate temperatures. Figure 1.4 ηTT plot for Zr41.2Ti13.8Cu12.5Ni10Be22.5 using heating TTT data () 1.12 and cooling TTT data (). This plot looks upside down compared to Figure 1.2 because lower viscosities occur at higher temperatures. Figure 1.5 Schematic of squish test proposed by Schroers. 1.13 Figure 1.6 Thermoplastic forming demonstrations 2005-2007 [30-31, 36-37]. 1.16 Figure 1.7 ηTT plots for alloys commonly used in TPF processes. GFA for 1.19 the Pt alloy is insufficient to obtain the entire cooling TTT curve. No cooling TTT data is available for Zr44Ti11Cu10Ni10Be25. Conflicting heating TTT data for the Pd alloy is not presented. Data taken from [1, 5, 7, 40-41]. Figure 1.8 Quaternary alloy with 5% Cu plotted at bottom of figure. This 1.23 quaternary alloy could be thought of as 5% substitution of Cu for Zr, Ti, or Be in the ternary alloys going top down. Zr35Ti30Be35 has a SCLR most similar to the quaternary alloy so Cu substitution for Be is the most useful way to think of these alloys to maximize ΔT. Figure 1.9 Time to crystallization versus viscosity plot for four thermo- 1.26 plastically processable alloys. This plot combines TTT and viscosity versus time data to show available processing time for a given viscosity for the alloys [7, 37, 40-41, 56]. Figure reproduced in Chapter 5.
Figure 1.10 Photograph of the polished injection molded part prior to final 1.27 sectioning for three-point bend testing.
Figure 1.11 Apparent two Tg phenomenon seen in 20 K/min DSC scan of 1.28 Zr35Ti30Be27.5Cu7.5.

x
Figure 1.12 DSC and viscosity curve plotted against temperature for 1.29 Zr30Ti30Be40 which shows about 60% of the low Tg phase and 40% of the high Tg phase. The viscosity plot shows two flow regions roughly corresponding to the discontinuities in heat capacity seen in the DSC. Figure 1.13 Plot of Δcp1/(Δcp1 + Δcp2) versus Zr concentration gives fraction 1.30 of phase 1 assuming two glassy phases with similar fragilities. Linear fits indicate rule of mixtures analysis is appropriate and suggests a metastable miscibility gap in SCLR.
Figure 2.1 Pictures of amorphous 6mm diameter rod of Ti45Zr20Be35 (S1), 2.4 7mm diameter rod of Ti45Zr20Be30Cr5 (S2) and 8mm diameter rod of Ti40Zr25Be30Cr5 (S3) prepared by the copper mold casting method are presented in (a). The X-ray diffraction patterns (b) verify the amorphous nature of the corresponding samples.
Figure 2.2 DSC scans of the amorphous Ti45Zr20Be35 (S1), Ti45Zr20Be30Cr5 (S2), 2.6 and Ti40Zr25Be30Cr5 (S3) alloys at a constant heating rate of 0.33 K/s. The marked arrows represent the glass transition temperatures.
Figure 2.3 Compressive stress-strain curves for the Ti45Zr20Be35 and 2.7 Ti40Zr25Be30Cr5 3mm amorphous rods.
Figure 3.1 Bulk glass forming regions shown on ZrTiBe phase diagram. 3.5
Figure 3.2 Ternary ZrTiBe phase diagram showing the region originally 3.6 explored by Tanner for ribbon forming glasses (dashed line), the isothermal cross sections showing the liquid phase at various temperatures (shaded triangles), and the alloys recreated in this experiment (letters). Figure 3.3 20 K/min DSC scans of several alloys in the ternary ZrTiBe system. 3.8 Crystallization is seen as a single exothermic peak suggesting that these alloys tend to crystallize by simultaneous crystal growth at that heating rate. Inset: Magnified view of glass transitions (temperature axes aligned); vertical order of alloys maintained. Figure 3.4 (a) The effect of Cu substitution for Be in Zr35Ti30Be35 (Alloy K). 3.10 (b) The effect of Co substitution for Be in Zr35Ti30Be35 (Alloy K). (c) The effect of Fe substitution for Be in Zr35Ti30Be35 (Alloy K). All insets contain magnified view of glass transitions (temperature axes aligned) with vertical order of alloys maintained.

xi
Figure 3.5 Bar graph showing the compositions with the largest ΔT from 3.13 each quaternary family. Alloys with ΔT values as large as 165.1 °C are shown. Zr44Ti11Be25Cu10Ni10 (Vitreloy 1b) is shown for reference. Figure 4.1 DSC scans of three typical bulk metallic glasses with excellent 4.4 glass forming ability and extremely high thermal stability. The marked arrows represent the glass transition temperatures. Figure 4.2 The temperature dependence of equilibrium viscosity of 4.6 several metallic glass forming liquids: Zr41.2Ti13.8Ni10Cu12.5Be22.5
(Vitreloy 1) (Δ); Zr46.25Ti8.25Cu7.5Ni10Be27.5 (Vitreloy 4) (); Zr35Ti30Cu8.25Be26.75 (); Pd43Ni10Cu27P20 (×); Pt60Ni15P25 (◊). It is shown that the viscosity of Zr35Ti30Cu8.25Be26.75 in the thermoplastic processing region is at least two orders of magnitude lower than that of Vitreloy 1 or Vitreloy 4 and is comparable to that of Pd based metallic glass and polymer glasses. Figure 4.3 TTT diagrams for Zr35Ti30Cu8.25Be26.75 upon heating (), and 4.8 cooling (). The data were measured by electrostatic levitation for cooling measurements. TTT upon heating measurements were done by processing in graphite crucibles after heating from the amorphous state. At 683 K, where the equilibrium viscosity is about 8*104 Pa-s, a 600 s thermoplastic processing window is available. Figure 4.4 Demonstration of the strong thermoplastic processability of the 4.9 Zr35Ti30Cu8.25Be26.75 metallic glass. The ingot in (a) is pressed over a dime at 643 K for 45 s at 25 MPa to form the negative imprint of a United States dime shown in (b). A diamond shaped microindentation pattern was placed in the flame on the dime (c) and was successfully replicated in the negative imprint (d) as well. Figure 4.5 Squish test proposed by Schroers [28] performed on four alloys 4.11 traditionally used in TPF and the new large ΔT alloy. The largest diameter after the squish test is obtained by using the Zr35Ti30Cu7.5Be27.5 alloy suggesting that it will exhibit the best flow properties in TPF processes requiring large strains. Figure 5.1 Time to crystallization versus viscosity plot for four thermo- 5.3 plastically processable alloys. This plot combines TTT and viscosity versus time data found in references [6-9] to show available processing time for a given viscosity for the alloys.

xii
Figure 5.2 2a - 20 oC/min DSC scans of feedstock material and injection 5.5 molded specimen. The injection molding process appears to have had little effect on the thermodynamic properties measured in the DSC. Inset 2b - Schematic drawing of the modified injection molding setup consisting of a plunger, gates, and a heated mold and reservoir. The dimensions of the mold cavities are 2mm x 10mm x 20mm and 1.5mm x 10mm x 20mm. Figure 5.3 Photograph of injection molded parts. The top part (5.3a) was 5.8 processed at 410 oC with an applied pressure of 140 MPa but the plunger jammed. The second part (5.3b) was processed at 385 oC with an applied pressure of 300 MPa for 3 minutes. The third part (5.3c) was processed at 420 oC with an applied pressure of 300 MPa for two minutes. The fourth part (5.3d) made of polyethylene was processed at 210 oC with an applied pressure of 35 MPa for one minute. Figure 5.4 Plot of modulus of rupture values for injection molded and die 5.11 cast samples. Die cast modulus of rupture = (2.879 ± 0.240)GPa. Injection molding modulus of rupture = (2.923 ± 0.065)GPa.
Figure 6.1 20 K/min DSC scan of Zr30Ti30Be40 showing double discontinuity 6.4 in heat capacity in SCLR. Δcp and Tg determination method illustrated. Figure 6.2 Plot of Δcp1/(Δcp1 + Δcp2) versus Zr concentration gives fraction 6.7 of phase 1 assuming two glassy phases with similar fragilities. Linear fits indicate rule of mixtures analysis is appropriate and suggests a metastable miscibility gap in SCLR. Figure 6.3 20 K/min DSC scans of alloys predicted to show only one phase 6.9 from rule of mixtures analysis and one intermediate two phase composition. Figure 6.4 Sketch of the metastable miscibility gap in SCLR of 6.10 (ZraTi1-a)60Be40. Endpoint compositions are known, but temperature bounds are not.

xiii
Figure 6.5 η(T) plots for three alloys with differing fractions of phase 1, 6.13 showing apparent double glass transition. The test specimens were 1mm diameter x 1.8mm tall rods of Zr20Ti40Be40 (38% phase 1), Zr25Ti35Be40 (48% phase 1), and Zr30Ti30Be40 (61% phase 1) deformed under a force of 1400 mN at 5 K/min in a TMA. Region 1 corresponds to a solid-solid mixture with no deformation. Region 2 corresponds to solid-liquid mixture and minimal deformation indicated by shallow slope of η(T). Region 3 is a liquid-liquid mixture with the greatest deformation rate indicated by the steepest η(T) slope. The scatter in first and second glass transitions as measured in 5 K/min DSC scans shown by parallel black vertical lines. Figure 6.6 η(T) plots for as-cast and annealed samples of Zr30Ti30Be32Cu8. 6.14 The test specimens were 3mm diameter x 3mm tall rods deformed under a force of 1400 mN at 5 K/min in a TMA. The annealed sample was heated to 410 °C for 100 s and shows a slightly lower viscosity than the as-cast sample in region 2. Both samples show similar flow behavior in the SCLR. The flow regions and glass transitions do not align for these samples as was observed for the (ZraTi1-a)60Be40 compositions in Figure 6.5. Figure 6.7 In situ G(T) measurements on an annealed sample of 6.15 Zr30Ti30Be32Cu8 showing two slope changes. These slope changes are indicative of two relaxation events in the alloy. The G(T) and η(T) relaxation temperatures do not correlate well for this sample. Figure 6.8 Dimple ground and ion milled sample imaged in TEM. Bright 6.17 field and dark field images show no evidence of two phases. The diffraction pattern is characteristic of an amorphous alloy. Figure 7.1 Heating and forming times achievable using rapid discharge 7.4 forming, RF heating, and conventional heating depicted along the x axis. ηTT data for a marginal glass former is schematically represented with the dashed line. ηTT data for the Pd alloy is sketchy because it is estimated from constant heating experiments in [1-2] but shows a change in slope as the melting temperature is approached. ηTT data for Pt alloy found in [2-3], and for the Zr alloy in [2, 4]. Figure A1.1 Corrosion rate as a function of Zr content in Zr65-xTixBe35 alloys. A1.5 Squares are 2mm diameter amorphous rods. The triangle is a crystallized 2mm diameter sample.

xiv
Figure A1.2 Plot of corrosion rate versus standard half cell potential E0 of A1.7 quaternary alloying element. Table A1.2 gives compositions. Fig A1.3 High resolution XPS scans of Zr35Ti30Be35 after sitting in air A1.9 for 24 hours (blue) and after being immersed in 12M HCl for 12 hr resulting in 3% mass loss (pink). Figure A3.1 Cyclic anodic polarization curves of Zr52.5Cu17.9Ni14.6Al10Ti5, A3.4 Zr35Ti30Be29Co6, and Zr35Ti30Be35 in 0.6M NaCl solution at a scan rate of 0.167 mV/s. Figure A3.2 Fatigue performance in air ( Zr52.5Cu17.9Ni14.6Al10Ti5, A3.5 Zr35Ti30Be29Co6, and Zr35Ti30Be35) and in 0.6M NaCl (Δ Zr52.5Cu17.9Ni14.6Al10Ti5, Zr35Ti30Be29Co6, and Zr35Ti30Be35) at a frequency of 10 Hz and R = 0.1. Zr52.5Cu17.9Ni14.6Al10Ti5 is tested in four-point bending geometry (data taken from [9]). Zr35Ti30Be29Co6 and Zr35Ti30Be35 are tested in compression-compression geometry (present study). Figure A4.1 Thermoplastic formability parameter δ found by integrating A4.6 as shown. Figure A4.2 Squish test data for 5 TPF candidate alloys shows δ is a A4.6 decent predictor of TPF potential. Figure A4.3 All possible three component compositions with 5% A4.7 composition steps found at line intersections. Figure A4.4 Four component phase diagram is an equilateral A4.8 pyramid / tetrahedron. Figure A4.5 Five component phase diagram is a 4D equilateral hyperpyramid. A4.8 Figure A4.6 Case 1 showing laminae of two fluids orthogonal A4.10 to shear direction. Figure A4.7 Case 2 showing laminae of two fluids parallel to A4.11 shear direction. Figure A4.8 Additive fluidity cases and additive viscosity cases on three A4.14 flow regions of a glass with 60% low Tg phase are shown. It is interesting to note that the theoretical additive viscosity case resembles the flow seen in figure 6.5 suggesting that we may approach the immiscible fluids resisting indefinite extension case proposed in [1] on page 87.

xv
List of Tables Page Table 2.1 Density, thermal and elastic properties of representative 2.5 lightweight TiZrBe and Vitreloy type glassy alloys. Table 3.1 Thermodynamic data of the alloys listed in Figure 3.1. 3.7 Table 3.2 Thermodynamic data for quaternary variants of Zr35Ti30Be35 3.9 (Alloy K) obtained by substituting Cu, Co, Fe, Al for Be. Table 3.3 Thermodynamic data for quaternary variants of large ΔT 3.12 ternary compositions obtained by substituting Cu for Be. Table 4.1 Thermal, mechanical, and rheological properties of various 4.5 BMG forming alloys. Table 5.1 Effects of rod diameter and overheating above melt temperature 5.7 on ΔT as well as variation in arc melted button ΔT are tabulated. Temperatures given in °C. Table 6.1 DSC data for alloys considered in this article. Data shown in 6.8 parentheses taken at 5 K/min. Other data taken at 20 K/min. Temperatures in °C. Δcp1 values in J/(g*K). Table A1.1 Mass loss and ICPMS measurements of NaOH solution after A1.2 3 months. Solution acidified to 2% w/w HNO3 as required for ICPMS. Table A1.2 Alloy compositions and corrosion rates measured in 12M HCl. A1.6 Table A2.1 Muscle and bone implant histological grading criteria. A2.14 Table A2.2 3 Month Muscle Implants: Significance of Material Type A2.15 vs Parameter. Table A2.3 3 Month Bone Implants: Significance of Material Type A2.15 vs Parameter. Table A2.4 6 Month Muscle Implants: Significance of Material Type A2.15 vs Parameter. Table A2.5 6 Month Bone Implants: Significance of Material Type A2.16 vs Parameter. Table A2.6 12 Month Muscle Implants: Significance of Material Type A2.16 vs Parameter.

xvi
Table A2.7 12 Month Bone Implants: Significance of Material Type A2.16 vs Parameter. Table A2.8 Fibrosis Thickness Interaction Analysis: Muscle Implants A2.17 by Time, Finish, and Material. Table A2.9 Intracapsular Inflammation Interaction Analysis: Muscle A2.17 Implants by Time, Finish, and Material. Table A2.10 Degeneration Interaction Analysis: Muscle Implants by A2.17 Time, Finish, and Material. Table A2.11 Extracapsular Inflammation Grade Interaction Analysis: A2.18 Muscle Implants by Time, Finish, and Material. Table A2.12 Extracapsular Inflammation Distance Interaction Analysis: A2.18 Muscle Implants by Time, Finish, and Material. Supplementary tables for Appendix 2. A2.19 – A2.30 Table A3.1 Data for corrosion and corrosion fatigue in 0.6M NaCl. A3.4 Fatigue values are the stress amplitudes at which the samples endured 107 loading cycles normalized by the material yield strength. The yield strengths of Zr35Ti30Be35, Zr35Ti30Be29Co6, and Zr52.5Cu17.9Ni14.6Al10Ti5 are 1850 MPa [22], 1800 MPa [22], and 1700 MPa [7], respectively. Corrosion data for 18/8 Stainless Steel, annealed Monel, and Alclad 24S-T are taken from [10], while data for fatigue in air and 0.6M NaCl are taken from [11-15]. Table A4.1 All possible two component compositions with 5% A4.7 composition steps. Table A4.2 Combinatorics for 3 - 5 element alloys. A4.9

Chapter 1 - Introduction
1.1 History
Metallic glasses have some amazing properties that captured my imagination and
determined my path for grad school. In APh 110, Winter term 2003-2004, Dr. William
L. Johnson gave a seminar lecture describing his research with an enthusiasm that was
intoxicating. He described amorphous metals, materials having a random arrangement of
atoms that were frozen in a liquid configuration because of a clever choice of alloying
elements. These elements were chosen to have large negative heats of mixing and near
eutectic compositions meaning the elements were much happier mixed than separate. The
atomic sizes of alloying elements were also chosen so that many different sized spheres
can log jam efforts of the mixture to crystallize upon cooling from the molten state.
Dr. Johnson’s most famous alloy is a ZrTiCuNiBe composition called Vitreloy 1.
This alloy was so resistant to crystallization that 1 inch thick samples could be cooled
amorphous. The material conducted electricity like a metal, had strength in tension and
hardness as high as the best steels with elastic limits ten times greater than crystalline
metals. It could be die cast like aluminum because the melting temperature of the alloy
was half that of steel and it had an interesting softening behavior at the glass transition
temperature that opened possibilities of processing the material like a plastic.
To recap: There is a material as strong and hard as cutting edge steels with the
ability to be formed like a plastic. This is something I had to study!
The metamorphosis of this theoretical possibility, plastically processing a metallic
glass, into reality, provided endless hours in my laboratory playground pursuing
interesting avenues of research that made for a wonderful grad school experience.

1.2
1.2 Physics of Metallic Glasses
Below the glass transition temperature, metallic glasses are liquids stuck in one
configuration. They are formed by rapidly quenching molten material. As the material
cools, a competition between thermodynamics and kinetics ensues. Thermodynamics
requires that materials exist in the lowest energy state at a given temperature. Below the
melting temperature, the lowest energy state for materials is a crystal. To form a crystal
however, the atoms must move into a crystalline configuration. As a liquid cools, the
viscosity of the liquid increases or stated another way, the mobility of the atoms
decreases. If a material can be cooled quickly enough to limit atom mobility and frustrate
crystallization, a glass is formed. The speed at which an alloy must be cooled to frustrate
crystallization is called its glass forming ability (GFA). Due to the slower cooling rate of
thicker samples, another measure of GFA is an alloy's critical casting thickness. Critical
casting thickness is the maximum diameter a cylindrical sample can be cast amorphous
(see Derivation 1).
A glass at room temperature can be reheated above Tg to a viscous liquid state
where the mobility of the atoms increases as a function of temperature. This increased
mobility allows the glass, which bypassed crystallization when originally cooled from the
melt, to sample various configurations and eventually the crystalline state is found. Most
heating processes are too slow to bypass crystallization of metallic glasses, but one alloy
very resistant to crystallization, PdNiCuP, has been cooled from the molten state to room
temperature and then reheated to the molten state with no crystallization [1].
These thermodynamic properties can be measured in a Differential Scanning
Calorimeter (DSC). The amount of heat required to equalize the temperatures of an

1.3
empty reference crucible and a crucible with a known weight of sample is measured as a
function of temperature. The heat difference divided by the mass of the sample is the
heat capacity of the sample. A plot of the heat capacity as a function of temperature for a
typical metallic glass (MG) is a good starting point to discuss the thermodynamics of
these materials. Figure 1.1 shows a typical DSC scan for a MG. The glass transition
temperature, Tg, the crystallization temperature, Tx, the solidus temperature, Ts, and the
liquidus temperature, TL, are shown along with the enthalpy of crystallization, Hx, the
enthalpy of fusion, Hf and the magnitude of the discontinuity in heat capacity Δcp.
Area=Hf
V
Area=Hx
V
-6
-5
-4
-3
-2
-1
0
1
2
100 200 300 400 500 600 700 800Temperature [C]
Hea
t Flo
w [W
/g]
Tx
TsTL
Tg regionenlarged below
0.150.170.190.210.230.250.270.290.31
270 290 310 330 350 370 390
Tg
V
V
Δcp
Exo
Figure 1.1: DSC scan of Zr44Ti11Cu20Be25 showing heat capacity features characteristic of metallic glasses. Inset region on left shows glass transition region and maintains axis units of large plot.
These variables need further explanation. The glassy sample begins at room
temperature and is heated above its glass transition temperature. The physics of the glass
transition is still being debated. Some claim that it is a second order phase transition [2]

1.4
and that glasses are a unique phase of matter. The less controversial explanation follows
the kinetics argument above and defines Tg as the temperature at which the material
begins to flow. The glass transition is visible as a discontinuous jump in heat capacity =
Δcp. In the kinetics argument, Δcp arises from changes in the slope of the volume,
entropy, and enthalpy curves at the glass transition due to the kinetic freezing of the
liquid [2] (see Derivation 2). Above Tg, the mobility of the atoms in the undercooled
liquid increases and at Tx a crystalline configuration is found and the sample reaches the
desired thermodynamic low energy crystalline state. As the sample transitions from a
high energy liquid to a low energy crystal, heat must be released and the exothermic
crystallization peak is observed. The total heat released in the crystallization process is
Hx. The temperatures at which melting begins and ends are Ts and TL respectively. In an
elemental solid, melting peaks are very sharp and theoretically Ts = TL. Melting a solid is
an endothermic process meaning that heat input is required to cause the phase change
from crystal to liquid. The amount of heat required to melt the crystal = Hf. If the
sample was heated quickly enough, crystallization and melting would not have occurred
and the glass could be taken back above the crystalline melting temperature with only a
discontinuity in heat capacity.
The ability of a metallic glass to resist crystallization at temperatures above Tg is
called its thermal stability. This is of course a time and temperature dependant
parameter. The longer a MG is left at a temperature above Tg, the more configurations
the atoms can explore and eventually the sample will crystallize. Additionally, the atoms
move more quickly and explore configurations more quickly at higher temperatures.
Both Tg and Tx as measured in a DSC will depend on heating rate. Exact values for Tg

1.5
and Tx are impossible to obtain because they are tied to the kinetics of the atoms. In
much of the scientific literature on MG and for most of this thesis, thermodynamic data is
collected at heating rates of 20 K/min. The value Tx - Tg = ΔT is one measure of the
thermal stability of a MG. ΔT is also called the width of the supercooled liquid region
(SCLR), so named because the material has regained flow properties of a liquid, but
exists at “super cooled” temperatures well below the melting temperature.
Another quantitative measure of the thermal stability of an alloy is summarized in
a time temperature transformation (TTT) diagram. TTT diagrams depict the results of
rapidly bringing a MG to a given temperature and then measuring the time to the onset of
crystallization at that temperature. Asymmetries exist in TTT diagrams constructed by
cooling molten material and waiting for crystallization vs ones constructed by heating
glassy material and waiting for crystallization [3]. The authors of [3] discuss the
asymmetry in terms of classical nucleation theory and suggest that crystal nuclei are
formed upon cooling and then grow at different rates upon heating above Tg. Heating
and cooling TTT diagrams for the Zr based alloy with the highest known GFA,
Zr41.2Ti13.8Cu12.5Ni10Be22.5 [3-5], are presented in Figure 1.2. Notice the rounded shape of
the cooling TTT curve. The shortest time is marked Tn on the temperature axis indicating
the “nose temperature.” At this temperature, the thermodynamic driving force to
crystallize and mobility of the atoms combine to be optimal for crystallizing in the
shortest possible time. At temperatures higher than Tn, the mobility of atoms is greater,
but there is less thermodynamic driving force to crystallize. At temperatures lower than
Tn, the thermodynamic driving force is higher, but the mobility of the atoms is too low.
These concepts are shown in Figure 1.3.

1.6
350
400
450
500
550
600
650
101 102 103 104
Time [s]
Tem
pera
ture
[C]
Tn
Figure 1.2: TTT diagram upon heating () and cooling () for Zr41.2Ti13.8Cu12.5Ni10Be22.5.
Time
Tem
pera
ture
Kinetic contribution to TTT
Thermodynamic contribution to TTT
Resulting TTT curve
Figure 1.3: Schematic TTT plot shown with high mobility (kinetics) and low driving force (thermodynamics) at high temperature and low atom mobility with high thermodynamic driving force at low temperature creating a nose in the TTT curve at intermediate temperatures. The thermodynamic driving force would go to zero (infinite time) above the liquidus temperature.

1.7
We know that a MG begins to flow at Tg and stops flowing at Tx (liquid to solid
transition) upon heating. Flow can be thought of in terms of shear stresses, i.e., how does
one layer of material move with respect to another as they slide across each other. The
fundamental equation governing viscosity is ηF
drdv
= where F is the applied shear
stress, η is the viscosity, and dv/dr is the spatial derivative of the velocity orthogonal to
the shear direction. This equation can be solved for many testing geometries. The
parallel plate geometry is solved in Derivation 3. Measurements of viscosity as a
function of temperature are also possible and a good mathematical fit to η(T) data is
achieved using the Vogel-Fulcher-Tammann (VFT) equation presented in Derivation 4
[6].
The physics of MG flow has been a subject of much interest in the MG
community [7]. Johnson et al. examined flow of MG from a microscopic perspective.
Given that MG are multicomponent alloys, there should be a smallest length scale at
which the properties of the glass are observable. In crystals, this length scale is the unit
cell and a periodic arrangement of unit cells recreates the crystal and its properties. In
MG a “unit cell” is most closely approximated by a shear transformation zone, STZ.
Experiments suggest that STZ may be as small as 200 atoms [7]. One can not
periodically arrange STZ because they approximate fundamental units of an amorphous
material and are not space filling. There are compatibility stresses required to place STZ
in space. As the name suggests, an STZ will shear given an appropriate temperature and
stress and accommodate movement in the SCLR. Analysis of flow assuming a
distribution of STZ sizes and energy wells each STZ sits in is contained in Derivation 5.

1.8
The result is an equation with less fitting parameters than the VFT equation that better
fits η(T) data of MG. The equation is:
⎥⎥⎦
⎤
⎢⎢⎣
⎡⎟⎟⎠
⎞⎜⎜⎝
⎛=
∞
Amg
TT
AExp/
ηη
Where η is the temperature dependant viscosity, η∞ is the high temperature viscosity or
can be approximated by the plank limit viscosity ~ 10-5 Pa-s, A = Log(ηg/η∞) where ηg =
1012 Pa-s, and m = Angell fragility.
The Angell fragility is defined as follows:
)/()(
TTLogm
g∂∂
=η
The Angell fragility gives the slope of the Log(η(Tg/T)) curve. This is a valuable
parameter because it determines how steep the η(T) plot will be. Fragile liquids or
materials with high m soften quickly above their glass transition temperature and exhibit
steeper η(T) relationships.
The physics of the SCLR in some alloys is even more complicated than we have
discussed so far. Phase separation in metallic glasses has been claimed in many glass
forming alloy systems including AuPbSb [8-9], ZrCu [10], ZrTiBe [11-14], ZrTiCuNiBe
[15-17], MgCuYLi [18], CuZrAlAg [19], TiYAlCo and ZrYAlCo [20]. X-ray scattering
has shown splitting of the broad amorphous spectrum in as-cast AuPbSb glass [8].
Additionally Small Angle Neutron Scattering (SANS), Small Angle X-ray Scattering
(SAXS), Anomalous Small Angle X-ray Scattering (ASAXS), observation with
Transmission Electron Microscopy (TEM), rheology measurement anomalies, resistivity
measurement anomalies, and Differential Scanning Calorimetry (DSC) measurements
showing apparent double glass transitions are some of the techniques used to support the

1.9
claims of phase separation. Some AuPbSb and ZrTiBe glasses are thought to have two
glasses in as-quenched samples. Other alloy systems are thought to phase separate upon
annealing.
Much of the work on phase separation in the Vitreloy (ZrTiNiCuBe) system is
relevant to this thesis. Johnson and collaborators conducted SANS experiments on
Vitreloy compositions after various annealing times and temperatures [15-17]. As-cast
samples exhibited only background scattering, but after annealing, the maximum
scattering intensity was peaked about q = 0.5 A-1 and indicated a quasiperiodic
arrangement of scattering inhomogeneities. SAXS and ASAXS experiments determined
that the annealing led to the segregation of the alloy into Zr rich and Ti rich amorphous
phases. This composition variation was found to happen at a length scale of about 13nm.
After this amorphous phase separation, the crystallization pathway becomes quite
complex. Kelton found a stable icosahedral phase in the TiZrNi phase diagram from ab
initio calculations [21]. Evidence of the icosahedral phase has been found in various
Vitreloy compositions by indexing X-ray diffraction patterns of alloys crystallized by
isothermal annealing in the SCLR [22-24]. TEM observation of quasicrystal phases has
also been accomplished [23-24]. The SANS peak is seen to shift as a function of
annealing temperature as predicted by the Cahn-Hilliard theory for spinodal
decomposition. Annealing at temperatures higher than the amorphous phase
decomposition region causes spinodal decomposition of the alloy into nanocrystalline
regions [15-17]. Some postulate that the quasicrystals phase precipitates from the phase
separated glass and later provides the nucleation site for other crystal phases [22-24].
Slight coarsening of the nanocrystals has been observed with annealing, but the length

1.10
scale only increased to about 40nm [17]. Other compositions in the same Vitreloy alloy
family did not phase separate into amorphous phases upon annealing [16]. Johnson and
collaborators proposed a miscibility gap and a spinodal decomposition region in the
SCLR of the ZrTiNiCuBe phase diagram and proposed rough composition boundaries.
Tanner and Ray examined the ZrTiBe system for glass forming compositions and
found many alloys could be made amorphous in 100μm thick ribbons [11-14]. Heat
capacity measurements conducted in a DSC on some of the compositions revealed two
discontinuities in heat capacity in the supercooled liquid region (SCLR). A glassy
material is expected to exhibit one discontinuity in heat capacity at the glass transition
temperature as the material transitions from solid-like to liquid-like behavior and
becomes able to flow [2]. Two jumps in heat capacity, and an apparent double glass
transition temperature are unusual. Tanner proposed that this anomalous feature in the
heat capacity was due to the presence of two glassy phases.
There are some in the metallic glass community who dispute the existence of the
two phases in many of these systems and attempt to explain the data in alternative ways
[25-28]. Perhaps the most controversial alloy thought to show two phases is
Zr36Ti24Be40. Hono showed that TEM work done by Tanner supporting the existence of
two phases in the Zr36Ti24Be40 alloy was flawed and proved that the observed “phases”
were in fact etching artifacts [27]. The apparent double glass transition has been
suggested to be a single glass transition with a neighboring exothermic ordering event
prior to crystallization [26]. This explanation could be plausible given the evidence of
quasi crystal formation in the more complicated Vitreloy system, especially in light of
TEM work showing what appear to be ordered phases after deformation of the in the

1.11
SCLR of the Zr36Ti24Be40 alloy [25]. Discussion and experiments supporting the two
phase glass argument in the ZrTiBe system will be discussed further in Chapter 6.
1.3 Applied Physics (for processing) in Metallic Glasses
Armed with the concepts of viscosity, thermal stability and TTT diagrams we can
consider what properties a metallic glass must posses to be a good candidate for
processing like a plastic in the SCLR. The plastic forming process we sought to replicate
was injection molding. A simple injection molding process requires feedstock material, a
heated reservoir in which the material is softened, a nozzle, a mold and a plunger to force
the softened material from the reservoir through the nozzle into the mold. Typical plastic
injection molding occurs at temperatures of 180 - 340 °C and viscosities of 102 - 103 Pa-s.
Time is a minimal constraint because polymers and plastics typically have enormous
thermal stabilities due to the long tangled molecular chains that kinetically resist
organization into a crystalline structure. 60 - 300 s is a reasonable time to thermally
equilibrate the feedstock material and inject it into the mold.
A metallic glass must have good enough GFA to make macroscopic specimens to
be a viable candidate for feedstock material. The metallic glass community calls an alloy
a bulk metallic glass (BMG) if the GFA is high enough to allow 1mm diameter rods to be
cast fully amorphous. BMG forming alloys also have the advantage of having better
thermal stability on cooling as compared to alloys with poorer GFA.
Processing a BMG using a method similar to injection molding in the SCLR
however, requires high thermal stability of the glass upon heating. In order to look at the
relevant parameters for processing in the SCLR we invented a new kind of plot for
metallic glasses. Because temperature is the easiest parameter to vary in the injection

1.12
molding process, we combined the TTT data upon heating with η(T) data for an alloy of
interest eliminating the temperature variable. This created an ηTT or viscosity time
transformation plot. An ηTT plot is shown in Figure 1.4 for the well known
Zr41.2Ti13.8Cu12.5Ni10Be22.5, Vitreloy 1, composition. TTT and η(T) data is only tabulated
for a few alloys in the literature because the measurements are very time consuming.
Therefore another parameter is needed to compare the majority of BMG forming alloys.
109
108
107
106
105
104
103
102
10
110 100 1000
Time [s]
Visc
osity
[Pa-
s]
Figure 1.4: ηTT plot for Zr41.2Ti13.8Cu12.5Ni10Be22.5 using heating TTT data () and cooling TTT data (). This plot looks upside down compared to Figure 1.2 because lower viscosities occur at higher temperatures.
If an oversimplification is made and all BMG are assumed to have similar
fragilities, then the dominant term predicting the lowest available processing viscosity in
the η(T) equation derived by Johnson et al. [7] is Tx - Tg = ΔT. ΔT is also a measure of
an alloy's thermal stability upon heating. Measurement of ΔT for a BMG forming alloy

1.13
takes less than one hour and ΔT data is tabulated for many compositions. This could be a
simple way of eliminating many compositions from consideration as potential alloys for
plastic forming processes in the SCLR.
Another method to measure formability of glassy alloys in the SCLR was
suggested by Schroers [29]. Schroers proposed that 0.1cm3 of material could be
compressed between parallel plates under a specified load at a constant heating rate
through the SCLR until crystallization of the glassy material stopped the flow. A
schematic diagram illustrating this test is presented in Figure 1.5 (modified from Chapter
4). The diameter of the squished disk would be a measure of the formability with larger
diameters indicating higher formability in the SCLR. This method closely resembles
viscosity determination in a parallel plate rheometer, but explores the entire SCLR in one
measurement. For alloys with known fragility, a parameter to predict formability can be
derived from the Johnson η(T) equation [7] coupled with the ideas behind the squish test
method proposed by Schroers. The basic idea is to integrate the area between the infinite
temperature viscosity line and the η(T) equation over the SCLR. The parameter is
presented in Derivation 6.
Formability Characterization
2000 lb2000 lb Tg< T <TxProcess in entire ΔT region
dT/dt = 10 K/minSample size= 0.1 cm3
V V
Sample
Final Diameter indicatesthermoplastic formability
Figure 1.5: Schematic of squish test proposed by Schroers.

1.14
1.4 Advantages of Thermoplastic Processing and State of the Field in 2005
Most practical applications of MG demand near net-shaping process in
manufacturing. The most common method of obtaining metallic glass parts is die casting
wherein molten alloy is injected into a mold and then cooled below the glass transition
temperature sufficiently fast to avoid crystallization. Die casting requires the molten
alloy to be quickly introduced into the mold and then rapidly quenched before the onset
of crystallization. This processing route takes advantage of the thermodynamic stability
of the alloy at temperatures above the crystallization nose, Tn in the TTT diagram showed
in Figure 1.2. At the temperature Tn, an alloy has the minimum time to crystallization.
Porosity is introduced into the sample due to the high inertial forces in relation to the
surface tension forces realized during the injection of the molten liquid, which gives rise
to a Rayleigh-Taylor instability and consequent flow breakup resulting in void
entrapment. Porosity is also found in the center of die cast parts because parts are cooled
through contact with a mold from the outside in and cavities nucleate in the center due to
large negative pressures present in the center of parts cooled in this manner. The cooling
requirements of die casting bound the dimensions of die cast parts to no larger than can
be cooled sufficiently fast to avoid crystallization and no smaller than can be quickly
filled. Parts with complex geometries, thin sections, and high aspect ratios are difficult to
obtain with die casting.
The unique advantages of injection molding, blow molding, micro replication,
and other thermoplastic technologies are largely responsible for the widespread uses of
plastics such as polyethylene, polyurethane, PVC, etc., in a broad range of engineering
applications. Powder Injection Molding (PIM) of metals represents an effort to apply

1.15
similar processing to metals, but requires blending of the powder with a plastic binder to
achieve net shape forming and subsequent sintering of the powder. Given suitable
materials, thermoplastic forming (TPF) would be the method of choice for manufacturing
of metallic glass components because TPF decouples the forming and cooling steps by
processing glassy material at temperatures above Tg and below Tx followed by cooling to
ambient temperature [30-31]. To clear up some terminology difficulties it should be
noted that forming in the SCLR, thermoplastic forming, and plastic processing all refer to
the same process of applying pressure to deform an alloy heated to a temperature in the
SCLR. A polymer or plastic material made up of long carbon chains also exhibits a Tg
and is processed in this manner, thus the terminology “plastic” processing.
Thermoplastic forming methods take advantage of the kinetic stability of an alloy
at temperatures below the crystallization nose. TPF decouples the fast cooling and
forming of MG parts inherent in die casting and allows for the replication of small
features and thin sections of metals with high aspect ratios. TPF methods also take
advantage of lower processing temperatures resulting in relatively lower oxidation rates.
TPF has several advantages over conventional die casting, including smaller
solidification shrinkage, less porosity of the final product, more flexibility on possible
product sizes, and a robust process that does not sacrifice the mechanical properties of the
material. TPF methods include the forming of amorphous metal sheets [32], the
compaction of amorphous powders [33], the extrusion of amorphous feedstock into a die
[34], and the imprinting of amorphous metal [35]. Most of these routes reduce the
porosity of the processed amorphous part but have limitations. Forming of amorphous
metal sheets limits the thickness of the final sample and the available part geometries.

1.16
Powder compaction methods usually produce parts having micro or nano dispersed
porosity which often results in inferior mechanical properties compared to homogenously
solidifying parts. Free extrusion, or extrusion into a die only allows parts with simple
geometries to be fabricated. Imprinting methods enable very small features to be
replicated, but are incapable of producing bulk parts. Figure 1.6 gives a pictorial
summary of some of the parts created with thermoplastic forming techniques. It is easily
seen in Figure 1.6 that fabrication of the depicted parts required relatively small strains.
In fact, all the parts formed using TPF methods prior to the work described in Chapter 5
of this thesis were limited to small strains.
Overview of Plastic Processing Methods
Micro Forming Powder/PelletCompaction
Extrusion
Blow MoldingImprinting
Figure 1.6: Thermoplastic forming demonstrations 2005-2007 [30-31, 36-37].

1.17
The goal of injection molding is to use the ability of metallic glasses to flow
homogeneously at temperatures between Tg and Tx to enable pressurized injection of the
alloy into a mold to produce a homogenous bulk part with no size restrictions. This
method would require higher strains than previously achieved by any of the thermoplastic
forming methods prior to 2005.
A perfect BMG forming alloy that could be swapped for polymer plastics in
injection molding and similar plastic forming processes would have the following
properties:
• Thermal stability in the SCLR for 60 - 300 s
• A viscosity of 102 - 103 Pa-s
• A processing temperature of 180 - 340 °C
In 2005 when my graduate studies began, there were hundreds of BMG forming
compositions to choose from. Metallic glass forming alloy compositions are given in
atomic percent unless otherwise stated and the family to which a particular alloy belongs
is determined by the element with the highest atomic percentage. Some of the families
we considered were Au, Pd, Pt, Zr, Ti, Ce, Y, La, Mg, Ca, Co, and Fe based alloys [38-
39]. Y, La, Co, and Fe based alloys are known for low fracture toughness and are
therefore mechanically undesirable. Ce, Ca, and Mg based glasses are often prone to
corrosion. Au based alloys have very high fragility but often the Tg is near room
temperature and the alloys crystallize readily. Zr, Ti, Pd, and Pt based BMG were
examined for suitability to forming processes in the SCLR.
A literature search revealed many attempts at forming in the SCLR prior to 2005.
Some of the best results to date are presented in Figure 1.6. The favored alloys were

1.18
Pd43Ni10Cu27P20, Pt57.5Ni5.3Cu14.7P22.5, Zr41.2Ti13.8Cu12.5Ni10Be22.5 (Vitreloy 1), and
Zr44Ti11Cu10Ni10Be25 (Vitreloy 1b). TTT diagrams and η(T) measurements had been
published prior to 2005 for many of these alloys and DSC data existed for all of them.
The alloys all had large ΔT values ranging from the smallest value for ΔTVit 1 = 65 °C to
ΔTVit 1b = 135 °C. The Pd and Pt based glasses have smaller ΔT values, but higher
fragilities making all these alloys good candidates for TPF. In the last four years,
publications from other research groups, and work within the Johnson group has fleshed
out the data necessary to construct ηTT plots for all these compositions. Figure 1.7
contains heating and cooling ηTT plots for the good TPF candidate alloys. It is quickly
seen that the alloys are limited to viscosities greater than 105 Pa-s for the processing
times required for injection molding and similar TPF processes using the ηTT plots for
heating. Only a cooling ηTT plot for Pd43Ni10Cu27P20 is presented. There are multiple
conflicting sets of data for heating the Pd alloy. The Pd alloy differs from other alloys
because Pd based alloys are able to be fluxed and cleaned with B2O3. Fluxing Pd based
alloys with B2O3 under inert gases allows the alloys greater thermal stability and
resistance to crystallization. Fluxed and unfluxed samples have very different TTT plots
because unfluxed alloys crystallize at much shorter times for a given temperature than
their fluxed counterparts. In an injection molding process conducted in air, the unfluxed
behavior is what would be observed. The Pd based alloy shows the most promise for
TPF of the alloys examined so far, but falls short of what would be needed to replace a
plastic.

1.19
0.1
1
10
102
103
104
105
106
107
108
109
1 10 102 103 104
Time [s]
Visc
oity
[Pa-
s]
Pt57.5Ni5.3Cu14.7P22.5 Cooling
Zr41.2Ti13.8Cu12.5Ni10Be22.5 Heating
Zr41.2Ti13.8Cu12.5Ni10Be22.5 Cooling
Pd43Ni10Cu27P20 Cooling
Pt57.5Ni5.3Cu14.7P22.5
Heating
Zr44Ti11Cu10Ni10Be25 Heating
Figure 1.7: ηTT plots for alloys commonly used in TPF processes. GFA for the Pt alloy is insufficient to obtain the entire cooling TTT curve. No cooling TTT data is available for Zr44Ti11Cu10Ni10Be25. Conflicting heating TTT data for the Pd alloy is not presented. Data taken from [1, 5, 7, 40-41].
From a processing point of view, BMG alloys with an extremely large
supercooled liquid region (excellent thermal stability against crystallization), which can
provide lower processing viscosities and exhibit smaller flow stress, would be desirable
for use in conjunction with a TPF process. In addition, excellent GFA and low glass
transition temperature (Tg) are also preferred properties for MG used in TPF processes.
Unfortunately, among the published metallic glasses, no suitable alloys existed [42-44].
Zr based metallic glasses, especially the Vitreloy series, are much less expensive than Pt
and Pd based alloys, have exceptional glass forming ability, but they have low fragilities
and low processing viscosities are unattainable in the SCLR [45-48].

1.20
Accordingly, a need exists for a new family of inexpensive MG that can be
incorporated into a thermoplastic processing application.
1.5 Alloy Development Strategies
The value of ΔT was the easiest parameter to measure and seemed to give a good
indication of TPF potential so we set out to find alloys with larger ΔT values. Without a
strategy, success in alloy development can be as likely as winning the lottery.
Approaching the problem scientifically and not just rolling the dice was the key. Even
then, it took a few iterations before finding the right method.
The first strategy to find alloys with larger ΔT values that met with limited
success was based on the phase separation work discussed in Section 1.2 in the
ZrTiCuNiBe, Vitreloy, system. Given that some of the Vitreloy compositions showed
phase separation upon annealing in the SCLR which led to formation of a quasicrystal
phase and eventual nanocrystallization, it was thought that we could increase ΔT by
suppressing the quasicrystalline phase. Kelton’s work predicted a stable TiZrNi
quasicrystal [21]. The simplest solution to suppress a TiZrNi phase is to remove all Ni
from the alloys.
The alloy with the largest ΔT found by this method was the all Cu version of
Vitreloy 1b, Zr44Ti11Cu20Be25. Unfortunately, ΔTvit 1b all Cu = 135 °C. We hadn’t lost
anything in ΔT by removing all the Ni, but also hadn’t gained anything.
Exploring quinary composition space in the Vitreloy system is very cumbersome.
Assuming we coarse grained the system into 5% composition steps, we would need to
create 10626 alloys to tile the composition space. The combinatorics for 1 - 5 component
alloys is included in Derivation 7. It takes approximately 2 hours per alloy to weigh,

1.21
melt, cast and run a DSC scan. This task could be accomplished in just over 10 years of
40 hour work weeks. If we explored a ternary composition space, we would only need
231 alloys to tile the system. Tanner explored the ZrTiBe system in the 1970s [11-14]
and found that compositions with 30 – 60% Be could be made amorphous in thin foils.
Additional work by Tanner using the CALPHAD method to predict ternary phase
diagrams from binary phase diagram data found the region of composition space
expected to have the lowest melting temperature alloys [49]. This near eutectic region
occupied a triangle with 30 - 45% Be. Using this prior work by Tanner and the ternary
phase space simplification, we were able to significantly diminish the number of alloys
necessary to explore the composition space. The ternary alloy development is detailed in
Chapter 3 of this thesis.
The next alloy development strategy challenged many of the assumptions about
GFA in the Vitreloy family held in the BMG community in 2005. It was assumed
because of the work by Tanner that alloys in the ZrTiBe system were limited in GFA to
thin foils 10 - 100μm thick [11-14, 50-51]. Thanks to Dr. Peker’s work and patent it was
also assumed that the GFA of Vitreloy type alloys was only attainable by adding late
transition metals (LTM) from the columns containing Mn, Fe, Co, Ni, or Cu on the
periodic table [4, 52]. Both these assumptions turned out to be false. In order to stay
outside the Peker patent, only alloys free of LTM were tested. ZrTiBe compositions with
GFA high enough to cast 1 - 6mm diameter rods were found. This means that the critical
cooling rates required to create amorphous ZrTiBe samples were 100 - 1000 times lower
than previously thought. Additions of V, Nb, and Cr were found to raise the GFA of
alloys to as high as 8mm diameter casting thickness. Bulk glass forming alloys with

1.22
densities as low as crystalline Titanium were discovered having compressive yield
strengths as high as Vitreloy compositions [53-54]. Some of the highest strength to
weight ratio metals in existence are among these alloys. The low density and no LTM
alloy development details and hallmark alloys are more thoroughly discussed in Chapter
2 of this thesis. The alloy with largest ΔT value discovered using this strategy of alloy
development, Zr35Ti30Be35, only had ΔT = 120 °C.
It became clear that our last option was to venture back into Peker patent territory
by adding LTM to the ternary compositions. It is important to have a mental picture of
what each alloying addition accomplishes to know what direction to move for further
improvement. For instance the alloy Zr35Ti30Be30Cu5 could be thought of as
• 5% Cu substitution of Zr in Zr40Ti30Be30
• 5% Cu substitution of Ti in Zr35Ti35Be30
• 5% Cu substitution of Be in Zr35Ti30Be35
The property we sought to maximize was ΔT. Adding a LTM to the alloys had the added
bonus of increasing GFA. DSC plots of the ternary alloys and quaternary alloy which
could be thought of as Cu substitution for the various elements are included in Figure 1.8.
Figure 1.8 suggests that LTM substitution should be thought of as a fourth element being
substituted for Be in order to maximize ΔT.

1.23
-5-3-113579
11
100 300 500 700 900Temperature [C]
Hea
t Flo
w (a
rb. r
ef.)
[W/g
]
Zr35Ti30Be30Cu5
Zr35Ti30Be35
Zr35Ti35Be30
Zr40Ti30Be30
Exo
Figure 1.8: Quaternary alloy with 5% Cu plotted at bottom of figure. This quaternary alloy could be thought of as 5% substitution of Cu for Zr, Ti, or Be in the ternary alloys going top down. Zr35Ti30Be35 has a SCLR most similar to the quaternary alloy so Cu substitution for Be is the most useful way to think of these alloys to maximize ΔT.
We identified the ternary compositions with the largest ΔT and replaced Be with
increasing amounts of LTM until ΔT stopped increasing. This strategy was extremely
successful. We tried Co, Fe, Ni, and Cu substitution for Be and found Cu to be the best
alloying addition. We found 12 alloys with ΔT larger than 150 °C and three alloys with
ΔT larger than 160 °C. An alloy based on the ternary composition with the largest ΔT
turned out to be the optimal alloy for our purposes. Zr35Ti30Be27.5Cu7.5 had ΔT = 165 °C.
Our work in alloy development increased the thermal stability of Vitreloy type glasses by
over 20% and opened up possibilities for injection molding a metal. The addition of
LTM to create quaternary alloys with the largest known ΔT values of any metallic glass
is detailed in Chapter 3 of this thesis.

1.24
1.6 What To Do with All These Alloys
Grad students often daydream about being one of those scientists so accomplished
they get equations or physical constants or even elements named after them. Einstein,
Curie, Fermi, Nobel, Mendel, Bohr, Lawrence, Rutherford, Meitner, and Seaborg all
made it to the Periodic Table of the Elements. Some of us in the Johnson group wished
to play a hand in our scientific immortality and decided to name alloys after ourselves.
Elements have the suffix “ium” added after the name and in order to differentiate our
alloys from elements, we had to come up with a new suffix. Indisputably Amorphous
Metal, “IAM,” seemed like a good suffix that would sound elemental. It further amused
because of the biblical reference in Exodus, and because the plural, IAMS, could be
confused for a dog food. Just to make sure these alloys are in print and not limited to oral
histories of the Johnson research group they are recorded here.
• Aaroniam Zr35Ti30Be29Co6
• Marioniams A class of Ni and Cu free Pd glasses [55]
• O’Reillyam / O'Reilliam Zr35Ti30Be30Al5*
*In honor of my favorite news commentator, I have named a cutting edge alloy after Bill
O’Reilly. This alloy, O'Reillyam (O'Reilliam) is less dense than others in its family and
can withstand a corrosive environment 1,000,000 times longer than its precious-metal
sister.
After inventing and naming the alloys, some of the properties needed to be
studied. The squish test proposed by Schroers, as a way to rank thermoplastic formability
of different alloys, was performed on the alloys favored for TPF in the literature, namely,
Pd43Ni10Cu27P20, Pt57.5Ni5.3Cu14.7P22.5, Zr41.2Ti13.8Cu12.5Ni10Be22.5 (Vitreloy 1), and

1.25
Zr44Ti11Cu10Ni10Be25 (Vitreloy 1b) as well as the alloy we invented with the largest ΔT,
Zr35Ti30Be27.5Cu7.5. The squish test indicated that Zr35Ti30Be27.5Cu7.5 had the best
potential for TPF of any of the alloys tested. Details of the squish test are included in
Chapter 4 of this thesis.
η(T) and TTT measurements for Zr35Ti30Be27.5Cu7.5 were taken to quantitatively
determine the TPF. Details of these experiments in Chapter 4 reveal a surprisingly high
fragility was calculated for this alloy that does not fit well with other Vitreloy alloy data.
It has been neglected so far, but many of the ternary alloys showed the double
discontinuity in heat capacity that Tanner proposed was evidence of two glasses. Many
of the quaternary compositions based on the “two Tg” ternaries also showed the double
jump in heat capacity. A more detailed study of the flow properties of these materials
with the two Tg events is included in Chapter 6 of this thesis. The unusual flow
properties of these materials may be the reason for the high fragility calculated for
Zr35Ti30Be27.5Cu7.5 which exhibits the two Tg phenomenon. A plot in Chapter 5 of ηTT
(using heating data) for the commonly used TPF alloys and the newly invented
Zr35Ti30Be27.5Cu7.5 verify as the squish tests did that Zr35Ti30Be27.5Cu7.5 is the best
available for TPF applications like injection molding. That plot is reprinted here as
Figure 1.9.

1.26
10000
100000
1000000
10000000
0 100 200 300 400 500 600
Time to crystallize [s]
Visc
osity
[Pa-
s]
Pt57.3Ni5.3Cu14.6P22.8
Pd40Ni10Cu30P20
Zr44Ti11Be25Ni10Cu10
Zr35Ti30Be27.5Cu7.5
Figure 1.9: Time to crystallization versus viscosity plot for four thermoplastically processable alloys. This plot combines TTT and viscosity versus time data to show available processing time for a given viscosity for the alloys [7, 37, 40-41, 56]. Figure reproduced in Chapter 5.
A TPF process like injection molding takes 60 - 300 s. If we look at Figure 1.9,
we see that Zr35Ti30Be27.5Cu7.5 has 10 times lower processing viscosities in that time
frame than any other metallic glass. This is a huge alloy development success, but
unfortunately not a candidate to replace plastics in injection molding because plastics
process at 102 - 103 Pa-s while this alloy only reaches viscosities of 104 Pa-s at the times
required for injection molding.
Determined to have some success after this much work, we modified an injection
molding setup to maximize the nozzle diameter, increase the available force, and heat the
feedstock to temperatures higher than those used for processing plastics. As we tried to

1.27
make Zr35Ti30Be27.5Cu7.5 feedstock we ran into additional problems. Alloys are melted
on an arc melter and if the ingot cools amorphous, the value of ΔT ~ 165 °C. If the alloy
is remelted and cast into a mold, ΔT decreases. We tried various temperatures and hold
times while melting the alloy in quartz tubes and water quenching and the value of ΔT
decreased. The details of this study are included in Chapter 5.
Finally we decided that amorphous ingots from the arc melter must be used as
feedstock material. The bottom of the ingots however had a thin crystalline layer because
of direct contact with the cooled hearth and had to be cut off with a diamond saw. After
verifying that the ingots were completely amorphous, multiple attempts at injection
molding were made using varying temperatures and pressures. The modifications were
successful and the first ever injection molded metallic glass part was created. A figure
showing the polished injection molded part from Chapter 5 is included below as Figure
1.10. The injection molded part had superior mechanical properties to a die cast
specimen of the same dimensions. Details can be found in Chapter 5.
Figure 1.10: Photograph of the polished injection molded part prior to final sectioning for three-point bend testing.
Viscosity measurements performed on Zr35Ti30Be27.5Cu7.5 had some unusual
characteristics that were neglected in the push to be the first person to injection mold a
metallic glass. A DSC scan of the SCLR of Zr35Ti30Be27.5Cu7.5 is magnified to show the

1.28
apparent two Tg phenomenon in Figure 1.11. Viscosity measurements of this alloy would
show small deformation for the first 50 °C after the calorimetric Tg1 and then the
deformation rate would increase dramatically after the calorimetric Tg2. After
successfully injection molding this alloy, curiosity prompted a revisiting of the ternary
alloys that showed the most prominent discontinuities in heat capacity.
0.24
0.26
0.28
0.3
0.32
0.34
250 300 350
Temperature [C]
Hea
t Flo
w [W
/g]
Tg1
Tg2?
Exo
Figure 1.11: Apparent two Tg phenomenon seen in 20 K/min DSC scan of Zr35Ti30Be27.5Cu7.5.
The ternary alloys with the most prominent double heat capacity discontinuities
lay along the (ZraTi1-a)60Be40 composition line. Three regions of flow were observed in
these alloys with discontinuities in the slope of the η(T) measurements roughly
correlating to the Tg values measured in the DSC. Figure 1.12 shows a representative
viscosity curve superimposed with a DSC curve for this composition line. The alloy
should have about 60% of the low Tg phase and 40% of the high Tg phase. Viscosity is
plotted on the left vertical axis, temperature is along the x axis and the heat capacity is

1.29
along the right vertical axis. Although there is some controversy in the BMG community
over the existence of two phases in these alloys, the flow behavior can be nicely
explained with the two phase assumption. In region 1, both phases are below their glass
transition temperatures and would behave like solids. In region 2, the phase with the
lower Tg softens and the other phase is still below its Tg so a solid + liquid flow is
observed. In region 3, the second glass softens at temperatures above Tg2 and we get
liquid + liquid flow, where the two liquids have different viscosities. A large body of
theoretical work has been done on two phase flow and with some hefty assumptions, a
qualitative picture of what a two phase glass η(T) plot should look like is included in
Derivation 8. The analysis predicts changes of slope in η(T) as observed experimentally.
Zr30Ti30Be40 DSC and Viscosity
1.E+08
1.E+09
1.E+10
1.E+11
1.E+12
1.E+13
250 300 350 400Temperature [C]
Visc
osity
[Pa-
S]
5.0E-02
7.0E-02
9.0E-02
1.1E-01
1.3E-01
Hea
t Flo
w [W
/g]
viscosity 1.5NDSC
Exo
Tg1
Tg2
Figure 1.12: DSC and viscosity curve plotted against temperature for Zr30Ti30Be40 which shows about 60% of the low Tg phase and 40% of the high Tg phase. The viscosity plot shows two flow regions roughly corresponding to the discontinuities in heat capacity seen in the DSC.

1.30
If we assume that the magnitude of the discontinuities in heat capacities, Δcp1 and
Δcp2, are directly correlated to the fraction of each phase, we can look at how
composition affects phase fraction. Figure 1.13 is reproduced in Chapter 6 where the two
Tg story is thoroughly presented, but is necessary to illustrate this concept. A linear
relationship was found between Zr concentration in the alloy and the fraction of phase 1
= Δcp1/(Δcp1 + Δcp2). The linear relationship of these variables viewed in the context of a
rule of mixtures analysis predicts a metastable miscibility gap in the SCLR. This is
similar to the phenomenon seen in the phase separating Vitreloy glasses studied by
Johnson et al. [15-17] described in Section 1.2, but no annealing is required to cause
phase separation. Using a fit to the Zr concentration vs Δcp1/( Δcp1 + Δcp2) data presented
in Chapter 6, we can predict the compositions that should show all phase 1 or all phase 2
by setting Δcp1/( Δcp1 + Δcp2) = 1 or 0 respectively. Amorphous samples of these
compositions showed only single discontinuities in heat capacity as expected from single
phase glasses. If this two phase analysis is correct, the endpoints of the miscibility gap
have been discovered and the phases into which the alloy separates are known.
Rule of Mixtures Iso-Be
y = 1.7053x - 0.2273 (Be=40)
y = 0.9426x + 0.3929 (Be=35)
0.0
0.2
0.4
0.6
0.8
1.0
0 0.2 0.4 0.6 0.8 1
Zr/(100-Be)
ΔC
p1/(Δ
Cp1
+ΔC
p2)
Figure 1.13: Plot of Δcp1/(Δcp1 + Δcp2) versus Zr concentration gives fraction of phase 1 assuming two glassy phases with similar fragilities. Linear fits indicate rule of mixtures analysis is appropriate and suggests a metastable miscibility gap in SCLR.

1.31
The alloy calculated to contain only phase 1 was Zr43Ti17Be40. The alloy
calculated to contain only phase 2 was Zr8Ti52Be40. If phase separation into these single
phase compositions existed in the two Tg alloys, Z contrast imaging in the SEM seemed
like a good way to prove their existence. SEM failed to observe the phases suggesting
that perhaps the scale of phase separation was too small. This was plausible because
Johnson et al. calculated the scale of phase separation was 13nm in Vitreloy compositions
from SANS data [15]. TEM work also failed to reveal the two phases. Bright field (BF)
and dark field (DF) images showed no evidence of phase separation at nm length scales.
Diffraction patterns may have had broadening of the amorphous halo, but were not
distinct enough to prove phase separation. Composition analysis was also inconclusive.
If the phase separation is very small, on the order of 3 - 5nm or the size of an STZ, the
electron interactions with multiple phase regions would be averaged over the thickness of
the sample and would mask BF or DF contrast.
It is disheartening not to have microscopic evidence of the two phases. Ternary
samples had limited GFA so preparation of a sample for SANS is difficult. SAXS is a
good technique for observing composition fluctuations that we are pursuing at Argonne
National Labs. We discovered that these samples could be doped with up to 2% Fe
without diminishing the apparent two Tg effect and hoped that Mössbauer spectroscopy
might reveal two local environments. We doped the two endpoint compositions expected
to contain only one phase with 2% Fe and observed two distinct spectra. Two
intermediate compositions showing the two Tg phenomenon were also doped with 2% Fe.
The two intermediate compositions had Mössbauer spectra identical to the Zr8Ti52Be40
alloy. Various annealing times and temperatures were tried on the two Tg alloys with no
1.32
change in the spectra. If we had microscopic evidence of the two phases, we could argue
that all the Fe went to the Ti rich phase and therefore all spectra looked like the
Zr8Ti52Be40 alloy except the Zr43Ti17Be40 composition where the Fe was forced into the
Zr rich phase because there was no Ti rich phase present. This explanation seems
implausible given the entropic driving force to dissolve impurities in a phase.
Additionally there seems to be no insolubility of Fe in the FeZr phase diagram.
The anomalous flow behavior of alloys with an apparent two Tg event was
observed and the steeper slope of η(T) in the “liquid + liquid” region 3 may be the reason
for the higher than expected fragility calculated for Zr35Ti30Be27.5Cu7.5 reported in
Chapter 4. Chapter 6 clearly shows the presence of two relaxation phenomena in the
SCLR of these alloys, but fails to convincingly establish the presence of two phases.
1.6.1 Biocompatible Beryllium???
Appendices A1, A2, and A3 were a digression from the thermodynamics, flow
properties and TPF theme of this work, but represent efforts to commercialize a few of
the more amazing alloys and led to some important discoveries.
ZrTiBe alloys have high strength, high hardness, good wear characteristics, high
corrosion resistance, high elastic limit, and low Young’s modulus [57-59]. They fail
catastrophically in tension and can show some compressive plasticity in compression [57,
60]. They are less dense than steel, more dense than Al and some compositions approach
the density of Ti [57]. The fatigue properties were wonderful according to some groups
in 2005 and terrible according to other groups [61-62]. One promising application we
saw for these alloys was as orthopaedic hardware.

1.33
Hip replacements have some characteristic failure mechanisms. Wear debris can
be created as the ball and socket material rub together [63]. This wear debris migrates
into the surrounding tissue and causes inflammation. The hardness and good wear
characteristics of ZrTiBe glasses could diminish the likelihood of this failure mechanism.
Another problem is called stress shielding [64]. The commonly used implant materials
have stiffnesses or Young’s modulii much higher than bone. As a result, the load on the
hip is carried mainly by the metallic implant material and not the bone surrounding it. As
a result of this stress shielding, the body decreases the unused bone's density, the implant
loosens, and fracture can result. The Young’s modulus of ZrTiBe BMG is much lower
than the commonly used implant materials and could diminish stress shielding. Another
failure mechanism is fatigue cracking [65]. The size and type of artificial hip is
determined prior to surgery. If a person gains weight and stresses the hip more than was
estimated, fatigue conditions accelerate and the socket joint can fail catastrophically. The
good corrosion resistance and high strength of ZrTiBe glasses along with some of the
promising fatigue data made us hopeful that the newly discovered alloys would be
unaffected by this failure mechanism as well.
The newly invented alloys showed promise to solve some of the mechanical
failure mechanisms of hip joints or more broadly orthopaedic hardware, but
biocompatibility of these alloys was unknown. Zr and Ti are well known for their
biocompatibility. Many alloys free of Ni and Cu had been invented and Ni and Cu are
known for poor biocompatibility. Beryllium is a known respiratory toxin, but very little
data on cytotoxicity of Be containing alloys was found in the literature. A good indicator
of biocompatibility is corrosion resistance [66]. Zr based BMG compositions are known

1.34
to have good corrosion resistances in saline environments [67] and biologically relevant
solutions [68] and this suggested they might show good biocompatibility.
With limited equipment to test corrosion at Caltech, we chose four highly
corrosive solutions, (37% w/w HCl, 0.6M NaCl, 50% w/w NaOH, and 10x phosphate
buffered saline (PBS)), to test the corrosion resistance of three metallic glass
compositions, (Zr35Ti30Be35, Zr35Ti30Be29Co6, and Zr44Ti11Cu10Ni10Be25), and three
commonly used alloys for biomedical applications (Ti-6Al-4V, 316L Stainless Steel, and
CoCrMo). Mass loss measurements were conducted at 1 week, 1 month, and 3 months.
Inductively coupled plasma mass spectrometry (ICPMS) measurements were used to
analyze the solution for dissolved elements. Details of this study are included in
Appendix A1. It was determined from mass loss data that all alloys had excellent
corrosion resistance in all solutions except for HCl. ICPMS data was inconclusive for
some of the solutions because the amount of dissolved material was below the detection
limit.
Corrosion rates in HCl were enormous for most of the alloys tested.
Zr44Ti11Cu10Ni10Be25 dissolved in under 10 minutes. Most of the other alloys were
completely dissolved in 1 week, Zr35Ti30Be35 survived for almost 1 month, and the only
alloy to survive the full 3 months was CoCrMo which lost 12% of its mass. Corrosion
rates in HCl were seen to vary by many orders of magnitude depending on composition.
We sought to find the most corrosion resistant BMG for biological applications and given
that this was an acidic chloride containing environment, we saw an opportunity to quickly
differentiate corrosion resistances in a possibly biologically relevant accelerated
corrosion environment.

1.35
Zr35Ti30Be35 quaternary variants showed the most promise for injection molding
so the bulk of the corrosion testing focused on those compositions. Depending on the
fourth alloying element, the corrosion rate varied from 107 MPY to 50 MPY where MPY
is a corrosion penetration rate that measures .001 in / year thickness loss. A plot of
standard hydrogen electrode (SHE) half cell potential of the fourth alloying element vs
Log(MPY) gave a fairly linear relationship. This was unexpected and has not been
satisfactorily explained. The most noble alloying element Pd, when substituted for 4%
Be, caused the highest corrosion rate while Al, which has the most anodic half cell
potential, when substituted for 5% Be, caused the lowest corrosion rate of the ZrTiBe
compositions tested in HCl. The problem with Al addition was that it raised Tg and
decreased GFA and ΔT (see Chapter 3). More details can be found in Appendix A1.
Zr35Ti30Be35 and Zr35Ti30Be29Co6 were chosen for further biocompatibility testing.
Zr35Ti30Be35 exhibited one of the best corrosion resistances in HCl, had moderate GFA =
6mm, had a moderate ΔT = 120 °C and good strength to weight ratio. Zr35Ti30Be29Co6
had good corrosion resistance, but much better GFA = 15mm, ΔT = 155 °C, and showed
good potential for TPF. Samples were sent to a testing company NAMSA and short term
in vitro and in vivo studies were done to assess biocompatibility. Both alloys performed
as well as the control specimen and were considered biocompatible in these short term
trials. I took a semester long cell culture class at PCC and had the opportunity to test the
cytotoxicity of the 10x PBS solutions in which the metals were tested for corrosion
resistance. The solution was diluted to regular 1x strength and no visible damage to the
cells resulted after they were exposed to the media and allowed to reach 90% confluence.
We became aware of extensive biocompatibility testing performed for Liquidmetal

1.36
Technologies on samples of Vitreloy 1 and a glassy composite material called LM2 in an
effort to obtain FDA approval. The testing showed that both Vitreloy and the Be
containing LM2 were viable as biomaterials and had even passed 1 year in vivo studies in
New Zealand White Rabbits. The results of the biocompatibility testing are more
thoroughly discussed in Appendix A2.
Discussions with Liquidmetal Technologies revealed that the FDA approval
process had been abandoned temporarily not because of biocompatibility issues, but
because of corrosion fatigue issues with these alloys. Given our improvements in ZrTiBe
alloy corrosion resistance we arranged a collaboration with Dr. Liaw at the University of
Tennessee, Knoxville and provided Zr35Ti30Be35 and Zr35Ti30Be29Co6 samples for
corrosion testing in NaCl solutions and corrosion fatigue testing. Our newly invented
alloys showed more than an order of magnitude increase in corrosion resistance in
simulated sea water solutions as compared to other ZrTi based BMG compositions and
even better than other crystalline alloys commonly used in marine environments.
Corrosion fatigue results however, were unimproved over other ZrTi based glass forming
compositions.
X-ray photoelectron spectroscopy, XPS, studies of the surface chemistry of these
new compositions revealed a fully oxidized surface that likely acts as an effective
corrosion barrier in static corrosion testing. This oxide layer is expected to have low
fracture toughness if the fracture toughnesses of Zr, Ti, or Be oxides are representative of
the alloy's surface oxide fracture toughness. As a result of the applied stresses in
corrosion fatigue testing, the surface layer cracks allowing the corrosive solution access
1.37
to the unoxidized inner material, resulting in a corrosion couple between the inner
material and cracked surface layer. More details of this study are found in Appendix A3.
1.7 Introduction Summary
The thermoplastic formability (TPF) of metallic glasses was found to be related to
the calorimetrically measured crystallization temperature minus the glass transition
temperature, Tg - Tx = ΔT. Alloy development in the ZrTiBe system identified a
composition with ΔT = 120 °C. Many alloys with ΔT > 150 °C and one alloy,
Zr35Ti30Be27.5Cu7.5, with ΔT = 165 °C were discovered by substituting Be with small
amounts of fourth alloying elements. The viscosity as a function of temperature, η(T),
and time temperature transformation (TTT) measurements for the new alloy are presented
and combined to create ηTT plots (viscosity time transformation) that are useful in
determining what viscosities are available for a required processing time. ηTT plots are
created for many alloys used in TPF in the literature and it is found that for processes
requiring 60 - 300 s, Zr35Ti30Be27.5Cu7.5 provides an order of magnitude lower viscosity
for processing than the other metallic glasses. Injection molding is demonstrated with
Zr35Ti30Be27.5Cu7.5 and the part shows improved mechanical properties over die cast
specimens of the same geometry. Changes of slope in η(T) measurements were observed
and investigated in some quaternary compositions and found to be present in ternary
compositions as well. Traditionally metallic glasses show a single discontinuity in heat
capacity at the glass transition temperature. Alloys with the changes in slope of η(T)
were found to show two discontinuities in heat capacity with the changes in slope of η(T)
roughly correlating with the observed Tg values. These two Tg values were assumed to
arise from two glassy phases present in the alloy. Further heat capacity analysis found

1.38
systematic trends in the magnitude of the heat capacity discontinuities with composition
and the single phase compositions of a metastable miscibility gap were discovered.
Microscopic evidence of the two phases is lacking so we must limit our claims to
evidence of two relaxation phenomena existing and can’t definitively claim two phases.
The alloy development led to the discovery of alloys with densities near Ti that
are among the highest strength to weight ratio materials known. Alloys with corrosion
resistances in simulated sea water 10x greater than other Zr based glasses and commonly
used marine metals were discovered. Glasses spanning 6 orders of magnitude in
corrosion resistance to 37% w/w HCl were discovered. Corrosion fatigue in saline
environments remains a problem for these compositions and prevents their utility as
biomaterials despite good evidence of biocompatibility in in vitro and in vivo studies.
Chapter 1 References [1] J. Schroers, W.L. Johnson, R. Busch, Appl. Phys. Lett. 77 (2000) 1158. [2] S.R. Elliott, Physics of Amorphous Materials, second ed., John Wiley & Sons
Inc., New York, 1990, pp. 29-69. [3] J. Schroers, A. Masuhr, W.L. Johnson, R. Busch, Phys. Rev. B 60 (1999) 11855. [4] A. Peker, W.L. Johnson, Appl. Phys. Lett. 63 (1993) 2342. [5] Y.J. Kim, R. Busch, W.L. Johnson, A.J. Rulison, W.K. Rhim, Appl. Phys. Lett.
68 (1996) 1057. [6] H. Vogel, Z. Phys. 22 (1921) 645. [7] W.L. Johnson, M.D. Demetriou, J.S. Harmon, M.L. Lind, K. Samwer, MRS Bull.
32 (2007) 644. [8] M.C. Lee, J.M. Kendall, W.L. Johnson, Appl. Phys. Lett. 40 (1982) 382. [9] W.L. Johnson, Amorphe Metallische Werkstoffe 14, Metalltagung in der DDR
(1981) 183. [10] R. Schulz, K. Samwer, W.L. Johnson, J. Non-Cryst. Solids 61 & 62 (1984) 997. [11] L.E. Tanner, R. Ray, Scripta Metal. 11 (1977) 783. [12] R. Hasegawa, L.E. Tanner, Phys. Rev. B 16 (1977) 3925. [13] L.E. Tanner, R. Ray, Acta Metall. 27 (1979) 1727. [14] L.E. Tanner, R. Ray, Scripta Metall. 14 (1980) 657. [15] S. Schneider, P. Thiyagarajan, U. Geyer, W.L. Johnson, MRS Technical Report
DOI 10.2172/510428 (1996). [16] S. Schneider, P. Thiyagarajan, U. Geyer, W.L. Johnson, Physica B 241 (1998)
918.
1.39
[17] S. Schneider, U. Geyer, P. Thiyagarajan, W.L. Johnson, Materials Science Forum Vols. 235-238 (1997) 337.
[18] W. Liu, W.L. Johnson, S. Schneider, U. Geyer, P. Thiyagarajan, Phys. Rev. B 59 (1999) 11755.
[19] Q. Zhang, W. Zhang, G. Xie, A. Inoue, Mater. Sci. Eng. B 148 (2008) 97. [20] B.J. Park, H.J. Chang, D.H. Kim, W.T. Kim, K. Chattopadhyay, T.A.
Abinandanan, S. Bhattacharyya, Phys. Rev. Lett. 96 (2006) 245503. [21] R.G. Hennig, A.E. Carlsson, K.F. Kelton, C.L. Henley, Phys. Rev. B 71 (2005)
144103. [22] X.P. Tang, J.F. Löffler, W.L. Johnson, Y. Wu, J. Non-Cryst. Solids 317 (2003)
118. [23] B. Van de Moortele, T. Epicier, J.L. Soubeyroux, J.M. Pelletier, Phil. Mag. Lett.
84 (2004) 245. [24] G. Wang, J. Shen, J.F. Sun, B.D. Zhou, J.D. Fitz Gerald, D.J. Llewellyn, Z.H.
Stachurski, Scripta Mater. 53 (2005) 641. [25] J.H. Na, Y.C. Kim, W.T. Kim, D.H. Kim, Met. Mater. Int. 14 (2008) 553. [26] G. Kumar, D. Nagahama, M. Ohnuma, T. Ohkubo, K. Hono, Scripta Mater. 54
(2006) 801. [27] D. Nagahama, T. Ohkubo, K. Hono, Scripta Mater. 49 (2003) 729. [28] T. Abe, M. Shimono, K. Hashimoto, K. Hono, H. Onodera, Scripta Mater. 55
(2006) 421. [29] J. Schroers, Acta Mater. 56 (2008) 471. [30] J. Schroers, JOM 57 (2005) 35. [31] J. Schroers, N. Paton, Adv. Mater. Processes 164 (2006) 61. [32] T. Masumoto, A. Inoue, N. Nishiyama, H. Horimura, T. Shibata, US Patent
#6027586. [33] T. Masumoto, A. Inoue, J. Nagahora, K. Kita, US Patent #5209791. [34] K.S. Lee, Y.W. Chang, Mater. Sci. Eng. A 399 (2005) 238. [35] Y. Saotome, K. Imai, S. Shioda, S. Shimizu, T. Zhang, A. Inoue, Intermetallics 10
(2002) 1241. [36] J. Schroers, Q. Pham, A. Peker, N. Paton, R.V. Curtis, Scripta Mater. 57 (2007)
341. [37] G. Duan, A. Wiest, M.L. Lind, J. Li, W.K. Rhim, W.L. Johnson, Adv. Mater. 19
(2007) 4272. [38] Y. Li, S.J. Poon, G.J. Shiflet, J. Xu, D.H. Kim, J.F. Löffler, MRS Bull. 32 (2007)
624. [39] A.L. Greer, E. Ma, MRS Bull. 32 (2007) 611. [40] B.A. Legg, J. Schroers, R. Busch, Acta Mater. 55 (2007) 1109. [41] T. Waniuk, J. Schroers, W.L. Johnson, Phys. Rev. B 67 (2003) 184203. [42] J. Schroers, W.L. Johnson, Appl. Phys. Lett. 84 (2004) 3666. [43] G.J. Fan, H.J. Fecht, E.J. Lavernia, Appl. Phys. Lett. 84 (2004) 487. [44] J.P. Chu, H. Wijaya, C.W. Wu, T.R. Tsai, C.S. Wei, T.G. Nieh, J. Wadsworth,
Appl. Phys. Lett. 90 (2007), 034101. [45] A. Masuhr, T.A. Waniuk, R. Busch, W.L. Johnson, Phys. Rev. Lett. 82 (1999)
2290. [46] R. Busch,W.L. Johnson, Appl. Phys. Lett. 72 (1998) 2695.

1.40
[47] F. Spaepen, Acta Metall. 25 (1977) 407. [48] J. Lu, G. Ravichandran,W.L. Johnson, Acta Mater. 21 (2003) 3429. [49] L. Kaufman, L.E. Tanner, CALPHAD 3 (1979) 91. [50] L.E. Tanner, R. Ray, C.F. Cline, US Patent #3989517. [51] L.E. Tanner, R. Ray, C.F. Cline, US Patent #4050931. [52] A. Peker, W.L. Johnson, US Patent #5288344. [53] G. Duan, A. Wiest, W.L. Johnson, US Patent Application #20080121316. [54] G. Duan, A. Wiest, M.L. Lind, A. Kahl, W.L. Johnson, Appl. Phys. Lett. 90
(2007) 211901. [55] M.D. Demetriou, A. Wiest, W.L. Johnson, US Patent Application #20090162629. [56] J.F. Löffler, J. Schroers, W.L. Johnson, Appl. Phys. Lett. 77 (2000) 681. [57] G. Duan, A. Wiest, M.L. Lind, A. Kahl, W.L. Johnson, Scripta Mater. 58 (2008)
465. [58] A. Wiest, G.Y. Wang, L. Huang, S. Roberts, M.D. Demetriou, P.K. Liaw, W.L.
Johnson, Scripta Mater. in review. [59] M.Z. Ma, R.P. Liu, Y. Xiao, D.C. Lou, L. Liu, Q. Wang, W.K. Wang, Mater. Sci.
Eng. A 386 (2004) 326. [60] D.C. Hofmann, J.Y. Suh, A. Wiest, G. Duan, M.L. Lind, M.D. Demetriou, W.L.
Johnson, Nature 451 (2008) 1085. [61] G.Y. Wang, P.K. Liaw, A. Peker, B. Yang, M.L. Benson, W. Yuan, W.H. Peter,
L. Huang, M. Freels, R.A. Buchanan, C.T. Liu, C.R. Brooks, Intermetallics 13 (2005) 429.
[62] C.J. Gilbert, J.M. Lippmann, R.O. Ritchie, Scripta Mater. 38 (1998) 537. [63] C.R. McMillin, in: B.D. Ratner, A.S. Hoffman, F.J. Schoen, J.E. Lemons (Eds.),
Biomaterials Science: An Introduction to Materials in Medicine, Academic Press, California, 1996, pp. 267-271.
[64] J. Black, Biological Performance of Materials: Fundamentals of biocompatibility, fourth ed., CRC Press, Florida, 2006.
[65] M. Niinomi, T. Hattori, T. Kasuga, H. Fukui, in: G.E. Wnek, G.L. Bowlin (Eds.), Encyclopedia of Biomaterials and Biomedical Engineering, second ed., Informa Healthcare USA, Inc., New York, 2008, pp. 2876-2892.
[66] G.L. Burke, Can. Med. Assoc. J. (1940) 125. [67] M.L. Morrison, R.A. Buchanan, P.K. Liaw, B.A. Green, G.Y. Wang, C.T. Liu,
J.A. Horton, Mater. Sci. Eng. A 467 (2007) 198. [68] M.L. Morrison, R.A. Buchanan, R.V. Leon, C.T. Liu, B.A. Green, P.K. Liaw, J.A.
Horton, J. Biomed. Mater. Res. Part A 74 (2005) 430.

2.1
Chapter 2 - Lightweight Ti-based Bulk Glassy Alloys Excluding Late Transition Metals
This chapter draws heavily on the article, “Lightweight Ti-based Bulk Glassy
Alloys Excluding Late Transition Metals,” published in Scripta Materialia [G. Duan, A.
Wiest, M.L. Lind, A. Kahl, W.L. Johnson, Scripta Mater. 58 (2008) 465]. It discusses
lightweight Ti based bulk amorphous metals with more than double the specific strength
of conventional titanium alloys discovered in the course of alloy development in the
ZrTiBe system. Thermal, elastic, and mechanical properties of these metallic glasses
were studied and presented. These amorphous alloys exhibit good glass forming ability,
exceptional thermal stability, and high strength. The research results have important
implications on designing and developing bulk metallic glasses (BMG). The
technological potential of this class of lightweight Ti based glassy alloys as structural
metals is very promising.
Owing to their high glass forming ability (GFA), good processing ability, and
exceptional stability with respect to crystallization along with many promising properties
such as high strength, elastic strain limit, wear resistance, fatigue resistance, and
corrosion resistance, BMG have garnered considerable attention in the past 20 years
scientifically and technically [1-2]. To date, families of binary and multi-component
systems have been designed and characterized to be BMG formers [3-15] among which
highly processable ZrTiCuNiBe BMG (Vitreloy series) have been used commercially for
items such as sporting goods and electronic casings [3, 16].
Prior research results teach that Be bearing amorphous alloys (Vitreloy series)
require the presence of at least one early transition metal (ETM) and at least one late
transition metal (LTM) in order to form BMG. It is believed that BMG containing

2.2
certain LTM (e.g., Fe, Ni, Cu) have potential advantages including better glass forming
ability, higher strength and elastic modulus, and lower materials cost. However, because
of the high density of LTM, glassy alloys containing LTM will have higher densities than
alloys excluding LTM. Vitreloy alloys have densities of about ~ 6 g/cc [17] and are
therefore limited in their uses in structural applications requiring low density and high
specific strength materials. The elimination of LTM would make this class of materials
ideal for structural applications where specific strength and specific modulus are key
figures of merit. We discovered that Be bearing alloys excluding LTM are excellent bulk
metallic glass formers and have a 20% to 40% advantage over Vitreloy alloys in density
while still possessing high strength and high elastic modulus.
Conventional titanium alloys have been widely used in the aerospace industry due
to their resource availability, low density and high specific strength. However no Ti
based BMG with density comparable to that of pure titanium or Ti-6Al-4V alloy have
been discovered yet, although researchers have developed several Ti based glass forming
systems [13, 18-20]. Recently BMG forming alloys in the form of glassy ingots were
discovered in TiZrNiCuBe system [13]. Up to 14mm amorphous rods could be
successfully produced. For a typical Ti40Zr25Ni3Cu12Be20 alloy, a density of ~ 5.4 g/cc
was obtained. In this chapter we report a class of Ti based bulk amorphous alloys with
high GFA, exceptional thermal stability, and low density (~ 4.59 g/cc) comparable to that
of pure titanium, as well as very high specific strength.
Tanner reported that some TiBe, ZrBe and TiZrBe compositions could be made
amorphous at very high cooling rates of ~ 106 K/s [21-24]. These cooling rates are
achievable using splat quenching or melt spinning techniques, which limits the thickness

2.3
of the alloys to 30 - 100μm. However, no bulk glass formers have been identified in the
ternary TiZrBe system. This research discovered that TiZrBe compositions are not
limited to 30 - 100μm thick foils, but many compositions can be cast into bulk samples of
1 - 6mm thickness. This discovery reveals alloys can be cooled amorphous 1000 times
slower than reported by Tanner [21-24].
Mixtures of elements of purity ranging from 99.9% to 99.99% were alloyed in an
arc melter with a water cooled copper plate under a Ti-gettered argon atmosphere. Each
ingot was flipped over and remelted at least three times in order to obtain chemical
homogeneity. After the alloys were prepared, the materials were cast into machined
copper molds under high vacuum. These copper molds have internal cylindrical cavities
of diameters ranging from 1 - 10mm. A Philips X’Pert Pro X-ray Diffractometer and a
Netzsch 404C Pegasus Differential Scanning Calorimeter (DSC) with graphite crucibles
performed at a constant heating rate 20 K/min were utilized to verify the amorphous
natures and to examine the thermal behavior of these alloys. We evaluated the elastic
properties of the samples using ultrasonic measurements along with density
measurements. The pulse-echo overlap technique was used to measure the shear and
longitudinal wave speeds at room temperature for each of the samples. 25 MHz
piezoelectric transducers and a computer controlled pulser/receiver were used to produce
and measure the acoustic signal. The signal was measured using a Tektronix TDS 1012
oscilloscope. Sample density was measured by the Archimedean technique according to
the American Society of Testing Materials standard C 693-93. Cylindrical rods 3mm in
diameter x 6mm in height were used to measure mechanical properties of the lightweight
Ti based bulk glassy alloys on an Instron testing machine at a strain rate of 1*10-4 s-1.

2.4
S1
S2
S3
(a)
Before these mechanical tests, both ends of each specimen were examined with X-ray
diffraction to make sure that the rod was fully amorphous and that no crystallization
occurred due to unexpected factors.
It was recently found that in the CuZrBe alloy system, the shear modulus, G, and
Poisson’s ratio, ν, are very sensitive to composition changes, where G decreases linearly
with the increasing total Zr concentration [25]. Extensive regions in the TiZrBe phase
diagram were systematically examined. The best glass forming region was found along
the pseudo-binary line, TixZr(65-x)Be35. Figure 2.1(a) shows pictures of three as-cast rods,
Ti45Zr20Be35 (S1), Ti45Zr20Be30Cr5 (S2) and Ti40Zr25Be30Cr5 (S3), having diameters of 6,
7, and 8mm, respectively. Their as-cast surfaces appear smooth and no apparent volume
reductions can be recognized on their surfaces. The X-ray diffraction patterns of S1, S2,
and S3 are presented in Figure 2.1(b). S1 and S2 have X-ray patterns indicative of fully
amorphous samples and S3 has a very small Bragg peak on an otherwise amorphous
background indicating that the critical casting diameter has been reached. Glassy rods up
to 8mm diameter are formed by the addition of 5% Cr into the ternary TiZrBe alloys.
Figure 2.1: Pictures of amorphous 6mm diameter rod of Ti45Zr20Be35 (S1), 7mm diameter rod of Ti45Zr20Be30Cr5 (S2) and 8mm diameter rod of Ti40Zr25Be30Cr5 (S3) prepared by the copper mold casting method are presented in (a). The X-ray diffraction patterns (b) verify the amorphous nature of the corresponding samples.

2.5
Thermal behavior of these glassy alloys was measured using DSC at a constant
heating rate of 20 K/min. The characteristic thermal parameters including the variations
of supercooled liquid region, ΔT, (∆T = Tx - Tg, in which Tx is the onset temperature of
the first crystallization event and Tg is the glass transition temperature) and reduced glass
transition temperature Trg (Trg = Tg/TL, where TL is the liquidus temperature) are
evaluated and listed in Table 2.1. The DSC scans are shown in Figure 2.2.
Table 2.1: Density, thermal and elastic properties of representative lightweight TiZrBe and Vitreloy type glassy alloys.
Materials ρ [g/cm3]
d [mm]
Tg [K]
Tx [K]
TL [K]
ΔT [K] Tg/TL G
[Gpa] B
[Gpa] Y
[Gpa] υ
Ti45Zr20Be35 4.59 6 597 654 1123 57 0.53 35.7 111.4 96.8 0.36
Ti40Zr25Be35 4.69 6 598 675 1125 76 0.53 37.2 102.7 99.6 0.34
Ti45Zr20Be30Cr5 5.76 7 602 678 1135 77 0.53 39.2 114.5 105.6 0.35
Ti40Zr25Be30Cr5 4.89 8 599 692 1101 93 0.54 35.2 103.1 94.8 0.35
Zr65Cu12.5Be22.5 6.12 4 585 684 1098 99 0.53 27.5 111.9 76.3 0.39
Zr41.2Ti13.8Cu12.5Ni10Be22.5 6.07 >20 623 712 993 89 0.63 37.4 115.9 101.3 0.35
Zr46.75Ti8.25Cu7.5Ni10Be27.5 6.00 >20 625 738 1185 113 0.53 35.0 110.3 95.0 0.36
Upon heating, these amorphous alloys exhibit a clear endothermic glass transition
followed by a series of exothermic events characteristic of crystallization. It appears that
Cr delays the exothermic peaks, indicating a suppression of the kinetics of crystal
nucleation and growth. In the TiZrBe ternary alloy system, the critical casting diameter
of Ti45Zr20Be35 and Ti40Zr25Be35 is 6mm (see Table 2.1). The addition of Cr increases the
crystallization temperature, stabilizes the supercooled liquid, thereby increasing the GFA.
It is known that the GFA of the present lightweight TiZrBe glassy alloys would be
dramatically improved with Ni and Cu additions as indicated in [13].

2.6
250 300 350 400 450 500 550Temperature [C]
Hea
t Flo
w (A
rb. u
nits
)
S1
S2S3
Exo
Figure 2.2: DSC scans of the amorphous Ti45Zr20Be35 (S1), Ti45Zr20Be30Cr5 (S2), and Ti40Zr25Be30Cr5 (S3) alloys at a constant heating rate of 0.33 K/s. The marked arrows represent the glass transition temperatures.
Table 2.1 also presents the density, thermal and elastic properties of representative
glassy alloys in ZrCuBe ternary systems and other Vitreloy type BMG. The value of Trg
gives a good first order approximation of GFA. The newly developed low density
TiZrBe glassy alloys show very good thermal stability against crystallization. The best
glass former Ti40Zr25Be30Cr5 possesses a large supercooled liquid region of 93 K, among
the highest in the known Ti based BMG. It is noted that the glass transition temperatures
of TiZrBe amorphous alloys fall into the same range as those of ZrCuBe glasses with the
same total Zr + Ti concentration. High Ti content alloys exhibited higher G values than
are typical for Vitreloy type alloys. Another interesting observation is that ZrTi based Be
bearing glassy alloys have to be Zr rich to exhibit a low G and a high ν.

2.7
Figure 2.3 presents typical compressive stress-strain curves for 3mm diameter
amorphous rods of the lowest density alloy, Ti45Zr20Be35, and the best glass former,
Ti40Zr25Be30Cr5. Compression tests indicate that Ti45Zr20Be35 shows fracture strength of
~ 1860 MPa, with total strain of ~ 2.2% (mainly elastic). Ti40Zr25Be30Cr5 yields at ~
1720 MPa, with an elastic strain limit of ~ 1.9%, and ultimately fractures at a strength of
~ 1900 MPa, with a plastic strain of ~ 3.5%.
0.0
0.2
0.4
0.6
0.8
1.0
1.2
1.4
1.6
1.8
2.0
0.0 1.0 2.0 3.0 4.0 5.0 6.0Strain [%]
Stre
ss [G
pa]
Ti40Zr25Be30Cr5Ti45Zr20Be35
Figure 2.3: Compressive stress-strain curves for the Ti45Zr20Be35 and Ti40Zr25Be30Cr5 3mm amorphous rods.
The current study resulted in a class of bulk amorphous alloys with high GFA,
good processing ability and exceptional thermal stability with mass densities significantly
lower than those of the Vitreloy alloys and comparable to those of pure titanium and Ti-
6Al-4V alloy (see Table 2.1). Ti45Zr20Be35 and Ti40Zr25Be30Cr5 show low densities of ~
4.59 and ~ 4.76 g/cc respectively. Compared to Vitreloy alloys, a 20 - 40% higher

2.8
specific strength is observed in the lightweight TiZrBe compositions. These lightweight
Ti based bulk amorphous alloys also exhibit higher specific strengths than crystalline Ti
alloys. For example, commercial Ti-6Al-4V exhibits a specific strength of 175 J/g, while
bulk amorphous Ti45Zr20Be35 is calculated to have a specific strength of 405 J/g. The
specific strength of Vitreloy 1 (Zr41.2Ti13.8Ni10Cu12.5Be22.5) is about 305 J/g. Thus, this
class of amorphous alloys is ideal for structural applications where specific strength and
specific modulus are key figures of merit.
In summary, lightweight Ti based bulk amorphous structural metals with low
mass density comparable to that of pure titanium have been discovered. These
amorphous alloys exhibit high GFA, exceptional thermal stability, and very high specific
strength. The research results have important implications on designing and developing
bulk metallic glasses.
The authors acknowledge the support from the MRSEC Program (Center for the
Science and Engineering Materials, CSEM) of the National Science Foundation under
Award Number DMR-0520565.

2.9
Chapter 2 References [1] W.L. Johnson, MRS Bull. 24 (1999) 42. [2] A. Inoue, Acta Mater. 48 (2000) 279. [3] A. Peker, W.L. Johnson, Appl. Phys. Lett. 63 (1993) 2342. [4] V. Ponnambalam, S.J. Poon, G.J. Shiflet, J. Mater. Res. 19 (2004) 1320. [5] V. Ponnambalam, S.J. Poon, G.J. Shiflet, J. Mater. Res. 19 (2004) 3046. [6] Z.P. Lu, C.T. Liu, J.R. Thompson, W.D. Porter, Phys. Rev. Lett. 92 (2004)
245503. [7] D.H. Xu, G. Duan, W.L. Johnson, C. Garland, Acta Mater. 52 (2004) 3493. [8] B. Zhang, D.Q. Zhao, M.X. Pan, W.H. Wang A.L. Greer, Phys. Rev. Lett. 94
(2005) 205502. [9] F.Q. Guo, S.J. Poon, G.J. Shiflet, Appl. Phys. Lett. 84 (2004) 37. [10] D.H. Xu, G. Duan, W.L. Johnson, Phys. Rev. Lett. 92 (2004) 245504. [11] F.Q. Guo, S.J. Poon, G.J. Shiflet, Appl. Phys. Lett. 83 (2003) 2575. [12] G. Duan, D.H. Xu, W.L. Johnson, Metall. Mater. Trans. A 36A (2005) 455. [13] F.Q. Guo, H.J. Wang, S.J. Poon, G.J. Shiflet, Appl. Phys. Lett. 86 (2005) 091907. [14] F.Q. Guo, S.J. Poon, X.F. Gu, G.J. Shiflet, Scripta Mater. 56 (2007) 689. [15] G. Duan, D.H. Xu, Q. Zhang, G.Y. Zhang, T. Cagin, W.L. Johnson, W.A.
Goddard, Phys. Rev. B 71 (2005) 224208. [16] A.J. Peker, W.L. Johnson, US Patent #5288344. [17] M.L. Lind, G. Duan, W.L. Johnson, Phys. Rev. Lett. 97 (2006) 015501. [18] C.L. Ma, S. Ishihara, H. Soejima, N. Nishiyama, A. Inoue, Mater. Trans. 45
(2004) 1802. [19] H. Men, S.J. Pang, A. Inoue, T. Zhang, Mater. Trans. 46 (2005) 2218. [20] J.J. Oak, D.V. Louzguine-Luzgin, A. Inoue, J. Mater. Res. 22 (2007) 1346. [21] L.E. Tanner, R. Ray, Scripta Metall. 11 (1977) 783. [22] R. Hasegawa, L.E. Tanner, Phys. Rev. B 16 (1977) 3925. [23] L.E. Tanner, R. Ray, Acta Metall. 27 (1979) 1727. [24] L.E. Tanner, R. Ray, Scripta Metall. 14 (1980) 657. [25] G. Duan, M.L. Lind, K. De Blauwe, A. Wiest, W.L. Johnson, Appl. Phys. Lett. 90
(2007) 211901.

3.1
Chapter 3 - ZrTi Based Be Bearing Glasses Optimized for High Thermal Stability
and Thermoplastic Formability
We flesh out the details of the alloy development story in this chapter with a
thorough exploration of the ZrTiBe system and the large ΔT quaternary compositions.
This chapter draws heavily on the article “ZrTi based Be bearing glasses optimized for
high thermal stability and thermoplastic formability” published in Acta Materialia [A.
Wiest, G. Duan, M.D. Demetriou, L.A. Wiest, A. Peck, G. Kaltenboeck, B. Wiest, W.L.
Johnson, Acta Mater. 56 (2008) 2625].
A new class of ZrTi based Be bearing (Vitreloy) glass forming compositions that
exhibit high thermal stability and good glass forming ability is reported. Optimized
ternary compositions were obtained by reexamining the ZrTiBe phase diagram for
regions that produce glasses having high thermal stability and modest glass forming
ability. By incorporating a fourth element in the optimized ternary compositions,
quaternary alloys were obtained having thermal stabilities twice that of
Zr41.2Ti13.8Ni10Cu12.5Be22.5 (Vitreloy 1) while exhibiting good glass forming abilities.
Optimized quaternary alloys exhibiting critical casting thicknesses exceeding 15mm and
thermal stabilities as high as 165 ºC are reported herein. The good thermal stability of
these alloys renders them attractive for forming processes that can be performed
thermoplastically in the supercooled liquid region, in a manner similar to the forming of
polymers.
3.1 Introduction
Over the last decade, families of bulk glass forming metallic systems exhibiting
remarkable glass forming ability (GFA) have been discovered [1-3]. These relatively

3.2
new materials are known to exhibit attractive mechanical properties, including high (near
theoretical) yield strengths, high elastic limits, and good wear resistance. More
interestingly, the ability of amorphous metals to soften and flow upon relaxation at the
glass transition gives rise to a viscoplastic flow behavior enabling unique forming
capabilities that resemble those of plastics and conventional glasses [4-6]. Essentially,
such thermoplastic forming ability arises as a result of the supercooled liquid thermal
stability and fragility.
The liquid thermal stability can be defined as the resistance of a glassy sample to
crystallize upon heating above the glass transition temperature, Tg, and is typically
quantified by the temperature region bounded between Tg and Tx, i.e., ΔT = Tg - Tx,
where Tx is the temperature at which a sample crystallizes at a certain heating rate. This
temperature region is typically referred to as the supercooled liquid region (SCLR). The
glass fragility (m) is referred to as the steepness of the equilibrium temperature dependent
viscosity at Tg [7]. Given that the viscosity of liquids is a hyper-Arrhenius function of
temperature, one can reasonably assume that the higher the m and ΔT for a given glass,
the lower the accessible viscosities in the SCLR that could be utilized for forming.
Many forming processes have been attempted with metallic glasses in the SCLR.
Micro and nano replication [8-9], powder consolidation [10], extrusion [11], and recently
blow molding [12] have been demonstrated. These processes are collectively referred to
as thermoplastic forming processes. The success and feasibility of these and similar
processes are dependant on the processing time available at the accessible viscosities in
the SCLR. Very few alloys are known to exhibit the combination of thermal stability and
fragility necessary for successful thermoplastic forming. The most commonly used

3.3
alloys in thermoplastic forming applications are the fragile Pd43Ni10Cu27P20 and
Pt57.5Ni5.3Cu14.7P22.5 glasses and the thermally stable Zr44Ti11Cu10Ni10Be25 (Vitreloy 1b),
but even these alloys require high pressures and undergo only limited thermoplastic
strains due to the high viscosities and limited processing times available.
In the present work, optimization of ZrTi based Be bearing glasses for large
thermal stability is attempted. Measurement of the liquid fragility of these alloys will be
the subject of future investigation. Several quaternary ZrTi based Be bearing glasses
with high ΔT and good GFA will be presented. The alloy optimization was approached
by examining the ternary ZrTiBe system for compositions exhibiting large ΔT and
modest GFA. Some of the ternary compositions investigated here for bulk glass forming
ability include those investigated previously by Tanner [13], who focused primarily on
their amorphous ribbon forming ability. An appropriate fourth “solute element” at an
optimum fraction was added to the ternary compositions, and in most cases, both ΔT and
glass forming were seen to increase until too high a concentration of solute precipitated
additional phases. Late transition metals were found to be the optimum solute element.
Ni was not considered a viable solute atom as ample evidence in the literature suggests
that the NiTi rich quasicrystal is the first phase to nucleate in Vitreloy glasses, providing
nucleation sites for other crystals that eventually crystallize the alloy [14-15]. This is the
approach that led to the development of the recently reported Zr35Ti30Cu8.25Be26.75 alloy
[16], having ΔT = 159 °C and a processing viscosity prior to crystallization of ~ 104 Pa-s.
3.2 Experimental Method
Alloys were prepared using elements of >99.9% purity. The elements were
weighed to within ± 0.1% of the calculated mass to ensure accurate compositions, and

3.4
were ultrasonically cleaned in acetone and ethanol prior to melting. Typically 6 g ingots
were arc melted on a Cu plate in a Ti-gettered argon atmosphere and flipped at least three
times to ensure chemical homogeneity. The mass was again measured after melting to
ensure proper composition, and alloys with greater than ± 0.1% deviation from the
originally weighed mass were discarded.
Rods were cast under an argon atmosphere using an Edmund Buhler mini arc
melter suction casting setup or by injecting inductively molten alloy from quartz nozzles
into a copper mold. The largest diameter rod for which each alloy casts fully amorphous
is reported as critical casting thickness or GFA. The amorphous nature of the rods was
verified using a Philips X'Pert Pro X-ray Diffractometer and thermodynamic data was
collected in graphite crucibles at 20 K/min using a Netzsch 404C Pegasus Differential
Scanning Calorimeter (DSC). Tg, Tx, solidus temperature (Ts), liquidus temperature (TL)
and enthalpy of crystallization (ΔHx) are reported.
Casting techniques introduced a large variability into the DSC results.
Thermodynamic data is reported from DSC scans of mini arc melter cast specimens. For
different segments of a mini arc melter cast rod (top, middle, bottom), there was less than
3 °C variation in Tg, Tx, Ts, and TL, while ΔHx showed less than 5% variability.
Variability between rods of the same alloy cast using identical casting methods was also
minimal. Critical casting measurements necessitated the use of die casting into large
diameter copper molds. Die casting from quartz nozzles into copper molds occasionally
lowered the Tx value by as much as 10 °C and larger diameter rods were seen to have
lower Tg values than smaller diameter rods. Error bars are ± 3 °C on temperatures and ±
5% on ΔHx.

3.5
3.3 Results and Discussion
The ZrTiBe system was investigated in the 1970s by Tanner, who discovered that
amorphous ribbons (10-100μm thick) could be produced by means of melt spinning at
cooling rates of 105 - 106 K/s [17]. Ternary phase diagrams showing isothermal sections
of the composition space are published, but very little of the thermodynamic data on the
glasses is available [18].
In this study, many of the alloys reported to be glassy ribbons were recreated,
primarily those in the low melting temperature regions given by the isothermal cross
section phase diagrams. Several bulk glasses with critical casting thicknesses between
1mm and 6mm were identified from those compositions. Bulk GFA regions are shown in
Figure 3.1. The ternary phase diagram showing the Tanner glassy ribbons region is
presented in Figure 3.2. Twenty-two bulk glass forming compositions are outlined in the
diagram. The thermodynamic data for these compositions are listed in Table 3.1.
Figure 3.1: Bulk glass forming regions shown on ZrTiBe phase diagram.

3.6
L
.
Figure 3.2: Ternary ZrTiBe phase diagram showing the region originally explored by Tanner for ribbon forming glasses (dashed line), the isothermal cross sections showing the liquid phase at various temperatures (shaded triangles), and the alloys recreated in this experiment (letters).
Alloys H, I, J and K are found to have a critical casting thickness of 6mm [19].
This is rather surprising, considering the extensive investigation previously performed in
this system. The work of Peker and Johnson [20] indicates that addition of at least one
late transition metal was necessary to form a bulk glass in this system. Tanner on the
other hand, explored the ZrTiBe system and concluded that glass formation required
cooling rates of 105 – 106 K/s, which limited the dimension of amorphous samples to ~
100μm thick. The presence of bulk glass formers in the ternary system facilitated the

3.7
optimization of quaternary alloys for large ΔT by allowing a large range of additional
elements to be added without concern for GFA.
Table 3.1: Thermodynamic data of the alloys listed in Figure 3.2.
Alloy Composition Tg [C] Tx1 [C] Tx2 [C] ΔT ΔHx [J/mol]
Ts [C] TL [C] GFA
A Zr20Ti50Be30 288.2 331.4 464.9 43.2 5610 829 >950 >1mm B Zr25Ti45Be30 308 348.1 454.2 40.1 4121 846 850.2 >1mm C Zr30Ti40Be30 293.7 339.2 439.5 45.5 6177 838 848.9 >1mm D Zr35Ti35Be30 292.2 349 431.3 56.8 6244 842 853.5 >1mm E Zr50Ti20Be30 292.3 362.9 422.3 70.6 6003 881 >900 >1mm F Zr32.5Ti35Be32.5 299.4 378.5 444.6 79.1 6477 870 922.1 >1mm G Zr15Ti50Be35 313.4 366.1 503.2 52.7 5484 830 914.5 >0.5mmH Zr20Ti45Be35 319.9 380.5 481.2 60.6 6265 836 848.5 6mm I Zr25Ti40Be35 322.3 401.7 469.8 79.4 6690 845 850.6 6mm J Zr30Ti35Be35 308 412.8 454 105 6964 838 845 6mm K Zr35Ti30Be35 319 439.2 - 120 6284 849 861.5 6mm L Zr40Ti25Be35 300.2 409 429 109 5796 838 934.3 >1mm M Zr45Ti20Be35 304.7 402.7 423.4 98 6421 877 >950 >1mm N Zr50Ti15Be35 302.4 398 418 95.6 6613 879 >950 >1mm O Zr55Ti10Be35 306.9 389.4 415.1 82.5 6747 905 >950 >0.5mmP Zr27.5Ti35Be37.5 317.4 440.2 456.5 123 7167 833 843 >1mm Q Zr32.5Ti30Be37.5 314.2 427.5 441.8 113 6469 837 846.8 >1mm R Zr37.5Ti25Be37.5 314.1 413.2 431.4 99.1 6800 831 857.7 >1mm S Zr42.5Ti20Be37.5 314.8 405.4 424.4 90.6 6382 845 880.8 >1mm T Zr20Ti40Be40 314.3 433.2 488.8 119 6542 829 853 >0.5mmU Zr25Ti35Be40 322.2 444.7 449.6 123 7104 831 842.8 >1mm V Zr30Ti30Be40 330.1 447.4 - 117 6659 826 844.1 >1mm W Zr35Ti25Be40 325.5 432.4 - 107 6422 837 850 >1mm X Zr40Ti20Be40 324.8 415.9 - 91.1 6323 842 907.2 >1mm Y Zr45Ti15Be40 326.4 411.8 - 85.4 7242 880 >900 >1mm
Error bars are ± 3 °C on temperatures and ± 5% on ΔHx.
Many alloys with large ΔT are found in the ternary system. The 20 K/min DSC
scans of some of the ternary alloys are shown in Figure 3.3. It is interesting to note that
the scans of the alloys of Figure 3.3 reveal a single exothermic peak following the glass
transition, suggesting that these alloys tend to crystallize by simultaneous crystal growth.
Many other alloys revealed a small additional exothermic event before or after the main

3.8
crystallization event indicating that for these alloys the crystallization was nearly
simultaneous. It was found that replacing small fractions of Be with certain late
transition metals in alloys that exhibited simultaneous or nearly simultaneous crystal
growth had the most beneficial effect on increasing the thermal stability of the alloys.
0
2
4
6
8
10
12
14
16
18
200 250 300 350 400 450 500Temperature [C]
Hea
t Flo
w (a
rb. r
ef.)
[W/g
]
T xT g
Zr45Ti15Be40
Zr40Ti20Be40
Zr35Ti25Be40
Zr35Ti30Be35
Zr30Ti30Be40
Exo
00.10.20.30.40.5
275 300 325 350 375
[W/g
]
Figure 3.3: 20 K/min DSC scans of several alloys in the ternary ZrTiBe system. Crystallization is seen as a single exothermic peak suggesting that these alloys tend to crystallize by simultaneous crystal growth at that heating rate. Inset: Magnified view of glass transitions (temperature axes aligned); vertical order of alloys maintained.
3.3.1 Quaternary Alloys
Quaternary variants of Zr35Ti30Be35 (Alloy K) were most thoroughly investigated
because alloy K is in the best glass forming region and has the largest ΔT while still
exhibiting simultaneous crystal growth in a 20 K/min DSC scan. Al, Fe, Co, and Cu
were substituted for Be and the effect on ΔT was monitored. An increasing ΔT resulted
from additions of Fe, Co, and Cu until too high a concentration was reached. Table 3.2

3.9
lists the compositions and thermodynamic data for quaternary variants of Alloy K.
Figure 3.4 presents 20 K/min DSC scans showing the effect on thermal stability of
various additions of Cu, Co, and Fe.
Table 3.2: Thermodynamic data for quaternary variants of Zr35Ti30Be35 (Alloy K) obtained by substituting Cu, Co, Fe, Al for Be.
Tg[C] Tx1[C] Tx2[C] ΔT
ΔHx (J/mol)
Ts[C] TL[C] GFA
Zr35Ti30Be35 (Alloy K) 319 439.2 - 120.2 6284 848.6 861.5 6mm
Zr35Ti30Be30Cu5 301.7 452.1 - 150.4 7549 674.5 841.2 >10mmZr35Ti30Be27.5Cu7.5 301.4 466.5 - 165.1 7446 674.4 797.5 >15mmZr35Ti30Be26.75Cu8.25 305 464 - 159 7444 674 771 >15mmZr35Ti30Be25Cu10 305.3 426.4 460.1 121.1 7449 672.4 756.7 >10mm Zr35Ti30Be33Co2 311.1 447.8 - 136.7 7046 729 824.1 >3mm Zr35Ti30Be31Co4 315.5 467.2 - 151.7 7418 724.7 801.9 >3mm Zr35Ti30Be29Co6 324.1 476.2 - 152.1 7457 721.7 837.3 >15mmZr35Ti30Be27.5Co7.5 318.9 407.9 454.8 89 6154 717.8 813.7 >10mm Zr35Ti30Be33Fe2 312.8 449.6 - 136.8 6796 770.6 827.6 >3mm Zr35Ti30Be31Fe4 318.5 464.6 - 146.1 6297 759.4 800.5 >3mm Zr35Ti30Be29Fe6 323.4 451.7 - 128.3 5810 747.8 842.8 >10mmZr35Ti30Be27.5Fe7.5 328.9 405.6 433.6 76.7 5370 758.2 817.8 >3mm Zr35Ti30Be30Al5 329.3 459.6 - 130.3 6126 829.8 864.8 >3mm
Error bars are ± 3 °C on temperatures and ± 5% on ΔHx.

3.10
0
2
4
6
8
10
12
14
16
18
200 250 300 350 400 450 500 550Temperature [C]
Hea
t Flo
w (a
rb. r
ef.)
[W/g
]
T xT gZr35Ti30Be35
Exo
Zr35Ti30Be27.5Cu7.5
Zr35Ti30Be26.75Cu8.25
Zr35Ti30Be25Cu10
Zr35Ti30Be30Cu5
00.10.20.30.4
275 300 325 350 375
[W/g
]
0
2
4
6
8
10
12
14
16
18
200 250 300 350 400 450 500 550Temperature [C]
T xT gZr35Ti30Be35
Exo
Zr35Ti30Be31Co4
Zr35Ti30Be29Co6
Zr35Ti30Be27.5Co7.5
Zr35Ti30Be33Co2
00.10.20.30.4
275 300 325 350 375
[W/g
]
0
2
4
6
8
10
12
14
16
18
200 250 300 350 400 450 500 550Temperature [C]
T xT gZr35Ti30Be35
Exo
Zr35Ti30Be31Fe4
Zr35Ti30Be29Fe6
Zr35Ti30Be27.5Fe7.5
Zr35Ti30Be33Fe2
00.10.20.30.40.5
275 300 325 350 375
[W/g
]
Hea
t Flo
w (a
rb. r
ef.)
[W/g
]H
eat F
low
(arb
. ref
.) [W
/g]
Figure 3.4: (a) The effect of Cu substitution for Be in Zr35Ti30Be35 (Alloy K). (b) The effect of Co substitution for Be in Zr35Ti30Be35 (Alloy K). (c) The effect of Fe substitution for Be in Zr35Ti30Be35 (Alloy K). All insets contain magnified view of glass transitions (temperature axes aligned) with vertical order of alloys maintained.

3.11
The largest ΔT values for quaternary variants of alloy K were obtained by
substituting Cu for beryllium (Figure 3.4a). The ΔT value peaks at 165.1 °C for the alloy
that has 7.5 atomic percent Cu. Co and Fe also increased ΔT significantly, but Fe
addition in alloy K was not as beneficial in terms of GFA. Since Cu was observed to
have the greatest effect on GFA and ΔT, Cu substitution for Be was performed in many
of the large ΔT ternary alloys near alloy K. Table 3.3 presents several examples of such
quaternary alloys along with their thermodynamic data.
From Figure 3.4 and Tables 3.2 and 3.3 one can observe that there is an optimal
late transition metal substitution for Be for each quaternary family. Substitutions smaller
than optimal are shown to have a limited effect on GFA and minimally increase thermal
stability, while substitutions larger than optimal tend to precipitate additional phases
diminishing ΔT. A summary of the alloys exhibiting the largest ΔT from each of the
quaternary families is presented in Figure 3.5.

3.12
Table 3.3: Thermodynamic data for quaternary variants of large ΔT ternary compositions obtained by substituting Cu for Be.
Tg[C] Tx1[C] Tx2[C] ΔT ΔHx (J/mol)
Ts[C] TL[C] GFA
Zr40Ti25Be35 (Alloy L) 300.2 409 429 108.8 5796 838 934.3 >1mmZr40Ti25Be29Cu6 306.5 454.9 - 148.4 7184 682.2 839.9 >10mmZr40Ti25Be27Cu8 306.2 464.3 - 158.1 7304 679.5 806.8 >10mmZr40Ti25Be25Cu10 306.2 470 - 163.8 6316 677.5 773.7 >10mmZr40Ti25Be23Cu12 308 389 464.5 81 9333 675.7 740.3 >10mm Zr27.5Ti35Be37.5 (Alloy P) 317.4 440.2 456.5 123 7167 832.7 843 >1mmZr27.5Ti35Be29.5Cu8 317.7 455.4 - 137.7 5707 669.7 834.3 >10mm Zr32.5Ti30Be37.5 (Alloy Q) 314.2 427.5 441.8 113.3 6469 836.8 846.8 >1mmZr32.5Ti30Be31.5Cu6 317.2 466.5 - 149.3 6976 673.1 >850 >10mmZr32.5Ti30Be29.5Cu8 314.5 471.9 - 157.4 8099 671.1 819.7 >10mmZr32.5Ti30Be27.5Cu10 314.6 474.2 - 159.6 8248 670.2 788 >10mmZr32.5Ti30Be25.5Cu12 317.1 409.1 456.2 92 7922 672.4 760.8 >10mm Zr37.5Ti25Be37.5 (Alloy R) 314.1 413.2 431.4 99.1 6800 831.1 857.7 >1mm Zr37.5Ti25Be27.5Cu10 310.8 470.9 - 160.1 7349 674.7 807 >10mm Zr30Ti30Be40 (Alloy V) 330.1 447.4 - 117.3 6659 825.5 844.1 >1mmZr30Ti30Be32Cu8 318 462.8 - 144.8 6783 668.5 850 >1mmZr30Ti30Be30Cu10 322.8 467.2 - 144.4 5739 668.7 772.8 >10mmZr30Ti30Be27.5Cu12.5 323.1 442.7 - 119.6 7557 663.2 816.7 >10mm Zr35Ti25Be40 (AlloyW) 325.5 432.4 - 106.9 6422 836.5 850 >1mmZr35Ti25Be32Cu8 323.3 462.2 - 138.9 7825 676.4 748 >10mmZr35Ti25Be30Cu10 321.8 472.9 - 151.1 8101 675.3 716 >10mmZr35Ti25Be28Cu12 323.1 470.8 - 147.7 8225 673 711.4 >10mm Zr40Ti20Be40 (Alloy X) 324.8 415.9 - 91.1 6323 842.3 907.2 >1mm Zr40Ti20Be26.25Cu13.75 316.3 467.6 - 151.3 7352 674.3 841.5 >10mm
Error bars are ± 3 °C on temperatures and ± 5% on ΔHx.

3.13
061041021ΔT[C]
Zr35Ti30Be31Fe4
Zr35Ti30Be29Co6
Zr35Ti30Be27.5Cu7.5
Zr40Ti25Be25Cu10
Zr32.5Ti30Be27.5Cu10
Zr37.5Ti25Be27.5Cu10
Zr30Ti30Be32Cu8
Zr35Ti25Be30Cu10
Zr44Ti11Be20Cu10Ni10
Figure 3.5: Bar graph showing the compositions with the largest ΔT from each quaternary family. Alloys with ΔT values as large as 165.1 °C are shown. Zr44Ti11Be25Cu10Ni10 (Vitreloy 1b) is shown for reference.
3.4 Conclusion
An alloy development approach is presented, by which ZrTi based Be bearing
bulk glass forming compositions were optimized for high thermal stability. From the
optimization of the ternary ZrTiBe system, the following conclusions can be drawn:
• Several ternary bulk glass forming compositions were identified, capable of
forming glasses with critical casting thicknesses exceeding 6mm.
• Several ternary glass forming compositions with thermal stabilities exceeding
120 °C were identified.

3.14
• The ternary alloys exhibiting good glass forming abilities and high thermal
stabilities tend to undergo simultaneous or near-simultaneous crystal growth
upon crystallization at 20 K/min heating rate.
The ternary alloy Zr35Ti30Be35 was found to exhibit the best combination of glass
forming ability and thermal stability, and was singled out for development of high
thermal stability quaternary compositions. The following conclusions can be drawn from
the optimization of the quaternary alloys:
• High thermal stability quaternary glasses with good glass forming ability were
obtained by substituting small fractions of Be (4 - 10 atomic percent) with late
transition metals such as Cu, Co, Fe, and Al.
• Cu substitution of Be is found to yield quaternary alloys with the best
combination of thermal stability and glass forming ability. For example,
Zr35Ti30Be27.5Cu7.5 is found to have a thermal stability exceeding 165 °C and a
critical casting thickness greater than 15mm.
• The optimization strategy yielded twelve quaternary alloys with thermal
stabilities >150 °C, three of which have thermal stabilities exceeding 160 °C.
Owing to the high thermal stability of their supercooled liquid states, these glasses
are promising candidates for forming processes that can be performed thermoplastically
in the SCLR. Furthermore, the high stability of the supercooled liquid states of these
alloys will enable studies of liquid thermodynamics, rheology, atomic diffusion, and the
glass transition to an extent previously not possible in metallic glass forming systems.
This alloy development strategy could be employed in other systems where
ternary phase diagrams are known. Comparison of Figures 3.1 and 3.2 reveals that the

3.15
best glass formers in the ternary phase space were located near the lowest melting
temperature region. Computer models designed to predict bulk glass forming
compositions have enjoyed limited success to date. Perhaps the simplest approach would
be to estimate ternary phase diagrams from known binary phase diagrams using a
CALPHAD type approach and then check GFA of alloys near low melting temperature
regions.
The authors thank the Office of Naval Research for their support of this work
under ONR06-0566-22.
Chapter 3 References [1] A.L. Greer, E. Ma, MRS Bull. 32 (2007) 611. [2] W.L. Johnson, MRS Bull. 24 (1999) 42. [3] A. Inoue, Acta Mater. 48 (2000) 279. [4] W.L. Johnson, JOM 54 (2002) 40. [5] J. Schroers, JOM 57 (2005) 35. [6] B. Zhang, D.Q. Zhao, M.X. Pan, W.H. Wang, A.L. Greer, Phys. Rev. Lett. 94
(2005) 205502. [7] C.A. Angell, J. Non-Cryst. Solids 131 (1991) 13. [8] J. Schroers, Q. Pham, A.J. Desai, Micromech. Microeng. 16 (2007) 240. [9] Y. Saotome, K. Imai, C. Shioda, S. Shimizu, T. Zhang, A. Inoue, Intermetallics
10 (2002) 1241. [10] J. Degmova, S. Roth, J. Eckert, H. Grahl, L. Schultz, Mat. Sci. Eng. A 375 (2004)
265. [11] K.S. Lee, Y.W. Chang, Mat. Sci. Eng. A 399 (2005) 238. [12] J. Schroers, Q. Pham, A. Peker, N. Paton, R.V. Curtis, Scripta Mater. 57 (2007)
341. [13] L.E. Tanner, R. Ray, Acta Metall. 27 (1979) 1727. [14] R.G. Hennig, A.E. Carlsson, K.F. Kelton, C.L. Henley, Phys. Rev. B 71 (2005)
144103. [15] B. Van de Moortele, T. Epicier, J.L. Soubeyroux, J.M. Pelletier, Philos. Mag.
Lett. 84 (2004) 245. [16] G. Duan, A. Wiest, M.L. Lind, J. Li, W.K. Rhim, W.L. Johnson, Adv. Mater. 19
(2007) 4272. [17] L.E. Tanner, R. Ray, C.F. Cline, US Patent #4050931. [18] L. Kaufman, L.E. Tanner, CALPHAD 3 (1979) 91. [19] G. Duan, A. Wiest, M.L. Lind, A. Kahl, W.L. Johnson, Scripta Mater. 58 (2008)
465. [20] A. Peker, W.L. Johnson, Appl. Phys. Lett. 63 (1993) 2342.

4.1
Chapter 4 - Bulk Metallic Glass with Benchmark Thermoplastic Processability
After discovering the large ΔT alloys discussed in Chapter 3, we characterized the
most promising of them to determine if we had made any improvements over other alloys
used for thermoplastic forming (TPF). Two alloys were studied in parallel and are
reported in this chapter. The data for the alloys is considered nearly interchangeable
because of the similarity of compositions. The two compositions are Zr35Ti30Cu8.25Be26.75
(ΔT = 159 K) and Zr35Ti30Cu7.5Be27.5 (ΔT = 165 K). This chapter is based on a talk given
at the MRS conference in Boston 2007 and an article entitled "Bulk Metallic Glass with
Benchmark Thermoplastic Processability" [G. Duan, A. Wiest, M.L. Lind, J. Li, W.K.
Rhim, and W.L. Johnson, Adv. Mater. 19 (2007) 4272] The article can be found at DOI:
10.1002/adma.200700969. The text has been changed in many places to reflect recent
research and should be compared to the original document if all changes are of interest.
The exceptional processability and large supercooled liquid region (SCLR) of
bulk amorphous metals makes them highly promising candidates for thermoplastic
processing. We report a lightweight (ρ = 5.4 g/cm3) quaternary glass forming alloy,
Zr35Ti30Cu8.25Be26.75, having the largest supercooled liquid region, ΔT = 159 K (at 20
K/min heating rate) of any known bulk glass forming alloy. The alloy can be cast into
fully amorphous rods of diameter = 1.5cm. The undercooled liquid exhibits an
unexpectedly high Angell Fragility of m = 65.6. Based on these features, it is
demonstrated that this alloy exhibits “benchmark” characteristics for thermoplastic
processing. We report results of mechanical, thermal, rheological, and time temperature
transformation (TTT) studies on this new material. The alloy exhibits high yield strength
and excellent fracture toughness, and a relatively high Poisson’s ratio. Simple

4.2
microreplication experiments carried out in open air using relatively low applied
pressures demonstrate superior thermoplastic processability for engineering applications.
Chapter 5 will demonstrate a modified injection molding setup that allowed TPF with
high strains.
Over the last two decades, the unique properties of bulk metallic glasses (BMG),
such as high strength, high specific strength, large elastic strain limit, and excellent wear
and corrosion resistances along with other remarkable engineering properties have made
these materials of significant interest for science and industry [1-9]. Researchers have
designed families of multi-component systems that form bulk amorphous alloys [4–9],
among which Zr based (Vitreloy series) [4], and Pt based [8] BMG have been utilized
commercially to produce items including sporting goods, electronic casings, medical
devices, and fine jewelries.
The unique advantages of injection molding, blow molding, microreplication, and
other thermoplastic technologies are largely responsible for the widespread uses of
plastics such as polyethylene, polyurethane, PVC, etc., in a broad range of engineering
applications. Powder injection molding of metals represents an effort to apply similar
processing to metals, but requires blending of the powder with a plastic binder to achieve
net shape forming and subsequent sintering of the powder. Given suitable materials,
thermoplastic forming (TPF) would be the method of choice for manufacturing of net
shape metallic glass components because TPF decouples the forming and cooling steps
by processing glassy material at temperatures above the glass transition temperature (Tg)
and below the crystallization temperature (Tx) followed by cooling to ambient
temperature [10-11]. Conventional die casting requires rapid quenching to bypass the

4.3
crystallization nose, which limits the ability to make high quality casts and to create parts
with complex geometries. Unfortunately, among the published metallic glasses none of
the alloys used in TPF processes to date reach viscosities suitable to mimic polymer
plastics formability with sufficient time to use conventional plastic processing
techniques. Alloys in the expensive Pt and Pd based [8, 12-13] families have shown
good thermoplastic formability reaching viscosities of around 105 Pa-s with sufficient
time available for processing. Zr based metallic glasses are much less expensive than Pt
and Pd based alloys. Unfortunately, Zr based BMG forming alloys have low fragilities,
and low processing viscosities are only attainable in the SCLR [14-15] with alloys having
large ΔT. Strain rate effects on viscosity of amorphous alloys have been extensively
studied [16-17].
An alloy optimal for TPF should have good glass forming ability, low viscosity /
high fragility in the SCLR, a low processing temperature, and a long processing time at
that temperature before crystallization. We studied Be bearing ZrTi based quaternary
metallic glasses with compositions in the range of 60% ≤ Zr + Ti ≤ 70%. We found that
compared with Vitreloy alloys (Zr + Ti = 55%), Tg is lowered, the liquid appears to
become more fragile, and the SCLR is increased. The apparent increase in fragility may
be due to two phase flow effects that are further discussed in Chapter 6. Two
composition regions were found with alloys that exhibit exceptional properties for TPF in
the ZraTibCucBed system. These were a ≈ b with c ≤ 12.5%, and a ≈ 5b with d ≥ 20%.
DSC curves of three representative alloys are presented in Figure 4.1. The alloys all
exhibit a very large SCLR with a single sharp crystallization peak at which the alloy
undergoes massive crystallization to a multiphase crystalline product.

4.4
-12
-10
-8
-6
-4
-2
0
2
4
6
8
550 600 650 700 750 800Temperature [K]
Hea
t Flo
w (a
rb. r
ef.)
[W/g
]Zr35Ti30Cu8.25Be26.75
Zr54Ti11Cu12.5Be22.5
Zr51Ti9Cu15Be25
Exo
Figure 4.1: DSC scans of three typical bulk metallic glasses with excellent glass forming ability and extremely high thermal stability. The marked arrows represent the glass transition temperatures.
The 5 gram samples were generally found to freeze without any crystallization
during preparation resulting in a glassy ingot. The Zr35Ti30Cu8.25Be26.75 alloy can be cast
into fully amorphous rods of diameter = 1.5cm. The amorphous nature of all the samples
studied in this work has been confirmed by X-ray diffraction. A summary of thermal
properties of these BMG is listed in Table 4.1 and compared with several earlier reported
amorphous alloys.[4, 7-8, 12, 18–21] The variations of SCLR, ΔT (ΔT = Tx – Tg, in
which Tx is the onset temperature of the first crystallization event), and reduced glass
transition temperature Trg (Trg = Tg/TL, where TL is the liquidus temperature) are
calculated. In the three newly designed alloys, Zr35Ti30Cu8.25Be26.75 exhibits the lowest
Tg (578 K and about 45 K lower than that of Vitreloy 1 or Vitreloy 4) and the largest ΔT

4.5
(159 K). It was further found that ΔT of the same glass can be enlarged to be 165 K by
addition of 0.5% Sn, giving the largest SCLR reported for any known bulk metallic glass.
Table 4.1: Thermal, mechanical, and rheological properties of various BMG forming alloys.
Material Tg [K]
Tx [K]
TL [K]
ΔT [K]
Trg [K]
m s m*ΔT*rx G [Gpa]
Y [Gpa]
υ
Zr51Ti9Cu15Be25 592 730 1047 138 0.565 - 0.30 - 31.8 86.5 0.36
Zr54Ti11Cu12.5Be22.5 581 721 1035 140 0.561 - 0.31 - 30.3 82.8 0.37
Zr35Ti30Cu8.25Be26.75 578 737 1044 159 0.554 65.6 0.34 20.3 31.8 86.9 0.37
Zr41.2Ti13.8Ni10Cu12.5Be22.5 623 712 993 89 0.627 49.9 0.24 8.0 37.4 101.3 0.35
Zr46.75Ti8.25Ni10Cu7.5Be27.5 625 738 1185 113 0.527 44.2 0.20 10.0 35.0 95.0 0.35
Pd43Ni10Cu27P20 575 665 866 90 0.664 58.5 0.31 12.3 33.0 92.0 0.39
Pt60Ni15P25 488 550 804 60 0.596 67.2 0.17 12.5 33.8 96.1 0.42
Ce68Cu20Al10Nb2 341 422 643 81 0.530 - 0.26 - 11.5 30.3 0.31
Au49Ag5.5Pd2.3Cu26.9Si16.3 401 459 644 58 0.623 - 0.24 - 26.5 74.4 0.41
Pt57.5Ni5.3Cu14.7P22.5 508 606 795 98 0.639 - 0.34 - 33.4 95.7 0.43
In Figure 4.2, the temperature dependence of equilibrium Newtonian viscosity of
Zr35Ti30Cu8.25Be26.75 and several other metallic glass forming liquids with different
Angell fragility numbers [22] are presented. The solid curve represents a Vogel-Fulcher-
Tammann (VFT) fit to the viscosity data of Zr35Ti30Cu8.25Be26.75:
⎟⎟⎠
⎞⎜⎜⎝
⎛−∗
=0
0*
0 expTTTD
ηη
where η0, D*, and T0 are fitting constants. T0 is the VFT temperature and η0 ≈ 10–5 Pa-s.
In the best fit, T0 = 422.6 K and D* = 12.4 are found, which yields an Angell fragility
number of m = 65.6. This high fragility value could be a result of the two Tg relaxation
phenomenon that will be presented in Chapter 6. No viscosity data near Tg was collected
so the VFT fit used to calculate fragility, which is the slope of the Log[η(T/Tg)] curve at
Tg (see Derivation 5), may be off. The fragility calculated from the VFT fit is quite high

4.6
when compared to fragilities for other Vitreloy glasses which are typically in the range of
m = 30 - 40 [23]. If we fit the data using the viscosity formula based on metallic glass
physics proposed by Johnson [23] and detailed in Derivation 5 we find that m = 40 and
Tg = 539 K. The value for Tg calculated using the Johnson formula is close to the Tg
measured at 20 K/min in the DSC = 578 K and the fragility is more in line with what
would be expected for a Vitreloy type alloy.
-4
-2
0
2
4
6
8
10
12
14
0.6 0.8 1 1.2 1.4 1.6 1.8 2 2.21000/T [1/K]
Log(
η) [η
in P
a-s]
Figure 4.2: The temperature dependence of equilibrium viscosity of several metallic glass forming liquids: Zr41.2Ti13.8Ni10Cu12.5Be22.5 (Vitreloy 1) (Δ); Zr46.25Ti8.25Cu7.5Ni10Be27.5 (Vitreloy 4) (); Zr35Ti30Cu8.25Be26.75 (); Pd43Ni10Cu27P20 (×); Pt60Ni15P25 (◊). It is shown that the viscosity of Zr35Ti30Cu8.25Be26.75 in the thermoplastic processing region is at least two orders of magnitude lower than that of Vitreloy 1 or Vitreloy 4 and is comparable to that of Pd based metallic glass and polymer glasses.
The Angell fragility parameters of Vitreloy series, Pd based, and Pt based metallic
glass forming liquids [19, 24-25] are listed in Table 4.1 as well. Zr35Ti30Cu8.25Be26.75
shows rather fragile behavior compared with the strong Vitreloy series of liquids. Its
viscosity in the thermoplastic zone is at least two orders of magnitude lower than that of

4.7
Vitreloy 1 or Vitreloy 4 at the same temperature and is comparable to that of Pd based
metallic glass. For example, the equilibrium viscosity at 683 K for Zr35Ti30Cu8.25Be26.75
is measured to be only 8*104 Pa-s, similar to that of viscous polymer melts [26]. As is
known from the processing of thermoplastics, the formability is inversely proportional to
viscosity. This alloy’s low viscosity in the SCLR will result in a low Newtonian flow
stress and high formability.
Recently, the normalized thermal stability, S, which is defined as ΔT/(TL-Tg), was
introduced to characterize the thermoplastic formability [10]. As indicated in Table 4.1,
Zr35Ti30Cu8.25Be26.75 demonstrates an S value of 0.34, which is higher than that of all the
other alloys and is as good as Pt57.5Cu14.7Ni5.3P22.5. Because the S parameter is based on
an oversimplified assumption of identical viscosity at TL, a deformability parameter,
)](/)([ **xg TTLogd ηη= [19] was also proposed and correlated with Angell fragility (m)
and the reduced thermal stability, *** /)( ggxrx TTTT −=Δ , where Tg* is the glass transition
temperature at which the viscosity is 1012 Pa-s. Table 4.1 lists the calculated m*ΔTrx*
values for Zr35Ti30Cu8.25Be26.75, Vitreloy 1, Vitreloy 4, Pd43Ni10Cu27P20, and Pt60Ni15P25
based on the measured viscosity data. It is seen clearly that Zr35Ti30Cu8.25Be26.75 shows
the largest m*ΔTrx*, which implies a superior thermoplastic workability.
In Figure 4.3, we present the measured TTT curve for Zr35Ti30Cu8.25Be26.75 and
other Vitreloy series alloys [27]. The TTT curve indicates a nose shape, with the
minimum crystallization time of about 3 - 10 s occurring somewhere between 700 K and
950 K. The data on the bottom part of the nose was collected by heating the metallic
glass from room temperature. The data on the top part of the nose was obtained by
cooling the material from the melt. Because of insufficient GFA, the bottom part of the

4.8
cooling TTT curve was inaccessible with the cooling rates available to us. Both sets of
data are shown on the same graph for convenience. At 683 K, where the equilibrium
viscosity is about 8*104 Pa-s, a 600 s thermoplastic processing window is available for
forming.
500
600
700
800
900
1000
1100
1 10 100 1000 10000Time [s]
Tem
pera
ture
[K]
Figure 4.3: TTT diagrams for Zr35Ti30Cu8.25Be26.75 upon heating (), and cooling (). The data were measured by electrostatic levitation for cooling measurements. TTT upon heating measurements were done by processing in graphite crucibles after heating from the amorphous state. At 683 K, where the equilibrium viscosity is about 8*104 Pa-s, a 600 s thermoplastic processing window is available.
To demonstrate the strong thermoplastic processability of the Zr35Ti30Cu8.25Be26.75
glassy alloy, we carried out plastic forming experiments as shown in Figure 4.4. The
thermoplastic processing was done on a Tetrahedron hot press machine in air at a
pressure of 25 MPa with a processing time of 45 s, followed by a water quenching step.
Figure 4.4 shows the microformed impression of a United States dime (Figure 4.4b)
made on TPF metallic glass ingots at about 643 K (Figure 4.4a). Minimal oxidation was

4.9
observed after processing, which is consistent with the strong oxidation resistance of Be
bearing amorphous alloys. The final parts remain fully amorphous as verified by X-ray
diffraction. It is found from the Rockwell hardness tests that no degradation of the
mechanical properties was caused by the thermoplastic processing. Before the TPF was
carried out, we produced diamond shaped microindentation patterns (~ 100μm) in the top
flame of the dime using a Vickers hardness tester (Figure 4.4c). Figure 4.4d presents the
successfully replicated diamond pattern in the final part. Even the scratches (on the level
of several μm) on the original dime are clearly reproduced. Although the induced strain
was small, replication of small features is shown.
Figure 4.4: Demonstration of the strong thermoplastic processability of the Zr35Ti30Cu8.25Be26.75 metallic glass. The ingot in (a) is pressed over a dime at 643 K for 45 s at 25 MPa to form the negative imprint of a United States dime shown in (b). A diamond shaped microindentation pattern was placed in the flame on the dime (c) and was successfully replicated in the negative imprint (d) as well.

4.10
The imprinting and microreplication test on the dime required minimal thermoplastic
strain. However, many TPF processes like injection molding require large strains to
move material from a reservoir to a mold cavity. We used a method proposed by
Schroers [28] to compare glassy alloys commonly used in TPF processes with the newly
developed large ΔT alloy for TPF processes requiring large strains. The method
proposed by Schroers involves applying a constant force to a known volume of each alloy
through the SCLR at a constant heating rate. We chose a force of 2000 lbs, 10 K/min
heating rate, and 0.1cm3 of each alloy. The alloys of interest were Pd43Ni10Cu27P20,
Pt57.5Ni5.3Cu14.7P22.5, Zr41.2Ti13.8Cu12.5Ni10Be22.5 (Vitreloy 1), and Zr44Ti11Cu10Ni10Be25
(Vitreloy 1b). Schroers squish test is depicted in Figure 4.5 along with pictures of the
squished alloys and a table of the results.

4.11
Formability Characterization
2000 lb2000 lb Tg< T <TxProcess in entire ΔT region
dT/dt = 10 K/minSample size= 0.1 cm3
V V
Sample
Final Diameter indicatesthermoplastic formability
40 or 65.6585935Fragility = 40
743 K676.5 K577.0 K760.3 KTx = 681.1 K
575.6 K499.3 K619.4 KTg = 620.2 K
28.5mm24.7mm23.7mm21.7mmDiam = 12.8mm
Tx
578 KTg
Diam
Zr41.2Ti13.8Cu12.5Ni10Be22.5Zr44Ti11Cu10Ni10Be25 Zr35Ti30Cu7.5Be27.5Pd43Ni10Cu27P20Pt57.5Ni15.3Cu14.7P22.5
Figure 4.5: Squish test proposed by Schroers [28] performed on four alloys traditionally used in TPF and the new large ΔT alloy. The largest diameter after the squish test is obtained by using the Zr35Ti30Cu7.5Be27.5 alloy suggesting that it will exhibit the best flow properties in TPF processes requiring large strains.
The elastic constants of Zr35Ti30Cu8.25Be26.75 and several other BMG are also
shown in Table 4.1. Evidence suggests that a high Poisson’s ratio is related to the ductile
behavior of metallic glasses [29-34]. Zr35Ti30Cu8.25Be26.75 has a Poisson’s ratio of ~ 0.37,
higher than that of Vitreloy series alloys. The fracture toughness (K1C) of
Zr35Ti30Cu8.25Be26.75 was estimated to be ~ 85 MPa m1/2, while that of Vitreloy 1 is only ~
20 – 45 MPa m1/2 [35–37]. The yield strength of Zr35Ti30Cu8.25Be26.75 under uniaxial
compressive tests was found to be ~ 1.43 GPa. To design this new class of BMG, a
balance between strength and thermoplastic processability has to be obtained [38]. The

4.12
present series of amorphous metals possesses superior thermoplastic formability with a
minimum reduction of yield strength and elastic energy storage.
In summary, we have designed a series of metallic glass forming alloys, having
the combination of optimized properties for TPF, such as extraordinarily low viscosity in
the thermoplastic zone, exceptional thermal stability, low Tg, and excellent GFA. These
alloys demonstrate strong thermoplastic processability and excellent mechanical
properties. We expect that this discovery will greatly broaden the engineering
applications of amorphous metals by taking advantage of the unique properties of the
newly designed BMG.
4.1 Experimental Method
Mixtures of elements of purity ranging from 99.9% to 99.99% were alloyed by
induction melting on a water cooled silver boat under a Ti-gettered argon atmosphere.
Typically 5 g ingots were prepared. Each ingot was flipped over and remelted at least
three times in order to obtain chemical homogeneity. A Philips X’Pert Pro X-ray
Diffractometer and a Netzsch 404C Pegasus Differential Scanning Calorimeter (DSC
performed at a constant heating rate 0.33 K/s) were utilized to confirm the amorphous
natures and to examine the isothermal behaviors in the SCLR of these alloys. The pulse-
echo overlap technique with 25 MHz piezoelectric transducers was used to measure the
shear and longitudinal wave speeds at room temperature for each of the samples. Sample
density was measured by the Archimedean technique according to the American Society
of Testing Materials standard C 693-93 [39]. The viscosity of Zr35Ti30Cu8.25Be26.75 as a
function of temperature in the SCLR was studied using a Perkin Elmer TMA7
Thermomechanical Analyzer (TMA) in the parallel plate geometry as described by

4.13
Bakke, Busch, and Johnson [40]. The measurement was done with a heating rate of
0.667 K/s, a force of 0.02 N, and an initial height of 0.3mm. The viscosity and TTT
diagrams of Zr35Ti30Cu8.25Be26.75 at high temperatures were measured in a high vacuum
electrostatic levitator (ESL) [41-42]. For the viscosity measurements, the resonant
oscillation of the molten drop was induced by an alternating current electric field while
holding the sample at a preset temperature. Viscosity was calculated from the decay time
constant of free oscillation that followed the excitation pulse. To determine the TTT
curve, an electrostatically levitated molten (laser melting) droplet (~ 3mm diameter)
sample was cooled radiatively to a predetermined temperature, and then held isothermally
until crystallization. The temperature fluctuations were within ± 2 K during the
isothermal treatment.
The authors acknowledge the valuable discussions with Prof. Jan Schroers and
Dr. Marios D. Demetriou, and the kind help from Bo Li, Dr. Boonrat Lohwangwatana,
Joseph P. Schramm, and Jin-yoo Suh on taking digital and optical graphs and doing
fracture toughness measurements. We also thank the support from the MRSEC Program
(Center for the Science and Engineering Materials, CSEM) of the National Science
Foundation under Award Number DMR - 0520565.
Chapter 4 References [1] A.L. Greer, Science 267 (1995) 1947. [2] W.L. Johnson, MRS Bull. 24 (1999) 42. [3] A. Inoue, Acta Mater. 48 (2000) 279. [4] A. Peker, W.L. Johnson, Appl. Phys. Lett. 63 (1993) 2342. [5] D.H. Xu, G. Duan, W.L. Johnson, Phys. Rev. Lett. 92 (2004) 245504. [6] V. Ponnambalam, S.J. Poon, G.J. Shiflet, J. Mater. Res. 19 (2004) 1320. [7] B. Zhang, D.Q. Zhao, M.X. Pan, W.H. Wang, A.L. Greer, Phys. Rev. Lett. 94
(2005) 205502. [8] J. Schroers, W.L. Johnson, Appl. Phys. Lett. 84 (2004) 3666.

4.14
[9] Z.P. Lu, C.T. Liu, J.R. Thompson, W.D. Porter, Phys. Rev. Lett. 92 (2004) 245503.
[10] J. Schroers, JOM 57 (2005) 35. [11] J. Schroers, N. Paton, Adv. Mater. Proc. 164 (2006) 61. [12] G.J. Fan, H.J. Fecht, E.J. Lavernia, Appl. Phys. Lett. 84 (2004) 487. [13] J.P. Chu, H. Wijaya, C.W. Wu, T.R. Tsai, C.S. Wei, T.G. Nieh, J. Wadsworth,
Appl. Phys. Lett. 90 (2007) 034101. [14] A. Masuhr, T.A. Waniuk, R. Busch, W.L. Johnson, Phys. Rev. Lett. 82 (1999)
2290. [15] R. Busch, W.L. Johnson, Appl. Phys. Lett. 72 (1998) 2695. [16] F. Spaepen, Acta Metall. 25 (1977) 407. [17] J. Lu, G. Ravichandran, W.L. Johnson, Acta Mater. 51 (2003) 3429. [18] T.A. Waniuk, J. Schroers, W.L. Johnson, Appl. Phys. Lett. 78 (2001) 1213. [19] H. Kato, T. Wada, M. Hasegawa, J. Saida, A. Inoue, H.S. Chen, Scripta Mater. 54
(2006) 2023. [20] K. Shibata, T. Higuchi, A.P. Tsai, M. Imai, K. Suzuki, Prog. Theor. Phys. Suppl.
126 (1997) 75. [21] J. Schroers, B. Lohwongwatana, W.L. Johnson, A. Peker, Appl. Phys. Lett. 87
(2005) 061912. [22] L.M. Martinez, C.A. Angell, Nature 410 (2001) 663. [23] W.L. Johnson, M.D. Demetriou, J.S. Harmon, M.L. Lind, K. Samwer, MRS Bull.
32 (2007) 644. [24] V.N. Novikov, A.P. Sokolov, Phys. Rev. B 74 (2006) 064203. [25] D.N. Perera, J. Phys. Condens. Matter 11 (1999) 3807. [26] F.W. Billmeyer, Text. Ploym. Sci. (1984) 305. [27] T. Waniuk, J. Schroers, W.L. Johnson, Phys. Rev. B 67 (2003) 184203. [28] J. Schroers, Acta Mater. 56 (2008) 471. [29] H.S. Chen, J.T. Krause, E. Coleman, J. Non-Cryst. Solids 18 (1975) 157. [30] V.N. Novikov, A.P. Sokolov, Nature 431 (2004) 961. [31] J. Schroers, W.L. Johnson, Phys. Rev. Lett. 93 (2004) 255506. [32] W.L. Johnson, K. Samwer, Phys. Rev. Lett. 95 (2005) 195501. [33] X.J. Gu, A.G. McDermott, S.J. Poon, G.J. Shiflet, Appl. Phys. Lett. 88 (2006)
211905. [34] J.J. Lewandowski, W.H. Wang, A.L. Greer, Philos. Mag. Lett. 85 (2005) 77. [35] J.J. Lewandowski, M. Shazly, A.S. Nouri, Scripta Mater. 54 (2006) 337. [36] P. Lowhaphandu, J.J. Lewandowski, Scripta Mater. 38 (1998) 1811. [37] J.J. Lewandowski, Mater. Trans. 42 (2001) 633. [38] G. Duan, M.L. Lind, K. De Blauwe, A. Wiest, W.L. Johnson, Appl. Phys. Lett. 90
(2007) 211901. [39] M.L. Lind, G. Duan, W.L. Johnson, Phys. Rev. Lett. 97 (2006) 015501. [40] E. Bakke, R. Busch, W.L. Johnson, Appl. Phys. Lett. 67 (1995) 3260. [41] S. Mukherjee, J. Schroers, Z. Zhou, W.L. Johnson, W.K. Rhim, Acta Mater. 52
(2004) 3689. [42] S. Mukherjee, Z. Zhou, J. Schroers, W.L. Johnson, W.K. Rhim, Appl. Phys. Lett.
84 (2004) 5010.

5.1
Chapter 5 - Injection Molding Metallic Glass
After determining that the Zr35Ti30Be27.5Cu7.5 alloy shows the most promise of
any known alloy for TPF processes requiring large strains, we set out to demonstrate
injection molding of a metallic glass for the first time. This chapter draws heavily on
"Injection Molding Metallic Glass" published in Scripta Materialia [A. Wiest, J.S.
Harmon, M.D. Demetriou, R.D. Conner, W.L. Johnson, Scripta Mater. 60 (2009) 160].
Advances in alloy development produced the Zr35Ti30Be27.5Cu7.5 alloy with
(crystallization - glass transition temperature) = ΔT = 165 °C. This alloy’s large
supercooled liquid region (SCLR) provides the longest processing times and lowest
processing viscosities of any metallic glass and was injection molded using tooling based
on plastic injection molding technology. Injection molded beams and die cast beams
were tested in three-point bending. The average modulus of rupture (MOR) was found to
be similar while injection molded beams had a smaller standard deviation in MOR.
Bulk metallic glasses (BMG) are high strength, high hardness, highly elastic, low
modulus, low melting temperature materials with no crystalline order that have been the
subject of extensive research in recent years [1-4]. Because of their low melting
temperature they are easily processed using conventional vacuum die casting and suction
casting techniques. These methods require processing that is sufficiently fast to avoid
crystallization, and alloys with high glass forming ability (GFA) are generally preferred.
Die cast parts have somewhat unreliable mechanical properties because of porosity that
often exists in the specimens due to the high flow velocities required to fill the mold
cavity [5]. The cooling requirements of die casting bound the dimensions of die cast
parts to no larger than can be cooled sufficiently fast to avoid crystallization and no

5.2
smaller than can be quickly filled. Parts with complex geometries, thin sections, and high
aspect ratios are difficult to obtain with die casting.
Thermoplastic forming decouples the forming and cooling processes because it is
carried out in the SCLR between the glass transition temperature, Tg, and the
crystallization temperature, Tx. In the SCLR a BMG forming alloy exists as a viscous,
deeply undercooled liquid. The viscosity of the alloy follows a hyper-Arrhenius function
of temperature [6] and crystallization is forestalled due to the sluggish kinetics in the
deeply undercooled liquid. Much longer processing times are available in the SCLR than
are available when casting from the molten state because the alloy is resistant to
crystallization below Tx. Die casting processes must shape and cool the alloy in seconds
to tens of seconds while processing in the SCLR allows hundreds to thousands of seconds
for forming and cooling. Time temperature transformation (TTT) diagrams measure the
time to crystallization of an alloy held isothermally at a given temperature. Viscosity
plots measure the Newtonian viscosity of an alloy held isothermally at a given
temperature. Figure 5.1 combines data from these two kinds of plots to show attainable
viscosity for a given processing time for three alloys commonly used in thermoplastic
forming experiments and the alloy used in this experiment, Zr35Ti30Be27.5Cu7.5 [6-9].
This plot is a viscosity time transformation plot, ηTT. Good TTT data upon heating is
not available in the literature for Pd43Ni20Cu27P20 so cooling TTT data was used for the
Pd alloy in the Figure 5.1. Crystallization times are known to be shorter for heating TTT
plots compared to cooling TTT plots for the same alloy. Accordingly, the true heating
ηTT plot for the Pd alloy should be moved to shorter times. It is clearly seen that the
Zr35Ti30Be27.5Cu7.5 alloy has the lowest processing viscosity for a wide range of

5.3
processing times. Interpolation of viscosities not directly measured was done using the
fit suggested by Johnson et al. [6].
10000
100000
1000000
10000000
0 100 200 300 400 500 600
Time to crystallize [s]
Visc
osity
[Pa-
s]
Pt57.3Ni5.3Cu14.6P22.8
Pd40Ni10Cu30P20
Zr44Ti11Be25Ni10Cu10
Zr35Ti30Be27.5Cu7.5
Figure 5.1: Time to crystallization versus viscosity plot for four thermoplastically processable alloys. This plot combines TTT and viscosity versus time data found in references [6-9] to show available processing time for a given viscosity for the alloys.
The decreasing viscosity and longer processing times available in the SCLR allow
metallic glasses to be processed in ways similar to plastics which are not possible with
crystalline metal alloys. Nanometer scale features with high aspect ratios have been
formed in the SCLR by pressing metallic glasses into etched wells of semiconductor
materials [10]. Glassy powders have been consolidated in the SCLR to form net shaped
parts [11]. Hot extrusion has been demonstrated using Zr based alloys [12] and blow
molding experiments using relatively low pressures yielded hemispheres with high

5.4
quality surface finish [13]. An additional benefit to processing BMG in the SCLR is the
decoupling of forming and cooling steps which allows formation of parts larger than the
critical casting thickness of the alloy.
A conventional processing method used in the plastics industry that has not
previously been successfully demonstrated with BMG is injection molding. This is in
part due to the limited viscosities and processing times available in the SCLR of known
alloys. Recent discovery of alloys with SCLR (ΔT = Tx – Tg) as high as 165 oC makes
BMG injection molding a possibility [14].
A basic injection molding machine has a heated reservoir in which plastic
feedstock is softened, a piston or plunger to apply pressure to the feedstock, a nozzle or
gate to restrict the flow of plastic when necessary and a mold into which the plastic is
forced to form a part. A schematic drawing of the setup used in this experiment is shown
in Figure 5.2b. Typical operating temperatures and pressures are 175 °C – 350 °C and 35
MPa - 150 MPa, respectively. Softened plastics used for injection molding usually have
a viscosity of ~ 103 Pa-s.
Zr44Ti11Be25Cu10Ni10, Pd43Ni10Cu27P20 and Pt57.5Ni5.3Cu14.7P22.5 were among the
most thermoplastically processable alloys known, reaching viscosities of ~ 105 Pa-s in the
SCLR before onset of crystallization. The alloy used in this experiment,
Zr35Ti30Be27.5Cu7.5, can reach viscosities in the SCLR of ~ 3*104 Pa-s at 420 °C with ~
230 s available for thermoplastic processing at that temperature [15]. This is an order of
magnitude lower viscosity than is attainable in the SCLR of previously reported metallic
glasses [16-18]. However, when compared to the viscosity of plastics used for injection
molding, it is an order of magnitude higher viscosity. A modified injection molding

5.5
setup was created to accommodate the higher temperatures and pressures necessary to
force the more viscous Zr35Ti30Be27.5Cu7.5 supercooled liquid into a mold cavity.
-5
-4
-3
-2
-1
0
1
2
3
4
5
6
200 300 400 500 600 700 800Temperature [C]
Hea
t Flo
w [W
/g] (
arb.
ref.)
Exo
Tg=305.0C Tx=464.9C
Tg=304.7C Tx=467.1C
After Injection Molding
Feedstock Material
Enthalpy=-136.5J/g
Enthalpy=-142.6J/gPLUNGER
METALLICGLASS
5.2a
5.2b
Figure 5.2: 2a - 20 oC/min DSC scans of feedstock material and injection molded specimen. The injection molding process appears to have had little effect on the thermodynamic properties measured in the DSC. Inset 2b - Schematic drawing of the modified injection molding setup consisting of a plunger, gates, and a heated mold and reservoir. The dimensions of the mold cavities are 2mm x 10mm x 20mm and 1.5mm x 10mm x 20mm.
The Zr35Ti30Be27.5Cu7.5 feedstock material was made using >99.9% pure elements
and melted thoroughly in an arc melter under a Ti-gettered argon atmosphere. Each ingot
was flipped and remelted multiple times to ensure chemical homogeneity. Ingots with
more than 0.1% deviation from initial weighed mass after melting were discarded. Die
casting was done by radio frequency heating the alloy in a quartz nozzle and injecting the
molten alloy into a copper mold using argon pressure. The amorphous nature of all
material was determined using X-ray diffraction and DSC. Mechanical testing was

5.6
performed on an Instron 4204 Load Frame at a constant displacement rate of 0.5mm/min
in a three-point bending geometry to determine MOR.
Suitable feedstock material was also required for the injection molding process.
Various methods were tested to create amorphous feedstock material and the effect on ΔT
was measured in the DSC at 20 K/min. We noticed large variations in ΔT depending on
the method used. The results are summarized in Table 5.1. To test the variation of ΔT
with rod diameter, samples were RF melted and cast into copper molds or water
quenched in quartz tubes had ΔT values ranging from 136 °C to 170 °C but there was no
systematic variation with rod diameter and the ΔT = 170 °C was only obtained once. We
also tried melting the alloy in a furnace so the melting temperature could be controlled
more carefully and identical diameter rods were formed. The ΔT values ranged from 153
°C to 165 °C but the results were not systematic. Arc melted buttons showed the most
uniformity in ΔT and were chosen as the feedstock material. We removed the thin
crystalline layer on the side of the ingot in contact with the copper hearth with a diamond
saw and collected X-ray diffraction data on the cut samples to ensure they were
completely amorphous.
A schematic drawing of the modified injection molding setup can be found in
Figure 5.2b. The experimental setup consisted of a plunger used to apply force, a 19mm
diameter x 20mm tall heated reservoir in which BMG feedstock material was brought to
the processing temperature, an 8mm diameter x 3mm tall vertical channel opening into
two perpendicular channels with dimensions 5mm x 2mm x 2mm long which restricted
the flow of material into the mold cavity. The heated mold cavity on the left in Figure

5.7
5.2b is 10mm x 2mm x 60mm long and the one on the right is 10mm x 1.5mm x 60mm
long.
Table 5.1: Effects of rod diameter and overheating above melt temperature on ΔT as well as variation in arc melted button ΔT are tabulated. Temperatures given in °C. Tg Tx ΔT Furnace melted samples 7mm quartz 1235 °C 304 459 1557mm quartz 1200 °C 303 459 1567mm quartz 1145 °C 304 457 1537mm quartz 930 °C 302 467 165 RF melted samples 3mm Cu mold 305 441 1366mm quartz 305 452 14710mm quartz 307 477 17015mm quartz 306 450 144 Arc Melted Ingots Ingot 7 305 469 164Ingot 9 298 464 166Ingot 11 299 467 168Ingot 12 302 465 163Ingot 13 306 466 160Ingot 15 304 464 160Ingot 16 304 467 163Ingot 18 303 467 164Ingot 21 306 469 163Ingot 23 307 466 159Ingot 25 304 468 164Ingot 26 305 467 162Average Arc Melted Ingots 304 467 163Standard Deviation 2.7 1.7 2.6
A photograph of injection molding attempts is shown in Figure 5.3. The most
successful run was accomplished when the mold and glassy feedstock material were
heated to 420 °C with a force of 300 MPa applied to the material in the reservoir for two
minutes. The material completely filled the larger mold cavity and a 0.2mm diameter
flashing was formed along the perimeter due to insufficient clamping pressure. The

5.8
material that filled this cavity underwent more than 1000% strain. Minimal polishing
with 320 grit sand paper removed the surface oxide layer and the beam formed in the
large mold cavity was found to be glassy using X-ray diffraction. The flow was
terminated in the smaller cavity due to crystallization of material near the heating
element. Figure 5.3c shows the most successful metallic glass part; Figures 5.3a and 5.3b
illustrate two less successful attempts, and Figure 5.3d is a part made of polyethylene
shown for reference. The short fill shown in Figure 5.3a was due to the plunger binding
in the reservoir. Note the parabolic flow front visible on both sides of the part.
3a
3b
3c
3d
Figure 5.3: Photograph of injection molded parts. The top part (5.3a) was processed at 410 oC with an applied pressure of 140 MPa but the plunger jammed. The second part (5.3b) was processed at 385 oC with an applied pressure of 300 MPa for three minutes. The third part (5.3c) was processed at 420 oC with an applied pressure of 300 MPa for two minutes. The fourth part (5.3d) made of polyethylene was processed at 210 oC with an applied pressure of 35 MPa for one minute.

5.9
Using the velocity distribution of a viscous fluid flowing in a cylindrical channel
assuming stick boundary conditions and laminar flow we obtain )(41 22 rR
xPv −ΔΔ
−=η
,
where v is the velocity of a lamina, η is the viscosity, PΔ is the pressure differential of
the pipe, xΔ is a displacement in the direction of flow, R is the diameter of the pipe, and
r is the radial distance from the center of the pipe. A similar equation results for an
ellipse where the lamina are elliptical cylinders instead of circular. In the limiting case of
a rectangular channel, a parabolic velocity distribution is found away from the corners.
The observed flow front suggests laminar flow into the mold cavity. Laminar flow is
important, as it reduces the formation of voids and other flaws which weaken the part.
The part shown in Figure 5.3b was processed at too low a temperature, resulting in a
processing viscosity that was too high as indicated by “river marks” or flow lines.
Despite the large thermal stability of Zr35Ti30Be27.5Cu7.5, approximately 10 times more
force is required to form the metallic glass part than was used to form a polyethylene part
of the same geometry. The polyethylene part filled both mold cavities at a processing
temperature of 250 °C and a pressure of 35 MPa, while those of the BMG are 420 °C and
300 MPa.
We were able to process metallic glass parts with 10 times higher processing
viscosity than polyethylene by using a higher force. It is natural to wonder if perhaps
even more force could be applied to alloys with higher processing viscosities and achieve
similar flow. Up to a certain point this strategy works but shortens mold life. If too high
a strain rate is imposed at a given viscosity, non-Newtonian flow results and shear
banding can occur in the SCLR.

5.10
The availability of injection molding as a potential forming process for metallic
glass parts allows for the formation of parts greater than the critical casting thickness of
the parent alloy. Injection molding is carried out at temperatures much lower than die
casting which may improve the mold lifetime. Since processing is accomplished in the
laminar flow regime, higher quality and more reliable parts can be fabricated than with
current die casting technology.
DSC scans of the feedstock material and a section of the injection molded beam
are overlaid in Figure 5.2a. The ΔT value of the injection molded material is slightly
smaller than the feedstock material and the enthalpies of crystallization are nearly
identical.
The injection molded plate was sectioned into 2mm x 2mm x 20mm beams for
mechanical testing in three-point bending. The modulus of rupture (MOR, maxσ ) was
determined for 12 beams and compared to die cast specimens of the same dimension
using the formula 2max 23abFL
=σ s where F = applied force, a = b = 2mm, L = distance
between bottom supports of the three-point bending setup = 13mm. The MOR equation
for a square beam is derived in Derivation 9.
The die cast specimens were cut from three 2mm x 10mm x 20mm plates. Figure
5.4 shows the results of the three-point bend tests. Twelve specimens of each fabrication
method were tested, with MOR = 2.923 ± 0.065 GPa for injection molding and MOR =
2.879 ± 0.240 GPa for die casting. Note that the average MOR is nearly identical for
both processing methods while the standard deviation of the injection molded specimens
is 73% less than that of the die cast specimens. This suggests that injection molding
produces parts with more reliable mechanical properties than their die cast counterparts.

5.11
2
2.2
2.4
2.6
2.8
3
3.2
0 2 4 6 8 10 12Sample Number
Mod
ulus
of R
uptu
re [G
Pa]
Die Cast
Injection Molded
Figure 5.4: Plot of modulus of rupture values for injection molded and die cast samples. Die cast modulus of rupture = (2.879 ± 0.240)GPa. Injection molding modulus of rupture = (2.923 ± 0.065)GPa.
The discovery of the Zr35Ti30Be27.5Cu7.5 alloy with viscosity in the SCLR as low
as 104 Pa-s allowed injection molding of a metallic glass to be demonstrated. Tooling
based on plastic injection molding machines was used, but modified to allow for the
higher temperatures and pressures necessary to process the more viscous metallic glass.
The material underwent strains greater than 1000% at a temperature of 420 °C and a
pressure of 300 MPa applied for two minutes and formed a part 2mm x 10mm x 60mm.
The injection molded part was tested mechanically in three-point bending and showed
MOR equivalent to that of a die cast specimen with a standard deviation of MOR 73%
less than that of die cast specimens of the same composition and dimension. The ability
to injection mold high strength metal parts using methods similar to existing plastics

5.12
technology could greatly reduce processing costs, and will be the subject of future
investigation.
Special thanks to Doug Hofmann, Rebecca Stevens, Glenn Garrett, Jin-Yoo Suh,
and Joe Schramm for valuable discussion and heroic help quenching the 420 °C massive
mold.
Chapter 5 References [1] A.L. Greer, E. Ma, MRS Bull. 32 (2007) 611. [2] W.L. Johnson, MRS Bull. 24 (1999) 42. [3] A. Inoue, Acta Mater. 48 (2000) 279. [4] W.L. Johnson, JOM 54 (2002) 40. [5] K.J. Laws, B. Gun, M. Ferry, Mat. Sci. Eng. A 425 (2006) 114. [6] W.L. Johnson, M.D. Demetriou, J.S. Harmon, M.L. Lind, K. Samwer, MRS Bull.
32 (2007) 644. [7] B.A. Legg, J. Schroers, R. Busch, Acta Mater. 55 (2007) 1109. [8] J.F. Löffler, J. Schroers, W.L. Johnson, Appl. Phys. Lett. 77 (2000) 681. [9] T. Waniuk, J. Schroers, W.L. Johnson, Phys. Rev. B 67 (2003) 184203. [10] J. Schroers, Q. Pham, A. Desai, J. Microelectromech. S. 16 (2007) 240. [11] J. Degmova, S. Roth, J. Eckert, H. Grahl, L. Schultz, Mat. Sci. Eng. A 375 (2004)
265. [12] K.S. Lee, Y.W. Chang, Mat. Sci. Eng. A-Struct. 399 (2005) 238. [13] J. Schroers, Q. Pham, A. Peker, N. Paton, R.V. Curtis, Scripta Mater. 57 (2007)
341. [14] A. Wiest, G. Duan, M.D. Demetriou, L.A. Wiest, A. Peck, G. Kaltenboeck, B.
Wiest, W.L. Johnson, Acta Mater. 56 (2008) 2625. [15] G. Duan, A. Wiest, M.L. Lind, J. Li, W.K. Rhim, W.L. Johnson, Adv. Mater. 19
(2007) 4272. [16] G.J. Fan, H.J. Fecht, E.J. Lavernia, Appl. Phys. Lett. 84 (2004) 487. [17] R. Busch, E. Bakke, W.L. Johnson, Acta Mater. 46 (1998) 4725. [18] H. Kato, T. Wada, M. Hasegawa, J. Saida, A. Inoue, H.S. Chen, Scripta Mater. 54
(2006) 2023.

6.1
Chapter 6 - Relaxation Phenomena in the ZrTiBe System
6.1 Abstract
The presence of two apparent glass transitions in the large ΔT alloys prompted
further investigation of flow and relaxation properties in the supercooled liquid region
(SCLR). This chapter is similar to a paper entitled “Relaxation Phenomena in the ZrTiBe
System” submitted to Acta Materialia. The expected authors are [A. Wiest, S. Roberts,
M.L. Lind, D. Soh, D.C. Hofmann, M.D. Demetriou, C.M. Garland, W.L. Johnson]. The
discovery of bulk glass forming compositions in the ZrTiBe system allowed a more
thorough study of relaxation phenomena in the SCLR to be accomplished. Heat capacity
measurements of glassy compositions show two discontinuities, Δcp1 and Δcp2, in the
SCLR. If the discontinuities are assumed to arise from glass transitions of two glasses
with similar fragilities and different glass transition temperatures then the ratio Δcp1/(Δcp1
+ Δcp2) gives the fraction of the first glassy phase. A plot of Δcp1/(Δcp1 + Δcp2) vs Zr
concentration along an iso Be line reveals a linear relationship and rule of mixtures
analysis predicts compositions that would be single phase. The predicted compositions
exhibit single phase glass behavior and glass transition temperatures consistent with the
two phase alloys. Viscosity vs temperature and shear modulus versus temperature
measurements also reveal relaxation events at temperatures near the observed jumps in
heat capacity. These relaxation events are well described by a two phase glass
assumption, but microstructural evidence is lacking.
6.2 Introduction
The existence of a miscibility gap in the SCLR of BMG that gives rise to phase
separation upon relaxation of the glass has been claimed in many glass forming alloy

6.2
systems including AuPbSb [1-2], ZrCu [3], ZrTiBe [4-7], ZrTiCuNiBe [8-10], MgCuYLi
[11], CuZrAlAg [12], TiYAlCo and ZrYAlCo [13]. Using X-ray scattering, Johnson and
collaborators detected splitting of the broad amorphous spectrum in an as-spun AuPbSb
glassy ribbon [1]. Additional studies using Small Angle Neutron Scattering (SANS) [9-
10], Small Angle X-ray Scattering (SAXS) [10], Anomalous Small Angle X-ray
Scattering (ASAXS) [11], Transmission Electron Microscopy (TEM) [13], discontinuous
slopes in resistivity measurements [3], and Differential Scanning Calorimetry (DSC) [4-
7] have been performed to support the apparent phase separation in many glass forming
systems. In some systems, such as in the Vitreloy (ZrTiNiCuBe) system, phase
separation arises by annealing the glassy phase below Tg, supporting the existence of a
miscibility gap below Tg [8-10]. In other systems, such as AuPbSb and ZrTiBe, phase
separation is manifested as a twin relaxation in the SCLR [1-2, 4-7], supporting the idea
that the miscibility gap extends above Tg, and suggesting that perhaps two chemically
separable glassy phases vitrify upon cooling the alloy below the miscibility gap.
Tanner examined the ZrTiBe system for glass forming compositions and found
that many alloys could form amorphous ribbons with thickness up to 100μm [14-15].
Heat capacity measurements using DSC revealed that some of the glassy alloys exhibit
two discontinuities in heat capacity upon heating. Typically, a glassy material upon
heating is expected to exhibit just one discontinuity in heat capacity that designates the
increase in mobility associated with the glass relaxing to a supercooled liquid state at Tg
[16]. A double jump in heat capacity, which can be interpreted as a double glass
transition temperature is unusual. Tanner proposed that this anomalous feature of the
heat capacity supports the coexistence of two glassy phases in the vitrified state. Other

6.3
authors who have studied this system have interpreted the second jump in specific heat as
an exothermic ordering event that follows Tg and precedes crystallization [17]. To date,
the precise origin of the double jump in heat capacity and the associated impact on the
chemistry, structure, and rheology of the supercooled liquid remain unresolved, a fact
that can be at least partly attributed to the unavailability of bulk ZrTiBe specimens.
Recently, the ZrTiBe system has been reexamined, and many compositions that
exhibit the apparent two Tg phenomenon and which were previously thought to be limited
to a critical casting thickness of 100μm could in fact be cast into bulk glassy samples
with thicknesses that range from 1 - 6mm [18]. The availability of bulk ZrTiBe samples
that exhibit two Tg events paves the way to a more thorough examination of this
phenomenon allowing measurement of bulk flow properties and shear modulus as a
function of temperature. We use bulk ZrTiBe specimens to investigate the effects of the
two Tg events on the heat capacity, rheology, and rigidity of the SCLR through DSC,
TMA, and ultrasonic tests.
6.3 Experimental Method
Elements of 99.9% purity or higher were arc melted on a water cooled copper
hearth under a Ti-gettered argon atmosphere. Zr and Ti were varied in 5 atomic percent
increments along a fixed Be line and compositions were cast into 0.5mm thick plates for
DSC analysis using an Edmund Buhler mini arc melter. The amorphous nature of the
plates was verified using X-ray diffraction. Segments from the plates were heated in a
Netzsch 404C Pegasus Differential Scanning Calorimeter at 20 K/min and 5 K/min past
the crystallization temperature. The 20 K/min scans showed sharper features in heat
capacity because of the larger signal produced at faster scan rates and 20 K/min scans

6.4
were used to determine the apparent glass transition temperatures and magnitude of the
jumps in heat capacity. To enable the evaluation of the heat capacity jump from the 20
K/min scans, an initial baseline was taken and then subtracted from the sample run. The
5 K/min runs were used to determine the glass transition temperatures at that rate, as the
viscosity and shear modulus experiments were conducted at 5 K/min. Since only Tg was
of interest at 5 K/min, baseline subtraction was unnecessary.
The heat capacity features of the SCLR were analyzed in a consistent manner. A
baseline heat capacity is seen at low temperatures, and two successive jumps in heat
capacity are seen before the exothermic crystallization event. The lower glass transition
temperature, Tg1 is defined as the intersection between the tangent to the low temperature
heat capacity baseline and the tangent to the point of steepest slope during the first heat
capacity jump. The second heat capacity jump is similarly analyzed to find the second
glass transition temperature, Tg2. The two jumps in heat capacity are denoted Δcp1 and
Δcp2, and are shown in Figure 6.1.
-0.1
-0.05
0
0.05
0.1
0.15
200 250 300 350 400
Temperature [C]
Hea
t Flo
w [W
/g]
Exo
c p1
c p2
Tg1
Tg2
Figure 6.1: 20 K/min DSC scan of Zr30Ti30Be40 showing double discontinuity in heat capacity in SCLR. Δcp and Tg determination method illustrated.

6.5
The viscosity was measured using the parallel plate geometry with a Perkin Elmer
Diamond TMA over a temperature region spanning the two Tg events. 1mm and 3mm
diameter specimens were used. The diameter to height aspect ratio was set to 1.0 for the
3mm diameter samples, and to 1.8 for the 1mm diameter samples to avoid buckling and
achieve maximum deformation. A force of 1400 mN was applied resulting in a
compressive stress of 1.8 MPa on the 1mm diameter specimens and a stress of 0.2 MPa
on the 3mm diameter specimens. The heating rate through the SCLR was 5 K/min. The
viscosity was analyzed using the displacement and the displacement time derivative data,
according to the method for parallel plate rheometry also known as Stefan’s equation
found in Derivation 3 and [19]. The condition of zero thickness was not approximated in
this study, as suggested in [19] for accurate viscosity determination. Nevertheless,
despite a limited accuracy in viscosity, the relative flow behavior of different alloys,
which is of interest here, is clearly revealed by the present data.
In situ pulse-echo ultrasonic measurements using 25 MHz shear transducers
(Ultran) were used to measure the shear sound velocity of 8mm diameter rods heated
from room temperature through 410 °C with a heating rate of approximately 5 K/min.
The detailed experimental setup is fully described in Lind's Caltech PhD Dissertation
[20].
Samples were prepared for TEM by dimple grinding 50μm thick foils from both
sides and then ion milling. The ion milling was done at -100 °C, 9 degrees milling angle,
3.5kV and 7.0mA. Diffraction patterns were obtained as well as bright field and dark
field images at 1400000x.

6.6
6.4 Results and Discussion
6.4.1 Heat Capacity Measurements
A DSC scan conducted at 20 K/min of a Zr30Ti30Be40 alloy is presented in Figure
6.1. If we assume two phases, then the ratio Δcp1/(Δcp1 + Δcp2) should give some
information about the fraction of phase one in the alloy. To determine what information
can be gained, a brief discussion of fragility is necessary.
Fragility (m) is a measure of a liquid's resistance to flow with temperature, or put
differently, a resistance to changes in medium range order. Mathematically,
)/()(
TTLogm
g∂∂
=η which is the slope of the Log(η(Tg/T)) curve. A liquid with low fragility
resists flow and therefore has a lower configurational entropy (Sconfig) than a more fragile
liquid [16]. Liquids with low fragilities exhibit smaller jumps in heat capacity at the
glass transition temperature because T*Δcp = Sconfig. Therefore, the fraction of phase one
is given by the ratio Δcp1/( Δcp1 + Δcp2) if the two liquids are assumed to have similar
fragilities.
More thorough examination of the ZrTiBe system reveals many compositions
with moderate GFA = 1 - 6mm that exhibit apparent double glass transitions, similar to
the Zr36Ti24Be40 alloy, upon heating in the DSC. The alloys with the best GFA are along
the (ZraTi1-a)65Be35 composition line, but larger variations in fraction of phase 1 as a
function of composition are found along the (ZraTi1-a)60Be40 line. The data is analyzed
using the similar fragility assumption so that the fraction of phase 1 = Δcp1/(Δcp1 + Δcp2).
A plot of Δcp1/(Δcp1 + Δcp2) versus Zr concentration is found in Figure 6.2 for the Be =
35 and Be = 40 pseudo binary lines. Linear fits are included in Figure 6.2 and have R2
values greater than 0.99. The goodness of fit of the linear relationship suggests that a rule

6.7
of mixtures analysis could be applied to determine the compositions where a single phase
alloy would be expected. The compositions into which the alloy appears to be phase
separating are given by Δcp1/(Δcp1 + Δcp2) = 1 for all phase 1 and Δcp1/(Δcp1 + Δcp2) = 0
for all phase 2.
Rule of Mixtures Iso-Be
y = 1.7053x - 0.2273 (Be=40)
y = 0.9426x + 0.3929 (Be=35)
0.0
0.2
0.4
0.6
0.8
1.0
0 0.2 0.4 0.6 0.8 1
Zr/(100-Be)
ΔC
p1/(Δ
Cp1
+ΔC
p2)
Figure 6.2: Plot of Δcp1/(Δcp1 + Δcp2) versus Zr concentration gives fraction of phase 1 assuming two glassy phases with similar fragilities. Linear fits indicate rule of mixtures analysis is appropriate and suggests a metastable miscibility gap in SCLR.
Along the Be = 35 line we extrapolate to the point where Δcp1/(Δcp1 + Δcp2) = 1
and find that the composition Zr42Ti23Be35 should exhibit a single jump in heat capacity at
Tg1 but unfortunately, the variation in Δcp1/(Δcp1 + Δcp2) versus Zr concentration is not
steep enough to find a composition where Δcp1/(Δcp1 + Δcp2) = 0. In Table 6.1, we see
that near the composition predicted to show all phase 1 along the Be = 35 line, alloys do
not have a visible second jump in heat capacity. However, along the Be = 40 line we can
extrapolate to compositions where Δcp1/(Δcp1 + Δcp2) equals 1 or 0. These compositions
are Zr43Ti17Be40 for all phase 1 and Zr8Ti52Be40 for all phase 2. The GFA of the

6.8
Zr8Ti52Be40 alloy was poor and an amorphous sample was obtainable only in thin foils.
The DSC scans of Zr45Ti15Be40 and Zr8Ti52Be40 and a two phase glass midway along the
composition line Zr30Ti30Be40 are shown in Figure 6.3. The rule of mixtures analysis
predicted the compositions where a single phase glass would exist and we now have
some evidence of the compositions that the two phase glasses are separating into. Note
that the glass transition temperatures of each phase are fairly consistent between the two
phase and single phase glasses and that the overall jumps in heat capacity Δcp1 + Δcp2 are
similar along each iso Be line. The Zr8Ti52Be40 alloy likely exhibits a smaller Δcp1 + Δcp2
value because of early onset of crystallization. Thermodynamic data of the compositions
including glass transition temperatures and Δcp values is found in Table 6.1.
Table 6.1: DSC data for alloys considered in this article. Data shown in parentheses taken at 5 K/min. Other data taken at 20 K/min. Temperatures in °C. Δcp1 values in J/(g*K).
Composition Tg1 Δcp1 Tg2 Δcp2 Δcp1/(Δcp1Δcp2)
Zr25Ti40Be35 301.7 0.275 362 0.089 0.76
Zr30Ti35Be35 304.1 0.328 364.1 0.069 0.83
Zr35Ti30Be35 305.7 0.366 364.4 0.039 0.90
Zr40Ti25Be35 303.7 0.339 367.3 0.01 0.97
Zr45Ti20Be35 303.2 0.43 N/A 0 1
Zr8Ti52Be40 N/A 0 379.9 0.25 0
Zr20Ti40Be40 324.9 (320) 0.167 377.6 (363) 0.271 0.38
Zr25Ti35Be40 319.0 (311) 0.198 379.3 (360) 0.218 0.48
Zr30Ti30Be40 323.6 (317) 0.261 375.2 (360) 0.164 0.61
Zr35Ti25Be40 312.2 0.303 377.8 0.086 0.78
Zr40Ti20Be40 319.3 0.346 374.5 0.035 0.91
Zr45Ti15Be40 323.9 0.344 N/A 0 1
Zr30Ti30Be32Cu8 (306) (355)

6.9
0
0.05
0.1
0.15
0.2
0.25
0.3
0.35
0.4
150 200 250 300 350 400 450
Temperature [C]
Hea
t Flo
w a
rb. r
ef. [
W/g
]
Exo
Zr45Ti15Be40
Zr30Ti30Be40
Zr8Ti52Be40
Figure 6.3: 20 K/min DSC scans of alloys predicted to show only one phase from rule of mixtures analysis and one intermediate two phase composition.
It is interesting to note that both the simple ZrTiBe glasses and the quinary
Vitreloy compositions appear to separate into a Zr rich and a Ti rich phase. The ZrTiBe
glasses differ from the Vitreloy glasses in that they exhibit the two phase behavior
without any annealing in the SCLR. This suggests that the phase separation is more
favorable in the ternary system. It is also likely that annealing causes the glass to relax
toward the stable crystal phase as was seen in the Vitreloy glasses. This data lends itself
to expression in a metastable phase diagram exhibiting a liquid miscibility gap with the
endpoint compositions Zr8Ti52Be40 and Zr43Ti17Be40. The metastable phase diagram is
shown in Figure 6.4.
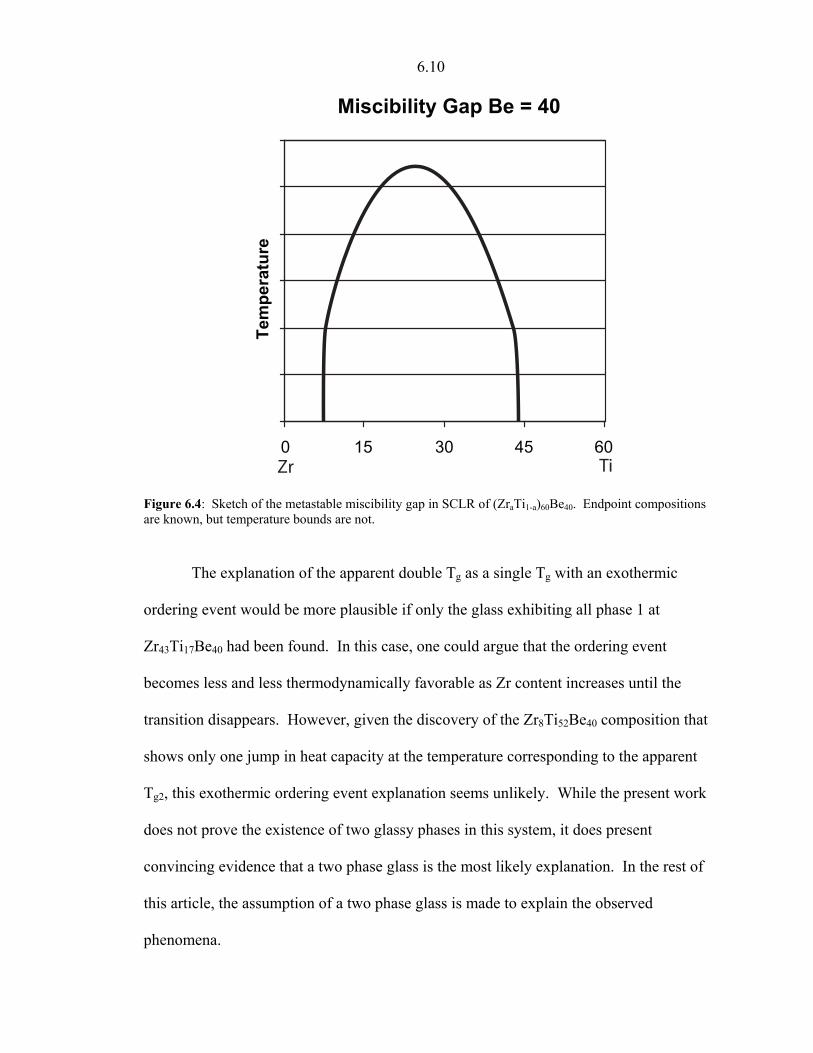
6.10
Miscibility Gap Be = 40
0 15 30 45 60
Tem
pera
ture
Zr Ti
Figure 6.4: Sketch of the metastable miscibility gap in SCLR of (ZraTi1-a)60Be40. Endpoint compositions are known, but temperature bounds are not.
The explanation of the apparent double Tg as a single Tg with an exothermic
ordering event would be more plausible if only the glass exhibiting all phase 1 at
Zr43Ti17Be40 had been found. In this case, one could argue that the ordering event
becomes less and less thermodynamically favorable as Zr content increases until the
transition disappears. However, given the discovery of the Zr8Ti52Be40 composition that
shows only one jump in heat capacity at the temperature corresponding to the apparent
Tg2, this exothermic ordering event explanation seems unlikely. While the present work
does not prove the existence of two glassy phases in this system, it does present
convincing evidence that a two phase glass is the most likely explanation. In the rest of
this article, the assumption of a two phase glass is made to explain the observed
phenomena.

6.11
6.4.2 Rheology
The flow of liquids with multiple phases is most simply divided into two limiting
cases for ideal mixtures. Variations of these ideal cases have been proposed to explain
the flow of other types of liquid mixtures. Very complicated analysis is possible for non-
Newtonian effects and can consider interfacial energies between the layers, but we seek a
qualitative picture of what to expect from viscosity as a function of temperature plots.
Both cases consider a liquid mixture with parallel layers or laminae. The applied shear
stress is orthogonal to the layers in Case 1. The applied shear stress is parallel to the
layers in Case 2. A simple analysis of these cases can be found in Derivation 8 and [21].
The results of the analysis find that viscosities, η, are additive for fluid mixtures
resembling Case 1, and fluidities, φ = 1/η, are additive for mixtures resembling Case 2.
The measured viscosity is just a volume weighted average of the individual component
viscosities or fluidities depending on which case better approximates the mixture of
interest. This resembles the analysis of resistors in series or parallel. In immiscible
fluids, the layers resist indefinite extension and a case similar to Case 1 results [21].
In the two phase amorphous (ZraTi1-a)60Be40 alloys, one would expect to see three
regions of flow. The first region is at temperatures below Tg1 where the sample would
behave like a solid and little or no flow would be observed. The second region covers the
temperature range Tg1 < T < Tg2. In region 2, we should see a slope change in the
viscosity versus temperature curve as the liquid + solid solution begins flow. The third
region spans the temperature range Tg2 < T < Tx. In region three, the sample should
exhibit flow characteristic of a two phase liquid. The sample begins to crystallize and
flow stops at Tx. Therefore, a flat η(T) relationship is expected in region one, followed

6.12
by a slightly decreasing η(T) slope in the solid + liquid solution in region 2, and finally a
large decrease in the η(T) slope in region 3 as both liquids begin to soften and flow.
Additionally, we should see a compositional effect causing lower measured values of
viscosity for a given temperature in alloys with a larger fraction of the low Tg phase. The
three regions should be visible in the η(T) plots regardless of whether the alloys exhibit
flow characteristics governed by additive viscosity or additive fluidity cases.
Three alloys along the Be = 40 line with moderate GFA and varying fractions of
the two phases were chosen to examine the flow characteristics of the alloys in the two
phase region. The chosen alloys were Zr20Ti40Be40, Zr25Ti35Be40, and Zr30Ti30Be40 with
35%, 48%, 61% of phase 1 respectively (as measured by the Δcp1/(Δcp1 + Δcp2) method).
Plots of η(T) are shown for the three alloys in Figure 6.5. The three flow regions are
visible in the plots and correlate well to the Tg values measured at the same heating rate
in the DSC. We also see the composition effect causing lower measured viscosities at a
given temperature for alloys with higher fractions of the low Tg phase. The horizontal
region in the η(T) plots at Tg2 is not understood and may be due to the small diameter of
the samples tested.

6.13
(ZraTi1-a)60Be40 Viscosity
250 300 350 400
1013
1012
1011
1010
109
108
Temperature [C]
Visc
osity
[Pa-
S]
Zr20Ti40Be40
Zr25Ti35Be40
Zr30Ti30Be40
Tg1 Tg2
Region 1 Region 2 Region 3
Figure 6.5: η(T) plots for three alloys with differing fractions of phase 1, showing apparent double glass transition. The test specimens were 1mm diameter x 1.8mm tall rods of Zr20Ti40Be40 (38% phase 1), Zr25Ti35Be40 (48% phase 1), and Zr30Ti30Be40 (61% phase 1) deformed under a force of 1400 mN at 5 K/min in a TMA. Region 1 corresponds to a solid-solid mixture with no deformation. Region 2 corresponds to solid-liquid mixture and minimal deformation indicated by shallow slope of η(T). Region 3 is a liquid-liquid mixture with the greatest deformation rate indicated by the steepest η(T) slope. The scatter in first and second glass transitions as measured in 5 K/min DSC scans shown by parallel black vertical lines.
Additions of Cu were found to increase the GFA and the temperature range of the
SCLR while maintaining the two discontinuities in heat capacity for some of these alloys.
3mm diameter samples of Zr30Ti30Be32Cu8 were cast fully amorphous and η(T) was
measured for as-cast samples and samples annealed at 410 °C for 100 s above Tg2.
Zr30Ti30Be32Cu8 has 63% phase 1 as measured by the Δcp1/(Δcp1 + Δcp2) method. η(T)
plots for the as-cast and annealed samples are shown in Figure 6.6. The η(T) plots are
very similar for both samples. Three flow regions are again visible and the horizontal
region after Tg2 is not present. The transition from the first to the second flow region

6.14
happens at Tg1 as expected, but the second decrease in slope of η(T) does not happen until
50 degrees above Tg2.
Zr30Ti30Be32Cu8 Viscosity
107
108
109
1010
1011
1012
1013
290 340 390 440
Temperature [C]
Vis
cosi
ty [P
a-s]
As Cast
Annealed
Region 1 Region 2 Region 3
Figure 6.6: η(T) plots for as-cast and annealed samples of Zr30Ti30Be32Cu8. The test specimens were 3mm diameter x 3mm tall rods deformed under a force of 1400 mN at 5 K/min in a TMA. The annealed sample was heated to 410 °C for 100 s and shows a slightly lower viscosity than the as-cast sample in region 2. Both samples show similar flow behavior in the SCLR. The flow regions and glass transitions do not align for these samples as was observed for the (ZraTi1-a)60Be40 compositions in Figure 6.5.
Viscosity versus temperature measurements show two relaxation events as would
be expected by a two phase glass. These relaxation events are evidenced by changes in
the slope of the viscosity vs temperature curves but the slope change does not happen at
Tg2 as one would expect.
6.4.3 Shear Modulus
The shear modulus as a function of temperature G(T) provides another method to
observe relaxation phenomena in the SCLR of glasses. As a glass transitions from solid-
like to liquid-like behavior at the glass transition temperature, a softening in shear

6.15
modulus occurs [16]. In a two phase glass, one would expect two softening events
corresponding to the two glass transition temperatures. Two in situ shear modulus
measurements were conducted on the Zr30Ti30Be32Cu8 alloy. The first measurement was
masked by deformation of the glass in the SCLR because the samples height decreased as
it expanded to tightly fill the holder. The second measurement gave G(T) for a sample
heated past Tg2 once. The second G(T) measurement is shown in Figure 6.7. There are
two changes in the slope of G(T) roughly corresponding to the two glass transition
temperatures. This is another evidence of two relaxation events in the SCLR of these
alloys showing the apparent double glass transition.
G(T) plot for Zr30Ti30Be32Cu8
32.0
33.0
34.0
35.0
36.0
37.0
38.0
39.0
40.0
100 150 200 250 300 350 400 450
Temperature [C]
Shea
r Mod
ulus
[GPa
]
Region 1 Region 2 Region 3
Figure 6.7: In situ G(T) measurements on an annealed sample of Zr30Ti30Be32Cu8 showing two slope changes. These slope changes are indicative of two relaxation events in the alloy. The G(T) and η(T) relaxation temperatures do not correlate well for this sample.

6.16
It should be noted that the G(T) and η(T) relaxation temperatures do not correlate
well with each other or with the temperatures corresponding to the heat capacity
discontinuities observed in 5 K/min DSC scans. This could be an effect of differences in
casting thickness between the samples. DSC and TMA samples were 3mm diameter rods
and the sample cast for G(T) measurements was an 8mm rod. The relaxation events
however were consistent in η(T) measurements for as-cast and annealed samples. Further
investigation is warranted to determine the reason behind the large scatter in measured
relaxation temperatures.
6.4.4 Microscopy
One would expect good Z contrast in alloys separating into the Zr rich and Ti rich
phases proposed in this paper. No Z contrast was visible with SEM imaging using a back
scatter electron detector suggesting that phase separation may be smaller than the
resolution of the SEM (about 100nm using our polishing technique). This would be
consistent with the 13nm length scale phase separation found in the SANS work of
Johnson [10]. A representative bright field image, dark field image, and diffraction
pattern is included in Figure 6.8 for TEM observation of an ion milled Zr30Ti30Be40
specimen. The magnification on the TEM images is 1400000x. Z contrast imaging was
attempted using a high angle annular dark field detector, but the lack of contrast made
focusing and magnification difficult so no images were obtained. It is not clear that any
broadening of the amorphous halos is present in the diffraction pattern. Elemental
analysis using electron dispersive X-ray spectroscopy (EDS) in the TEM was unable to
detect Be because of experimental limitations, but found that Zr concentration varied
from 52 - 58 atomic percent with Ti making the balance. The alloy we imaged was

6.17
Zr30Ti30Be40 so one would expect Zr = 50% in a single phase sample, but this deviation
from 50% is not statistically significant.
Figure 6.8: Dimple ground and ion milled sample imaged in TEM. Bright field and dark field images show no evidence of two phases. The diffraction pattern is characteristic of an amorphous alloy.
The lack of microscopic evidence does not preclude the existence of two phases,
but it casts doubt on the likelihood that two phases are present. It is possible that ion

6.18
milling provides enough energy to randomize the two phase structure. Indeed, higher
voltages and currents along with longer milling times caused another sample to
nanocrystallize in regions. A well prepared, thin TEM sample is about 50nm thick. The
length scale of phase separation is bounded below by the size of an STZ. If we assume a
5nm length scale, about half that observed in Vitreloy alloys, we could expect a TEM
image averaged over ~ 10 phase separated regions.
6.5 Conclusion
The discovery that many alloys in the ZrTiBe system could be cast amorphous in
bulk samples allowed relaxation phenomena in the SCLR to be studied more thoroughly.
Heat capacity measurements in a DSC were conducted on many compositions along the
Be = 35 and Be = 40 pseudo binary lines. An anomalous double discontinuity in heat
capacity in the SCLR was observed. The heat capacity discontinuities were assumed to
arise from two glassy phases with different glass transition temperatures and similar
fragilities. Under these assumptions, the ratio Δcp1/(Δcp1 + Δcp2) gives the fraction of
phase 1 in the glass. A plot of Δcp1/(Δcp1 + Δcp2) versus composition reveals a linear
relationship suggesting a rule of mixtures analysis would be appropriate and revealing a
metastable miscibility gap in the SCLR. Extrapolating the line to Δcp1/(Δcp1 + Δcp2) = 1
gives the composition Zr43Ti17Be40 where we would expect all phase 1. Extrapolating the
line to Δcp1/(Δcp1 + Δcp2) = 0 gives the composition Zr8Ti52Be40 where we would expect
all phase 2. DSC scans of amorphous samples of the projected single phase compositions
showed a single discontinuity in heat capacity with glass transition temperatures similar
to those observed in the intermediate composition range “two phase” alloys.

6.19
Viscosity measurements as a function of temperature also revealed two relaxation
phenomena. η(T) plots showing regions corresponding to solid-solid solutions, solid-
liquid solutions, and liquid-liquid solutions were found for three (ZraTi1-a)60Be40
compositions exhibiting the apparent two glass transitions. The η(T) plots also showed
lower viscosities as a function of temperature for alloys with a higher concentration of the
low Tg, Zr rich, phase. The temperatures at which the flow behavior changed roughly
correlate to the apparent glass transition temperatures measured in the DSC. A
quaternary composition exhibiting the apparent two glass transitions also showed the
three regions of flow. Annealing above the second glass transition temperature did not
affect the flow behavior of the quaternary glass.
In situ measurements of shear modulus as a function of temperature, G(T), on the
quaternary glass also revealed two relaxation phenomena. Decreases in the slope of the
G(T) line indicated softening events and roughly correlated to measured glass transition
temperatures in the DSC.
Unfortunately, attempts to image the phases in SEM and TEM were unsuccessful.
If the sample thickness was larger than the length scale of phase separation, the resolution
of the phases would be diminished in BF and DF imaging as electron interactions are
averaged over multiple phase regions. Future work should look for evidence of
composition fluctuations using small angle scattering techniques.
The low GFA of the ZrTiBe compositions makes preparation of sufficient sample
for SANS difficult. SAXS and ASAXS may provide a suitable alternative method to
determine the length scale of any possible phase separation. Evidence of two relaxation
events in the SCLR is clear from the presented data. It is still unproven whether or not

6.20
the relaxation events arise from two glassy phases softening at Tg. It is unlikely that an
explanation proposing a single glass transition with an exothermic ordering event would
be sufficient to describe the relaxation phenomena observed in these experiments.
The observed double relaxation phenomena in the SCLR of the studied alloys are
not yet fully understood. A two phase glass is one plausible explanation, but more
microstructural evidence is needed to confirm this hypothesis.
Chapter 6 References [1] M.C. Lee, J.M. Kendall, W.L. Johnson, Appl. Phys. Lett. 40 (1982) 382. [2] W.L. Johnson, Amorphe Metallische Werkstoffe 14. Metalltagung in der DDR
(1981) 183. [3] R. Schulz, K. Samwer, W.L. Johnson, J. Non-Cryst. Solids 61 & 62 (1984) 997. [4] L.E. Tanner, R. Ray, Scripta Metall. 11 (1977) 783. [5] R. Hasegawa, L.E. Tanner, Phys. Rev. B 16 (1977) 3925. [6] L.E. Tanner, R. Ray, Acta Metall. 27 (1979) 1727. [7] L.E. Tanner, R. Ray, Scripta Metall. 14 (1980) 657. [8] S. Schneider, P. Thiyagarajan, U. Geyer, W.L. Johnson, MRS Technical Report
DOI 10.2172/510428 (1996). [9] S. Schneider, P. Thiyagarajan, U. Geyer, W.L. Johnson, Physica B 241 (1998)
918. [10] S. Schneider, U. Geyer, P. Thiyagarajan, W.L. Johnson, Materials Science Forum
Vols. 235-238 (1997) 337. [11] W. Liu, W.L. Johnson, S. Schneider, U. Geyer, P. Thiyagarajan, Phys. Rev. B 59
(1999) 11755. [12] Q. Zhang, W. Zhang, G. Xie, A. Inoue, Mater. Sci. Eng. B 148 (2008) 97. [13] B.J. Park, H.J. Chang, D.H. Kim, W.T. Kim, K. Chattopadhyay, T.A.
Abinandanan, S. Bhattacharyya, Phys. Rev. Lett. 96 (2006) 245503. [14] L.E. Tanner, R. Ray, C.F. Cline, US Patent #3989517. [15] L.E. Tanner, R. Ray, C.F. Cline, US Patent #4050931. [16] S.R. Elliott, Physics of Amorphous Materials, second ed., John Wiley & Sons
Inc., New York, 1990, pp. 29-69. [17] G. Kumar, D. Nagahama, M. Ohnuma, T. Ohkubo, K. Hono, Scripta Mater. 54
(2006) 801. [18] A. Wiest, G. Duan, M.D. Demetriou, L.A. Wiest, A. Peck, G. Kaltenboeck, B.
Wiest, W.L. Johnson, Acta Mater. 56 (2008) 2625. [19] G.J. Dienes, H.F. Klemm, J. Appl. Phys. 17 (1946) 458. [20] M.L. Lind, Dissertation, California Institute of Technology (2008). [21] E.C. Bingham, Fluidity and Plasticity, McGraw-Hill Book Company, Inc., Ohio,
1922, pp. 81-105.

7.1
Chapter 7 - Conclusion
The potential for processing metals like plastics inspired much of the research of
this thesis. Some of the most important inventions and discoveries made in the course of
pursuing that goal are listed below.
1. ZrTiBe + ETM increases GFA (no LTM required) (Ch2).
2. ZrTiBe + ETM alloys can be as light as Ti and as strong as tool steel (Ch2).
3. ZrTiBe alloys can be cast amorphous in 1 - 6mm diameter rods (Ch3).
4. Substitution of Be with small amounts of LTM in ZrTiBe alloys exhibiting large
ΔT values leads to alloys with even larger ΔT values until other phases are formed
with too much LTM (Ch3).
5. Cu is the most effective element at increasing ΔT of ZrTiBe + Me alloys (Ch3).
6. The alloy with the largest ΔT in the literature prior to my entry into grad school in
2005 was Zr44Ti11Cu10Ni10Be25 with ΔT = 135 °C. The current record holder.
Zr35Ti30Be27.5Cu7.5, has ΔT = 165 °C and was found in the course of research for
this thesis (Ch3).
7. Investigation of the viscosity and TTT properties of Zr35Ti30Be27.5Cu7.5 revealed
that for TPF processes requiring 60 - 300 s, this newly discovered alloy provides
10x lower processing viscosity than the other well known alloys for TPF (Ch4).
8. TTT data and η(T) data can be combined to give valuable processing information
for TPF processes. The resulting ηTT plots tell how long one can process at a
desired viscosity before crystallization (Ch5). This concept will be further
discussed later in the conclusion.

7.2
9. The discovery of Zr35Ti30Be27.5Cu7.5 with ΔT = 165 °C allowed injection molding
of a metallic glass to be demonstrated for the first time (Ch5).
10. The discovery of bulk glass formers in the ZrTiBe system facilitated a better
understanding of the SCLR of these alloys and allowed for a clear observation of
two relaxation phenomena in the SCLR that is likely related to the phase
separation observed in Vitreloy alloys upon annealing in the SCLR (Ch6).
11. ZrTiBe + Me compositions exhibit very low corrosion rates in 50% w/w NaOH,
0.6M NaCl, and 10x PBS (A1).
12. ZrTiBe + Me compositions have corrosion rates varying from 50 MPY to 107
MPY in 12M HCl and show a log linear relationship with half cell potential
(SHE) (A1).
13. ZrTi based Be bearing alloys show evidence of good biocompatibility (A2).
14. We discovered ZrTiBe + Me compositions with 10x better corrosion resistance in
ocean water than other Zr based BMG alloys in the literature and other crystalline
alloys commonly used in marine environments (A3).
15. Corrosion fatigue properties are similar to other Zr based BMG alloys despite
improved corrosion resistance in 0.6M NaCl (A3). This makes the use of Zr
based BMG alloys unlikely in load bearing applications in saline environments
like the ocean or the human body.
My optimistic hopes for broad ranging application of these materials in the
orthopaedics industry compelled me to learn about corrosion, take a cell culture class,
explore pertinent literature on biocompatibility, and study fatigue of materials. That

7.3
investigation culminated in the discovery of the material's terrible corrosion fatigue
properties. It is disappointing to dream about endless possibilities and then find that they
will not materialize as I had imagined. However, the excitement, discovery, and learning
that ensued more than compensated for the occasional disappointment.
Challenging aspects of this research have yet to be fully explored. Some of this
research I hope to participate in and some may keep future grad students investigating
and learning.
7.1 Future Research Directions
We need to determine if phase separation is happening in the ZrTiBe system. As
discussed in Chapter 6, SANS is difficult with these samples due to limited GFA so
SAXS is our best option. Discussion with scientists at Argonne National Laboratory is
underway and if a length scale of phase separation can be found, future microscopy
attempts may be more fruitful. If no phase separation is discovered then an alternate
analysis of the physics behind the two Tg phenomenon observed in the SCLR of these
alloys could be explored.
While we were unable to find an alloy that would work as a drop-in replacement
for plastics in TPF processes, we simplified the way we think about TPF with ηTT plots
and found an alloy that has 10x lower processing viscosity than the previous best alloys
for conventional TPF processes requiring 60 – 300 s. An important contribution of this
work to the field of metallic glasses was the discovery that new TPF processes must be
completed in well under 60 s to achieve optimum formability. A major difficulty in
pursuing my research was having to wait while material heated slowly in a barrel as it
moved toward crystallization. This difficulty is depicted in Figure 7.1.

7.4
Rapid RF Heating
Processing diagram
Time to crystallize [s]
Visc
oity
[Pa-
s]
Pt GlassPd GlassZrTi Glass
1
10
102
103
104
105
106
107
108
10-1
10-2
10-3 10-2 10-1 1 10 102 103 104
Melting Point
Dcrit ~ 70 mmDcrit ~ 15 mmDcrit ~ 2 mm
Marginal Glass Form
er
Conventional HeatingRDFRapidDischargeForming
Figure 7.1: Heating and forming times achievable using rapid discharge forming, RF heating, and conventional heating depicted along the x axis. ηTT data for a marginal glass former is schematically represented with the dashed line. ηTT data for the Pd alloy is sketchy because it is estimated from constant heating experiments in [1-2] but shows a change in slope as the melting temperature is approached. ηTT data for Pt alloy found in [2-3], and for the Zr alloy in [2, 4].
New TPF ideas are being pursued in the Johnson group to address the need for
faster processing and mainly faster heating. One way to rapidly heat metallic glass is by
using RF heating. An alternating current is placed on a solenoid and the resultant eddy
currents induced in near by metallic material to counter the changing magnetic flux
causes resistive heating. This method can heat a sample in under a second and with an
appropriate force, the forming could be completed in less than 10 seconds depending on

7.5
part geometry. The processing window accessible using this method is shown on Figure
7.1 and labeled RF.
Another method already being explored in the Johnson group is abbreviated RDF,
rapid discharge forming (not radial distribution function). It is well described in a patent
application entitled “Forming of Metallic Glass by Rapid Capacitor Discharge” [5]. This
method takes advantage of the unusual resistive properties of metallic glasses.
Crystalline metals usually have increasing resistances with increasing temperature. This
causes crystalline material to develop hot zones near a contact with a capacitor. Metallic
glasses have decreasing electrical resistance with increasing temperature. If a hot zone
begins to develop in a metallic glass, the local resistance will decrease and cause the
cooler regions to dissipate more of the energy resulting in uniform heating of a sample.
This heating method can bring a metallic glass to a temperature in the SCLR in
milliseconds. The RC time constant is the governing time scale and material can be taken
all the way to the melting temperature with an appropriate sample size to capacitor
energy ratio allowing access to the entire SCLR upon heating. This method theoretically
allows any process viscosity up to the melt viscosity to be accessible for processing if the
flow and cooling can happen quickly enough to bypass crystallization. Heating is no
longer the limiting factor in process time using this processing method. This processing
window is shown on Figure 7.1 and labeled RDF.
The ability to form parts with thin sections and complicated geometries is limited
by the time available to heat, form, and cool them amorphous. One bonus to
development of rapid heating technologies combined with large ΔT alloys is the ability to
spend much longer times in the forming step by minimizing the time required for heating.

7.6
Parts exceeding the critical casting thickness of the alloy could even be created provided
sufficient time exists to cool them in the SCLR and as demonstrated in Chapter 5, the
parts resulting from TPF are more reliable than die cast parts and exhibit similar strengths
with less scatter in strength.
The RDF and RF methods of heating allow alloys with smaller ΔT to be
considered for TPF. Part geometries are likely more limited than larger ΔT alloys could
achieve, but alloys exhibiting desirable properties but poor GFA would become much
more useful. TTT diagrams are accessible upon heating to much higher temperatures
using rapid heating methods than with previous experimental methods. The SCLR of
most glass forming alloys could be thoroughly explored.
I wish to close with a special thanks to Dr. Johnson for creating a fantastic
atmosphere of theory and experimentation. It was exactly the education I hoped for.
Chapter 7 References [1] J. Schroers, W.L. Johnson, R. Busch, Appl. Phys. Lett. 77 (2000) 1158. [2] W.L. Johnson, M.D. Demetriou, J.S. Harmon, M.L. Lind, K. Samwer, MRS Bull.
32 (2007) 644. [3] B.A. Legg, J. Schroers, R. Busch, Acta Mater. 55 (2007) 1109. [4] T. Waniuk, J. Schroers, W.L. Johnson, Phys. Rev. B 67 (2003) 184203. [5] W.L. Johnson, M.D. Demetriou, C.P. Kim, J.P. Schramm, US Patent application
#20090236017.

A1.1
Appendix 1 - Corrosion Properties of ZrTiBe + Me Alloys in HCl
A brief discussion about the mechanical requirements of orthopaedic hardware is
presented in section 1.6.1 of the introduction. It was initially thought that many of the
newly developed alloys would be ideal for orthopaedic applications from a mechanical
point of view and biocompatibility considerations would be the deciding factor in
whether or not the alloys could be used as implants. A survey of biocompatibility
literature is daunting for a non-biologist. We verified that Ni is not biocompatible [1],
but alloys containing Ni such as 316L stainless steel (13 - 15 weight % Ni) and Nitinol
(55 weight % Ni) are regularly used in the body [2]. This is a striking example, but many
others exist. An article by Burke [3] described 0th order biocompatibility as simply a
corrosion phenomenon. If the alloy dissolves in the body then it releases ions and
material that may be harmful.
We chose to do a first screening of our alloys for corrosion resistance before
delving into biocompatibility. With limited equipment to test corrosion properties in our
lab, we chose four highly corrosive solutions, 37% w/w HCl, 50% w/w NaOH, 0.6M
NaCl, and 10x PBS, to test the corrosion resistance at 1g alloy to 30 ml static solution of
three metallic glass compositions, Zr35Ti30Be35, Zr35Ti30Be29Co6, and
Zr44Ti11Cu10Ni10Be25, and three commonly used alloys for biomedical applications, Ti-
6Al-4V, 316L Stainless Steel, and CoCrMo. Mass loss measurements were conducted at
1 week, 1 month, and 3 months and for all solutions except HCl. No mass loss was
detectible until the three month time period. Inductively coupled plasma mass
spectrometry (ICPMS) measurements were used to analyze the solution for dissolved
elements at 3 months. 0.6M NaCl and 10x PBS solutions caused <0.1% mass loss for

A1.2
each of the alloys after three months and ICPMS revealed no further information because
the dissolved material was below the detection limit of the instrument. NaOH results did
show minimal mass loss at 3 months and the results are presented in Table A1.1. It was
determined that all alloys had excellent corrosion resistance in the tested solutions
excluding HCl.
Table A1.1: Mass loss and ICPMS measurements of NaOH solution after 3 months. Solution acidified to 2% w/w HNO3 as required for ICPMS.
Corrosion rates in HCl were enormous for most of the alloys tested.
Zr44Ti11Cu10Ni10Be25 dissolved in under 10 minutes. Most of the other alloys were
completely dissolved in 1 week, Zr35Ti30Be35 survived for almost 1 month, and the only
alloy to survive the full 3 months was CoCrMo which lost 12% of its mass. Corrosion
rates in HCl were seen to vary by many orders of magnitude depending on composition.
We sought to find the most corrosion resistant BMG for biological applications and given
that this was an acidic chloride containing environment, we saw an opportunity to quickly
differentiate corrosion resistances in a possibly biologically relevant environment. The
information in this appendix is expected to be submitted as a paper entitled, "Corrosion
Properties of ZrTiBe + Me Alloys in HCl," with the authors A. Wiest, S. Roberts, M.D.
Demetriou, and W.L. Johnson.
A1.1 Abstract
ZrTiBe + Me alloys, where Me is a metallic element, were immersed in
concentrated HCl and the corrosion rates were measured. Depending on the fourth
Alloy ZrTiBe ZrTiBeCo ZrTiBeCuNi 316L SS Ti64 CoCrMoMass Loss 0.10% 0.10% 0.40% <0.1% 0.20% 0.10%
Be = 75ppb Be = 60ppb Be = 400ppb <50ppb Al = 50ppb Co,Cr=100ppbZr = 1ppm Zr = 1.7ppm Zr = 15.7ppm Ti = 200ppb Mo =200ppb
Elementsof Interest

A1.3
alloying element corrosion rates from 102 - 107 MPY where MPY = 0.001 in/yr were
observed. Corrosion rate and standard half cell potential of the Me element are correlated
and show a log linear relationship. Surface chemistry is examined with XPS and reveals
a completely oxidized surface for samples left in air and approximately 25% pure metal
after 3% mass loss in HCl.
A1.2 Introduction
Zr based bulk metallic glasses (BMG) are often noted for their high corrosion
resistance [4-5]. Vitreloy 105 has corrosion rates similar to Ti-6Al-4V, CoCrMo, and
316L stainless steel in phosphate buffered saline solution. In simulated sea water (0.6M
NaCl), Vitreloy 105 exhibits corrosion rates comparable to many alloys used in marine
environments. The recently published Zr35Ti30Be35 and Zr35Ti30Be29Co6 glasses have an
order of magnitude higher corrosion resistance than Vit 105 in 0.6M NaCl [6].
The ZrTiBe + Me alloys where Me is an additional metallic element are the
subject of this study. The corrosion resistances of the constituent elements in our base
ternary alloy have been previously studied. Yau reorted that “titanium is immune to all
forms of corrosive attack in seawater and chloride salt solutions at ambient temperatures”
in Corrosion Engineering Handbook [7]. Beryllium has been measured in oxygen free
and oxygen saturated solutions at 90 °C with NaCl concentrations ranging from 28µM -
0.85M. Low corrosion rates are observed for oxygen free water, however the rate
increases by two orders of magnitude in saturated oxygen water [8]. Zr is fully resistant
to attack at temperatures up to 100 °C in saturated NaCl [7, 9]. Ti alloyed with >10% Zr
is found to be more corrosion resistant in 90% H2O2 solutions than pure Ti. Thus it is not
surprising our alloys would exhibit high corrosion resistance in NaCl solutions.

A1.4
In order to differentiate corrosion rates of alloys with high corrosion resistance
and attempt to understand the mechanisms of corrosion better, 12M HCl was chosen as
an acidic chloride containing environment. Zr has high resistance to corrosion in 12M
HCl at room temperature, showing corrosion rates of <0.01µm/yr [9]. Ti and Be are
much more susceptible in elemental form to attack in HCl. Corrosion rates spanning 5
orders of magnitude were observed for ZrTiBe + Me glasses containing 1 - 5% of an
additional alloying element. Rates depended strongly on the “nobility” or standard half
cell potential of the alloying element.
A1.3 Experimental Method
6 - 10g master ingots were arc melted on a Cu hearth under a Ti-gettered argon
atmosphere. Alloys were composed of elements >99.9% purity and ingots with more
than 0.1% variation in mass before and after melting were discarded. Alloys were cast
amorphous into 2 or 3mm diameter rods depending on glass forming ability. Corrosion
tests were performed in static solution of 12M HCl in loosely capped high density
polyethylene bottles at room temperature using a ratio of 30 mL HCl to 1g alloy. Given
the low volume of corrosive media, corrosion rates were calculated using times
corresponding to mass losses of 1 - 5%.
Surface chemistry was examined using X-ray photoelectron spectroscopy (XPS).
Samples of the same composition were cut from a single rod and polished to 0.05µm
surface finish. One sample from each rod was left in air to examine the passive oxygen
layer. Other samples were immersed in 12M HCl until 1 - 3% mass loss was achieved.
Samples were removed from 12M HCl, rinsed in methanol to minimize oxide growth,
and placed in the XPS with less than 120 s of exposure to atmosphere before vacuum

A1.5
pumping commenced. Final pressures were in the 10-8 torr range. Minimal oxide growth
is expected on samples immersed in HCl after removal from the corrosive solution.
A1.4 Results and Discussion
In order to establish a baseline corrosion rate for the ZrTiBe alloys in 12M HCl,
Be was fixed at 35 atomic percent and Zr and Ti were varied in 5% increments. Be was
maintained at 35% because the best glass forming region in the ternary system is along
the Be = 35 line [10]. Figure A1.1 shows the corrosion rates of crystallized Zr25Ti40Be35,
and amorphous rods of Zr25Ti40Be35, Zr30Ti35Be35, and Zr35Ti30Be35. Note that the
corrosion rate decreases as the Zr content of the alloy increases, and the crystalline
sample has the fastest corrosion rate. The reason amorphous Zr based alloys exhibit
higher corrosion resistance than identical crystalline compositions is not well understood
despite other studies observing the same effect [11]. Pd40Ni40P20 shows the opposite
effect with the crystalline alloy exhibiting higher corrosion resistance [12].
ZrxTi65-xBe35 alloy corrosion
1.E+02
1.E+03
1.E+04
1.E+05
25 30 35
Zr content [at%]
Cor
rosi
on ra
te [M
PY]
Figure A1.1: Corrosion rate as a function of Zr content in Zr65-xTixBe35 alloys. Squares are 2mm diameter amorphous rods. The triangle is a crystallized 2mm diameter sample.

A1.6
Zr35Ti30Be35-xMex alloys, where x ~ 5, were tested in concentrated HCl. Large
variations in corrosion rates were measured between different Me additions. Table A1.2
lists the alloys tested and their observed corrosion rates. Figure A1.2 plots standard half
cell potential as measured against standard hydrogen electrode (SHE) of the fourth
alloying element versus corrosion rate of the alloy in 12M HCl. If the Pd point is
omitted, there is a nearly log linear relationship between corrosion rate and the standard
half cell potential of the fourth element. With little reason to expect a log linear
relationship, one can say that corrosion rate increases as nobility of the fourth alloying
element increases. We see the alloy containing Al with a half cell potential E0 = -1.66V
has the lowest observed corrosion rate = 56 MPY while alloys with Pd (E0 = 0.915V)
dissolve so quickly and violently that estimations of corrosion rate = 107 MPY are done
because complete dissolution happens in under 60 s. The Zr35Ti30Be30Cu5 alloy also
exhibits very high corrosion rates = 5*104 MPY.
Table A1.2: Alloy compositions and corrosion rates measured in 12M HCl.
Sample Corrosion rate [MPY]
Zr35Ti30Be35 2.6E+02Zr30Ti35Be35 5.8E+02Zr25Ti40Be35 1.6E+03Zr25Ti40Be35 crystallized 6.7E+04Zr35Ti30Be30Al5 5.6E+01Zr25Ti40Be30Cr5 4.3E+02Zr35Ti30Be29Fe6 7.9E+02Zr35Ti30Be29Co6 1.8E+03Zr35Ti30Be27.5Ni7.5 2.5E+03Zr35Ti30Be30Cu5 4.2E+04Zr35Ti30Be31Ag4 6.4E+04Zr35Ti30Be31Pd4 1.0E+07

A1.7
Figure A1.2: Plot of corrosion rate versus standard half cell potential E0 of quaternary alloying element. Table A1.2 gives compositions.
After immersion in HCl the alloy containing copper had chunks of Cu loosely
adhered on the surface, particularly at the ends of the rod. Pitting corrosion was evident
over the entire surface of rods removed from the HCl solution, but rods decreased
uniformly in diameter and length if pit depth is neglected. Elemental Zr is known to have
high corrosion rates in CuCl2 and FeCl3 solutions [9], but the measured corrosion rates
for Zr35Ti30Be29Fe6 = 785 MPY and Zr35Ti30Be30Cu5 = 42000 MPY differ by 2 orders of
magnitude. The corrosion rate may be somewhat accelerated due to the presence of
dissolved Cu or Fe in the acidic chloride solution, but the nobility of the alloying element
seems to be a more dominant effect. Given that Cu plates back onto the glass after
dissolving into the solution, it may be beneficial to think of the corrosion process in terms
of a redox reaction. Zr, Ti, and Be are all anodic elements with tough oxides, giving
good corrosion resistance in many environments. When an anodic element is placed next
to a cathodic element, the driving force to dissolve the anodic element is proportional to
the difference in standard half cell potentials at standard conditions. Since Zr, Ti, and Be
have similar half cell potentials, this difference in potential between neighbors would be
Zr35Ti30Be35-xMex
1.E+001.E+011.E+021.E+031.E+041.E+051.E+061.E+07
-2 -1.5 -1 -0.5 0 0.5 1
Standard half cell potential E0 [V]
Cor
rosi
on R
ate
[MPY
]

A1.8
mostly dependent upon the Me added. 12M HCl is far outside standard corrosion
conditions, and driving force does not predict corrosion rate, but the trend toward higher
corrosion rate in alloys with large differences in standard half cell potentials of the
elements suggests that the redox driving force may be an important part of the corrosion
physics.
XPS was used to analyze the surface chemistry of Zr35Ti30Be35. A polished
sample left in air for 24 hours showed a fully oxidized surface. Clear oxide peaks for the
ZrO2 3d3/2 and 3d5/2 doublet and the TiO2 2p1/2 and 2p3/2 peaks along with a weak
BeO 1s peak were detected. Peak fitting and integration of the area determined the
surface composition to be approximately (ZrO2)42(TiO2)25(BeO)33. Another sample from
the same rod was immersed in 12M HCl for 1 minute and then rinsed in methanol and
quickly loaded into the XPS to minimize oxide growth. The surface composition was
found to be (ZrO2)45(TiO2)24(BeO)31. These surface compositions are quite similar and
different from the bulk sample composition. Ti and Be are slightly deficient in the
surface with Zr dominating the chemistry. It appears that 1 min in HCl is not long
enough to alter the surface chemistry of this alloy. Another sample was polished and
immersed in 12M HCl for 12 hours resulting in 3% mass loss. This sample was rinsed in
methanol and quickly placed in the XPS to minimize time for oxide growth in air and a
new surface chemistry was observed. Zr and Ti peaks were visible separate from the
oxide peaks and accounted for approximately 25% of the surface chemistry. Figure A1.3
shows the Zr and Ti oxide peaks for the sample left in air and the oxide + metallic peaks
for the sample immersed in HCl for 12 hours. Despite 3% mass loss, the oxide is still the
dominant surface feature of the sample.

A1.9
0
500
1000
1500
2000
2500
3000
173178183188193
Binding Energy [eV]
Coun
ts
500
1000
1500
2000
2500
3000
450455460465470
Binding Energy [eV]
Coun
ts
Zr peaks
Ti Peaks
TiO
2 2p
1/2
TiO
2 2p
3/2
Ti 2p
3/2
Ti 2
p1/2
ZrO
2 3d
5/2
ZrO
2 3d
3/2
Zr 3d
3/2
Zr 3d
5/2
Fig A1.3: High resolution XPS scans of Zr35Ti30Be35 after sitting in air for 24 hours (blue) and after being immersed in 12M HCl for 12 hr resulting in 3% mass loss (pink).

A1.10
A1.5 Conclusion
ZrTiBe alloys are shown to have higher corrosion resistance as the Zr content is
increased. A crystallized rod of the Zr25Ti40Be35 composition exhibits much higher
corrosion rates than the glassy rods. Corrosion rates from 56 MPY to 107 MPY are
observed when approximately 5% of a metallic element is substituted for Be in
Zr35Ti30Be35 compositions. The Log of the corrosion rate seems linearly correlated with
standard half cell potential or nobility of the alloying element where, counterintuitively,
more noble elements cause higher corrosion rates. XPS reveals a completely oxidized
surface with surface chemistry differing from the bulk alloy. After dissolution in HCl
resulting in 3% mass loss, the surface reveals approximately 25% of the metal is in the
unoxidized state.

A1.11
Appendix 1 References [1] M. Uo, F. Watari, A. Yokoyama, H. Matsuno, T. Kawasaki, Biomaterials 20
(1999) 747. [2] J.F. Burke, P. Didisheim, D. Goupil, J. Heller, J.B. Kane, J.L. Katz, S.W. Kim,
J.E. Lemons, M.F. Refojo, L.S. Robblee, D.C. Smith, J.D. Sweeney, R.G. Tompkins, J.T. Watson, P. Yager, M.L. Yarmush, in: B.D. Ratner, A.S. Hoffman, F.J. Schoen, J.E. Lemons (Eds.), Biomaterials Science: An Introduction to Materials in Medicine, Academic Press, California, 1996, pp. 283-297.
[3] G.L. Burke, Can. Med. Assoc. J. (1940) 125. [4] M.L. Morrison, R.A. Buchanan, P.K. Liaw, B.A. Green, G.Y. Wang, C.T. Liu,
J.A. Horton, Mater. Sci. Eng. A 467 (2007) 198. [5] M.L. Morrison, R.A. Buchanan, R.V. Leon, C.T. Liu, B.A. Green, P.K. Liaw, J.A.
Horton, J. Biomed. Mater. Res. Part A 74A (2005) 430. [6] A. Wiest, G.Y. Wang, L. Huang, S. Roberts, M.D. Demetriou, P.K. Liaw, W.L.
Johnson, Scripta Mater. in review. [7] T.L. Yau, in: P.A. Schweitzer (Ed.), Corrosion Engineering Handbook, Marcel
Dekker, Inc., New York, 1996, pp. 158-163, 195-252. [8] J.L. English, in: D.W. White, J.E. Burke (Eds.), The Metal Beryllium, The
American Society for Metals, Ohio, 1955, pp. 533-548. [9] L.B. Golden, in: Zirconium and Zirconium Alloys, The American Society for
Metals, Ohio, 1953, pp. 305-326. [10] A. Wiest, G. Duan, M.D. Demetriou, L.A. Wiest, A. Peck, G. Kaltenboeck, B.
Wiest, W.L. Johnson, Acta Mater. 56 (2008) 2625. [11] S. Hiromoto, A.P. Tsai, M. Sumita, T. Hanawa, Corros. Sci. 42 (2000) 1651. [12] Y.F. Wu, W.C. Chiang, J. Chu, T.G. Nieh, Y. Kawamura, J.K. Wu, Mater. Lett.
60 (2006) 2416.

A2.1
Appendix 2 – One Year Rabbit Implantation Study of a Zirconium Based Beryllium
Bearing Metallic Glass
Aaron Wiest1, Theodore A. Waniuk2
1. Keck Engineering Laboratories, California Institute of Technology, Pasadena, California 91125, US
2. Liquidmetal Technologies, 30452 Esperanza, Rancho Santa Margarita, CA 92688, US
Zr35Ti30Be35 and Zr35Ti30Be29Co6 were chosen for further biocompatibility testing.
Zr35Ti30Be35 exhibited one of the best corrosion resistances in HCl, had moderate GFA =
6mm, had a moderate ΔT = 120 °C and good strength to weight ratio. Zr35Ti30Be29Co6
had good corrosion resistance, but much better GFA = 15mm, ΔT = 155 °C, and showed
good potential for TPF. Samples were sent to a testing company, NAMSA, and short
term in vitro and in vivo studies were done to assess biocompatibility. Both alloys
performed as well as the control specimen and were considered biocompatible in these
short term trials. A cell culture class at PCC provided me with the opportunity to test the
cytotoxicity of the 10x PBS solutions in which the metals were tested for corrosion
resistance over a period of three months. The solution was diluted to 1x strength and no
visible damage to the cells resulted after they were exposed to the media and allowed to
grow to 90% confluence. We became aware of extensive biocompatibility testing
performed for Liquidmetal Technologies on samples of Vitreloy 1 and a glassy composite
material called LM2 as part of Liquidmetal's effort to obtain FDA approval. Liquidmetal
Technologies kindly agreed to let me summarize and publish the results of the tests. The
summary was submitted to the Journal of Materials Science: Materials in Medicine under
the title “One Year Rabbit Implantation Study of a Zirconium Based Beryllium Bearing

A2.2
Metallic Glass,” but was not accepted. The reviewer stated that the paper seemed more
appropriate for a technological review and was likely correct. It is included here because
it presents important findings about the biocompatibility of ZrTiNiCuBe alloys.
A2.1 Abstract
A one year implantation study in specific pathogen free New Zealand White
Rabbits was performed to test the local response of bone and muscle tissue to a zirconium
based beryllium bearing bulk metallic glass, LM1, and a toughened glassy composite
material, LM2. Short term in vitro and in vivo studies conducted prior to the implantation
study are summarized and show that both LM1 and LM2 elicit responses similar to the
negative control material in each study. The implantation study shows LM1 elicits a mild
but worsening response with time while LM2 is statistically similar to 316L stainless
steel used as control. LM1 and LM2 have highly desirable mechanical properties
including low Young’s modulus, yield strengths double those of titanium alloys, and
elastic limits 5-10 times greater than crystalline metals.
A2.2 Introduction
Bulk metallic glasses, BMG, are relatively new highly elastic materials with high
hardness, high strength, and low modulus [1-3]. BMG are alloys composed of mixtures
of elements that frustrate crystallization pathways sufficiently that samples greater than
1mm in all dimensions can be cast completely amorphous. Unlike crystalline materials
which have periodic arrangements of atoms or molecules, the atoms of glasses solidify
into a random structure. Crystalline materials have much higher theoretical strengths
than are ever observed in nature. This is because all crystals have defects, and the defects
dramatically weaken the material. Glasses, on the other hand, have near theoretical

A2.3
properties because the structure is random and atom-size defects are nonexistent. A
commercially available BMG called Vitreloy1 or LM1 with composition
Zr62.6Ti11.0Cu13.2Ni9.8Be3.4 (weight percent) is of particular interest to the BMG
community because of its exceptional glass forming ability (parts with sections >1 inch
thickness can be cast) and good mechanical properties [4]. LM1 has a tensile yield stress
of ~ 1.9 GPa and a Vicker’s hardness of ~ 600 Kg/mm2 (double that of 316L stainless
steel). It has an elastic limit of 2% (10 times greater than most crystalline metals) and a
Young’s modulus of ~ 90GPa (less than half the value of 316L stainless steel and 20%
lower than titanium alloys) [5]. The disadvantage of LM1 is that it fails catastrophically
if the yield strength is exceeded. Such stresses would never be observed in biological
environments, but efforts have been made to avoid the catastrophic failure mode.
Another commercially available alloy, LM2 (Zr71.9Ti9.2Cu6.2Ni4.6Be1.6Nb6.5), is a
composite material with a glassy matrix and soft crystalline inclusions that absorb energy
when failure initiates, allowing for graceful failure and plastic elongation of up to 5% in
tension [6]. This material yields at 1.4 GPa. Both LM1 and LM2 have been studied in
fatigue loading conditions and values ranging from 60 MPa - 700 MPa at 107 cycles have
been reported, so no conclusive statements can be made about the fatigue endurance limit
[7-9]. This, along with corrosion fatigue characterization, is an area where more research
is needed.
In the simplest approximation, cytotoxicity can be thought of as a corrosion
problem [10]. Given the high cytotoxicity of metallic salt forms of nickel, copper and
beryllium [11], it may seem surprising that a material containing all three would be tested
for biocompatibility. However, due to the high corrosion resistance of these alloys, both

A2.4
LM1 and LM2 performed as well as the negative control in a wide range of in vitro and
in vivo tests. Zr based BMG exhibit excellent corrosion resistance in saline
environments. In a study conducted by Morrison et al., a Zr based BMG was shown to
have corrosion resistance higher than 316L stainless steel and comparable to CoCrMo
and Ti-6Al-4V in a saline environment [12].
A2.3 Experimental Method
Biological testing was performed by AppTec Laboratory Services or Louisiana
State University Health Sciences Center Department of Orthopaedics. Studies were
conducted in compliance with U.S. Good Laboratory Practice (GLP) regulations set forth
in 40 CFR Part 160, 40 CFR Part 792, or 21 CFR Part 58. Samples obtained from
Liquidmetal Technologies were either chemically sterilized or sterilized with steam. All
extractions to obtain leachable materials from LM1 and LM2 were performed while
maintaining the ratio of 60cm2 to 20mL.
Samples for in vitro and in vivo tests were produced by Liquidmetal
Technologies. >99% pure elements were melted under an inert argon atmosphere in a
water cooled crucible and cast into plates or rods. The amorphous nature of the material
was verified using X-ray spectroscopy. The material was cut and polished into
specimens with the dimensions and surface finish specified by AppTec Laboratory
Services or Louisiana State University Health Sciences Center Department of
Orthopaedics.
A2.4 Preliminary Tests and Results
The cytotoxicity of both materials was assessed using two different methods set
forth in ISO10993-5. In one study, LM1 and LM2 were extracted in Eagle’s Minimal

A2.5
Essential Medium (E-MEM), supplemented with 5% (v/v) Fetal Bovine Serum (FBS) and
one or more of the following: L-glutamine, HEPES, gentamicin, penicillin, vancomycin,
and Fungizone at 37 ± 1 °C and 5 ± 1% CO2 for 24 hours. A ratio equivalent of 60.0cm2
test article and 20mL E-MEM + 5% FBS was maintained in the extraction process. L929
mouse fibroblast cells obtained from ViroMed Laboratories, Inc., Minnetonka, MN, were
grown and used as monolayers in disposable tissue culture labware at 37 ± 1 °C and 5 ±
1% CO2. After the extraction period, the maintenance culture media was removed from
the test culture wells and replaced with test media/extract and control media. Positive
and intermediate controls were media spiked with CdCl2 and negative control was normal
media. All samples were tested in triplicate and cultures were evaluated for cytotoxic
effects by microscopic observation after 24, 48, and 72 hour incubation periods at 37 ± 1
°C and 5 ± 1% CO2. Positive control showed nearly complete destruction of the cell
layer. Intermediate control showed no extensive cell lysis or empty areas between cells,
but 20 - 50% of cells were round and devoid of intracytoplasmic granules. Negative
control, LM1 and LM2 showed no reactivity. In the other study, leachable extracts were
allowed to diffuse through an agarose barrier and contact cultured cells. The agar was
composed of 1% agarose, 1X E-MEM, and 5% FBS + supplements listed in the first
study. The maintenance media was removed from the L929 cells cultured as in the first
study and it was replaced with the agar mixture. The cultures were held at room
temperature until the agarose solidified, and the test material was placed directly onto the
agar surface for 1 hour and incubated as in the first study. At the completion of the
incubation period the perimeter of the test articles was outlined in indelible ink and then
removed. All cultures were flooded with 0.01% neutral red stain, incubated for 1 hour

A2.6
and then observed microscopically. LM1, LM2 and the negative control, dram vial cap,
showed no detectible zone under or around specimen, and the positive control, Davol
Penrose Drain Tubing, showed definitive cytotoxic effects in a zone greater than 1cm
beyond the edge of the specimen.
The propensity of the materials to cause mutation was determined by three
methods outlined in ISO 10993-3. The first test was conducted on five strains of
Salmonella typhimurium. The positive and negative controls behaved as expected and
saline extracts of LM1 and LM2 showed no statistically significant tendency to induce
histidine (his) reversion in S. typhimurium (his- to his+) caused by base changes or
frameshift mutations in the genome of tester organisms.
The second test, conducted on L5178Y mouse lymphoma cells, determines the
ability of a test article to induce forward mutation at the thymidine kinase (TK) locus in
the presence of trifluorothymidine (TFT). TK is an enzyme that allows cells to salvage
thymidine from the surrounding medium for DNA synthesis. If the thymidine analog
TFT is included in the growth medium, the analog will be phosphorylated via the TK
pathway and will cause cellular death by inhibiting DNA synthesis. Cells which are
heterozygotes at the TK locus (TK+/-) may undergo a single-step forward mutation to the
TK-/- genotype in which little or no TK activity remains. These mutants are as viable as
the heterozygotes in normal medium because DNA synthesis proceeds by de novo
synthesis pathways that do not involve thymidine as an intermediate. TK-/- mutants
cannot utilize toxic analogs of thymidine. Cells which may grow to form colonies in the
presence of TFT are therefore assumed to have mutated, either spontaneously or as a
result of exposure to the test article, at the TK+/- locus. Neither test article extract (either

A2.7
with or without metabolic activation) induced appreciable differences in cell density
throughout the expression and recovery period as compared to the concurrent negative
control.
The third test was an in vivo mouse micronucleus assay. The Mouse
Micronucleus Assay evaluated the potential of 0.9% sodium chloride for injection
(saline) and cottonseed oil (CSO) extracts of the test article to induce in vivo clastogenic
events or damage to the mitotic spindle in polychromatic erythrocytes obtained from
mouse bone marrow of CD-1 mice.
Male and female CD-1 mice were treated with one of the test article extracts, or
negative or positive controls. Twenty-four and forty-eight hours after treatment, the
animals were sacrificed and the bone marrow harvested. All negative control treated
preparations demonstrated normal levels of spontaneously occurring aberrations while
positive control treated cultures demonstrated dramatic, dose-dependant increases in
aberrant cells. None of the mice treated with the test article preparations exhibited overt
signs of toxicity either immediately post-treatment or during the induction period. The
levels of micronucleated cells were within normal negative ranges. Based on the criteria
and conditions outlined in the study protocol, the results indicate that the test article is
non-mutagenic in this test system.
Hemolytic activity of LM1 and LM2 was investigated by placing the metals in
direct contact with New Zealand White Rabbit blood for 1 hour, removing the test article,
centrifuging, and analyzing the absorbance of the supernatant at 545nm using a standard
laboratory spectrophotometer. LM1 and LM2 showed the same hemolytic activity as

A2.8
isotonic saline and are therefore considered non-hemolytic under the test conditions
employed.
In a test where isotonic saline extracts were injected intravenously into Specific
Pathogen Free New Zealand White Rabbits, body temperature was measured at 30
minute intervals for 3 hours and no evidence of pyrogenicity was found.
Allergic reactions and evidence of edema or erythema induced by direct contact
with the metal or injection/contact with extracts were tested according to three methods
detailed in ISO 10993-10. In one study adult Hartley strain guinea pigs had topical
applications of isotonic saline extracts and direct contact with the material on shaved
regions of their back for 24 hours as well as intradermal injections in the back of extracts
of LM1, LM2, and positive chlorodinitrobenzene and negative 316L stainless steel
controls. Edema and erythema were evaluated at 24, 48, and 72 hours after treatment.
LM1, LM2, and 316L stainless steel elicited no visible skin edema or erythema while the
positive control showed deep lesions at the same stages validating the methodology.
LM1 and LM2 showed no allergic potential in either bulk or extracted form. In the
second and third tests specific Pathogen Free New Zealand White Rabbits were tested. In
the second test, rabbits were treated with isotonic saline extracts of LM1 and LM2
applied via gauze patches to the flank for four hours and no local irritation or
sensitization was observed. In the third test, isotonic saline and cottonseed oil extracts of
LM1 and LM2 were injected intradermally into the backs of the rabbits. No local
irritation in the dermal tissues of the rabbits was observed at 24, 48, or 72 hours.
An ISO10993-11 Test for Systemic Toxicity was also performed. In this test
Specific Pathogen Free Albino Swiss Mice were injected intravenously with saline

A2.9
extracts of LM1, LM2, or were injected intraperitoneally with cottonseed oil extracts of
the materials. Control injections were saline and cottonseed oil with no extract.
Extraction was performed at 37 °C for 72 hours and dosage was 0.05mL/g. Body weight
and general health were evaluated at 4, 24, 48, and 74 hours. Based on the observations
it was concluded that LM1 and LM2 do not contain leachable materials that cause toxic
effects as a result of a single-dose injection in mice.
Given the promising results of these in vitro and in vivo short term trials, a one
year implantation study in 21 Specific Pathogen Free New Zealand White Rabbits was
done to test for local effects after implantation.
A2.5 Long Term Implantation Study
The tissue response to polished and bead blasted samples of LM1 and LM2 was
compared to the control material, 316L stainless steel (SST) by implanting specimens
into specific pathogen free New Zealand White Rabbits.
Twenty-one specific pathogen free New Zealand White Rabbits were purchased
from Harlan World Headquarters, Indianapolis, IN. Animals of both sexes were used.
This test method and species have historically been used to assess systemic safety in
determining the biocompatibility of materials used in medical devices. The animal
species, number and route of test article administration were as recommended in ISO
10993-6:1995.
Each animal was anesthetized with a 50+5 mg/kg Ketamine/Xylazine cocktail,
according to SOP-0001. At the initial injection, a 0.1 mg/kg of acepromazine was added.
Subsequently a surgical plane of anesthesia was maintained by injections of 50 mg/kg of
Ketamine. Sterilized cylindrical implants of the two test materials and stainless steel

A2.10
controls were implanted into the paraspinal musculature and distal femora of 21 New
Zealand White Rabbits using sterile surgical technique according to SOP-0012. Each
animal received two types of implants – one test material on the left side and a different
one on the right side. The total number of implants per animal was 12: four in the right
and four in the left paravertebral musculature, and two unicortal implants placed into
each femur. Paravertebral implants were cylindrical in shape, 3mm diameter x 10mm
length. Bone implants were also cylindrical in shape, 2mm diameter x 7mm length.
All animals survived the implantation procedures and through to their planned
sacrifice time with no major complications. Animals were followed postoperatively daily
for two weeks and then at a minimum of bi-weekly until their sacrifice date. Animals
were sacrificed at 3, 6 and 12 month intervals. At the time of sacrifice, blood was
withdrawn for complete blood counts and chemical analysis. Part of the liver and one
kidney were retrieved for histological examination and were observed for gross evidence
of abnormalities. Implants in both muscle and bone were retrieved for histological
examination with some surrounding tissue. Tissues were observed for gross evidence of
rejection such as necrosis, cysts or extended granulation tissues. Histologically, muscle
and bone implants were evaluated and graded according to the criteria listed in Table
A2.1. Transcribed results from the histological evaluations and blood chemistry and
CBC are included in the supplementary materials section.
Gross examination of the implants and surrounding tissues revealed no overt signs
of rejection such as cysts or necrosis and no gross evidence of local inflammation. The
only significant findings were three muscle implants that had migrated to the fatty tissues.
One of these was surrounded by hemorrhage without overt inflammation or necrosis.

A2.11
Additionally, one bony implant was placed on the proximal tibia rather than the distal
femur due to technical error. All retrieved kidneys and livers appeared grossly normal.
The histological data regarding bone implants show no fibrosis, degeneration or
inflammatory reaction with direct apposition of bone on all three materials, and
remodeling to partially or completely surround the implant. As is shown in the statistical
analyses in Tables A2.2 - A2.7, these responses had no association with the implanted
material. Thus for all materials, excellent compatibility with bone is in evidence.
Statistical analysis of the implant local reaction data were performed using non-
parametric methods (Kruskal-Wallis); statistically significant post-hoc Student Neuman
Keuls comparisons are reported where appropriate (i.e., where there is significant main
effect and a post-hoc result with statistical significance). All evaluations are performed at
a 0.05 significance.
The histological data regarding muscle implants show what appears to be
evolving tissue responses. Histological examination showed stable encapsulation of
muscle implants with minimal to mild intracapsular inflammation for all materials, but
adverse response to the LM1 test material was greater than the control material at 6 and
12 months. Statistical analyses were performed on the results of the histologic analysis
of the slides. The first stage of the analyses shown in Tables A2.2 - A2.7 examines the
effect of materials at each time interval.
Because there were significant effects on muscle implants of fibrosis thickness,
intracapsular inflammation, degeneration, extracapsular inflammation grade and distance
at the 12 month time period, interaction analyses (multi-way analysis of variance) were
performed to assess combined effects on the materials (SST, LM1, LM2), finish

A2.12
(polished, bead blasted), and time post-implantation (3, 6, 12 months). Statistically
significant post-hoc Student Neuman Keuls comparisons are reported where appropriate
(i.e., when there is a significant main effect and a post-hoc result with statistical
significance). Similarly, interaction trends are described where significant in Tables A2.8
– A2.12.
The results of this study suggest that LM2 creates a local tissue response that is
essentially similar to that of the control material. LM1 creates a local tissue response that
is substantially greater than that of the control material. Although local tissue responses
of LM1 were within the mild category, trends indicated that local degeneration would
continue to evolve through the one year endpoint for this material.
A2.6 Conclusion
High strength Zr based Be bearing BMG and composite materials show good
evidence of biocompatibility despite the presence of Cu, Ni, and Be. This is attributed to
the high corrosion resistance of Zr based BMG. In short term in vitro and in vivo trials,
LM1 and LM2 elicited biological responses similar to control materials. Only in the long
term implantation study were statistically significant differences apparent. It was found
that, independent of surface finish, LM2 creates a local tissue response similar to 316L
stainless steel. LM1, however, creates a mild response worse than either SST or LM2
that appears to be increasing with time. When the compositions of LM1 and LM2 are
compared, one will note that LM2 contains about half the Cu, Ni, and Be as is found in
LM1 and additionally LM2 contains Nb. The data collected in these studies does not
indicate which elements caused the most adverse effects, but the decrease of Cu, Ni, Be,
and/or the addition of Nb improved the local tissue response to the material LM2. Given

A2.13
the excellent mechanical properties of these materials and the good biocompatibility in
evidence here, LM1 and LM2 may find utility as biomaterials in the future.
Appendix 2 References
[1] A.L. Greer, E. Ma, MRS Bull. 32 (2007) 611. [2] W.L. Johnson, MRS Bull. 24 (1999) 42. [3] A. Inoue, Acta. Mater. 48 (2000) 279. [4] A. Peker, W.L. Johnson, Appl. Phys. Lett. 63 (1993) 2342. [5] J. Black, Biological Performance of Materials: Fundamentals of Biocompatibility,
fourth ed., CRC Press, Taylor & Francis Group, Florida, 2006, pp. 127-129. [6] C.C. Hays, C.P. Kim, W.L. Johnson, Phys. Rev. Lett. 84 (2000) 2901. [7] K.M. Flores, W.L. Johnson, R.H. Dauskardt, Scripta Mater. 49 (2003) 1181. [8] B.C. Menzel, R.H. Dauskardt, Scripta Mater. 55 (2006) 601. [9] G.Y. Wang, P.K. Liaw, A. Peker, B. Yang, M.L. Benson, W. Yuan, W.H. Peter,
L. Huang, M. Freels, R.A. Buchanan, C.T. Liu, C.R. Brooks, Intermetallics 13 (2005) 429.
[10] G.L. Burke, Can. Med. Assoc. J., Aug (1940) 125. [11] A. Yamamoto, R. Honma, M. Sumita, J. Biomed. Mater. Res. 39 (1998) 331. [12] M.L. Morrison, R.A. Buchanan, R.V. Leon, C.T. Liu, B.A. Green, P.K. Liaw, J.A.
Horton, J. Biomed. Mater. Res. 74A (2005) 430.

A2.14
Table A2.1: Muscle and bone implant histological grading criteria. Parameter Grade Description
0 None 1 < 1/3 circumference 2 1/3 < 1/2 circumference 3 1/2 < 3/4 circumference 4 > 3/4 circumference
Fibrosis
Thickness (μm) 0 None 1 1-5 cells/high powered field 2 6-10 cells/high powered field 3 11-25 cells/high powered field 4 26-50 cells/high powered field
Intracapsular Inflammation
5 > 50 cells/high powered field None None Mild Minimal changes - nuclear pyknosis and/or minimal loss of
striation Moderate Nuclear karryorhexix/karyolysis and/or extensive loss of striation
Degeneration
Severe Coagulation necrosis None None Mild Focal, interfascicular and/or intermyocyte Moderate Multifocal, interfascicular and/or intermyocye
Fatty Infiltration
Severe > 3/4 Circumferential, interfascicular and/or intermyocyte 0 None 1 1-5 cells/high powered field 2 6-10 cells/high powered field 3 11-25 cells/high powered field 4 26-50 cells/high powered field 5 > 50 cells/high powered field
Extracapsular Inflammation
Distance (μm) inclusive from implant interface None None Mild Focal, unicellular histiocytes or < 5 cell aggregates Moderate Multifocal, unicellular histiocytes or > 5 cell aggregates
Granulomatous Inflammation
Severe Shees of histiocytes and/or foreign body giant cells None None - cortical hole present with or without periosteal lining Minimal Focal osteoblastic/osteoclastic activity with < 1/3 encasement of
the implant and/or cortex resorption Moderate 1/3 - 1/2 encasement of the implant and/or cortex resorption
Bone Remodeling
Extensive > 1/2 encasement of the implant and/pr cortex resorption No No evidence of necrosis Necrosis Yes Nuclear debris and/or capillary wall breakdown

A2.15
Table A2.2: 3 Month Muscle Implants: Significance of Material Type vs Parameter.
Parameter P-value Significant Post Hocs (if applicable)
Grade 0.368 N/A Fibrosis Thickness 0.093 N/A
Intracapsular Inflammation 0.075 N/A Degeneration 0.155 N/A Fatty Infiltration 0.553 N/A
Grade 0.227 N/A Extracapsular Inflammation Distance 0.146 N/A Granulomatous Inflammation 0.138 N/A Necrosis (none observed) N/A
Table A2.3: 3 Month Bone Implants: Significance of Material Type vs Parameter.
Parameter P-value Significant Post Hocs (if applicable)
Grade (none observed) N/A Fibrosis Thickness (none observed) N/A
Inflammation (none observed) N/A Degeneration (none observed) N/A Granulomatous Inflammation (none observed) N/A Bone Remodeling 0.955 N/A Necrosis (none observed) N/A
Table A2.4: 6 Month Muscle Implants: Significance of Material Type vs Parameter.
Parameter P-value Significant Post Hocs (if applicable)
Grade 0.360 N/A Fibrosis Thickness 0.108 N/A
Intracapsular Inflammation 0.010 LM1>SST Degeneration 0.560 N/A Fatty Infiltration 0.331 N/A
Grade 0.136 N/A Extracapsular Inflammation Distance 0.242 N/A Granulomatous Inflammation (none observed) N/A Necrosis 0.643 N/A

A2.16
Table A2.5: 6 Month Bone Implants: Significance of Material Type vs Parameter.
Parameter P-value Significant Post Hocs (if applicable)
Grade (none observed) N/A Fibrosis Thickness (none observed) N/A
Inflammation (none observed) N/A Degeneration (none observed) N/A Granulomatous Inflammation (none observed) N/A Bone Remodeling 0.153 N/A Necrosis (none observed) N/A
Table A2.6: 12 Month Muscle Implants: Significance of Material Type vs Parameter.
Parameter P-value Significant Post Hocs (if applicable)
Grade 0.091 N/A Fibrosis Thickness 0.0485 LM1>LM2
Intracapsular Inflammation 0.003 LM1>SST; LM1>LM2 Degeneration 0.018 LM1>SST; LM1>LM2 Fatty Infiltration 0.061 N/A
Grade 0.003 LM1>SST; LM1>LM2 Extracapsular Inflammation Distance 0.0002 LM1>SST; LM1>LM2 Granulomatous Inflammation (none observed) N/A Necrosis 0.145 N/A
Table A2.7: 12 Month Bone Implants: Significance of Material Type vs Parameter.
Parameter P-value Significant Post Hocs (if applicable)
Grade (none observed) N/A Fibrosis Thickness (none observed) N/A
Inflammation (none observed) N/A Degeneration (none observed) N/A Granulomatous Inflammation (none observed) N/A Bone Remodeling 0.460 N/A Necrosis (none observed) N/A

A2.17
Table A2.8: Fibrosis Thickness Interaction Analysis: Muscle Implants by Time, Finish, and Material.
Post Hoc Factor P-value (Or Interaction Tendencies) Material 0.336 N/A Finish 0.137 N/A Time 0.886 N/A Material * Finish 0.471 N/A Material * Time 0.129 N/A Finish * Time 0.764 N/A Material * Finish * Time 0.428 N/A
Table A2.9: Intracapsular Inflammation Interaction Analysis: Muscle Implants by Time, Finish, and Material.
Post Hoc Factor P-value (Or Interaction Tendencies) Material 0.0001 LM1>SST; LM1>LM2 Finish 0.041 Bead Blasted > Polished Time 0.046 12 months > 3 months Material * Finish 0.167 N/A Material * Time 0.001 LM1 increases with time Finish * Time 0.386 N/A Material * Finish * Time 0.797 N/A
Table A2.10: Degeneration Interaction Analysis: Muscle Implants by Time, Finish, and Material.
Post Hoc Factor P-value (Or Interaction Tendencies) Material 0.885 N/A Finish 0.026 Bead Blasted > Polished Time 0.866 N/A Material * Finish 0.894 N/A Material * Time 0.006 LM1 increases; SST decreases Finish * Time 0.644 N/A Material * Finish * Time 0.039 Material and finish affect time response

A2.18
Table A2.11: Extracapsular Inflammation Grade Interaction Analysis: Muscle Implants by Time, Finish, and Material.
Post Hoc Factor P-value (Or Interaction Tendencies) Material 0.0003 LM1>SST; LM1>LM2 Finish 0.0027 Bead Blasted > Polished Time 0.404 N/A Material * Finish 0.063 N/A Material * Time 0.088 N/A Finish * Time 0.356 N/A Material * Finish * Time 0.878 N/A
Table A2.12: Extracapsular Inflammation Distance Interaction Analysis: Muscle Implants by Time, Finish, and Material.
Post Hoc Factor P-value (Or Interaction Tendencies) Material 0.340 N/A Finish 0.048 Bead Blasted > Polished Time 0.209 N/A Material * Finish 0.429 N/A Material * Time 0.359 N/A Finish * Time 0.204 N/A Material * Finish * Time 0.445 N/A

Supplementary Materials for Appendix 2
A2.19

Par
amet
erR
ef. L
owR
ef. H
igh
Rab
bit I
D#
B-5
1B
-71
B-5
1B
-52
B-5
3B
-54
B-5
5B
-56
B-5
7B
-58
B-5
9B
-60
B-6
1B
-62
B-6
3B
-64
B-6
5B
-66
B-6
7B
-68
B-6
9B
-70
B-7
1G
luco
se74
148
123
248
127
251
136
138
139
169
209
174
273
201
143
151
167
175
138
176
132
163
136
AS
T33
9910
1910
1415
154
1117
2018
6432
6920
3432
1219
2530
17A
LT25
6527
2317
2318
3514
2824
4946
1946
2152
3525
4531
3426
Alk
. Pho
spha
tase
1086
2218
1023
23**
*22
3252
5518
5741
3348
4162
4841
5938 5291
63118311
809473
4421439
03422834
55159745
8470774
32016481
74712172
11516161
76410021
)K
PC( k
C Tota
l Bili
rubi
n0.
20.
50.
10.
20.
10.
10.
10.
40.
10.
10.
10.
10.
10.
10.
10.
10.
10.
10.
10.
10.
10.
10.
1To
tal P
rote
in5
7.5
5.3
55.
65.
55.
69.
85.
75.
65.
95.
45.
35.
75.
15.
25
5.4
55.
24.
84.
94.
9A
lbum
in2.
75
4.4
4.2
4.6
4.5
4.3
8.8
4.5
4.3
4.6
4.3
4.3
4.6
44.
24.
14.
34.
14.
44
4.1
4.2
Glo
bulin
1.5
2.7
0.9
0.8
11
1.3
11.
21.
31.
31.
11
1.1
1.1
10.
91.
10.
90.
80.
80.
80.
7C
hole
ster
ol10
100
3628
2146
2235
118
1325
1624
3854
2456
4388
3342
4641
Ure
a N
itrog
en5
2518
2021
2220
2118
2120
2220
1719
1724
2225
2021
2534
Cre
atin
ine
0.5
2.6
1.1
1.2
1.1
1.1
1.2
1.3
1.2
0.9
0.9
0.9
0.9
0.9
0.9
1.2
1.5
1.4
1.2
1.2
1.4
1.3
1.4 4.31
6.317.31
3.318.21
2.418.31
1.412.31
4.414.31
412.41
7.3141
4.2141
2.416.41
5.312.41
muiclaC P
hosp
horu
s4
62.
63.
63
4.2
3.2
6.4
33.
14
3.1
3.5
3.1
33.
14.
14.
44
3.7
2.9
4.1
4.3
Sod
ium
125
150
141
139
141
142
141
121
141
144
142
143
142
144
140
143
141
143
143
143
142
142
140
Pot
assi
um3.
77
5.9
76.
96.
95.
915
***
5.8
4.6
4.6
4.6
4.4
4.2
4.5
4.7
4.5
4.9
5.7
5.2
4.7
6.3
5.9
Chl
orid
e92
120
101
100
102
9810
394
101
105
100
9910
098
102
105
101
104
104
108
105
103
103 1.82
9.6282
6.527.62
3.121.42
6.329.42
2.823.92
8.928.62
7.625.13
6.215.72
9.429.32
5.729.62
2O
CT8.41
4.817.31
6.4181
6.224.02
1.916.71
221.71
8.818.91
9.613.41
4.924.61
6222
5.8191
paG noin
A Ery
thro
cyte
s5.
36.
85.
756.
136.
635.
716.
185.
636.
116.
655.
916.
486.
595.
955.
395.
616.
396.
454.
656.
325.
655.
75.
03H
omog
lobi
n9.
814
12.9
1414
.613
.412
.912
.713
.514
.212
.513
.714
.513
.813
.112
.213
.413
.510
.912
.911
.612
11.2 3.53
3.732.63
9.934.23
8.146.04
7.532.83
9.0434
1.146.73
6.249.83
4.635.73
1.835.14
1.046.63
tircotame
H MC
V60
6963
.865
.562
.566
.960
.764
.763
.764
63.6
63.5
66.2
68.7
70.8
61.4
63.6
64.3
69.6
63.2
6465
.470
.1M
CH
1923
22.4
22.9
2223
.520
.922
.622
21.4
21.2
21.1
2223
.224
.321
2120
.923
.420
.420
.521
.122
.3M
CH
C31
3535
.134
.935
.235
.234
.535
34.6
33.3
33.2
33.3
33.7
33.7
34.3
34.2
3332
.333
.632
.332
32.2
31.7
Pla
tele
ts15
865
027
239
630
441
439
214
933
727
527
722
122
615
319
017
432
035
332
426
428
530
334
2 3.52.5
2.55.5
5.57.5
2.51.5
9.53.6
6.57.5
1.67.5
62.6
6.56.6
3.63.5
6nietor
P amsal
P PC
V34
4338
4042
3839
3440
4235
3942
4038
3738
4032
3935
3735
Tota
l Leu
cocy
tes
5.1
9.7
6.9
4.9
5.4
5.5
7.9
7.6
7.8
7.5
7.3
7.3
8.6
8.2
7.7
7.6
6.6
5.3
10.7
3.9
2.8
9.9
8.1
Het
erop
hils
(%)
2546
2824
3323
2732
3367
4128
3826
3847
3425
4625
3014
30Ly
mph
ocyt
es (%
)39
6865
6963
7369
6165
2855
6959
7257
4959
6551
7361
7965
Mon
ocyt
es (%
)1
97
63
21
70
33
34
23
43
52
24
64
Bas
ophi
ls (%
)2
50
10
13
02
21
00
02
04
51
05
11
htnoM 3
htnoM 6
htnoM 21
Spec
ific
Path
ogen
Fre
e N
ew Z
eala
nd W
hite
Rab
bit B
lood
Che
mis
try
and
CB
C
A2.20

ID# OrganInflamma-
tionFatty
ChangesAcute Tubular
Necrosis Comment51 Kidney 0 --- 051 Liver 0 1 --- 152 Kidney 0 --- 052 Liver 0 0 ---53 Kidney 0 --- 053 Liver 0 0 ---54 Kidney 0 --- 054 Liver 0 1 ---55 Kidney 0 --- 055 Liver 0 0 ---56 Kidney 0 --- 056 Liver 0 0 ---57 Kidney 0 --- 057 Liver 0 0 ---58 Kidney 0 --- 058 Liver 0 1 ---59 Kidney 0 --- 059 Liver 0 1 ---60 Kidney 0 --- 060 Liver 0 1 ---61 Kidney 0 --- 061 Liver 0 0 ---62 Kidney 0 --- 062 Liver 0 2 ---63 Kidney 0 --- 063 Liver 0 1 ---64 Kidney 0 --- 064 Liver 0 0 ---65 Kidney 0 --- 065 Liver 2 0 ---66 Kidney 0 --- 066 Liver 0 0 ---67 Kidney 0 --- 067 Liver 0 0 ---68 Kidney 0 --- 068 Liver 1 1 ---69 Kidney 0 --- 069 Liver 0 0 ---70 Kidney 0 --- 070 Liver 0 0 --- 271 Kidney 0 --- 0 371 Liver 0 0 ---
Comment 1 Fatty change in the liver was minimal andaround the portal vein/venule regions
2 Mild autolytic changes3 Frequent deposits of dystrophic calcification in
cortical distal tubule. Significance unknown
All Animals Histology Data - Liver and Kidney
A2.21

Rab
bit I
DS
lide
IDM
ater
ial
Fini
shIn
flam
ma-
tion
Deg
ener
-at
ion
Fatty
Infil
tratio
nG
ranu
lom
atou
sIn
flam
mat
ion
Bon
eR
emod
elin
gN
ecro
sis
Com
men
tG
rade
Thic
knes
s65
BR
-1LM
1P
olis
hed
00
00
00
20
65B
R-2
LM1
Bea
d B
last
ed0
00
00
02
065
BL-
131
6-L
Pol
ishe
d0
00
00
03
065
BL-
231
6-L
Bea
d B
last
ed0
00
00
00
066
BR
-1LM
1P
olis
hed
00
00
00
10
66B
R-2
LM1
Bea
d B
last
ed0
00
00
01
066
BL-
131
6-L
Bea
d B
last
ed0
00
00
00
066
BL-
231
6-L
Pol
ishe
d0
10
00
00
67B
R-1
LM2
Bea
d B
last
ed0
00
00
01
067
BR
-2LM
2P
olis
hed
00
00
00
00
67B
L-1
316-
LP
olis
hed
00
00
00
10
67B
L-2
316-
LB
ead
Bla
sted
00
00
00
30
68B
R-1
LM2
Pol
ishe
d0
00
00
00
068
BR
-2LM
2B
ead
Bla
sted
01
00
00
068
BL-
131
6-L
Pol
ishe
d0
00
00
00
068
BL-
231
6-L
Bea
d B
last
ed0
10
00
00
69B
R-1
LM1
Pol
ishe
d0
00
00
00
069
BR
-2LM
1B
ead
Bla
sted
00
00
00
10
69B
L-1
LM2
Bea
d B
last
ed0
00
00
00
069
BL-
2LM
2P
olis
hed
00
00
00
00
70B
R-1
LM1
Bea
d B
last
ed0
00
00
00
070
BR
-2LM
1P
olis
hed
00
00
00
10
70B
L-1
LM2
Bea
d B
last
ed0
00
00
01
070
BL-
2LM
2P
olis
hed
00
00
00
20
71B
R-1
LM1
Bea
d B
last
ed0
00
00
00
071
BR
-2LM
1P
olis
hed
00
00
00
00
71B
L-1
LM2
Pol
ishe
d0
00
00
03
071
BL-
2LM
2B
ead
Bla
sted
00
00
00
20
Com
men
t1
Rec
ut re
ques
ted
on o
rigin
al s
ampl
es -
no im
prov
ed v
isua
lizat
ion
on re
cut n
oted
Fibr
osis
3 M
onth
Sac
rific
e H
isto
logy
Dat
a - B
one
Sam
ples
A2.22

Rab
bit I
DS
lide
IDM
ater
ial
Fini
shIn
traca
psIn
flam
mD
egen
er-
atio
nFa
ttyIn
filtra
tion
Gra
nulo
mat
ous
Infla
mm
atio
nN
ecro
sis
Com
men
tecnatsi
Dedar
GssenkcihT
edarG
65M
R-1
LM1
Pol
ishe
d0
00
00
00
00
65M
R-2
LM1
Bea
d B
last
ed1
110
02
00
00
65M
R-3
LM1
Pol
ishe
d4
117
00
10
00
065
MR
-4LM
1B
ead
Bla
sted
172
10
14
116
00
265
ML-
131
6-L
Pol
ishe
d4
320
02
00
00
65M
L-2
316-
LB
ead
Bla
sted
48
00
10
00
065
ML-
331
6-L
Pol
ishe
d2
90
00
00
00
65M
L-4
316-
LB
ead
Bla
sted
13
00
10
00
066
MR
-1LM
1P
olis
hed
461
00
10
00
066
MR
-2LM
1B
ead
Bla
sted
333
00
00
00
066
MR
-3LM
1P
olis
hed
242
00
10
00
066
MR
-4LM
1B
ead
Bla
sted
415
32
02
385
00
66M
L-1
316-
LB
ead
Bla
sted
00
00
00
00
066
ML-
231
6-L
Pol
ishe
d3
260
00
00
00
66M
L-3
316-
LB
ead
Bla
sted
415
70
11
00
00
66M
L-4
316-
LP
olis
hed
167
MR
-1LM
2B
ead
Bla
sted
336
00
10
00
067
MR
-2LM
2P
olis
hed
00
00
10
00
067
MR
-3LM
2B
ead
Bla
sted
479
10
11
210
00
67M
R-4
LM2
Pol
ishe
d4
206
00
21
620
03
67M
L-1
316-
LP
olis
hed
15
00
20
00
067
ML-
231
6-L
Bea
d B
last
ed0
00
01
00
00
67M
L-3
316-
LP
olis
hed
211
00
10
00
067
ML-
431
6-L
Bea
d B
last
ed4
852
01
210
50
068
MR
-1LM
2B
ead
Bla
sted
168
MR
-2LM
2P
olis
hed
117
00
00
00
068
MR
-3LM
2B
ead
Bla
sted
125
81
12
112
10
03
68M
R-4
LM2
Pol
ishe
d4
291
20
22
161
00
468
ML-
131
6-L
Bea
d B
last
ed3
260
00
00
00
68M
L-2
316-
LP
olis
hed
412
00
40
00
068
ML-
331
6-L
Bea
d B
last
ed1
90
02
00
00
68M
L-4
316-
LP
olis
hed
321
00
20
00
069
MR
-1LM
1B
ead
Bla
sted
122
00
00
00
069
MR
-2LM
1P
olis
hed
00
00
10
00
069
MR
-3LM
1B
ead
Bla
sted
123
61
02
120
000
05
69M
R-4
LM1
Pol
ishe
d0
00
02
00
00
Fibr
osis
Ext
raca
psul
arIn
flam
mat
ion
3 M
onth
Sac
rific
e H
isto
logy
Dat
a - M
uscl
e Sa
mpl
es
A2.23

69M
L-1
LM2
Pol
ishe
d3
118
10
10
00
069
ML-
2LM
2B
ead
Bla
sted
313
10
01
00
00
69M
L-3
LM2
Pol
ishe
d1
69M
L-4
LM2
Bea
d B
last
ed4
261
21
42
4000
10
670
MR
-1LM
1P
olis
hed
00
00
10
00
070
MR
-2LM
1B
ead
Bla
sted
00
00
20
00
070
MR
-3LM
1B
ead
Bla
sted
271
00
20
00
070
MR
-4LM
1P
olis
hed
426
00
10
00
070
ML-
1LM
2B
ead
Bla
sted
00
00
30
00
070
ML-
2LM
2P
olis
hed
00
00
10
00
070
ML-
3LM
2B
ead
Bla
sted
341
00
20
00
070
ML-
4LM
2P
olis
hed
437
00
10
00
071
MR
-1LM
1B
ead
Bla
sted
313
00
22
202
00
771
MR
-2LM
1P
olis
hed
49
00
10
00
071
MR
-3LM
1B
ead
Bla
sted
00
00
20
00
071
MR
-4LM
1P
olis
hed
00
00
20
00
071
ML-
1LM
2P
olis
hed
00
00
10
00
071
ML-
2LM
2B
ead
Bla
sted
216
00
10
00
071
ML-
3LM
2P
olis
hed
243
10
10
00
071
ML-
4LM
2B
ead
Bla
sted
422
001
13
210
02
08
Com
men
t1
Rec
ut re
ques
ted
on o
rigin
l sam
ples
- no
impr
oved
vis
ualiz
atio
n on
recu
t not
ed2
Chr
onic
(lym
phoc
ytes
& p
lasm
a ce
lls) i
ntra
and
ext
raca
psul
ar in
flam
mat
ion
in o
ne s
mal
l foc
us3
Chr
onic
infla
mm
atio
n4
Chr
onic
infla
mm
atio
n w
ith ra
re e
osin
ophi
ls5
Foca
l fib
rosi
s ex
tend
ing
2 m
m in
to ti
ssue
6Fi
bros
is e
xten
sa7
Chr
onic
infla
mm
atio
n fo
cal
8Tr
ansf
orm
atio
n in
to b
one
cont
aini
ng m
arro
w
A2.24

Rab
bit I
DS
lide
IDM
ater
ial
Fini
shIn
flam
ma-
tion
Deg
ener
-at
ion
Fatty
Infil
tratio
nG
ranu
lom
atou
sIn
flam
mat
ion
Bon
eR
emod
elin
gN
ecro
sis
Com
men
tG
rade
Thic
knes
s58
BR
-1LM
1P
olis
hed
00
00
00
10
58B
R-2
LM1
Bea
d B
last
ed0
00
00
01
058
BL-
131
6-L
Pol
ishe
d0
00
00
01
058
BL-
231
6-L
Bea
d B
last
ed0
00
00
02
059
BR
-1LM
1P
olis
hed
00
00
00
30
59B
R-2
LM1
Bea
d B
last
ed0
00
00
02
059
BL-
131
6-L
Bea
d B
last
ed0
00
00
02
059
BL-
231
6-L
Pol
ishe
d0
00
00
00
060
BR
-1LM
2B
ead
Bla
sted
00
00
00
00
60B
R-2
LM2
Pol
ishe
d0
00
00
00
060
BL-
131
6-L
Pol
ishe
d0
00
00
00
060
BL-
231
6-L
Bea
d B
last
ed0
00
00
00
061
BR
-1LM
2P
olis
hed
00
00
00
10
61B
R-2
LM2
Bea
d B
last
ed0
00
00
00
061
BL-
131
6-L
Pol
ishe
d0
00
00
02
061
BL-
231
6-L
Bea
d B
last
ed0
00
00
02
062
BR
-1LM
1P
olis
hed
00
00
00
30
62B
R-2
LM1
Bea
d B
last
ed0
00
00
03
062
BL-
1LM
2B
ead
Bla
sted
00
00
00
30
62B
L-2
LM2
Pol
ishe
d0
00
00
03
063
BR
-1LM
1B
ead
Bla
sted
00
00
00
30
63B
R-2
LM1
Pol
ishe
d0
00
00
01
063
BL-
1LM
2B
ead
Bla
sted
00
00
00
10
63B
L-2
LM2
Pol
ishe
d0
00
00
01
064
BR
-1LM
1B
ead
Bla
sted
00
00
00
10
64B
R-2
LM1
Pol
ishe
d0
00
00
02
064
BL-
1LM
2P
olis
hed
00
00
00
20
64B
L-2
LM2
Bea
d B
last
ed0
00
00
01
0
Fibr
osis
6 M
onth
Sac
rific
e H
isto
logy
Dat
a - B
one
Sam
ples
A2.25

Rab
bit I
DS
lide
IDM
ater
ial
Fini
shIn
traca
psIn
flam
mD
egen
er-
atio
nFa
ttyIn
filtra
tion
Gra
nulo
mat
ous
Infla
mm
atio
nN
ecro
sis
Com
men
tecnatsi
Dedar
GssenkcihT
edarG
58M
R-1
LM1
Pol
ishe
d0
00
01
00
00
58M
R-2
LM1
Bea
d B
last
ed3
90
00
00
00
58M
R-3
LM1
Pol
ishe
d3
146
10
00
00
058
MR
-4LM
1B
ead
Bla
sted
00
00
20
00
058
ML-
131
6-L
Pol
ishe
d4
80
01
00
00
58M
L-2
316-
LB
ead
Bla
sted
39
00
00
00
058
ML-
331
6-L
Pol
ishe
d2
146
00
20
00
058
ML-
431
6-L
Bea
d B
last
ed0
00
20
00
00
59M
R-1
LM1
Pol
ishe
d0
00
00
00
00
59M
R-2
LM1
Bea
d B
last
ed4
161
40
10
00
02
59M
R-3
LM1
Pol
ishe
d0
00
03
00
00
59M
R-4
LM1
Bea
d B
last
ed4
112
50
03
650
03
59M
L-1
316-
LP
olis
hed
00
00
10
00
059
ML-
231
6-L
Bea
d B
last
ed0
00
02
00
00
59M
L-3
316-
LP
olis
hed
482
00
10
00
059
ML-
431
6-L
Bea
d B
last
ed3
110
01
00
00
60M
R-1
LM2
Pol
ishe
d4
152
20
20
00
04
60M
R-2
LM2
Bea
d B
last
ed0
00
01
00
00
60M
R-3
LM2
Pol
ishe
d2
170
02
00
00
60M
R-4
LM2
Bea
d B
last
ed0
00
02
00
00
60M
L-1
316-
LP
olis
hed
413
10
03
00
00
60M
L-2
316-
LB
ead
Bla
sted
00
00
10
00
060
ML-
331
6-L
Pol
ishe
d3
220
02
00
00
60M
L-4
316-
LB
ead
Bla
sted
413
00
30
00
061
MR
-1LM
2B
ead
Bla
sted
421
93
03
243
00
561
MR
-2LM
2P
olis
hed
28
00
00
00
061
MR
-3LM
2B
ead
Bla
sted
00
00
10
00
061
MR
-4LM
2P
olis
hed
00
00
10
00
061
ML-
131
6-L
Bea
d B
last
ed0
00
02
00
00
61M
L-2
316-
LP
olis
hed
00
00
00
00
061
ML-
331
6-L
Bea
d B
last
ed3
90
01
151
00
61M
L-4
316-
LP
olis
hed
413
00
00
00
06
62M
R-1
LM1
Bea
d B
last
ed0
00
00
00
00
62M
R-2
LM1
Pol
ishe
d4
123
20
00
00
04
62M
R-3
LM1
Bea
d B
last
ed4
102
20
02
310
04
62M
R-4
LM1
Pol
ishe
d4
188
71
05
20
5
Fibr
osis
Ext
raca
psul
arIn
flam
mat
ion
6 M
onth
Sac
rific
e H
isto
logy
Dat
a - M
uscl
e Sa
mpl
es
A2.26

62M
L-1
LM2
Pol
ishe
d4
892
00
00
00
62M
L-2
LM2
Bea
d B
last
ed3
682
02
00
00
62M
L-3
LM2
Pol
ishe
d3
714
12
461
01
862
ML-
4LM
2B
ead
Bla
sted
18
00
30
00
063
MR
-1LM
1P
olis
hed
411
10
00
00
00
63M
R-2
LM1
Bea
d B
last
ed4
481
02
00
00
463
MR
-3LM
1P
olis
hed
149
00
10
00
063
MR
-4LM
1B
ead
Bla
sted
314
21
02
113
00
04
63M
L-1
LM2
Bea
d B
last
ed1
63M
L-2
LM2
Pol
ishe
d4
140
02
00
00
63M
L-3
LM2
Pol
ishe
d0
00
02
00
00
63M
L-4
LM2
Bea
d B
last
ed1
422
00
262
00
464
MR
-1LM
1P
olis
hed
461
00
20
00
064
MR
-2LM
1B
ead
Bla
sted
433
00
23
300
09
64M
R-3
LM1
Pol
ishe
d1
64M
R-4
LM1
Bea
d B
last
ed4
3000
10
22
2000
00
1064
ML-
1LM
2P
olis
hed
341
00
20
00
064
ML-
2LM
2B
ead
Bla
sted
362
00
30
00
064
ML-
3LM
2P
olis
hed
164
ML-
4LM
2B
ead
Bla
sted
328
00
00
00
0C
omm
ent
1R
ecut
requ
este
d on
orig
inl s
ampl
es -
no im
prov
ed v
isua
lizat
ion
on re
cut n
oted
2C
hron
ic (m
ainl
y pl
asm
a ce
lls) i
nfla
mm
atio
n3
Chr
onic
infla
mm
atio
n m
ainl
y ly
mph
ocyt
es4
Chr
onic
infla
mm
atio
n5
Chr
onic
infla
mm
atio
n in
tra %
ext
raca
psul
ar -
acut
e in
flam
mat
ion
intra
caps
ule
6O
ne fo
cus
chro
nic
infla
mm
atio
n7
Mix
ed in
flam
mat
ion
8M
ixed
infla
mm
atio
n ly
mph
s &
neu
troph
ils &
few
eos
inop
hils
9Fo
cal c
hron
ic10
Chr
onic
infla
mm
atio
n fo
cal e
xten
sion
of c
apsu
le fi
bros
is
A2.27

Rab
bit I
DS
lide
IDM
ater
ial
Fini
shIn
flam
ma-
tion
Deg
ener
-at
ion
Fatty
Infil
tratio
nG
ranu
lom
atou
sIn
flam
mat
ion
Bon
eR
emod
elin
gN
ecro
sis
Com
men
tG
rade
Thic
knes
s51
BR
-1LM
1P
olis
hed
00
00
00
20
51B
R-2
LM1
Bea
d B
last
ed1
51B
L-1
316-
LP
olis
hed
00
00
00
30
51B
L-2
316-
LB
ead
Bla
sted
00
00
00
10
52B
R-1
LM1
Pol
ishe
d0
00
00
03
052
BR
-2LM
1B
ead
Bla
sted
00
00
00
10
52B
L-1
316-
LB
ead
Bla
sted
00
00
00
10
52B
L-2
316-
LP
olis
hed
00
00
00
10
53B
R-1
LM2
Bea
d B
last
ed0
00
00
01
053
BR
-2LM
2P
olis
hed
00
00
00
20
53B
L-1
316-
LP
olis
hed
00
00
00
20
53B
L-2
316-
LB
ead
Bla
sted
00
00
00
20
54B
R-1
LM2
Pol
ishe
d0
00
00
03
054
BR
-2LM
2B
ead
Bla
sted
00
00
00
30
54B
L-1
316-
LP
olis
hed
00
00
00
20
54B
L-2
316-
LB
ead
Bla
sted
255
BR
-1LM
1P
olis
hed
00
00
00
10
55B
R-2
LM1
Bea
d B
last
ed0
00
00
03
055
BL-
1LM
2B
ead
Bla
sted
00
00
00
10
55B
L-2
LM2
Pol
ishe
d0
00
00
01
056
BR
-1LM
1B
ead
Bla
sted
00
00
00
30
56B
R-2
LM1
Pol
ishe
d0
00
00
03
056
BL-
1LM
2B
ead
Bla
sted
00
00
00
10
56B
L-2
LM2
Pol
ishe
d0
00
00
01
057
BR
-1LM
1B
ead
Bla
sted
357
BR
-2LM
1P
olis
hed
00
00
00
10
57B
L-1
LM2
Pol
ishe
d0
00
00
01
057
BL-
2LM
2B
ead
Bla
sted
00
00
00
20
Com
men
t1
Reo
rient
2Im
prop
erly
orie
nted
3P
artia
l spe
cim
en, i
ncom
plet
e - (
spec
imen
bro
ke u
pon
impl
ant r
emov
al R
VB
)
Fibr
osis
12 M
onth
Sac
rific
e H
isto
logy
Dat
a - B
one
Sam
ples
A2.28

Rab
bit I
DS
lide
IDM
ater
ial
Fini
shIn
traca
psIn
flam
mD
egen
er-
atio
nFa
ttyIn
filtra
tion
Gra
nulo
mat
ous
Infla
mm
atio
nN
ecro
sis
Com
men
tecnatsi
Dedar
GssenkcihT
edarG
51M
L-1
316-
LP
olis
hed
252
00
10
00
051
ML-
231
6-L
Bea
d B
last
ed0
490
01
00
00
51M
L-3
316-
LP
olis
hed
222
00
00
00
051
ML-
431
6-L
Bea
d B
last
ed1
110
00
00
00
51M
R-1
LM1
Bea
d B
last
ed2
210
01
00
00
51M
R-2
LM1
Pol
ishe
d1
80
02
00
00
51M
R-3
LM1
Bea
d B
last
ed4
108
00
10
00
051
MR
-4LM
1P
olis
hed
317
00
10
00
052
ML-
131
6-L
Pol
ishe
d3
610
02
00
00
52M
L-2
316-
LB
ead
Bla
sted
339
00
20
00
052
ML-
331
6-L
Pol
ishe
d1
240
00
00
00
52M
L-4
316-
LB
ead
Bla
sted
411
60
01
00
00
252
MR
-1LM
1P
olis
hed
418
85
12
535
00
03
52M
R-2
LM1
Bea
d B
last
ed3
602
01
220
00
452
MR
-3LM
1P
olis
hed
410
32
00
00
00
452
MR
-4LM
1B
ead
Bla
sted
326
00
10
00
053
ML-
131
6-L
Bea
d B
last
ed3
700
02
00
00
53M
L-2
316-
LP
olis
hed
043
00
10
00
053
ML-
331
6-L
Bea
d B
last
ed3
180
00
00
00
53M
L-4
316-
LP
olis
hed
326
00
00
00
053
MR
-1LM
2P
olis
hed
310
00
00
00
053
MR
-2LM
2B
ead
Bla
sted
18
00
10
00
053
MR
-3LM
2P
olis
hed
317
00
10
00
053
MR
-4LM
2B
ead
Bla
sted
218
00
10
00
054
ML-
131
6-L
Pol
ishe
d3
810
01
00
00
54M
L-2
316-
LB
ead
Bla
sted
418
41
02
00
00
554
ML-
331
6-L
Pol
ishe
d4
215
20
10
00
06
54M
L-4
316-
LB
ead
Bla
sted
322
20
12
00
07
54M
R-1
LM2
Bea
d B
last
ed3
330
01
00
00
54M
R-2
LM2
Pol
ishe
d3
120
01
00
00
54M
R-3
LM2
Bea
d B
last
ed3
180
01
00
00
54M
R-4
LM2
Pol
ishe
d3
190
00
00
00
55M
L-1
LM2
Bea
d B
last
ed3
531
03
10
00
55M
L-2
LM2
Pol
ishe
d3
290
00
00
00
55M
L-3
LM2
Bea
d B
last
ed1
310
00
00
00
55M
L-4
LM2
Pol
ishe
d1
310
00
00
00
Fibr
osis
Ext
raca
psul
arIn
flam
mat
ion
12 M
onth
Sac
rific
e H
isto
logy
Dat
a - M
uscl
e Sa
mpl
es
A2.29

55M
R-1
LM1
Pol
ishe
d4
102
00
10
00
055
MR
-2LM
1B
ead
Bla
sted
180
52
15
193
01
855
MR
-3LM
1P
olis
hed
221
00
10
00
055
MR
-4LM
1B
ead
Bla
sted
431
05
12
526
10
19
56M
L-1
LM2
Pol
ishe
d3
560
01
00
00
56M
L-2
LM2
Bea
d B
last
ed1
260
00
00
00
56M
L-3
LM2
Pol
ishe
d4
118
00
10
00
056
ML-
4LM
2B
ead
Bla
sted
411
73
01
40
00
1056
MR
-1LM
1B
ead
Bla
sted
430
45
12
518
90
011
56M
R-2
LM1
Pol
ishe
d4
173
20
11
240
012
56M
R-3
LM1
Bea
d B
last
ed4
238
40
13
600
012
56M
R-4
LM1
Pol
ishe
d3
270
01
00
00
57M
L-1
LM2
Pol
ishe
d1
410
00
00
00
57M
L-2
LM2
Bea
d B
last
ed4
610
01
00
00
57M
L-3
LM2
Pol
ishe
d2
440
00
00
00
57M
L-4
LM2
Bea
d B
last
ed3
190
00
00
00
57M
R-1
LM1
Pol
ishe
d4
892
01
10
00
57M
R-2
LM1
Bea
d B
last
ed4
166
30
02
240
012
57M
R-3
LM1
Pol
ishe
d2
210
01
00
00
57M
R-4
LM1
Bea
d B
last
ed1
Com
men
t1
Rec
ut2
Hem
orrh
age
in fa
t aro
und
caps
ule
3M
ixed
infla
mm
atio
n (e
spec
ially
per
ivas
cula
r). D
iffus
e an
d pr
edom
inan
tly ly
mph
ocyt
ic4
Foca
l chr
onic
infla
mm
atio
n in
a th
icke
ned
caps
ular
regi
on5
Intra
caps
ular
infla
mm
atio
n pr
edom
inan
tly ly
mph
ocyt
es, h
owev
er o
ccas
iona
l neu
troph
ils (~
1 hi
gh p
ower
fiel
d) is
iden
tifie
dTh
e in
flam
mat
ion
is lo
cate
d in
the
thic
kest
par
t of t
he c
apsu
le6
Chr
onic
infla
mm
atio
n - f
ocal
and
loca
ted
in th
ick
part
of fi
bros
is7
Foca
l chr
onic
infla
mm
atio
n lo
cate
d pe
rivas
cula
r in
extra
caps
ular
regi
on a
nd a
djac
ent c
apsu
le8
Mar
ked,
diff
use
chro
nic
infla
mm
atio
n in
volv
ing
entir
e ci
rcum
fere
nce
9M
ixed
acu
te/c
hron
ic in
flam
mat
ion
foca
lly10
Foca
l mix
ed in
flam
mat
ion
in a
regi
on o
f cap
sule
thic
keni
ng11
Chr
onic
infla
mm
atio
n, d
iffus
e an
d as
soci
ated
with
thic
k ca
psul
ar re
gion
s12
Foca
l chr
onic
infla
mm
atio
n
A2.30

A3.1
Appendix 3 - Corrosion and Corrosion Fatigue of Vitreloy Glasses Containing Low
Fractions of Late Transition Metals
The text and figures of this appendix draw heavily on a paper submitted and under
review in Scripta Materialia entitled “Corrosion and Corrosion Fatigue of Vitreloy
Glasses Containing Low Fractions of Late Transition Metals.” The authors are A. Wiest,
G.Y. Wang, L.Huang, S. Roberts, M.D. Demetriou, P.K. Liaw, and W.L. Johnson.
Corrosion resistance and fatigue performance of Vitreloy glasses with low fractions
of late transition metals (LTM) in 0.6M NaCl are investigated and compared to a
traditional Vitreloy glass and other crystalline alloys. Low LTM Vitreloy glasses exhibit
1/10 the corrosion rates of the other alloys. Corrosion fatigue performance of present
alloys is found to be <10% of their yield strength at 10^7 cycles. The poor corrosion
fatigue performance of the present alloys is likely due to low fracture toughness of the
passive layer.
Owing to the lack of long range order in their atomic structure and the absence of
microscopic defects such as vacancies, dislocation, or grain boundaries that typically
arise in crystalline microstructures, bulk metallic glasses (BMG) demonstrate a unique
combination of mechanical properties, such as high strength, high hardness, and a high
elastic strain limit [1-4]. The lack of electrochemically active sites, provided by the
absence of microstructural defects, has long been thought to give rise to exceptional
resistance to corrosion and chemical attack. Some BMG alloys based on noble metals
indeed demonstrate superb corrosion resistance [5], however, the resistance to corrosion
is not universally high for all BMG alloys. Zr based BMG of the Vitreloy alloy family

A3.2
were found to exhibit corrosion resistance in saline solutions higher than most crystalline
engineering metals, however on par with the most advanced corrosion resistant metals.
For example, the corrosion resistance of ZrTiNiCuAl glass (Vitreloy 105) in phosphate
buffered saline (PBS) was found to be on par or slightly lower than widely used metallic
biomaterials such as stainless steels, Ti-6Al-4V, and CoCrMo [6]. Despite the generally
good corrosion behavior of Vitreloy type BMG, their behavior in stress corrosion
environments, specifically cyclic stress (fatigue) corrosion environments, is rather poor.
The stresses at which Vitreloy type BMG endure 107 cycles in saline solutions was found
to be just 10 - 20% of their corresponding values in air [7,8]. We investigate the
corrosion and corrosion fatigue behavior of certain Vitreloy alloy variants in a 0.6M
saline environment (simulated sea water) and contrast it to traditional Vitreloy alloys and
other metals used in marine applications. We demonstrate that small variations in the
Vitreloy alloy composition can lead to dramatic improvements in corrosion resistance.
The improvement in corrosion resistance, however, is not accompanied by an analogous
improvement in corrosion fatigue endurance, thereby revealing that the two processes are
controlled by different physical mechanisms.
A series of Vitreloy type BMG compositions with low atomic fractions of LTM have
recently been reported [9]. Many of these alloys were found to exhibit a combination of
exceptionally large supercooled liquid region (SCLR) and good glass forming ability.
Notable examples include the ternary Zr35Ti30Be35 and quaternary Zr35Ti30Be29Co6, with
SCLR of 120 °C and 150 °C and critical casting thicknesses of 6mm and 15mm,
respectively. Owing to the low LTM atomic fractions, these compositions were thought
to also exhibit good corrosion characteristics. The corrosion and corrosion fatigue

A3.3
behavior of Zr35Ti30Be35 and Zr35Ti30Be29Co6 is investigated here, and is contrasted to
Zr52.5Cu17.9Ni14.6Al10Ti5, a traditional Vitreloy alloy (Vit105) with a much higher LTM
atomic fraction. The measured values are also contrasted to three traditional metallic
alloys used in sea water environments: 18/8 stainless steel, Monel (Cu-Ni-based), and
Alclad (Al-based) [10].
Alloys Zr35Ti30Be35 and Zr35Ti30Be29Co6 were prepared by arc melting elements of
>99.9% purity on a water cooled Cu plate in Ti-gettered argon atmosphere. 3mm
diameter amorphous rods of Zr35Ti30Be29Co6 and 2mm diameter amorphous rods of
Zr35Ti30Be35 were cast using an Edmund Buhler mini arc melter suction casting setup.
The amorphous nature of the rods was verified using X-ray diffraction and differential
scanning calorimetry (DSC).
Cyclic anodic polarization experiments were conducted on unloaded samples of
Zr35Ti30Be35 and Zr35Ti30Be29Co6 in 0.6M NaCl solution at a scan rate of 0.167 mV/s.
Data for Vit 105 was gathered from the study of Morrison et al. [7]. Epit, the pitting
potential, and Ecorr, the steady state corrosion potential, were measured multiple times for
each sample. In between measurements, samples were polished with 1200 grit sandpaper
in order to remove the reaction layer. Corrosion rates were calculated from corrosion
current density measurements. A more detailed description of the experimental method
can be found in [6-7]. The averaged cyclic anodic polarization curves for the three alloys
are presented in Figure A3.1. Average Epit and Ecorr values for each alloy along with
corrosion rates are tabulated in Table A3.1.

A3.4
Current Density [A/cm2]
Cyclic Anodic Polarization
Volta
ge [V
]
10-9 10-8 10-7 10-6 10-5 10-4 10-3 10-2 10-1 100
0
0.1
0.2
0.3
0.4
-0.1
-0.2
-0.3
-0.4
-0.5
Zr35Ti30Be35
Zr35Ti30Be35Co6
Zr52.5Cu17.9Ni14.6Al10Ti5
Figure A3.1: Cyclic anodic polarization curves of Zr52.5Cu17.9Ni14.6Al10Ti5, Zr35Ti30Be29Co6, and Zr35Ti30Be35 in 0.6M NaCl solution at a scan rate of 0.167 mV/s.
Table A3.1: Data for corrosion and corrosion fatigue in 0.6M NaCl. Fatigue values are the stress amplitudes at which the samples endured 107 loading cycles normalized by the material yield strength. The yield strengths of Zr35Ti30Be35, Zr35Ti30Be29Co6, and Zr52.5Cu17.9Ni14.6Al10Ti5 are 1850 MPa [22], 1800 MPa [22], and 1700 MPa [7], respectively. Corrosion data for 18/8 Stainless Steel, annealed Monel, and Alclad 24S-T are taken from [10], while data for fatigue in air and 0.6M NaCl are taken from [11-15].
Ecorr [mV]
Epit [mV]
corrosion rate [μm per year]
Fatigue (Air) [% strength]
Fatigue (0.6M NaCl) [%strength]
Zr35Ti30Be35 -445±42 84.5±23.5 0.871 ±.266 27% 8% Zr35Ti30Be29Co6 -424±8 257±64 0.544 ±.215 28% 6% Zr52.5Cu17.9Ni14.6Al10Ti5 -264 324 29±6 25% 6% 18/8 Stainless Steel 13 25% 15% Monel - Annealed 15.2 40% 35% Alclad 24S-T 11.2 20% 10%
Fatigue and corrosion fatigue measurements were conducted on 3mm diameter x
6mm tall rods of Zr35Ti30Be29Co6 and 2mm diameter x 4mm tall rods of Zr35Ti30Be35 in a
compression-compression loading geometry at 10 Hz using a stress ratio

A3.5
R = smin/smax = 0.1. For Vit 105, four-point bending fatigue and corrosion fatigue data
from the study of Morrison et al. [7] were utilized. Even though compression-
compression and four-point bending fatigue experiments often result in somewhat
different endurance limits, the relative drop in the endurance limits between air and saline
environments, which is of interest here, is not expected to be dramatically different in the
two tests. The S/N curves for the three alloys in air and saline environments are
presented in figure A3.2. The ratio of fatigue limit to yield stress in air and in saline
solution for the three BMG are listed in Table A3.1. Data for 18/8 stainless steel, Alclad
24S-T and Monel taken from Atlas of Fatigue Curves and other sources [11-15] are also
displayed in Table A3.1.
0
100
200
300
400
500
600
700
800
Cycles to Failure (NF)
104 105 106 107
Stre
ss A
mpl
itude
(MPa
)St
ress
Am
plitu
de (M
Pa)
0.6M NaCl
Air
Figure A3.2: Fatigue performance in air ( Zr52.5Cu17.9Ni14.6Al10Ti5, Zr35Ti30Be29Co6, and Zr35Ti30Be35) and in 0.6M NaCl (Δ Zr52.5Cu17.9Ni14.6Al10Ti5, Zr35Ti30Be29Co6, and Zr35Ti30Be35) at a frequency of 10 Hz and R = 0.1. Zr52.5Cu17.9Ni14.6Al10Ti5 is tested in four-point bending geometry (data taken from [9]). Zr35Ti30Be29Co6 and Zr35Ti30Be35 are tested in compression-compression geometry (present study).

A3.6
Analysis of the cyclic anodic polarization data, presented in figure A3.1, reveals that
the pitting potential of Vit 105 is the greatest, followed by Zr35Ti30Be29Co6 and
Zr35Ti30Be35. This suggests that the Zr35Ti30Be35 is the most susceptible and
Zr52.5Cu17.9Ni14.6Al10Ti5 the least susceptible to attack by pitting in 0.6M NaCl. However,
the corrosion current densities of the alloys with low LTM fraction are approximately
two orders of magnitude lower than Zr52.5Cu17.9Ni14.6Al10Ti5 in the range between Ecorr
and Epit. A higher corrosion current density naturally leads to a higher corrosion rate.
The corrosion rate of Vit 105 in 0.6M NaCl is reported to be 29 ≤ 6μm/yr [7]. By
contrast, the corrosion rates of Zr35Ti30Be29Co6 and Zr35Ti30Be35 in the same solution and
under the same conditions were measured in this study to be 0.5 ≤ 0.2μm/yr and 0.9 ≤
0.3μm/yr, respectively. These rates are lower than that of Zr52.5Cu17.9Ni14.6Al10Ti5 by
factors of ~150 °C and ~30 °C, respectively. Corrosion rates for 18/8 stainless steel,
Alclad 24S-T, and annealed Monel in sea water are reported to be 13, 11.2 and
15.9μm/yr, respectively [10]. These rates are slightly lower than that of Vit 105, but
more than an order of magnitude higher than the rates of Zr35Ti30Be35 and
Zr35Ti30Be29Co6.
The results of fatigue testing differ markedly from the corrosion results. The tested
metallic glasses have similar yield strengths (1700 - 1800 MPa) and, as shown in Figure
A3.2, the fatigue values at 107 cycles are also very close in each environment given the
experimental scatter. In Table A3.1, fatigue values are presented as a fraction of the
material yield strength. It is interesting to observe how each material's fatigue strength,
at 107 cycles, diminishes in saline solution compared to air. The tested metallic glasses
retain 25 - 28% of their yield strength at 107 cycles in air, but drop to 6 - 8% of their yield

A3.7
strength in saline solution. Alclad also has a low strength in NaCl decreasing from 20%
to 10%. Similar to metallic glasses, steel exhibits 25% of its strength at 107 cycles in air,
but only drops to 15% in saline solution. Annealed Monel starts with a low yield
strength, but retains the largest fractions of its yield strength surviving 107 cycles at 40%
of its yield strength in air and 35% in saline solution.
Crack growth rates of traditional Vitreloy alloys undergoing cyclic loading in saline
solutions are found to approach 1μm/cycle at high stress intensities [8], a value
substantially higher than in air. Owing to the dramatically improved corrosion resistance
demonstrated by Zr35Ti30Be29Co6 and Zr35Ti30Be35 over the traditional Vit 105, one
would expect to observe an analogous improvement in corrosion fatigue endurance as
well. As seen in Table A3.1 however, no statistically significant improvement in
corrosion fatigue endurance is attained. This suggests that the corrosion resistance and
corrosion fatigue endurance of Vitreloy alloys are governed by distinctly different
mechanisms.
When exposed in a chemical environment, Zr, the base metal for Vitreloy glasses, is
known to rapidly form a passive layer several atomic distances thick that protects the
bulk of the material against chemical dissolution [16-17]. Likewise, glassy Vitreloy
alloys based on Zr also tend to passivate rapidly when exposed in chemical environments.
The thermodynamic and chemical stability of the formed passive layer controls the rate
of corrosion of these glasses and is known to be a measure of their overall corrosion
resistance [18-21]. Preliminary X-ray Photoelectron Spectroscopy (XPS) studies of
ZrTiBe alloys show a passive layer comprised of oxides of the base elements in ratios
similar to the bulk sample [22]. This layer is stable in NaCl solutions in stress free

A3.8
environments and protects the bulk sample from dissolution [20]. It is therefore
reasonable to assume that the improvement in corrosion resistance demonstrated by the
low LTM Vitreloy glasses (Zr35Ti30Be29Co6 and Zr35Ti30Be35) over traditional Vitreloy
glasses (Zr52.5Cu17.9Ni14.6Al10Ti5) is due to the low fraction or complete absence of late
transition metals such as Ni and Cu. The presence of late transition metals in Vitreloy
glasses is known to interfere with the formation of chemically stable passive layers. For
example, XPS studies of Vitreloy glasses containing Cu show that the surface
composition includes Cu compounds which are not as resistant to chemical attack [22].
Under stress (or cyclic stress) corrosion conditions however, the mechanical stability of
the passive layer is also important. Mechanical properties of the passive layer such as its
fracture strength and fracture toughness are critical in determining the structural integrity
of the layer under stress and the sustained protection of the material against chemical
dissolution. While the fracture strength and fracture toughness of the passive layer of
these alloys is not known, the ceramics ZrO2 and TiO2 have fracture strengths of 550
MPa and 52 MPa respectively, and fracture toughnesses of less than 10 MPa-m1/2 [23].
These low fracture strength and fracture toughness values suggest that the passive layer is
brittle and prone to cracking under low applied stresses.
Mechanical rupture of the passive layer can be expected to lead to severe chemical
attack concentrated at the extending crack tip. Indeed, stress assisted cracking or anodic
dissolution is identified to be the dominant mechanism of corrosion fatigue failure of
Vitreloy glasses [7-8, 24]. Hence independent of its chemical stability, a brittle passive
layer can lead to early corrosion fatigue failure despite its ability to protect against
corrosion in stress free environments. Therefore, the poor corrosion fatigue performance

A3.9
demonstrated by Zr35Ti30Be29Co6 and Zr35Ti30Be35, despite their superior corrosion
resistance in stress free environment, can be attributed to the formation of a passive layer
with high chemical stability but low fracture toughness.
In conclusion, the corrosion resistance and corrosion fatigue performance of low
LTM Vitreloy glasses Zr35Ti30Be29Co6 and Zr35Ti30Be35 in 0.6M NaCl were investigated
and compared to traditional Vitreloy glass Zr52.5Cu17.9Ni14.6Al10Ti5 and to other
crystalline engineering alloys used widely in saline environments such as 18/8 stainless
steel, Alclad 24S-T, and annealed Monel. The low LTM Vitreloy glasses were found to
exhibit corrosion rates of less than 1μm per year, which are lower by more than one order
of magnitude compared to the traditional Vitreloy glass and the conventional engineering
metals. The high corrosion resistance of the present alloys is attributed to the low
fraction or complete absence of LTM elements facilitating the formation of a chemically
stable passive layer. Despite their superb corrosion resistance, the corrosion fatigue
performance of Zr35Ti30Be29Co6 and Zr35Ti30Be35 is found to be rather poor, as less than
10% of their yield strength is retained at 107 cycles, a value comparable to traditional
Vitreloy glasses but significantly lower than conventional crystalline alloys. The poor
corrosion performance of the present alloys is likely due to the fracture toughness of the
passive layer being relatively low, providing little protection against chemical dissolution
after being fractured in a corrosive environment.
Valuable discussions with Dr. Vilupanur A. Ravi are gratefully acknowledged. This
work is supported by the NSF International Materials Institutes Program under DMR-
0231320, with Drs. C. Huber, U. Venkateswaran, and D. Finotello as contract monitors,
and by the Office of Naval Research under ONR06-251 0566-22.

A3.10
Appendix 3 References [1] A.L. Greer, E. Ma, MRS Bull. 32 (2007) 611. [2] W.L. Johnson, MRS Bull. 24 (1999) 42. [3] A. Inoue, Acta Mater. 48 (2000) 279. [4] W.L. Johnson, JOM 54 (2002) 40. [5] Y.F. Wu, W.C. Chiang, J. Chu, T.G. Nieh, Y. Kawamura, J.K. Wu, Mater. Lett.
60 (2006) 2416. [6] M.L. Morrison, R.A. Buchanan, R.V. Leon, C.T. Liu, B.A. Green, P.K. Liaw, J.A.
Horton, J. Biomed. Mater. Res. Part A 74A (2005) 430. [7] M.L. Morrison, R.A. Buchanan, P.K. Liaw, B.A. Green, G.Y. Wang, C.T. Liu,
J.A. Horton, Mater. Sci. Eng. A 467 (2007) 198. Correspondence with the Liaw group verified that the corrosion rate value is 29 ≤ 6μm/yr, not 29 ≤ 60μm/yr as reported.
[8] V. Schroeder, C.J. Gilbert, R.O. Ritchie, Mater. Sci. Eng. A 371 (2001) 145. [9] A. Wiest, G. Duan, M.D. Demetriou, L.A. Wiest, A. Peck, G. Kaltenboeck, B.
Wiest, W.L. Johnson, Acta Mater. 56 (2008) 2625. [10] C.V. Brouillette, Corrosion Rates in Sea Water at Port Hueneme, California, for
Sixteen Metals, AD81212 Armed Services Technical Information Agency, 1954. [11] H.E. Boyer, Atlas of Fatigue Curves, American Society for Metals, Ohio, 1986,
pp. 37-38, 66, 177-180, 319, 321, 327, 391-392. [12] H.W. Russell, L.R. Jackson, H.J. Grover, W.W. Beaver, Fatigue Strength and
Related Characteristics of Aircraft Joints, National Advisory Committee for Aeronautics Technical Note No. 1485, 1948.
[13] A.C. Bond, Fatigue Studies of 24S-T and 24S-T Alclad Sheet with Various Surface Conditions, Master’s Thesis, Georgia Institute of Technology, 1948.
[14] T.W. Crooker, R.E. Morey, E.A. Lange, Low Cycle Fatigue Crack Propagation Characteristics of Monel 400 and Monel K-500 Alloys, NRL Report 6218, 1965.
[15] Monel Alloy R-405, Technical Brochure, UNS N04405, www.specialmetals.com. [16] P.A. Schweitzer, Corrosion Engineering Handbook, Marcel Dekker, Inc., New
York, 1996, pp. 157-163, 195-252. [17] D.W. White Jr., J.E. Burke, The Metal Beryllium, The American Society for
Metals, Ohio, 1955, pp. 530-547. [18] K. Hashimoto, K. Asami, M. Naka, T. Masumoto, The Research Institute for Iron,
Steel and Other Metals 1694 (1979) 237. [19] K. Hashimoto, K. Asami, M. Naka, T. Masumoto, The Research Institute for Iron,
Steel and Other Metals 1695 (1979) 246. [20] S. Hiromoto, A.P. Tsai, M. Sumita, T. Hanawa, Corros. Sci. 42 (2000) 1651. [21] S. Hiromoto, A.P. Tsai, M. Sumita, T. Hanawa, Corros. Sci. 42 (2000) 2193. [22] Unpublished Work. [23] http://www.ceramics.nist.gov/srd/summary/ftmain.htm. [24] Y. Nakai, Y. Yoshioka, JSMS 3 (2009) 219.

A4.1
Appendix 4 – Derivations Derivation 1 - Fourier Heat Equation We begin with the Fourier heat equation.
Tat
tzyxU 2),,,(∇=
∂∂
Where U is the temperature of the sample at every point in space and time, is
a constant, and 2
2
2
2
2
22
zyx ∂∂
+∂∂
+∂∂
=∇ .
We could solve this equation for many geometries, but the simplest solution is for an infinite plane of material in the y, z directions with thickness L in the x direction. This reduces the problem to 1D and approximates a cast plate where the thickness is much smaller than the other two dimensions. The equation reduces to:
Ux
at
txU2
2),(∂∂
=∂
∂ . Boundary conditions 1. Let us assume that the temperature of the mold is absolute zero so U(0,t) = U(L,t)
= 0. This is a reasonable 0th order approximation if Tg >> Tmold where Tg is the glass transition temperature where the liquid material becomes a glass, and Tmold is the temperature of the mold.
2. Let us assume that the temperature of the material when it is cast into the mold at t = 0 is U(x,0) = TL or the liquidus temperature.
We must also assume that T(x,t) = T(t)X(x) so separation of variables applies. This gives
λ−==)()(''
)()('
xXxX
taTtT
The solutions for λ ≤ 0 force U = 0 and for λ > 0 we find
atAetT λ−=)(
and )cos()sin()( λλ xCxBxX += where Ln /πλ =
Applying boundary conditions gives
∑∞
=
−
⎟⎠⎞
⎜⎝⎛=
1
2
22
sin),(n
Latn
n eL
xnDtxUππ
Where π
ππn
nTdxL
xnTL
D L
L
Ln)cos(22sin2
0
−=⎟
⎠⎞
⎜⎝⎛= ∫
The critical cooling rate is the time required to cool the centerline to Tg.
aa a

A4.2
Critical cooling rate = U(L/2,t)=Tg.
2
22
2sin)cos(22
1
Latn
nLg en
nnTT
πππ
π −∞
=⎟⎠⎞
⎜⎝⎛−
= ∑
We can solve this for n = 1 for the first order approximation and find that
g
L
TT
aLt ln2
2
π=
The important message from this derivation is that the critical cooling rate goes like the thickness squared (L2).
Derivation 2 - Implications of Slope Change in Thermodynamic Variables Assume a slope change in the entropy S(T) or enthalpy H(T) of a material. Call the temperature where the slope change occurs Tg. We know from thermodynamics that
VV T
STc ⎟⎠⎞
⎜⎝⎛∂∂
= and PP
P TH
TSTc ⎟
⎠⎞
⎜⎝⎛∂∂
=⎟⎠⎞
⎜⎝⎛∂∂
=
If either H or S changes slope at Tg then
V
g
V
g
TTS
TTS
⎟⎟⎠
⎞⎜⎜⎝
⎛
∂
∂≠⎟
⎟⎠
⎞⎜⎜⎝
⎛
∂
∂ −+ )()( and
P
g
P
g
TTS
TTS
⎟⎟⎠
⎞⎜⎜⎝
⎛
∂
∂≠⎟
⎟⎠
⎞⎜⎜⎝
⎛
∂
∂ −+ )()(
and we would expect a discontinuous cV and cP. Similarly if the slope of P(T) changes at Tg then we would expect discontinuities in the compressibility. These slope changes are observed in glass forming liquids and the discontinuities in cP as measured in a DSC provide a way to determine the glass transition temperature. Derivation 3 - Stephan’s Equation for Parallel Plate Viscometer The viscosity equation for a parallel plate viscometer geometry is called Stefan’s Equation. It is solved fully in “Theory and Application of the Parallel Plate Plastometer” [G.J. Dienes, H.F. Klemm, J. Appl. Phys. 17 (1946) 458]. The derivation takes four journal pages and the basic strategy is given here. Begin with the equation of motion for a viscous fluid. Neglect body forces. Transform to cylindrical coordinates and consider a cylinder with height << radius. Assume no slippage at the plates and a parabolic flow front.

A4.3
General expression for motion of a Newtonian fluid of viscosity η neglecting body forces is
ρ dv→
dt+ρv→ Ë ı v→ = −ı p+ ηı2 v→ +
13
ηı ıË v→
assumingincompressibilityrequiresıË v→ = 0 assumingvelocityissmall weneglectρ v→ Ë ı v→
andareleftwith ρ
dv→
dt= −ı p+ η ı2 v→
In cylindrical coordinates we have three equations
ρ dvrdt
= −dρ
dr+ η ı2 vr
ρ dvθ
dt= −
1r
dρ
dθ+ η ı2 vθ
ρ dvzdt
= −dρ
dz+ η ı2 vz
The parallel plates are located at z = 0 and z = h circularsymmetryrequiresvθ =0 assumingashortsampleletsusassumevz∼0
assumingnoslippageandsteadystateflow means
vr Hz =0L =vr Hz= hL = 0anddvrdt
=0
ASSUMPTIONS ARE GREAT!!!!!! We are left with
dρ
dr= η
d2 vrdz2
Integrate twice and apply the boundary conditions
vr =
12 η
dpdr
Hz−hL z
considerflowthroughasurfaceelementrdθdz= rdθdzvr
U= flow perunitarclength= ‡
0
hvr z=
12 η
dpdr
‡0
hz2−zh z
U= −
h3
12 η dpdr
nextwelettheplatesmovetowardseachotheratarate
dhdt
avolumeelementrdrdθdzchangesvolumeataraterdrdθ
dhdt
since the fluid is incompressible the rate of decrease of volume must equal the outward flow rate. Thus,
−rdrdθ
dhdt
=∂
∂r Hrdθ UL dr→
12 η
h3 dhdt
r=∂
∂r Jr
∂ p∂r
N
Integrating and requiring that p is finite for r = 0 and p(r = R) = atmospheric pressure gives
p= −
3 η
h3 dhdt
IR2−r2M +1 atm

A4.4
We must balance the forces on the plate in steady state flow.
Downwardforceappliedtotop plate= F+‡
0
R1 atm∗ 2 π r r
Sampleappliesthisforceupwards = ‡
0
Rp2 π r r
Wearriveat F= −2 π
dhdt
3 η
h3 ‡0
RIR2 −r2Mr r
solving for the case where radius of plate (R) = radius of sample (a)we obtain
F= −
3 π ηa4
2h3 dhdt
Solving for the case where we assume the plates are larger than the diameter of the cylinder we are squishing and we find:
dtdh
hVF 5
2
23πη−
=
Where F is the applied force, η is the viscosity, V is the volume, h is the height, dh/dt is the time derivative of the height of the specimen which is assumed to be incompressible. Derivation 4 – Vogel-Fulcher-Tammann Viscosity Some liquids are observed to exhibit Arrhenius type behavior. This means that their flow properties as a function of temperature can be well described by
0
0
0)( TTT
eT −=ηη where η0 is the high temperature viscosity limit ≈ 10–5 Pa-s, and T0 is the temperature at which no flow occurs. Deviations from this behavior are observed for many liquids. The deviation usually results in a steeper drop of viscosity with temperature than the Arrhenius relationship predicts. This is called hyper-Arrhenius behavior. To allow for this, the Vogel-Fulcher-Tammann (VFT) fit to the viscosity data has a multiplier in the exponent as seen below.
0
0*
exp0TTTD
−∗
=ηη where D* is a fitting constant and η0 and T0 are defined as before. T0 is also called the VFT temperature. Derivation 5 - Viscosity of BMG from Potential Energy Landscape Perspective Flow of a metallic glass is described as barrier crossing events in “Rheology and Ultrasonic Properties of Metallic Glass-Forming Liquids” published in Materials Research Society Bulletin [W.L. Johnson, M.D. Demetriou, J.S. Harmon, M.L. Lind, K. Samwer, MRS Bull. 32 (2007) 644].

A4.5
A barrier to flow is argued to be a function of STZ volume (Ω(T, P)) and the energy barrier to shear flow of the STZ which is shear modulus (G(T, P)). The total barrier to flow is W~G*Ω. The barrier to flow at the glass transition temperature is Wg. Experimental data suggests that the contributions of the shear modulus and STZ volume barriers are similar and can be well represented by
W = W HG HTL, Ω HTLL = Wg ikjj TgTyzzn ikjj TgTyzzp
W∼Wg HTgêTL2 n
Taking the barrier crossing rate normalized by an attempt frequency to follow a Boltzmann distribution (equivalently, thermally activated hopping), one arrives at a viscosity law that takes the form
η
η∞= Exp@−WêkTD
Because these flow barriers give rise to the observed viscosity, The exponents are shown to be related to the fragility as follows.
m = H1+2 nL Log Hηgêη∞L
where
m =ikjjj ∂ Logη
∂ HTgêTLyzzzTg=T
and
Wg =kTg ln Hηgêη∞L.
We can combine terms
η
η∞= ExpA Wg
kT ikjjTgTyzz2 nE
LnA η
η∞E =
WgkT
ikjjTgTyzz2 n
solveforTg
LnA ηg
η∞E =
WgkTg
ikjjj TgTg
yzzz2 n
→ Wg = KTg LnAηg
η∞E pluggingbackin
LnA η
η∞E = LnA ηg
η∞E ikjj TgTyzz2 n+1
LogA η
η∞E =
LnA ηgη∞
E
Ln@10D ikjj TgTyzzmêLog Hηgêη∞L
If we let
A= Log Hηgêη∞L
we arrive at the expression
LogA η
η∞E =A
ikjj TgTyzzmêA

A4.6
LogA η
η∞E =A
ikjj TgTyzzmêA
Derivation 6 - Thermoplastic Formability Parameter Starting with the result of Derivation 5:
We integrate as shown in Figure A4.1 by oversimplifying BMG physics and assuming all BMG exhibit the same viscosity at Tx.
Figure A4.1: Thermoplastic formability parameter δ found by integrating as shown.
In reality, the square region may be different from alloy to alloy.
δ = ‡
TgêTx
1@A− Log Hηêη∞LD HTgêTL
δ = ‡
TgêTx
1AA−A
ikjjTgTyzzmêA
E HTgêTL
δ = A ikjj1−
TgTx
yzz −
A1+ m
A
A1−ikjj TgTx
yzz1+mêA
E
Squish data and correlation with δ are detailed in Figure A4.2.
Zr41.2Ti13.8Cu12.5Ni10Be22.5 Zr35Ti30Cu7.5Be27.5 Pt57.5Ni5.3Cu14.7P22.5Zr44Ti11Cu10Ni10Be25 Pd43Ni10Cu27P20
12.8mm 21.7mm 23.7mm 24.7mm 28.5mm
=0.15 =0.56 =0.48 =0.57 =0.86 Figure A4.2: Squish test data for 5 TPF candidate alloys shows δ is a decent predictor of TPF potential.

A4.7
Derivation 7 - Composition Counting To determine the number of compositions one must create for 1 - 5 element alloys assuming 5% composition steps. There is a constraint that the sum of the elements = 100.
One element: There is only one choice with 100% of that element.
Two elements: Give the alloys shown in Table A4.1.
Table A4.1: All possible two component compositions with 5% composition steps.
Alloy # 1 2 3 4 5 6 7 8 9 10 11 12 13 14 15 16 17 18 19 20 21
%elment1 100 95 90 85 80 75 70 65 60 55 50 45 40 35 30 25 20 15 10 5 0
%element2 0 5 10 15 20 25 30 35 40 45 50 55 60 65 70 75 80 85 90 95 100
We see 21 possible compositions. Three elements: This case is best thought of with a ternary phase diagram as shown in Figure A4.3. This can be drawn in 2D because of the constraint that the sum of the elements = 100. The alloy's composition is determined by drawing lines orthogonal to the corners. In the Ti corner, the alloy would have 100% Ti. Horizontal lines orthogonal to the Ti corner are drawn in 5% composition steps. The lines slanting downward are drawn orthogonal to the Be corner in 5% composition steps. Intersections of the lines form a grid in the triangle where the Zr composition = 100 – Ti – Be. There are 21 compositions along the bottom of the triangle going from the Be corner to the Zr corner with Ti = 0%. There are 20 compositions possible along the line Ti = 5% just above the bottom of the triangle. This continues until we reach the Ti corner with 1 possible composition. The total number of compositions is 21 + 20 + 19 + . . . + 2 + 1 = 231.
Figure A4.3: All possible three component compositions with 5% composition steps found at line intersections.
+ + + . . . +21 20 19
+2 1

A4.8
Four elements: This case is best approached with a quaternary phase diagram drawn in 3D because of the constraint as shown in Figure A4.4. In this case the phase diagram is an equilateral pyramid with compositions determined by a plane orthogonal to each corner. Instead of adding line elements, we add equilateral triangle elements as shown below. A table with the math is included after the 5 element analysis.
Figure A4.4: Four component phase diagram is an equilateral pyramid / tetrahedron. Five elements: This case can't be drawn and occupy a 4D phase diagram that is an equilateral hyperpyramid as shown in Figure A4.5. Instead of adding equilateral triangles for composition steps, we now add equilateral pyramid elements shrinking in size as shown below. The counting follows. Figure A4.5: Five component phase diagram is a 4D equilateral hyperpyamid.
+21 20
+ . . . + 2 1+
+21 20
+ . . . + 2 1+
4D ???

A4.9
The 3 element phase diagram compositions were counted using an additive factorial type function which we will define as !:.The combinatorics are shown in Table A4.2. 3 element = 21!: = 21 + 20 + 19 + . . . + 2 + 1 = 231 4 element = 21!: + 20!: + 19!: + . . . + 2!: + 1 = 1771 5 element = 4 element(21) + 4 element(20) + . . . + 4 element(2) + 1 = 10626
Table A4.2: Combinatorics for 3 - 5 element alloys.
21 2020
1919
1918
1818
1817
1717
1717
1616
1616
1616
1515
1515
1515
1514
1414
1414
1414
1413
1313
1313
1313
1313
1212
1212
1212
1212
1212
1111
1111
1111
1111
1111
1110
1010
1010
1010
1010
1010
109
99
99
99
99
99
99
88
88
88
88
88
88
88
77
77
77
77
77
77
77
76
66
66
66
66
66
66
66
65
55
55
55
55
55
55
55
55
44
44
44
44
44
44
44
44
44
33
33
33
33
33
33
33
33
33
32
22
22
22
22
22
22
22
22
22
21
11
11
11
11
11
11
11
11
11
11
Sum
line
231
210
190
171
153
136
120
105
9178
6655
4536
2821
1510
63
1Su
m p
yram
id17
7115
4013
3011
4096
981
668
056
045
536
428
622
016
512
084
5635
2010
41
Sum
Hyp
erpy
ram
id10
626

A4.10
Derivation 8 - Limiting Cases of Two Phase Liquid Flow A recent study of amorphous alloys in the ZrTiBe system showed the possibility of a miscibility gap in the supercooled liquid region along the Be = 40 pseudo binary line, but no microscopic evidence of the two phases was obtained. The two phase glasses are thought to separate into a Zr rich phase with a glass transition temperature Tg1 ~ 320 °C and a Ti rich phase with Tg2 ~ 375 °C. If there are indeed two glasses, one would expect to see flow, or more precisely viscosity, as a function of temperature characteristic of a two phase liquid. The flow of liquids with multiple phases was a phenomenon studied extensively in the early 1900s. Two limiting cases were solved for ideal mixtures. Variations of these ideal cases were postulated to explain the flow of other types of liquid mixtures. Both cases consider a liquid mixture with parallel layers or laminae. The applied shear stress is orthogonal to the layers in Case 1 as shown in Figure A4.6. The applied shear stress is parallel to the layers in Case 2 as shown in Figure A4.7. The fundamental law governing viscous flow is
ηF
drdv
= (1)
Where F is the applied shear stress, η is the viscosity, and drdv is the spatial derivative of
the velocity orthogonal to the shear direction.
Figure A4.6: Case 1 showing laminae of two fluids orthogonal to shear direction.

A4.11
Case 1 constrains the layers to have the same velocity. For simplicity consider a liquid with alternating laminae A, B, . . . with viscosities ηA and ηB . . ., and laminae thicknesses sA and sB . . ., and shear stresses per unit area PA and PB . . . Since we are considering only a simple shear stress, we can integrate equation 1 and find
B
B
A
A RPRPHRPv
ηη===
Where R is the distance between horizontal planes, H is the viscosity of the mixture, and P is the average shear stress over the entire distance S. PS = PAsA + PBsB +. . . Hence
⎟⎠⎞
⎜⎝⎛ ++
=S
sPsPvRH BBAA ...
Because sA/S is the fraction by volume of substance A in the mixture, we can use the volume fraction ci for the ith substance in the mixture and find viscosities are additive for Case 1.
∑=i
iicH η (2)
Figure A4.7: Case 2 showing laminae of two fluids parallel to shear direction.

A4.12
The constraint in Case 2 requires the shearing stress to be constant across the layers such that
...===B
BB
A
AA
rv
rvP ηη (3)
where the vA and vB are the partial velocities, and rA and rB are the thicknesses of the A and B laminae. The measured viscosity may be determined by the velocity of the top plane relative to the bottom one such that
RHvP = (4).
The partial velocities of each layer are additive and combining equations 3 and 4 gives
∑∑ ==i i
i
iiv
HPR
ηPr .
Substituting in the fluidity, Φ, which is defined to be the 1/η, we find that
...)( ++=Φ BBAA rrPPR φφ .
But rA/R is the volume fraction of substance A in the mixture and can be replaced by ci. We find that fluidities are additive in Case 2.
∑=Φi
iicφ (5)
A similar derivation can be found in [1]. In immiscible fluids, the layers A and B resist indefinite extension and flow resembling Case 1 results. See page 87 of [1]. In the two phase amorphous (ZraTi1-a)60Be40 alloys, one would expect to see three regions of flow. The first region is at temperatures below Tg1 where the sample would behave like a solid and little or no flow would be observed. The second region covers the temperature range Tg1 <T < Tg2. In region 2, we should see a slope change in the viscosity versus temperature curve as the liquid-solid solution begins flow. The third region spans the temperature range Tg2 < T < Tx. In region three, the sample should exhibit flow characteristic of a two phase liquid. At Tx the sample begins to crystallize and flow stops. It is difficult to predict the flow properties of the (ZraTi1-a)60Be40 system in a quantitative manner. First we don’t know the fragilities of the phases in the alloys. These will be assumed similar to Vitreloy type alloys with m = 40. Also, the flow in region 2 depends not only on volume fraction of the solid phase, but also the size distribution, which is unknown. There are many theoretical models predicting measured viscosity of a liquid solid mixture with known viscosity and solid phase fraction, but they vary by orders of magnitude in their predictions [2]. They are not presented here. A schematic picture of flow is desired. As such, the Johnson viscosity model [3] will be used and a solid will be assumed to have a viscosity = 1012 Pa-s. At Tg1, the first phase is assumed to soften and at Tg2, the second phase is assumed to soften and flow according to the Johnson model.

A4.13
We will assume Tg values measured in the DSC are correct and also assume a fragility of 40 which is reasonable for Vitreloy type alloys. We will look at flow predicted by both Case 1 and Case 2 for a glass similar to Zr30Ti30Be40 with about 60% of the low Tg phase. Assume Tg1 = 310 °C, Tg2 = 360 °C, m = 40. Case 1: Additive viscosities: Region 1: η(T < 310 °C) = 0.6*1012 + 0.4*1012)Pa-s
Region 2: η(310 °C < T < 360 °C) = ⎟⎟
⎠
⎞
⎜⎜
⎝
⎛+
⎟⎠⎞
⎜⎝⎛
∞12
310
10*4.010**6.0/ Am
TA
η Pa-s
Region 3: η(360 °C < T < Tx) = ⎟⎟
⎠
⎞
⎜⎜
⎝
⎛+
⎟⎠⎞
⎜⎝⎛
∞
⎟⎠⎞
⎜⎝⎛
∞
AmAm
TA
TA
// 360310
10**4.010**6.0 ηη Pa-s
These equations are taken from the final equation of derivation 5 and solved for η.
Case 2: Additive fluidities so 2
2
1
12211
1ηη
φφφη
cccc +=+==
Solving for η gives 2211
21 *ηη
ηηηcc +
=
Region 1: η(T < 310 °C) = ⎟⎟⎠
⎞⎜⎜⎝
⎛+ 1212
1212
10*4.010*6.010*10 Pa-s = 1012 Pa-s
Region 2: η(310 °C < T < 360 °C) =
⎟⎟⎟⎟⎟⎟⎟
⎠
⎞
⎜⎜⎜⎜⎜⎜⎜
⎝
⎛
⎟⎟
⎠
⎞
⎜⎜
⎝
⎛+
⎟⎠⎞
⎜⎝⎛
∞
⎟⎠⎞
⎜⎝⎛
∞
12310
12310
10*4.010**6.0
10*10*/
/
Am
Am
TA
TA
η
η Pa-s
Region 3: η(360 °C < T < Tx) =
⎟⎟⎟⎟⎟⎟⎟
⎠
⎞
⎜⎜⎜⎜⎜⎜⎜
⎝
⎛
⎟⎟
⎠
⎞
⎜⎜
⎝
⎛+
⎟⎠⎞
⎜⎝⎛
∞
⎟⎠⎞
⎜⎝⎛
∞
⎟⎠⎞
⎜⎝⎛
∞
⎟⎠⎞
⎜⎝⎛
∞AmAm
AmAm
TA
TA
TA
TA
//
//
360310
360310
10**4.010**6.0
10**10*
ηη
ηη
The two limiting cases for two phase liquid flow are plotted in Figure A4.8.
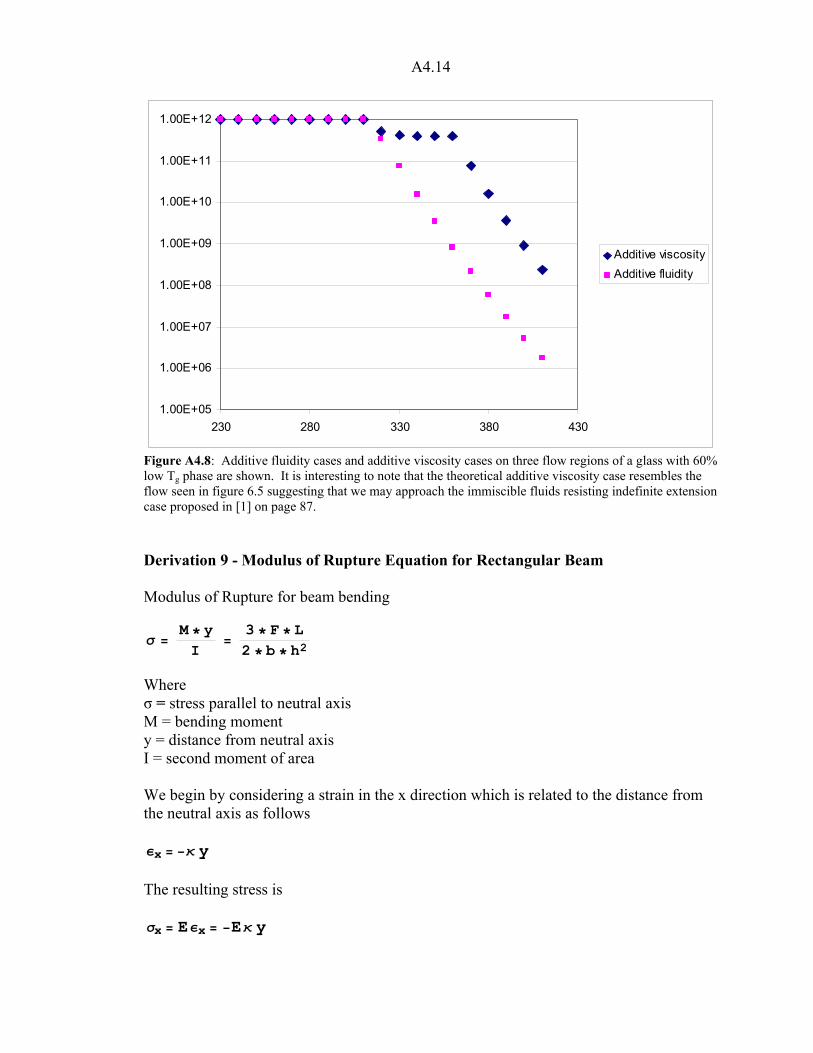
A4.14
1.00E+05
1.00E+06
1.00E+07
1.00E+08
1.00E+09
1.00E+10
1.00E+11
1.00E+12
230 280 330 380 430
Additive viscosityAdditive fluidity
Figure A4.8: Additive fluidity cases and additive viscosity cases on three flow regions of a glass with 60% low Tg phase are shown. It is interesting to note that the theoretical additive viscosity case resembles the flow seen in figure 6.5 suggesting that we may approach the immiscible fluids resisting indefinite extension case proposed in [1] on page 87. Derivation 9 - Modulus of Rupture Equation for Rectangular Beam Modulus of Rupture for beam bending σ =
M ∗ yI
=3 ∗ F ∗ L2 ∗ b ∗ h2
Where σ = stress parallel to neutral axis M = bending moment y = distance from neutral axis I = second moment of area We begin by considering a strain in the x direction which is related to the distance from the neutral axis as follows εx = −κ y The resulting stress is σx = Eεx = −Eκ y

A4.15
dM= −σx ydA
M= ‡ Eκ y2 A
I= ‡ y2 A =‡
−bê2
bê2‡
−hê2
hê2y2 y z
I=
bh3
12
M= Eκ I=
σx Iy
σxmax =MyI
=
F2
∗ L2
∗ h2
bh312
=3FL2bh2
Appendix 4 References [1] E.C. Bingham, Fluidity and Plasticity, McGraw-Hill Book Company, Inc., Ohio,
1922, pp. 81-105. [2] C. Journeau, G. Jeulain, L. Benyahia, J.F. Tassin, P. Abélard, Rhéologie 9 (2006)
28. [3] W.L. Johnson, M.D. Demetriou, J.S. Harmon, M.L. Lind, K. Samwer, MRS Bull.
32 (2007) 644.