pdf: how to profit from biogas market developments
TRANSCRIPT

www.globalintelligence.com
How to Profit from Biogas Market Developments
GIA Industries White Paper
June 2010
Global Intelligence Alliance©2010. All rights reserved.
Contact: [email protected]

www.globalintelligence.com
Table of contents
Executive Summary
Global Outlook
Market Characteristics – Europe, USA, Asia Pacific
Conclusions
Appendix
About GIA
The white paper is provided as is, free of charge and without any warranty or guarantee. Global Intelligence Alliance accepts noresponsibility for errors or omissions, or for any loss or consequential loss arising as a result of decisions taken based on its contents.
©2010 Global Intelligence Alliance. All rights reserved. This white paper is copyright, however individual pages or portions thereof may be copied referencing “Global Intelligence Alliance” as the source.
2
5
8
16, 22, 26
29
34
38
www.globalintelligence.com
Introduction
• The global megatrends such as climate change are driving the
increased adoption of renewable energy sources in general, whereas
the price volatility, supply issues and environmental hazards of fossil
fuel production are about to accelerate the pace in the investments of
non-fossil fuels production in particular.
• Biogas, the most sustainable of biofuels, is in a starting point of an
exponential market growth curve.
• This paper will cover the latest developments and future scenarios of
the rapidly developing biogas business, starting with a global outlook
and going through special market characteristics of Europe, USA and
Asia Pacific.

www.globalintelligence.com
Concepts and abbreviations
Anaerobic Digestion Anaerobic metabolic processes caused through
microbial enzymatic activities
AD Anaerobic digester. An istallation to produce biogas
with anaerobic digestion of organic material
Biogas A combination of methane, CO2 and trace gases
released during anaerobic digestion
Distributed Generation Generating electricity from many small sources
WWTF Wastewater treatment facility
FIT Feed in tariffs
4

www.globalintelligence.com
Executive Summary

www.globalintelligence.com
Executive Summary
6
Under an optimistic
scenario, the 2 Billion
EUR plant installations
business to grow up to 25 Billion by 2020.
Global suppliers to profit out
of increased demand for
components, services and
chemicals
A company with the right expertise and timing can capture it’s share of the
billions that are invested in the infrastructure in the coming years
Primary profiteers of biogas industry growth
• Anaerobic digester providers, especially those in Asia today
• Biogas condensation and upgrade technology developers
• Centralized and specialized plants producing, utilizing and
distributing biogas
Secondary profiteers
• Suppliers of power plants and process equipment
• Maintenance, service and certification businesses
• Companies specialized in environmental management
• Chemical companies developing the production yield
and efficiency

www.globalintelligence.com
Executive Summary
As a global trend, the larger sites will improve the efficiency of power
generation, profitability of biogas upgrade and the utilization of by-products
European
companies and
technologies will be
the ones to watch
between 2010-2015
Asia will be the
main growth area,
installing basic sites
on WWTF’s and
landfills
The US market to
provide innovative
applications and
new business
models
“Laws similar to German model have lead to
growth in other markets as well.”
Andrea Horbelt, European Biogas
Association
“Price volatility of gas and oil will be the main
drivers for the biogas industry; a sufficient
price increase of gas and oil will make biogas
profitable everywhere!”
Kim Söderman, Finnish Biogas Association

www.globalintelligence.com
Global Outlook
www.globalintelligence.com
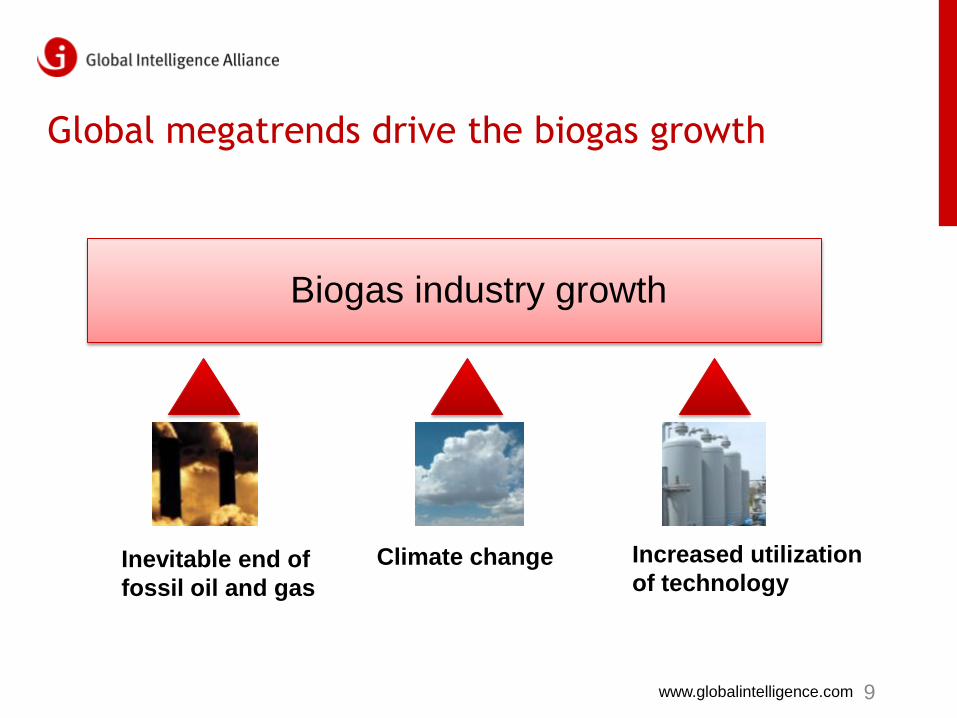
Global megatrends drive the biogas growth
9
Climate changeInevitable end of
fossil oil and gas
Increased utilization
of technology
Biogas industry growth

www.globalintelligence.com
Methane, key component of
biogas is 21 times a more
powerful greenhouse gas than
CO2 . During the
incineration of biogas,
methane is turned into CO2
and water, thus reducing the
negative impact to the
climate.
Biogas – what’s in it for me? (1/2)
10
Source: US Environmental Protection Agency
CO2 from fossil fuels 57 %
CO2 from deforestation etc.
20 %
Methane14 %
Nitrous oxide 8 %
Others 1 %
A chance to reduce both organic methane and fossile CO2 in the atmosphere
Global Greenhouse Gas Emissions
A chance to
profit out of
emissions trade
carbon credits
and government
subsidies

www.globalintelligence.com
Oil 37 %
Solid fossil fuels 25 %
Natural Gas 23 %
Nuclear 6 %
Renewables, hydro and other 9
%
Due to the identical
chemical composition
(methane) upgraded biogas
an be used as an alternative
to all existing natural gas
applications
Biogas – what’s in it for me? (2/2)
11
Source: US Environmental Protection Agency
Global Primary Energy Production
A ready-to-use,
economically
sustainable source
of energy and a
superior second
generation
transportation fuel!
“Biogas has better yield per Ha than ethanol or
biodiesel, making it the most sustainable of biofuels.”
Kim Söderman, Finnish Biogas Association
A chance to reduce both organic methane and fossile CO2 in the atmosphere

www.globalintelligence.com
75 %* of the biogas potential is in the
anaerobic digestion of agricultural crops, by-
products and manure
17%* in municipal
and industrial
organic waste
8%* in sewage
WWTF’s
Agriculture shows greatest potential in biogas
12
* The higher utilization rate of farmland as an energy resource could increase the share of manure, agricultural crops and by-products to
85%, leaving organic waste a 10% and WWTF’s a 5% share
Source: Biomass Magazine, Global Water Intelligence, American Biogas Council, Frost And Sullivan, European Biomass Association,
Eurostat, Iowa State University

www.globalintelligence.com
Current bottleneck of improved biogas utilization is the cost of upgrade technologies
13
Anaerobic
Digestion
Biogas
upgrade into
equivalent
with natural
gas
Fed into existing
networks / used
directly as a
transportation fuel
Combined heat &
energy
Household use
Agriculture75%
WWTF17 %
Landfill8 %
To date only 7 % of the plants in Germany are feeding the gas directly in
the existing natural gas network.
www.globalintelligence.com
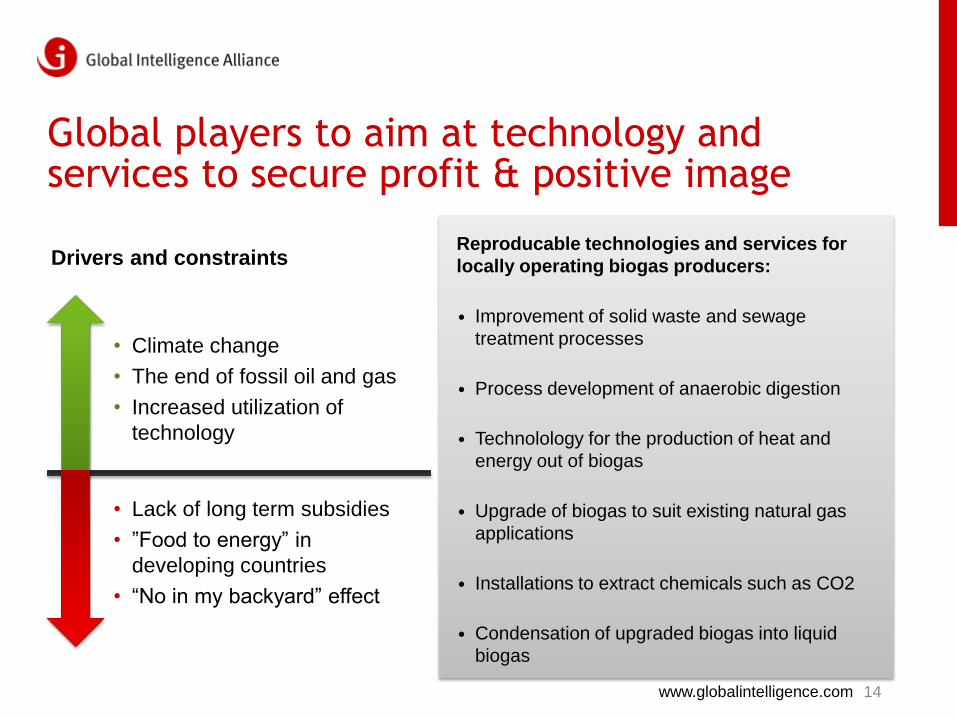
Global players to aim at technology and services to secure profit & positive image
Drivers and constraintsReproducable technologies and services for
locally operating biogas producers:
• Improvement of solid waste and sewage
treatment processes
• Process development of anaerobic digestion
• Technolology for the production of heat and
energy out of biogas
• Upgrade of biogas to suit existing natural gas
applications
• Installations to extract chemicals such as CO2
• Condensation of upgraded biogas into liquid
biogas
14
• Climate change
• The end of fossil oil and gas
• Increased utilization of
technology
• Lack of long term subsidies
• ”Food to energy” in
developing countries
• “No in my backyard” effect

www.globalintelligence.com
With many potential routes to market, where do companies target limited resources?
15
Raw Materials
Upstream Logistics
Biogas Production
Biogas Upgrade
Downstream Logistics
End User
Improvement of solid
waste and sewage
treatment processes:
Where does it take place
today?
Upgrade of biogas to suit
existing natural gas
applications:
Will there be biogas
refineries?
Technology for the
production of heat and
energy out of biogas:
What size of power plants
is required?
Process development of
anaerobic digestion:
Is there a technology jump
in sight?
Installations to extract
chemicals such as CO2:
Is this a business
opportunity?
Condensation of
upgraded biogas into
liquid biogas:
Who to profit out of higher
energy concentration?
1 2 3
64 5

www.globalintelligence.com
Market Characteristics
Europe

www.globalintelligence.com
The EU-wide targets to fight the climate change and the existing infrastructure boost the business
17
• A target to reduce
greenhouse gases by
20% by 2020
• Transportation fuels
need to be blended with
renewables at an
accelerated rate
• The initiatives are
implemented through
national legislation
• Arable land available
also for non-food
plants
• High tech industry
players in energy,
chemistry and
automotive industry
• A well-established
natural gas network
Biogas capacity
worth over 2
modern nuclear
power plants
EU Targets Infrastructure

www.globalintelligence.com
Germany, the biogas market leader, runs half
of Europe’s 9,000 biogas plants
18
1. Process know-how & global players in the
biogas plant installations market eg. Envitec
Biogas, Schmack Biogas and Biogas Nord
2. The rural areas have a new source of
income and jobs as the profitability of the
agriculture in general is decreasing
3. Other European countries are starting to
copy the German model
Source: Biomass Magazine
• Most of the gas is currently
produced by independent
farmers out of biomass
• A feed-in tariff (FIT) ensures a
reasonable payback time for
investments (4-5 years)
• Existing natural gas network
accepts upgraded biogas
• Larger, more centralized
sites are being built
• Biogas as a transportation
fuel is tax free
Key outcomes of the German model

www.globalintelligence.com
Subsidies and country-specific strategies
19
FIT’s exist in most EU countries - their
efficiency is rated 7 times higher to
other government support
Second generation biofuels such as
ethanol and biodiesel are blended with
fossil fuels. The existing fuel
distribution infrastructure supports
liquid fuels over gas.
The utilization of biogas as a
transportation fuel is neglected
Source: Biocycle, Biomass Magazine
Sweden: Innovation
• Community buses
increasingly using biogas
• Liquid biogas to enable long distance
transportation
• Technologies to extract chemicals out of
biogas
Poland today is
“Germany in 1990”
• Limited biogas production
• Excessive food production and wealthy
resources of arable land
• Good infrastructure and an existing
natural gas network in place
• A need to find alternatives for imported
natural gas
+

www.globalintelligence.com
The scope in the business to shift from power generation to gas and chemicals
Plants grow and centralize
New players enter market
Development of equipment,
enzymes, chemicals and know-how
Price of fossil fuels increases while biogas upgrade gets cheaper
More countries adopt biogas in transportation
20
A bright future for European high tech players
Source: Global Water Intelligence, Helmut Kaiser Consultancy
The market in Europe to
grow at a two-digit rate.
The main growth will take
place in refinery
projects and >1MW
power plants.
The share of exports
will increase from the
current 10 -15%.
www.globalintelligence.com
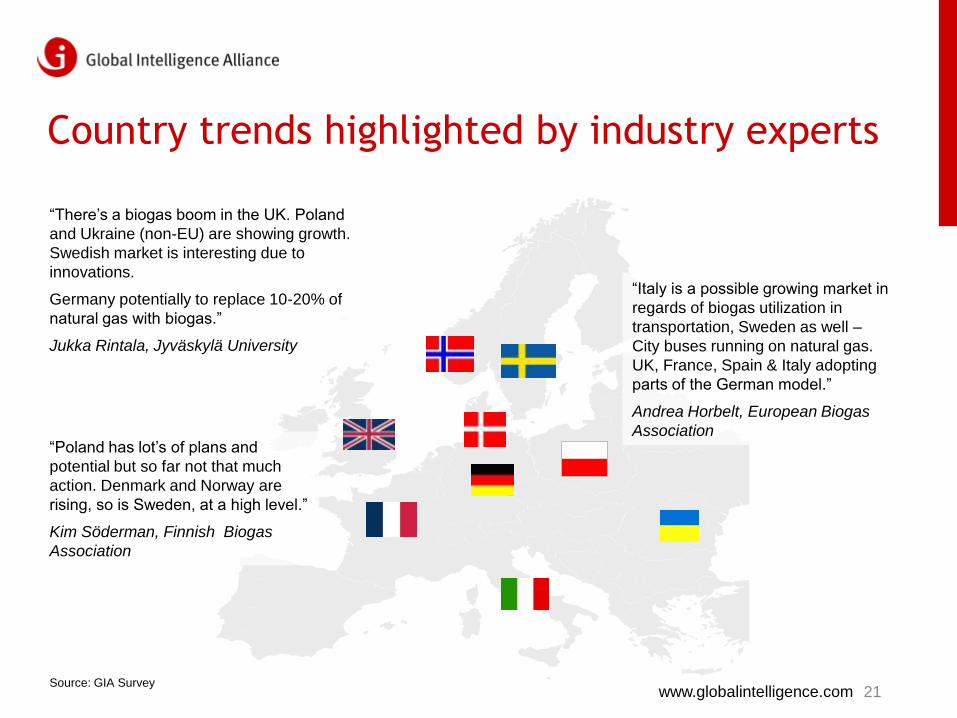
Country trends highlighted by industry experts
21Source: GIA Survey
“Italy is a possible growing market in
regards of biogas utilization in
transportation, Sweden as well –
City buses running on natural gas.
UK, France, Spain & Italy adopting
parts of the German model.”
Andrea Horbelt, European Biogas
Association
“There’s a biogas boom in the UK. Poland
and Ukraine (non-EU) are showing growth.
Swedish market is interesting due to
innovations.
Germany potentially to replace 10-20% of
natural gas with biogas.”
Jukka Rintala, Jyväskylä University
“Poland has lot’s of plans and
potential but so far not that much
action. Denmark and Norway are
rising, so is Sweden, at a high level.”
Kim Söderman, Finnish Biogas
Association

www.globalintelligence.com
Market Characteristics
USA

www.globalintelligence.com
Private sector beginning to leverage the biogas industry
• European-style FIT’s for biogas in
the US: California, Florida, Vermont
and Hawaii
• The FIT’s are limited to a certain size
of power plants as private
companies and individuals are
encouraged to feed electricity into
the power grid
• Followed by the examples of Europe
and Ontario (Canada), local
governments are discussing FIT’s in
Wisconsin, Indiana, Michigan,
Minnesota, Maine and Washington.
23
Source: Renewable Energy World, The New York Times, U.S. Department of Energy
MONTANA
WYOMING
IDAHO
WASHINGTON
OREGON
NEVADA
UTAH
CALIFORNIA
ARIZONA
NORTH
DAKOTA
SOUTH
DAKOTA
NEBRASKA
COLORADO
NEW MEXICO
TEXAS
OKLAHOMA
KANSAS
ARKANSAS
LOUISIANA
MISSOURI
IOWA
MINNESOTA
WISCONSIN
ILLINOISINDIANA
KENTUCKY
TENNESSEE
MISS
ALABAMA
GEORGIA
FLORIDA
SOUTH
CAROLINA
NORTH
CAROLINA
VIRGINIA
WV
OHIO
MICHIGANNEW YORK
PENN
MARYLAND
DELAWARE
NEW
JERSEY
CONN
RI
MASS
MAINE
VT
NH
ALASKA
HAWAII
FIT’s in place for biogas
FIT’s under discussion
www.globalintelligence.com
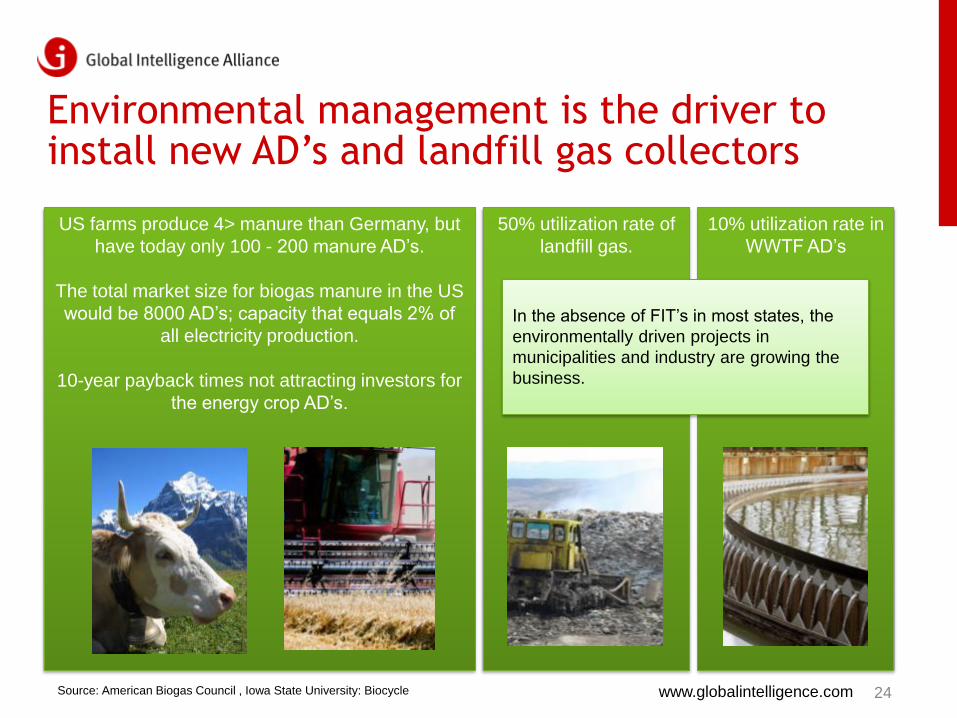
Environmental management is the driver to install new AD’s and landfill gas collectors
24Source: American Biogas Council , Iowa State University: Biocycle
US farms produce 4> manure than Germany, but
have today only 100 - 200 manure AD’s.
The total market size for biogas manure in the US
would be 8000 AD’s; capacity that equals 2% of
all electricity production.
10-year payback times not attracting investors for
the energy crop AD’s.
50% utilization rate of
landfill gas.
10% utilization rate in
WWTF AD’s
In the absence of FIT’s in most states, the
environmentally driven projects in
municipalities and industry are growing the
business.

www.globalintelligence.com
Three profit scenarios for the US until 2020
25Source: Scandinavian GTS, Global Water Intelligence
Scenario 3 – liquid biogas the
leading 2nd generation biofuel
By 2020, biogas upgrade and
condensation technologies
become available for farm-size
operations, making the utilization
of biogas as a transportation fuel
profitable.
Liquid biogas adopted by transport
and defence.
Scenario 2 – application
innovations
To avoid waste and sewage fees,
supermarket chains, schools,
hospitals etc. to follow waste-
intensive industry operations in the
installing of anaerobic digesters.
Other states to copy California in
allowing distributed generation and
consumers to profit out of selling
electricity into the grid.
Scenario 1 - stagnation
USA does not surpass Germany nor
APAC in capacity as the use of
energy crops into biogas is not
adapted in large scale.
Assuming the fossil prices develop
moderately, FIT’s will cover most of
the US.
Company-specific power purchase
agreements will also be implemented
for upgraded biogas.

www.globalintelligence.com
Market Characteristics
Asia Pacific

www.globalintelligence.com27
China and India are Asia’s key biogas markets
Source: Energy Information Administration, The New York Times, Frost and Sullivan
• The benefits in low infrastructure areas include improved sanitation, decreased use of firewood and costly fuels and the access to a free fertilizer.
Small-scale and low tech biogas production is an Asian tradition.
Countries such as India, China and Nepal have traditionally robust, small scale AD’s serving only a few households with gas for cooking.
• With mid-sized units the share of electricity production out of biogas has increased 600% in past 5 years.
• In 2007 China had 26 000 biogas facilities and 26 million households using biogas.
In China, the key players adopting biogas technology are the WWTF’s & landfills.
Increasing demand for electricity in rural areas has spun off biogas-based distributed
generation initiatives.
• Despite high infrastructure, the developed Asian countries not to surpass China, India or even the USA in the production of biogas.
Japan and South Korea are adopting biogas technologies at a high rate.
Malaysia’s palm oil residue represents a well-managed resource for biogas.
“A major driver in China is
economic disposal of waste
and sewage.”
Timo Veijanen, DEWACO Ltd

www.globalintelligence.com
By 2020, China and India to take the lead globally
28Source: Energy Information Administration Renewable Cogen Asia
E.g. China’s target is
to have 300 million
rural residents using
electricity generated
with biogas by 2020
Asian countries already
have high adoptation
rates of gas vehicles.
The replacement of
traditional fuels will
take place only after
the profits available in
petrochemicals
surpass the profits in
electricity production.
In the absence of FIT’s
this change will be
more rapid than in
Europe.
FIT’s are generally not
in place in Asia, but
governments do
provide financing and
tax incentives.
Power purchase
agreements take
place with local
energy companies.
In 2020, the most
modern biogas plants
will exist in Asia,
nearly all of the
capacity built
between 2010-2020
Germany gradually to
lose the tech edge.
When most of the
economic waste,
sewage and manure
resources is being
utililized, the use of
non-edible biomass
accelerates

www.globalintelligence.com
Conclusions

www.globalintelligence.com
With many potential routes to market, where do companies target limited resources?
30
Improvement of solid
waste and sewage
treatment processes:
Where does it take
place today?
Upgrade of biogas to
suit existing natural
gas applications:
Will there be biogas
refineries?
Technology for the
production of heat
and energy out of
biogas:
What size of power
plants is required?
Process development
of anaerobic
digestion:
Is there a technology
jump in sight?
Installations to
extract chemicals
such as CO2:
Is this a business
opportunity?
Condensation of
upgraded biogas into
liquid biogas:
Who to profit out of
higher energy
concentration?
1
2
3 6
4
5
Asia is the
main growth
area for new
WWTF
projects
No tech jumps
in sight to
revolutionize
the industry
Increasing
demand for
> 0.5 MW
plants
Large-scale
refining to start
first in Europe
By-product
chemicals to
remain a niche,
serving a
limited market
Long distance
transportation
and defense to
adopt liquid
biogas

www.globalintelligence.com
Tech trends highlighted by industry experts
31Source: GIA Survey
“While biotechnology will
resolve issues with handling big
masses of different raw
materials, the use of biogas as
a transportation fuel increases.”
Jukka Rintala, Jyväskylä
University
“Technology research on
biogas is ongoing but
progress is slow; it’s more
a walk than a jump!”
Andrea Horbelt, European
Biogas Association
“The bigger the power plants
get, the better the efficiency
of electricity generation and
heat recovery.”
Fredrik Wilenius, Wärtsilä

www.globalintelligence.com
Breaking news highlighting industry growth
32
USA
The Anheuser-Busch brewery in Houston US will begin
using landfill biogas as an alternative fuel source. The
gas will be carried through a pipeline to the Anheuser-
Busch brewery to help generate steam energy for the
brewery’s power plant. More than 55 percent of the
brewery’s fuel demand will be supplied by biogas.
Environmental Leader 29.6.2009
Walmart has completed biogas installations at two
stores in southern California, each at 400kW, generating
approximately 3.4 million kWh annually. Each of these
sites has the potential to eliminate 1 million pounds of
CO2 annually when powered by biogas.
Bloomenergy.com
Asia Pacific
Rhodia announces its first business development
investment in biogas technology, by acquiring
Econcern Group’s participation in six pilot biogas
production projects located in China and Vietnam.
Rhodia 6.7.2009
GE biogas engines to be used in Chinese project to
power a Chinese cow manure-based biogas project.
The manure from the 250,000 cows at the Liaoning
Huishan Farm in Shenyang, China, will be converted
into biogas through GE's four engines. The energy
produced will be sold to the state grid in China.
Bloomberg 5.5.2010

www.globalintelligence.com
Breaking news highlighting industry growth
33
Europe
Schmack Biogas AG has sold a 5 MW biogas feed-in project to RENION Biogas GmbH & Co. KG at a price
of approx. EUR 11.4 million. The raw materials will be transported over an average distance of less than 20
kilometres.
Financial.de 16.4.2009
The construction of a 16 million Euro plant for Liquified Biogas in Sweden has started. The facility, which is
one of the world's first plants for Liquefied Biogas, is scheduled for completion in winter 2010/2011.
Biogasmax 22.4.2010
Royal DSM N.V. announces an agreement to acquire the enzymes supplier Biopract GmbH, based in
Berlin. The acquisition of privately held Biopract will serve as an entry point for DSM into the promising biogas
market.
AZoM.com 2.6.2009

www.globalintelligence.com
Appendix

www.globalintelligence.com
About the MethodologyDiscussing the financial potential of biogas is challenging as the output of a biogas plant is a combination renewable electricity,
heat and a second generation biofuel.
1. The potential of biogas is not an absolute figure.
In the case of anaerobic digestion of wastewater sludge and manure and the collection of landfill gas the raw material base is
limited, tangible and the production is continuous, thus reliable calculations of the biogas potential can be performed based on
the number of WWTF’s and landfills.
With the anaerobic digestion of agricultural plants, crop residue and other biomass, the biogas potential can be valued many
times higher. However all farmland cannot be used for the cultivation of energy due to regulations and the need to produce
edible plants for food. This explains why the share of energy crop based production ranges from 0% to 85% by region.
2. The energy output of a biogas plant is a combination
• Electricity which is either utilized on site or fed into the grid
• Heat that can be used in the anaerobig digestion process or in distant heating of homes
• Gas that can be upgraded to equal the existing natural gas applications.
• In some cases the gas is also flared into the sky
3. The measurement of the utilized biogas potential challenging as well
• Most commonly, there is an equipment to convert gas into electricity, thus the use of Watts (W) to illustrate the net and gross
capacities is justified. The amount of electricity that is not used on-site is fed into the grid. This value is usually measured and
reported. Here kilowatt hours (kWh) are used in quantification.
• The quantification of heat production can only be done to an extent. The heat energy out of the electricity generation is usually
utilized either on site or used by a nearby industrial operation. Only in some cases, the heat is contributing a distant heating
network and a reliable report exists.
• A biogas upgrade operation is actually a petrochemical refinery and a suitable measures are cubic meter (m3) and the tonne of
oil equivalent (toe)
• In flaring the gas, the plant is not contributing energy at all and measurements rarely exist.
35

www.globalintelligence.com
About the Methodology (cont’d)
One unit for all applications would help market understanding.
• Energy industry reports about biogas tend to quantify operations with one unit only (either W, kWh, m3 or toe) thus creativity is
required to find descriptive methods to understand potentials of various end uses of biogas. For example, the use of electricity
units tend to neglect the use of biogas as a second generation biofuel. Joule (J) would be a fair unit to quantify each biogas
energy application.
• Three aspects should be highlighted when discussing the biogas market
1. A relative number that is mostly referred to in market reports is the total value of new installations per year. This is an
interesting figure as the plant installations supplier is looking at the market but does not tell anything about the value of
services and maintenance of existing operations.
2. Theoretically, the annual revenue of a biogas plant can be calculated with a simple formula as the local price of gas or
electricity is known. This value should be added with raw material costs (either negative, positive or zero), transportation
costs and the average value of the by-products (organic fertilizer, CO2, O2 etc) to make it interesting for a company in the
biogas production business.
3. For political decisionmakers the labor intensity of biogas production (e.g. employment/GJ) in comparison to other renewables
would be of interest as well.
36

www.globalintelligence.com37
In alphabetical order:
Sources
American Biogas Council
AZoM.com
Biocycle
Biogasmax
Biomass Magazine
Bloomberg
Bloomenergy
Energy Information Administration
Environmental Leader
European Biomass Association
Eurostat
Financial.de
Frost and Sullivan
Global Water Intelligence
Helmut Kaiser Consultancy
Iowa State University
Renewable Cogen Asia
Renewable Energy World
Scandinavian GTS
The New York Times
US Environmental Protection Agency
US Department of Energy
Wikipedia

www.globalintelligence.com
About GIA

www.globalintelligence.com
Global Intelligence Alliance (GIA) was formed in 1995
when a team of market intelligence specialists,
management consultants, industry analysts and
technology experts came together to build a powerful
suite of customized solutions ranging from outsourced
market monitoring services and software, to strategic
analysis and advisory.Today, we are the preferred partner for organizations
seeking to understand, compete and grow in
international markets. Our industry expertise and
coverage of over 100 countries enables our customers
to make better informed decisions worldwide.
GIA is a strategic market Intelligence and advisory group

www.globalintelligence.com
GIA Group has 12 offices on 4
continents. Together with affiliated GIA
Member companies, certified GIA
Research Partners and consultants,
GIA provides access to local knowledge
in over 100 countries.
All GIA Network companies adhere to
GIA’s Research and Analysis Quality
System as well as the SCIP Code of
Ethics.
Access local knowledge in over 100 countries
www.globalintelligence.com
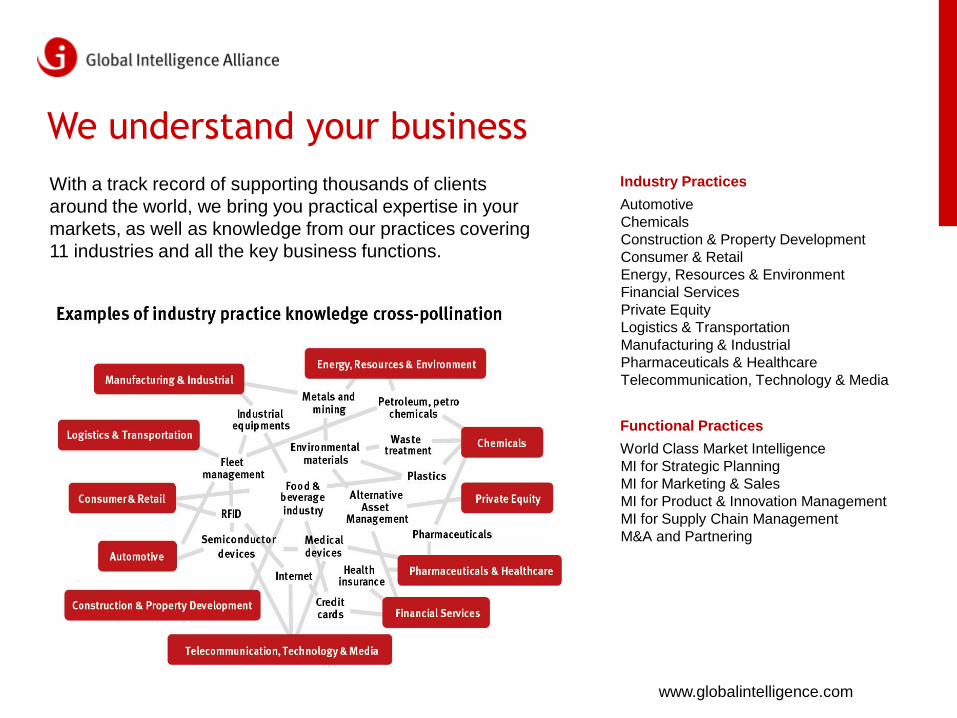
We understand your business
With a track record of supporting thousands of clients
around the world, we bring you practical expertise in your
markets, as well as knowledge from our practices covering
11 industries and all the key business functions.
Industry Practices
Automotive
Chemicals
Construction & Property Development
Consumer & Retail
Energy, Resources & Environment
Financial Services
Private Equity
Logistics & Transportation
Manufacturing & Industrial
Pharmaceuticals & Healthcare
Telecommunication, Technology & Media
Functional Practices
World Class Market Intelligence
MI for Strategic Planning
MI for Marketing & Sales
MI for Product & Innovation Management
MI for Supply Chain Management
M&A and Partnering

www.globalintelligence.com
International Global Intelligence Alliance Group [email protected]
Baltic Region Gateway Baltic [email protected]
Belgium Global Intelligence Alliance Belgium [email protected]
Brazil Global Intelligence Alliance Latin America [email protected]
Canada Global Intelligence Alliance Canada [email protected]
Central & Eastern Europe EasyLink Business Services [email protected]
China Global Intelligence Alliance China [email protected]
Finland Global Intelligence Alliance Finland [email protected]
France RV Conseil [email protected]
Germany Global Intelligence Alliance Germany [email protected]
Hong Kong Global Intelligence Alliance Hong Kong [email protected]
India Global Intelligence Alliance India [email protected]
Japan McRBC [email protected]
Netherlands Global Intelligence Alliance Netherlands [email protected]
Russia ALT R&C. [email protected]
Singapore Global Intelligence Alliance Singapore [email protected]
South Africa Butterfly Effect Intelligence [email protected]
Tunisia Tunisie RV Conseil [email protected]
UK Global Intelligence Alliance UK [email protected]
United Arab Emirates GCC Consulting [email protected]
USA East Coast Global Intelligence Alliance USA East Coast [email protected]
USA West Coast I.S.I.S. – Integrated Strategic Information Services, Inc. [email protected]