a human factors approach to root cause...
TRANSCRIPT

12/11/2012
1
A Human Factors Approach to RootCause Analysis
Thomas Diller, MD, MMM, VP Quality and Patient Safety, GHS
George Helmrich, MD, NCMP, CCD, Chief Medical Officer, Baptist Easley Hospital
Sharon Dunning, MBA, RN, Risk Manager, GHS
Scott A. Shappell, Ph.D., Professor & Chair, Embry-Riddle Aeronautical University
Session A6/B6Presenters have nothing to disclose.
December 11, 2012
9:30 – 10:45 a.m.;
11:15 – 12:30 p.m.
Examine the need to trend underlying causes.
Discuss use of underlying causes.
Describe a standardized taxonomy for analyzing events.
Detail taxonomy use in Common Cause Discovery.
Analyze one organization’s findings from Common Cause Discovery.
Session Objectives
12/11/2012
2
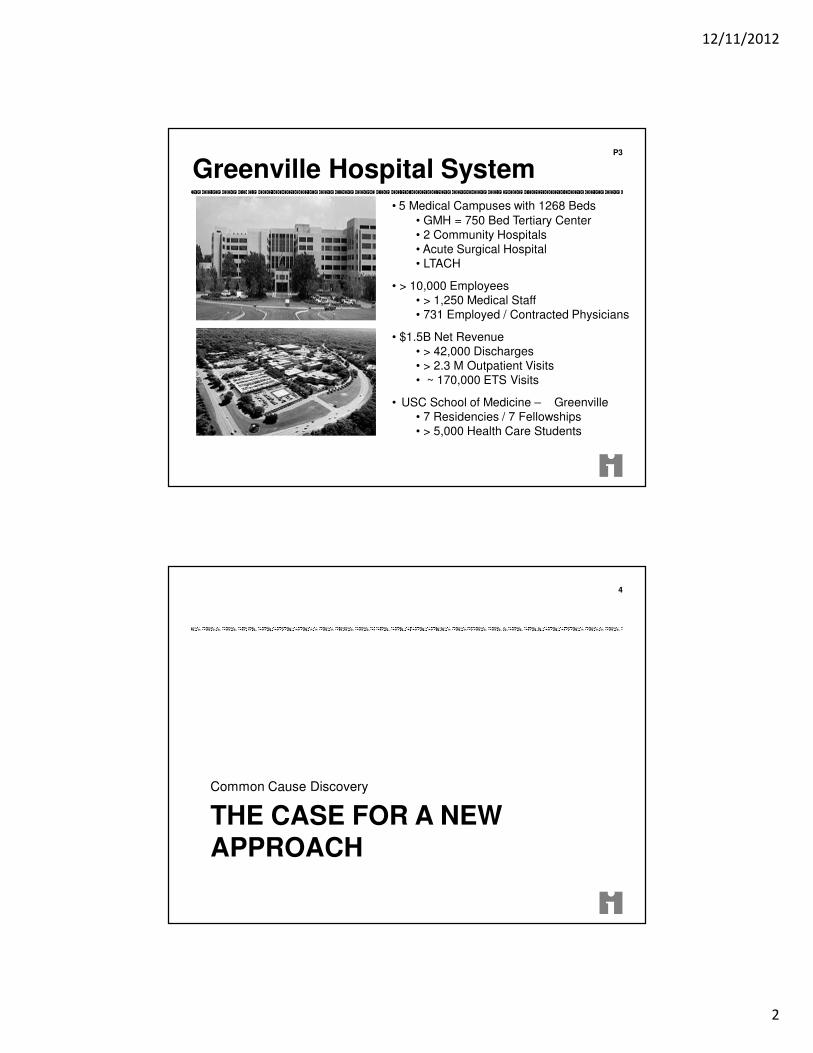
Greenville Hospital SystemP3
• 5 Medical Campuses with 1268 Beds• GMH = 750 Bed Tertiary Center• 2 Community Hospitals• Acute Surgical Hospital • LTACH
• > 10,000 Employees• > 1,250 Medical Staff• 731 Employed / Contracted Physicians
• $1.5B Net Revenue• > 42,000 Discharges• > 2.3 M Outpatient Visits• ~ 170,000 ETS Visits
• USC School of Medicine – Greenville• 7 Residencies / 7 Fellowships• > 5,000 Health Care Students
THE CASE FOR A NEW APPROACH
Common Cause Discovery
4
12/11/2012
3
Institute of Medicine Reports
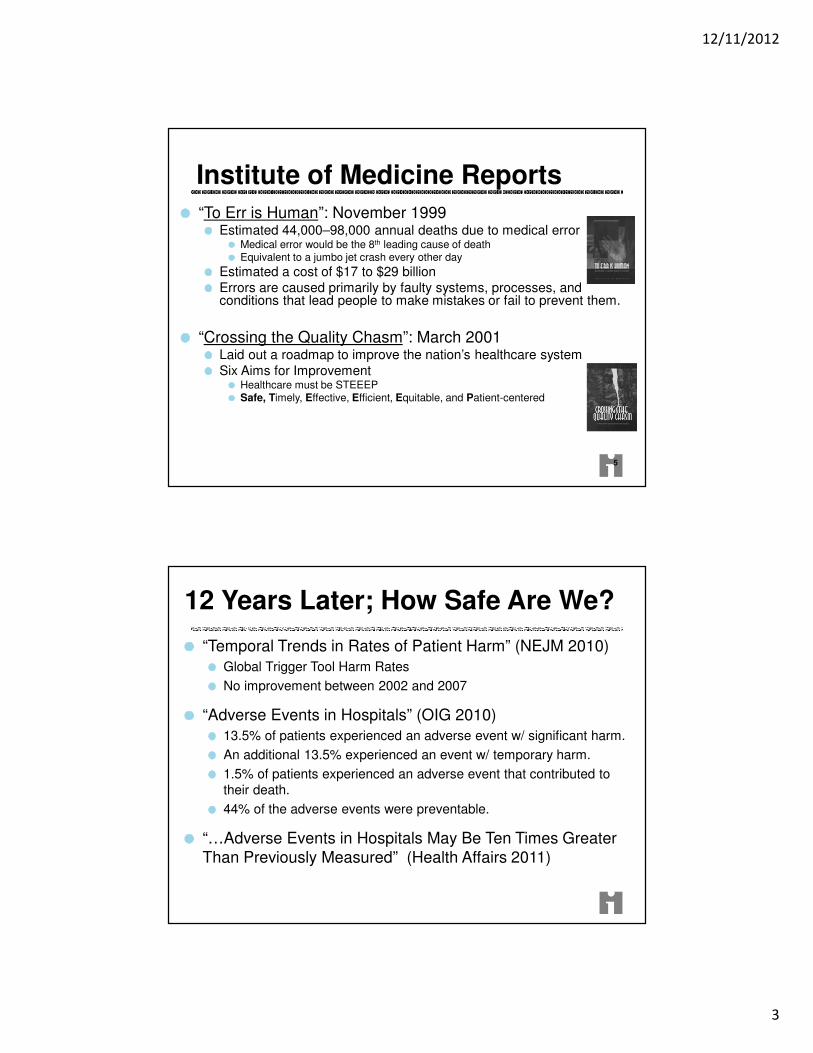
“To Err is Human”: November 1999Estimated 44,000–98,000 annual deaths due to medical error
Medical error would be the 8th leading cause of deathEquivalent to a jumbo jet crash every other day
Estimated a cost of $17 to $29 billionErrors are caused primarily by faulty systems, processes, and conditions that lead people to make mistakes or fail to prevent them.
“Crossing the Quality Chasm”: March 2001Laid out a roadmap to improve the nation’s healthcare systemSix Aims for Improvement
Healthcare must be STEEEP Safe, Timely, Effective, Efficient, Equitable, and Patient-centered
5
12 Years Later; How Safe Are We?
“Temporal Trends in Rates of Patient Harm” (NEJM 2010)
Global Trigger Tool Harm Rates
No improvement between 2002 and 2007
“Adverse Events in Hospitals” (OIG 2010)
13.5% of patients experienced an adverse event w/ significant harm.
An additional 13.5% experienced an event w/ temporary harm.
1.5% of patients experienced an adverse event that contributed to their death.
44% of the adverse events were preventable.
“…Adverse Events in Hospitals May Be Ten Times Greater Than Previously Measured” (Health Affairs 2011)
12/11/2012
4
High Quality is Assumed to Equal High Patient Safety
Quality Improvement is Project Based
Examples … Core Measures, CLABSI, Hand Hygiene, etc.
Too Many Things to Do!!! Not Sustainable!!!
PI Methods are Inadequate
Failure to identify specific causes for performance and fix them.
Copy what someone else did and replicate it.
Use of inadequate PI methods (PDCA, Best Practice, etc.).
Reactive, rather than Proactive
We will be talking about the same errors with the next case.
Punitive approach, rather than a system’s based approach.
Current Quality Approach
7
Future Quality Direction
8

12/11/2012
5
Stages of High ReliabilityHealth Affairs: Chassin and Loeb: 2011
9
Root Cause Analysis: Definitions
Root Cause
Fundamental reason(s) for the failure or inefficiency of one or more processes.
Point(s) in the process where an intervention could reasonably be implemented to change performance and prevent an undesirable outcome.
Common Cause
Aggregate of Root Causes over time for all events.

12/11/2012
6
Frequently Identified Root Causes P11
Traditional Root Cause Analysis
Facilitates a Culture of BlameFocuses on What and Who, rather than Why
Flawed Investigation ProcessInconsistent findings by investigatorsCases are handled one at a time, rather than a systematic view
Root Causes are usually high level and not actionableWe can’t improve “poor communication”
Corrective Actions don’t solve the problems, which then recur
Find who is at fault and punish themChange a policy or process with variable outcomesMore education and training; “Try harder”
P12

12/11/2012
7
Human Factors Analysis Classification System (HFACS)
Insanity: doing the same thing over and over again and expecting different results.” – Albert Einstein
Adverse Event (Root Cause Analysis) Investigation System
Based on James Reason’s Swiss Cheese Model of Accident Causation
Developed by Scott Shappell and Doug Weigmann for the US Navy and Marine Corps Aviation
Used in commercial aviation and several other industries
Highly effective at identifying the human behavior aspects of events
Modified for use in healthcare
P13
HUMAN FACTORS ANALYSIS CLASSIFICATION SYSTEM (HFACS)
Common Cause Discovery
14
12/11/2012
8
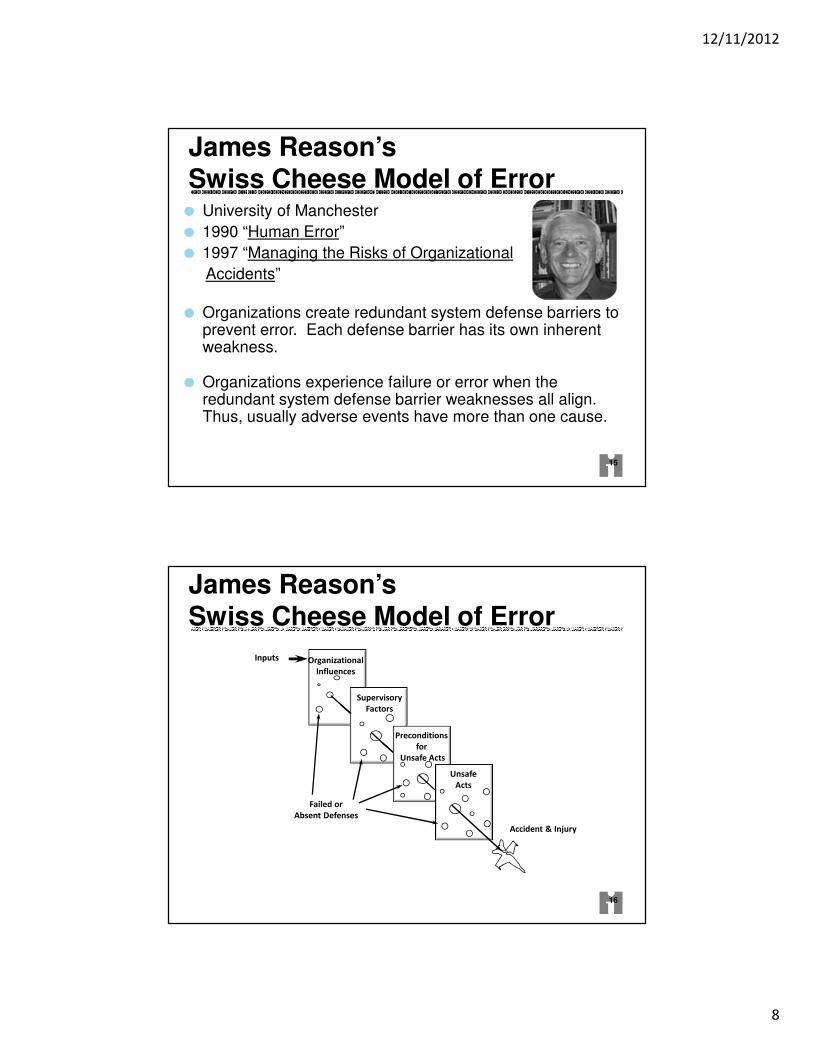
University of Manchester
1990 “Human Error”
1997 “Managing the Risks of Organizational
Accidents”
Organizations create redundant system defense barriers to prevent error. Each defense barrier has its own inherent weakness.
Organizations experience failure or error when the redundant system defense barrier weaknesses all align. Thus, usually adverse events have more than one cause.
James Reason’sSwiss Cheese Model of Error
15
James Reason’s Swiss Cheese Model of Error
16
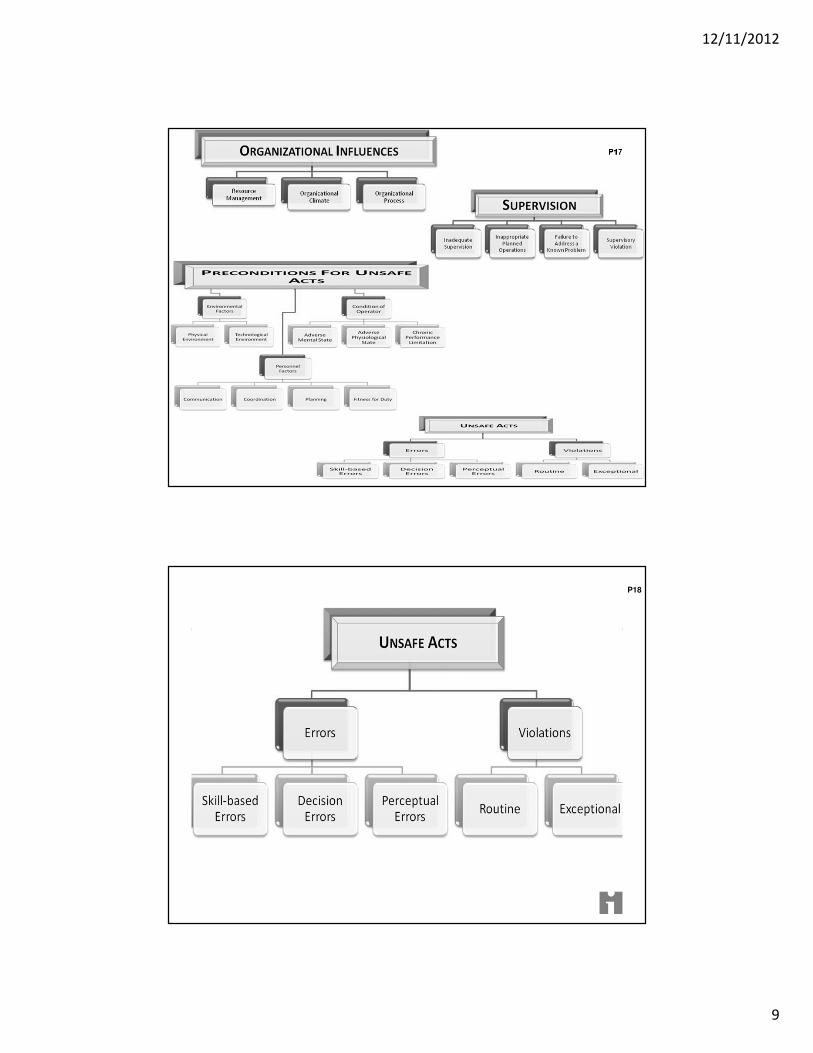
Inputs
Accident & Injury
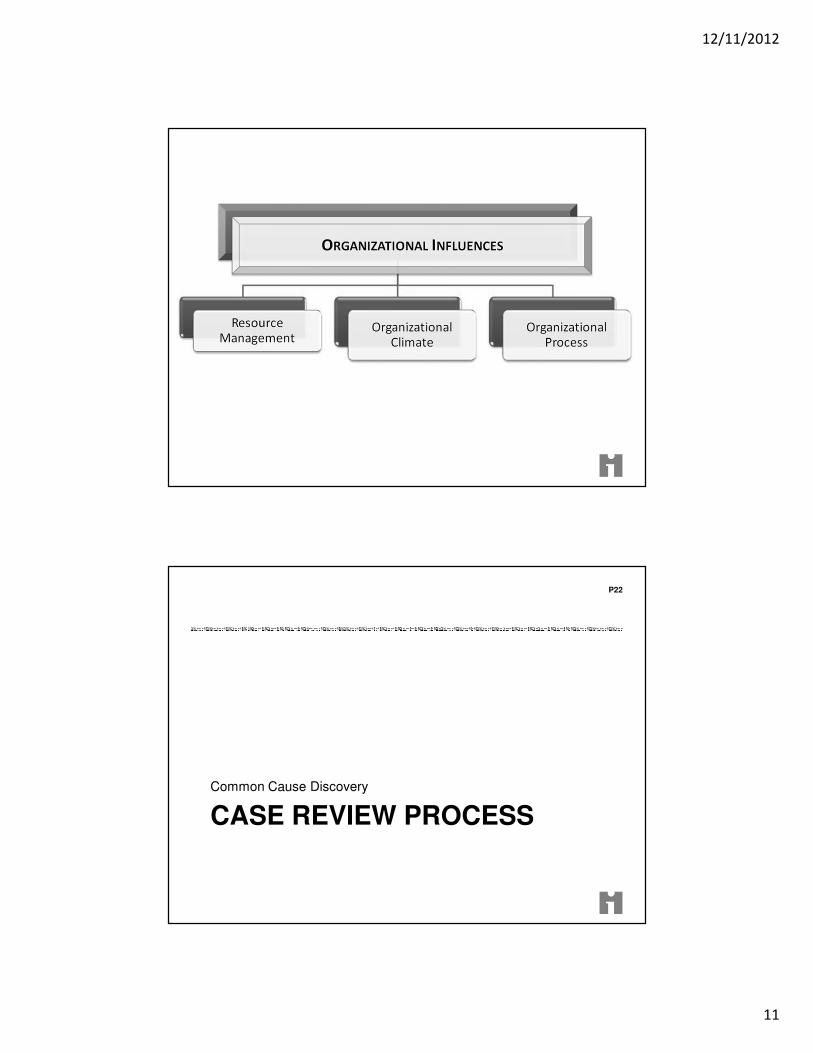
Organizational
Influences
Supervisory
Factors
Preconditions
for
Unsafe Acts
Unsafe
Acts
Failed or
Absent Defenses
12/11/2012
9
P17
P18

12/11/2012
10
12/11/2012
11
CASE REVIEW PROCESS
Common Cause Discovery
P22
12/11/2012
12
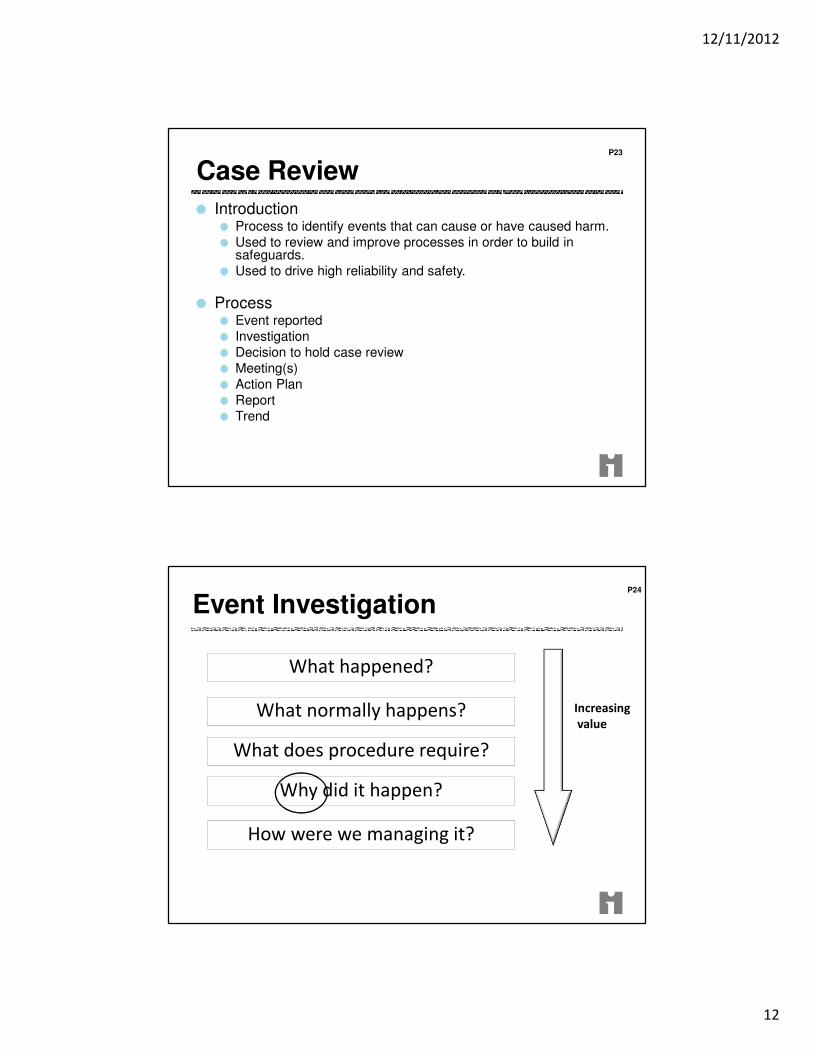
Case Review
IntroductionProcess to identify events that can cause or have caused harm.Used to review and improve processes in order to build in safeguards.Used to drive high reliability and safety.
ProcessEvent reportedInvestigationDecision to hold case reviewMeeting(s)Action PlanReportTrend
P23
Event InvestigationP24
What happened?
Why did it happen?
How were we managing it?
What does procedure require?
What normally happens? Increasing
value
12/11/2012
13
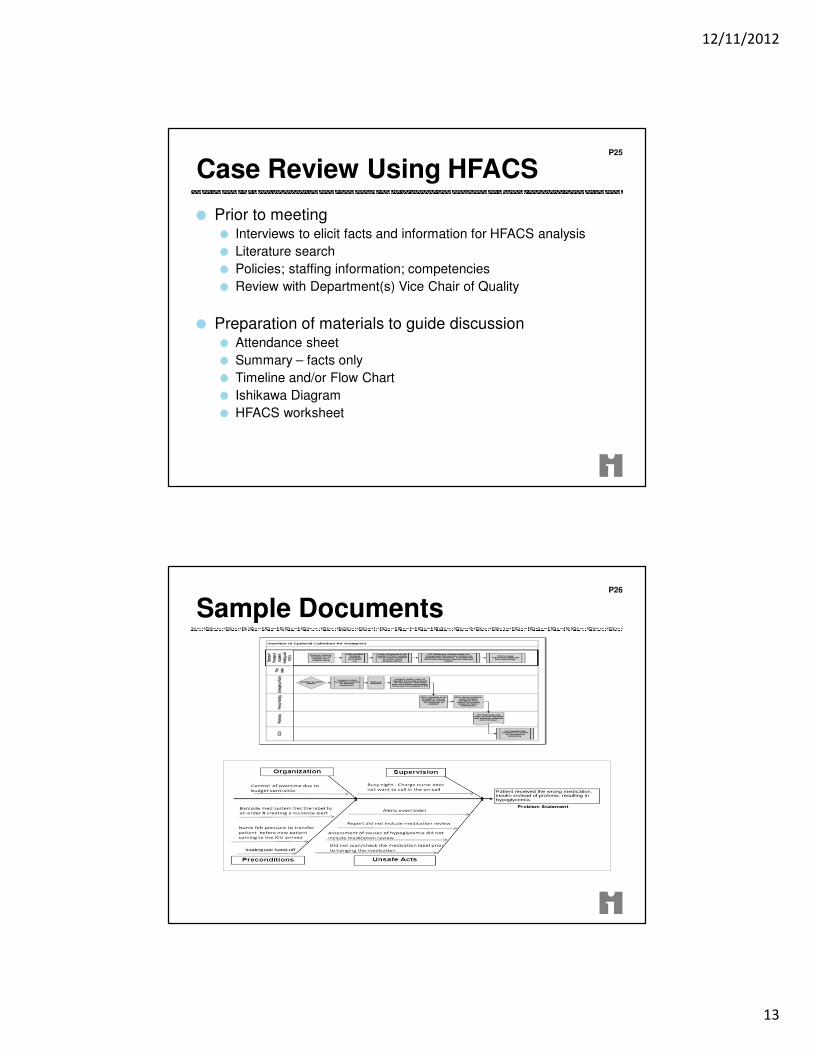
Case Review Using HFACS
Prior to meetingInterviews to elicit facts and information for HFACS analysis
Literature search
Policies; staffing information; competencies
Review with Department(s) Vice Chair of Quality
Preparation of materials to guide discussionAttendance sheet
Summary – facts only
Timeline and/or Flow Chart
Ishikawa Diagram
HFACS worksheet
P25
Sample DocumentsP26

12/11/2012
14
Cause and Effect Mapping
• Begin with undesirable outcome.
• Identify root cause.
• Discern preceding
cause.
• Continue to ask, “why,” until all preceding causes are identified.
P27
Ownership
Process must have an owner
Probably some form of joint ownership
Allow for some decentralization
The owner(s)
Collects
Sifts
Identifies and reaches out to the key players
Follow up

12/11/2012
15
The Review
Pre-work has been completed and a timeline prepared
Assemble the stakeholders
Explain the process
Review the timeline and comments
Ask the right questions and facilitate discussion
Close by bringing the group back to the central themes identified and ensure agreement
Complete a draft action plan
Case Review
Action Plan Based on discussion during case review
Drafted with key stakeholders
Include action to be taken, individual assigned, timeframe for completion and how/when remonitoring will be accomplished
Approval / Revision of Action PlanSharePoint workflow process for in-turn revision / approval
Report Medical Staff Performance Improvement Committee
Quality Management Committee
Board of Trustees
P30
12/11/2012
16
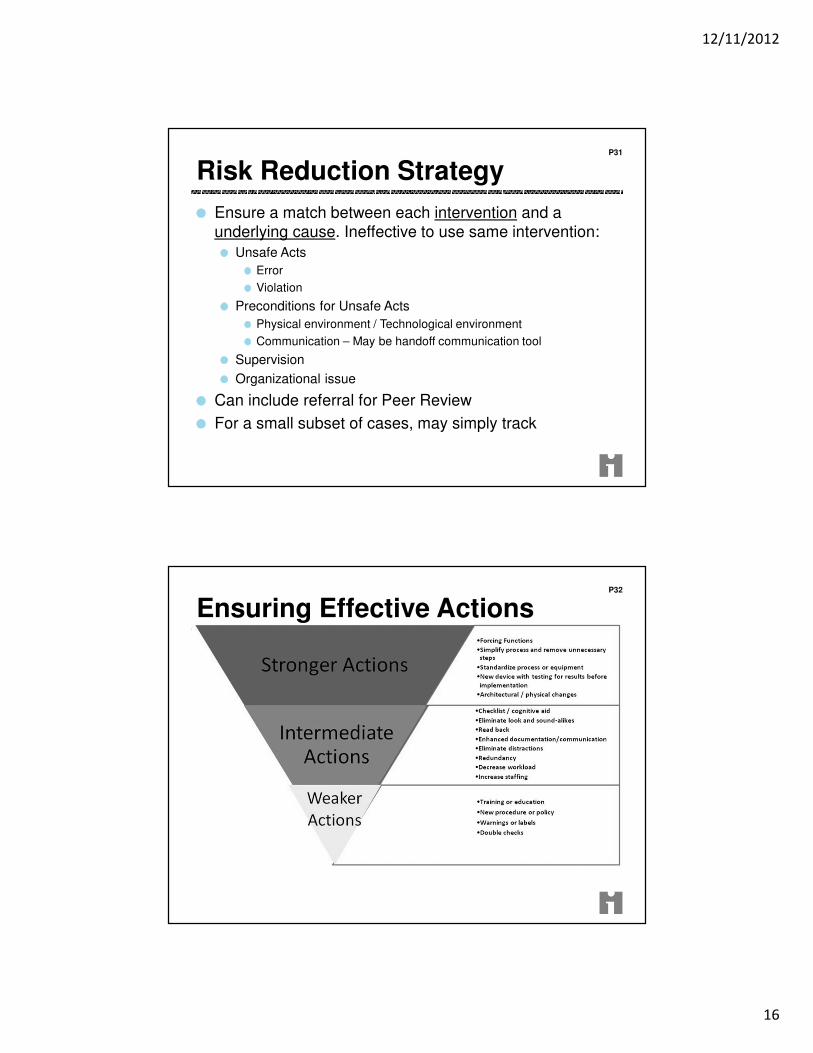
Risk Reduction Strategy
Ensure a match between each intervention and a underlying cause. Ineffective to use same intervention:
Unsafe Acts
Error
Violation
Preconditions for Unsafe Acts
Physical environment / Technological environment
Communication – May be handoff communication tool
Supervision
Organizational issue
Can include referral for Peer Review
For a small subset of cases, may simply track
P31
Ensuring Effective ActionsP32
12/11/2012
17
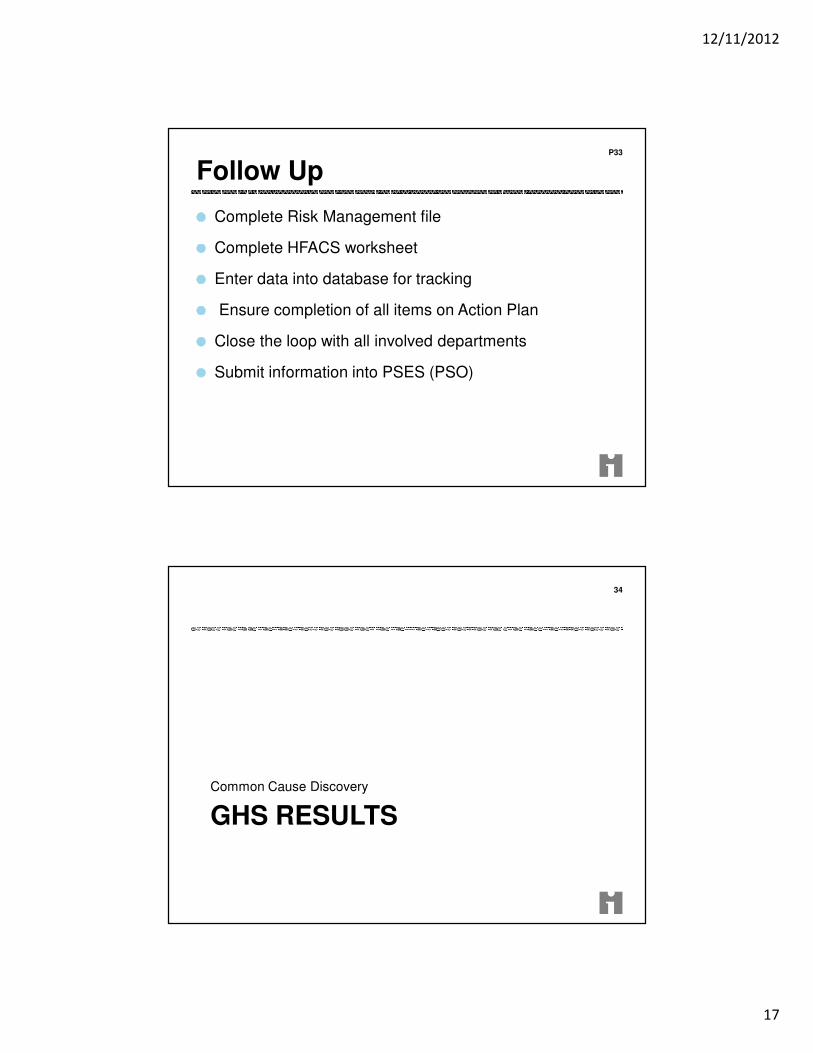
Follow Up
Complete Risk Management file
Complete HFACS worksheet
Enter data into database for tracking
Ensure completion of all items on Action Plan
Close the loop with all involved departments
Submit information into PSES (PSO)
P33
GHS RESULTS
Common Cause Discovery
34

12/11/2012
18
AHRQ Patient Safety Culture Survey
•Report generated October 2012
Event Opportunity Continuum
Customer ComplaintsPatient driven reporting
Focus is on immediate mitigation and patient satisfaction
Currently difficult to obtain systematic information
OccurrencesStaff reported events and near misses
Identifies areas for process improvement
Captured in database, but <10% of events are reported
Adverse EventsIntense investigation of adverse events by Risk Management and VCQ
Identifies both process and behavioral root causes
Malpractice ClaimsLimited data with several year lag time
Generally it is about money, not about process or behavior
Captured in database
36

12/11/2012
19
Occurrence Reports
Since 2010 … > 20,000 occurrence reports
Handoffs
196 Occurrence Reports / Mean Harm Score 2.96
Communication
848 Occurrence Reports / Mean Harm Score 3.17
Staffing
193 Occurrence Reports / Mean Harm Score 2.85
P38

12/11/2012
20
P39
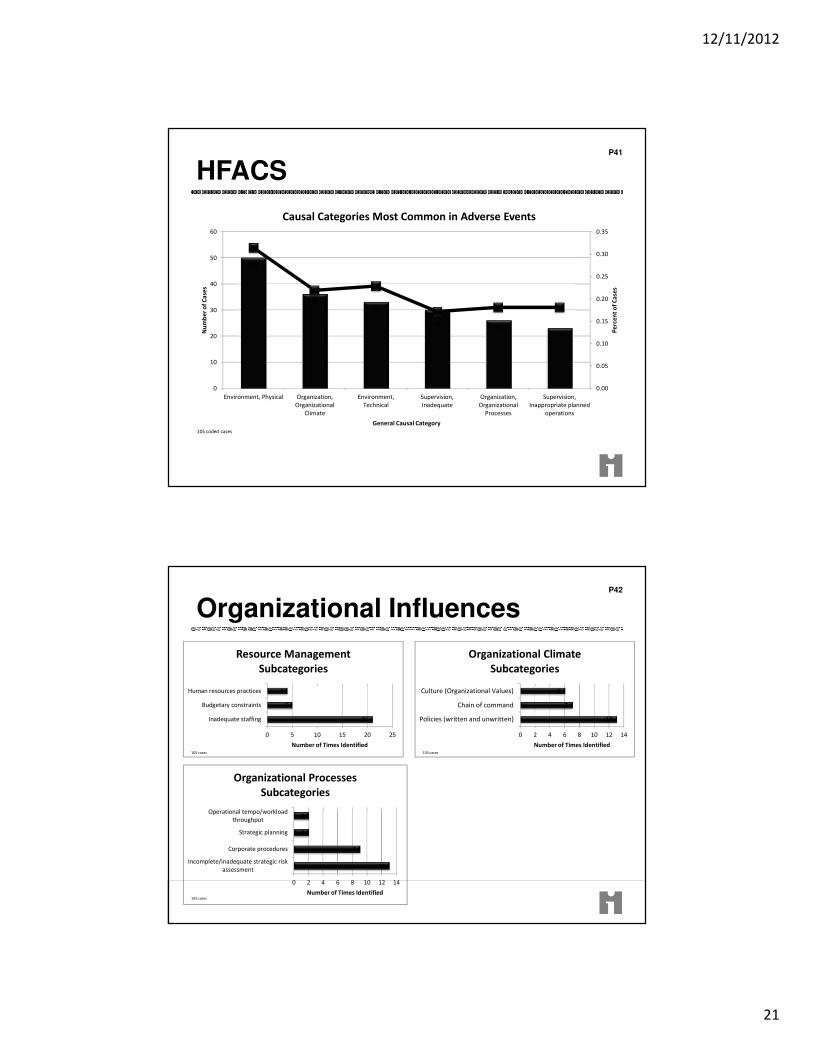
HFACSP40
434
372
183
97
62
0.00
0.10
0.20
0.30
0.40
0.50
0.60
0.70
0.80
0.90
1.00
0
50
100
150
200
250
300
350
400
450
500
Personnel,
Communication,
Coordination, Planning
Error, Decision Violation, Routine Operator, Adverse Mental
State
Error, Skill-Based
Pe
rce
nt
of
Ca
ses
Nu
mb
er
of
Ca
ses
General Causal Category
Causal Categories Most Common in Adverse Events
105 coded cases
12/11/2012
21
HFACSP41
50
36
33
3026
23
0.00
0.05
0.10
0.15
0.20
0.25
0.30
0.35
0
10
20
30
40
50
60
Environment, Physical Organization,
Organizational
Climate
Environment,
Technical
Supervision,
Inadequate
Organization,
Organizational
Processes
Supervision,
Inappropriate planned
operations
Pe
rce
nt
of
Ca
ses
Nu
mb
er
of
Ca
ses
General Causal Category
Causal Categories Most Common in Adverse Events
105 coded cases
Organizational InfluencesP42
21
5
4
0 5 10 15 20 25
Inadequate staffing
Budgetary constraints
Human resources practices
Number of Times Identified
Resource Management
Subcategories
105 cases
13
9
2
2
0 2 4 6 8 10 12 14
Incomplete/inadequate strategic risk
assessment
Corporate procedures
Strategic planning
Operational tempo/workload
throughput
Number of Times Identified
Organizational Processes
Subcategories
105 cases
13
7
6
0 2 4 6 8 10 12 14
Policies (written and unwritten)
Chain of command
Culture (Organizational Values)
Number of Times Identified
Organizational Climate
Subcategories
105 cases

12/11/2012
22
SupervisionP43
7
7
6
5
0 1 2 3 4 5 6 7 8
Failed to provide adequate
mentoring/coaching/instruction
Failed to provide adequate oversight
Failed to provide adequate training
Failed to communicate
policies/procedures
Number of Times Identified
Inadequate Supervision Subcategories
105 cases
15
5
0 10 20 30 40 50 60
Failed to enforce
policies/procedures/requirements
Authorized hazardous operation
(compromised safety for efficiency)
Number of Times Identified
Violation Subcategories
105 cases
4
3
2
0 1 2 3 4 5
Failure to match staff competency
with task
Workload assignment
Incorrect task prioritization
Number of Times Identified
Operational Planning Subcategories
105 cases
5
4
4
1
0 1 2 3 4 5 6
Failed to initiate corrective action
Failed to ensure problem corrected
Failed to revise a policy
Failed to report unsafe tendencies
Number of Times Identified
Failure To Address Problem Subcategories
105 cases
Preconditions for Unsafe ActsP44
82
58
46
41
41
0 20 40 60 80 100
Communication between providers
Did not disclose critical info
Failed to use all available resources
Communication between depts
Number of Times Identified
Communication/Coordination Top
Subcategories
105 cases
41
32
21
21
18
0 10 20 30 40 50
Lack of teamwork
Confusing/conflicting directions
Communication with patient
Failure in leadership
Inaccurate information provided
Number of Times Identified
Communication/Coordination Top
Subcategories
105 cases
26
18
17
14
14
0 5 10 15 20 25 30
Task overload
Perceived pressure
Inattention/Distraction
Complacency
Job related stress
Number of Times Identified
Operator Adverse Mental State
Subcategories
105 ases
34
10
2
0 10 20 30 40
Inadequate design
Obstructed access visualization
Clutter, debris, slippery surfaces
Number of Times Identified
Top Subcategories of Physical
Environment
105 cases

12/11/2012
23
Unsafe ActsP45
75
66
65
60 62 64 66 68 70 72 74 76
Inadequate risk assessment
Critical-thinking failure
Caution/warning ignored or
misinterpreted
Number of Times Identified
Decision Error Subcategories
105 cases
27
25
24
11
10
0 10 20 30 40 50 60
Performed task at the wrong time
Safety checklist error
Work or motion at improper speed
Lapse of memory / recall
Poor technique
Number of Times Identified
Skill-Based Error Top
Subcategories
105 cases
76
47
34
33
26
17
0 10 20 30 40 50 60 70 80
Violation of policy / procedure
Failure to assess patient
Failure to monitor patient
Documentation inadequate
Distracting behavior
Taking shortcuts
Number of Times Identified
Routine Violations Subcategories
105 cases
8
5
2
1
1
0 2 4 6 8 10
Violation of policy / procedure
Disabled safety devices
Excessive risk taking
Improper use of equipment
Failure to follow orders
Number of Times Identified
Exceptional Violation
Subcategories
105 cases
Findings Comparison
Source Pt. Safety Survey Occurrence Reports HFACS
Adverse Mental
State
No No Yes
Communication Yes Yes Yes
Errors (Decision /
Skill Based)
No No Yes
Handoffs and
Transitions
Yes Yes Yes
Organizational
Learning
Yes No No
Staffing (Resource
Management)
Yes +/- +/-
Violations No No Yes
P46

12/11/2012
24
Findings Comparison
Prior to HFACS
No preceding cause
Lack of sufficient information
May have failed to address root causes
Non-actionable Root Causes
With use of HFACS
Actionable Common Causes identified
Avoid unintended consequences
Identify commonalities across departments/services/units
System solutions
P47
Lessons Learned
HFACS required refining for the healthcare industry
Resource intensive and took over two years of adjustments
Future refinements should be expedited
Retrospective application of HFACS was ineffective
Traditional reviews failed to address multiple failure modes or preceding causes
Training for key staff (physician leaders and risk managers) is essential
Excel database works well
Identification of causes is only the beginning; appropriate solutions are essential
P48

12/11/2012
25
Solutions
Use common causes to develop intervention and mitigation strategies that target change
Human Factors Intervention Matrix (HFIX)
Contrasts causal factors against intervention/mitigation approaches:
Organizational / AdministrativeHuman FactorsTechnology / EngineeringTask / MissionOperational / Physical Environment
Next Steps
Discussion / Questions
Tom Diller, MD, MMM … [email protected]
Sharon Dunning, MBA, RN … [email protected]
George Helmrich, MD, NCMP, CCD … [email protected]
Scott Shappell, PhD … [email protected]
Thank You
P50