an early electrocardiograph - cardiology.org for an ecg chest or epigastric pain or sensation chf...
TRANSCRIPT
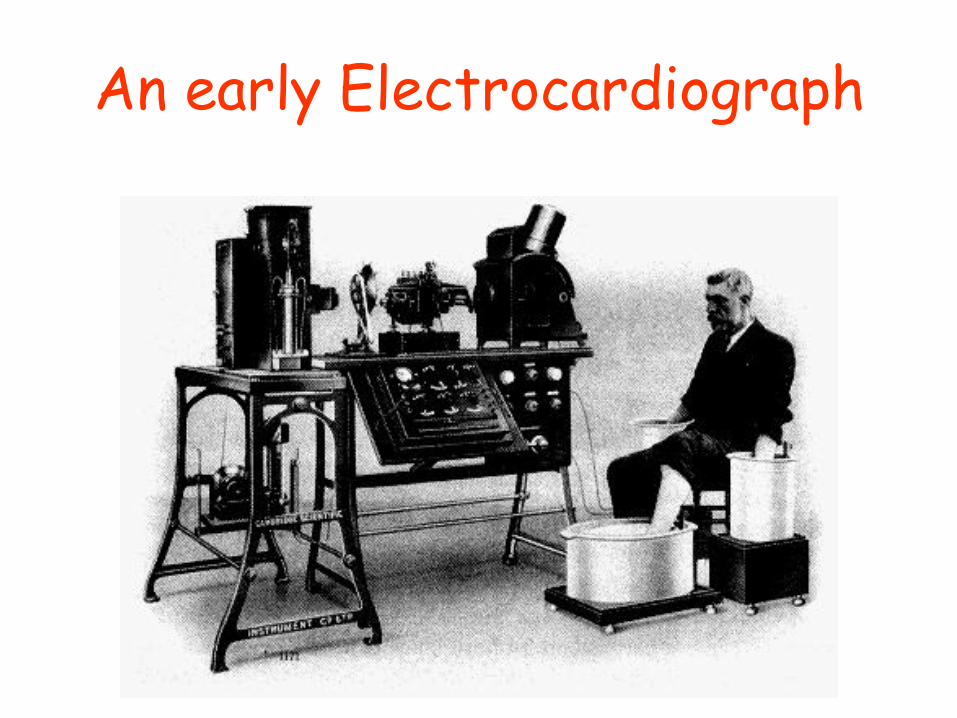
An early Electrocardiograph
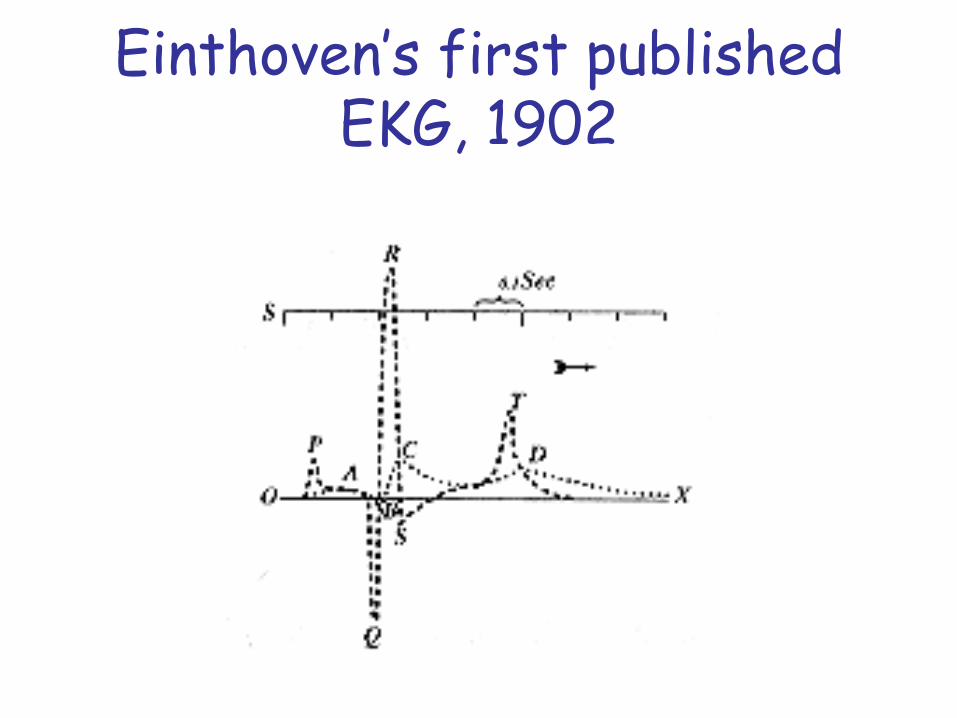
Einthoven’s first published EKG, 1902

“I do not however imagine that the
string galvanometer…is likely to
find any very extensive use in the
hospital”
August D. Waller, 1909
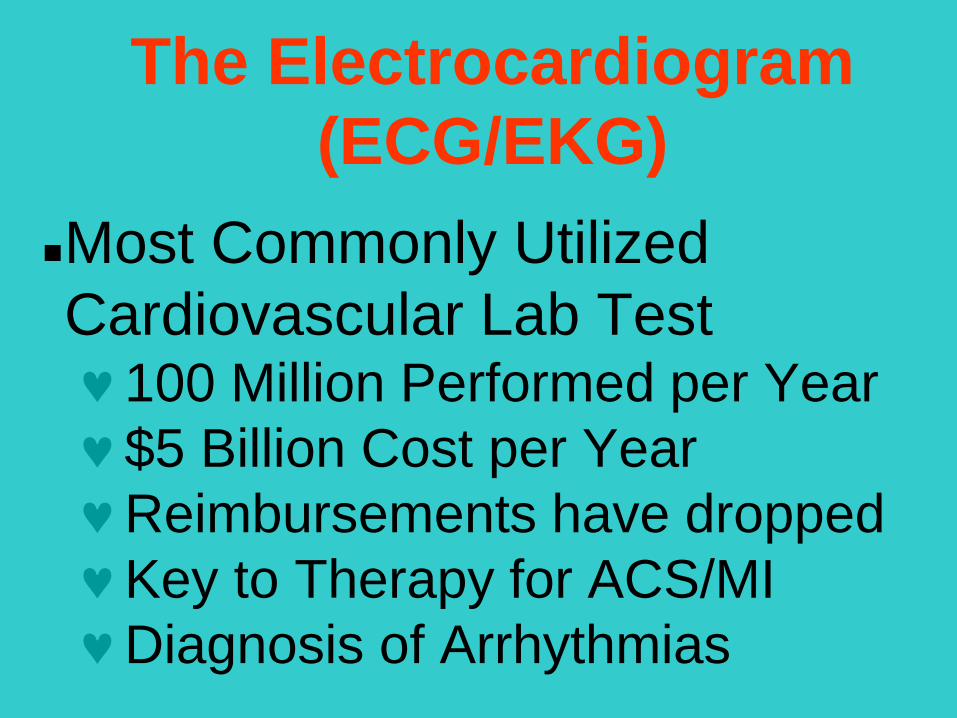
The Electrocardiogram
(ECG/EKG)
Most Commonly Utilized
Cardiovascular Lab Test 100 Million Performed per Year
$5 Billion Cost per Year
Reimbursements have dropped
Key to Therapy for ACS/MI
Diagnosis of Arrhythmias
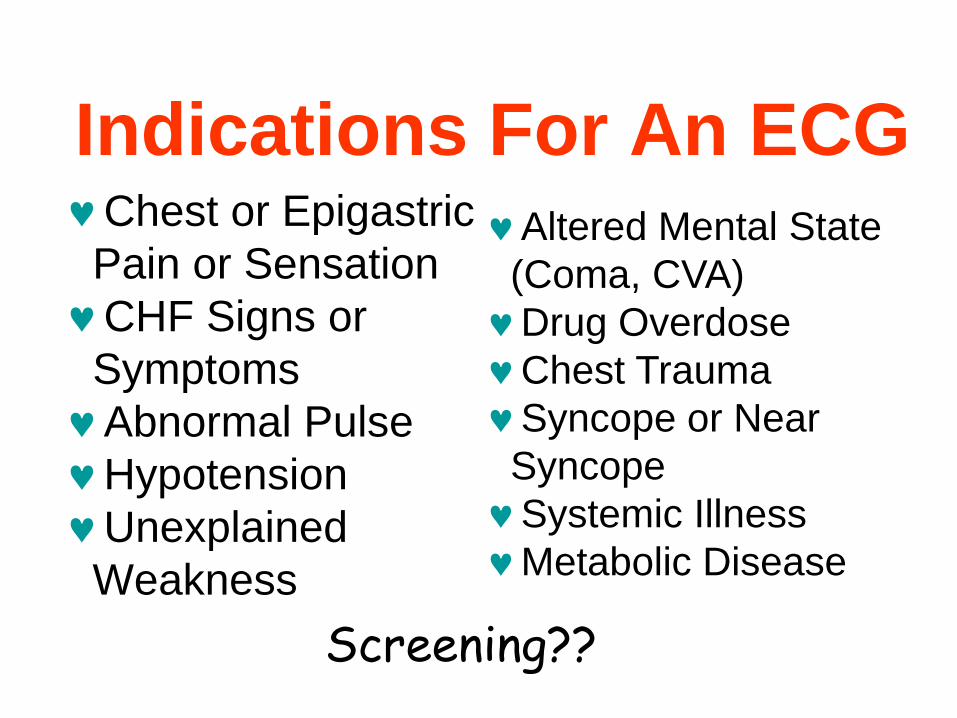
Indications For An ECG Chest or Epigastric
Pain or Sensation
CHF Signs or
Symptoms
Abnormal Pulse
Hypotension
Unexplained
Weakness
Altered Mental State
(Coma, CVA)
Drug Overdose
Chest Trauma
Syncope or Near
Syncope
Systemic Illness
Metabolic Disease
Screening??
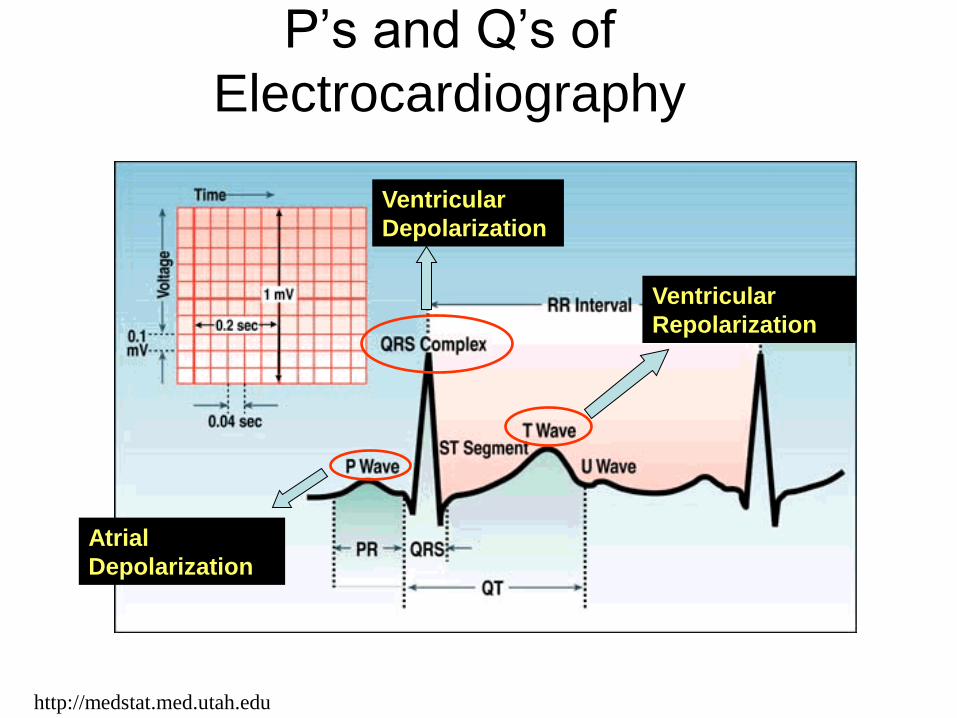
P’s and Q’s of
Electrocardiography
Atrial
Depolarization
Ventricular
Depolarization
Ventricular
Repolarization
http://medstat.med.utah.edu

RL/LL- side does not matter, place anywhere below umbilicus

The Electrocardiogram
(ECG/EKG)
Rhythms
ST Segments


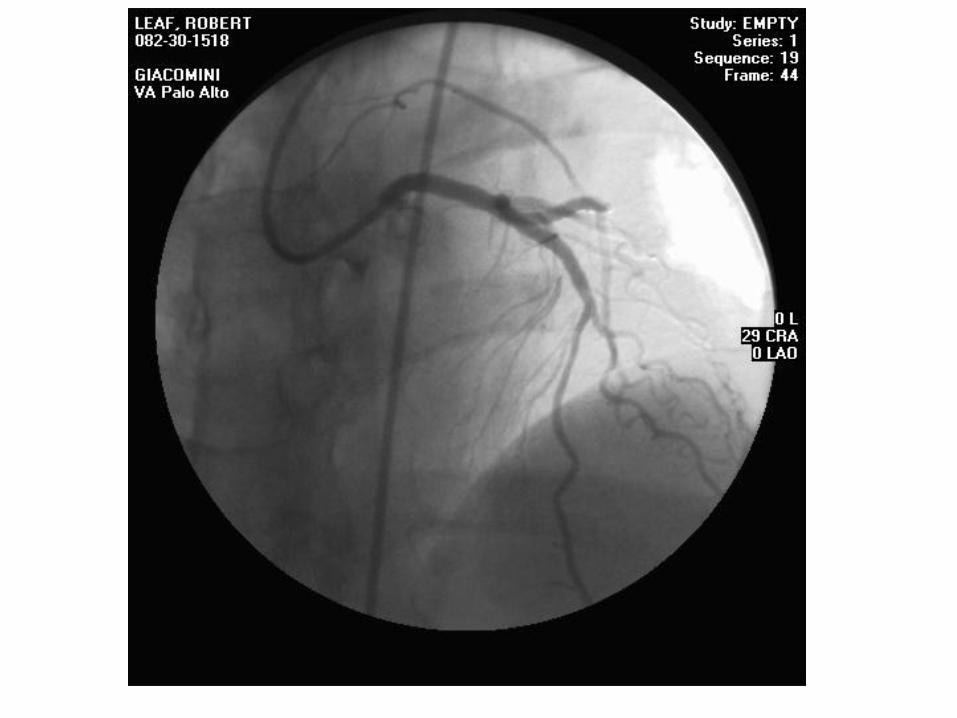


LAD 95%
1

LAD 95%
1

1
LAD 95%

1

1
LAD 0%
Post PCI
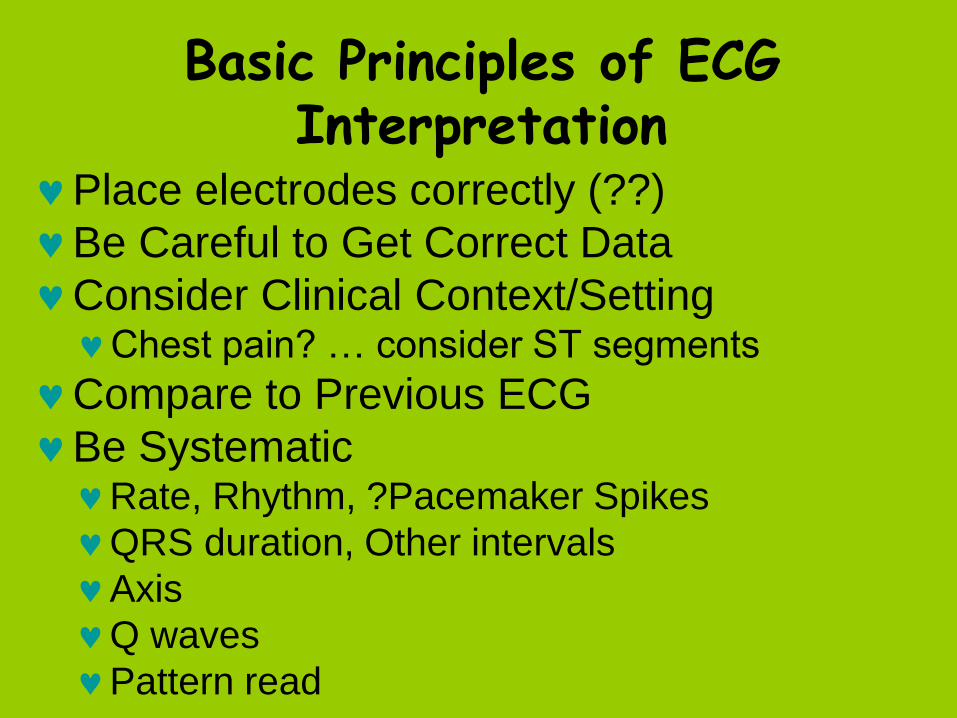
Basic Principles of ECG Interpretation
Place electrodes correctly (??)
Be Careful to Get Correct Data
Consider Clinical Context/Setting Chest pain? … consider ST segments
Compare to Previous ECG
Be Systematic Rate, Rhythm, ?Pacemaker Spikes
QRS duration, Other intervals
Axis
Q waves
Pattern read
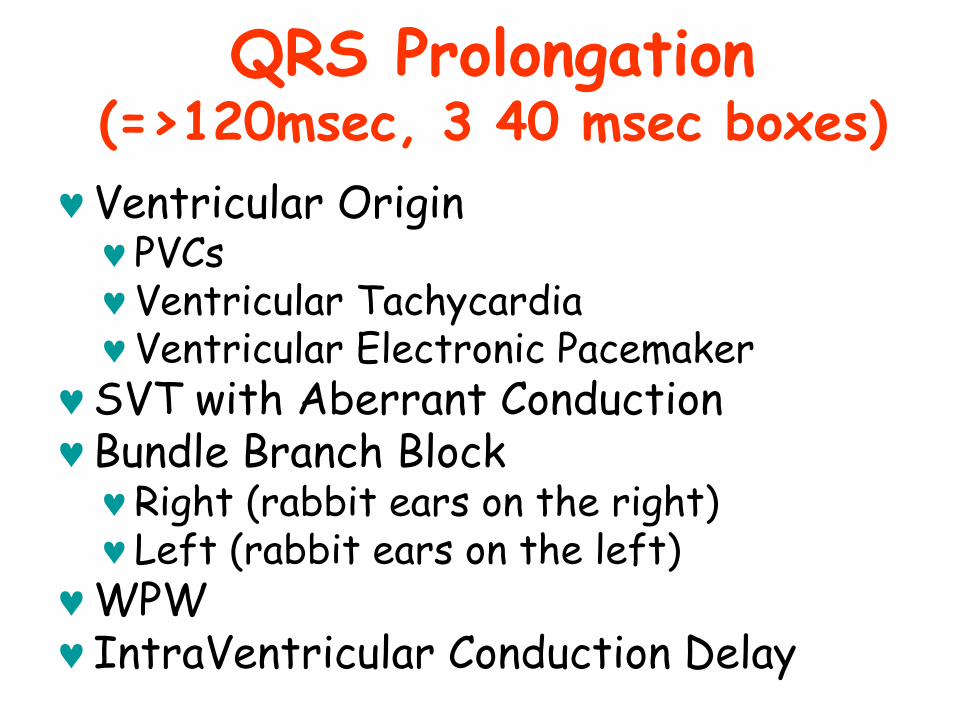
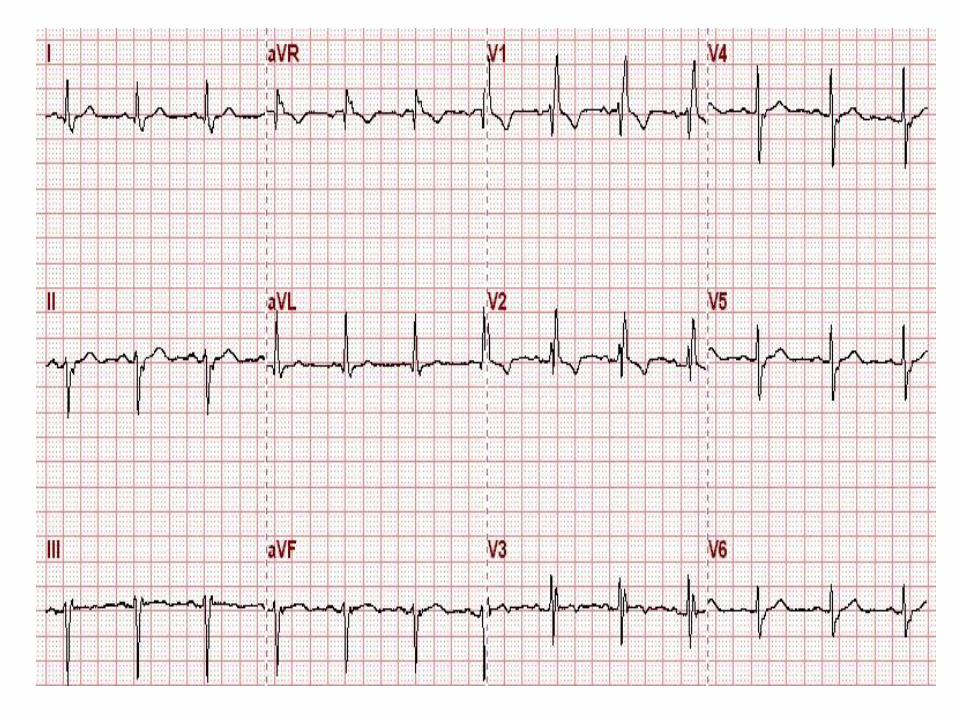
QRS Prolongation (=>120msec, 3 40 msec boxes)
Ventricular Origin PVCs Ventricular Tachycardia Ventricular Electronic Pacemaker
SVT with Aberrant Conduction Bundle Branch Block Right (rabbit ears on the right) Left (rabbit ears on the left)
WPW IntraVentricular Conduction Delay
Why is QRS Prolongation so
important except for RBBB???
Q waves not diagnostic ST Depression not diagnostic Possibly Ventricular Origin
Usually High Risk
0.000
0.250
0.500
0.750
1.000
0.0 2.0 4.0 6.0 8.0 10.0 12.0 14.0
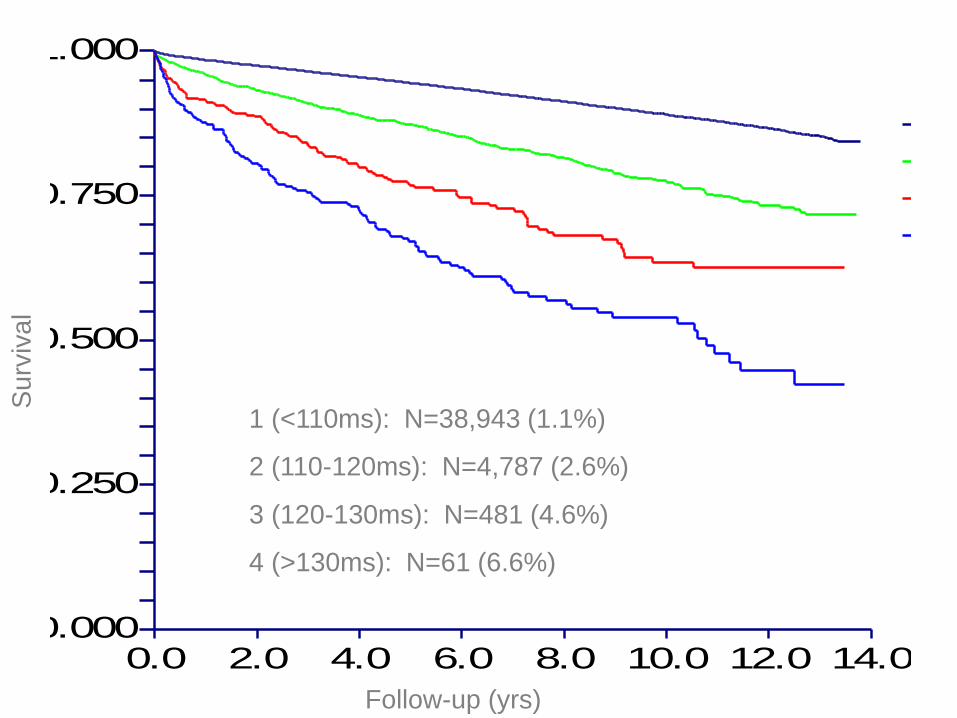
Survival Plot
FUpYears
Surv
ival
QRSscore
1234
1 (<110ms): N=38,943 (1.1%)
2 (110-120ms): N=4,787 (2.6%)
3 (120-130ms): N=481 (4.6%)
4 (>130ms): N=61 (6.6%)
Follow-up (yrs)
Su
rviv
al
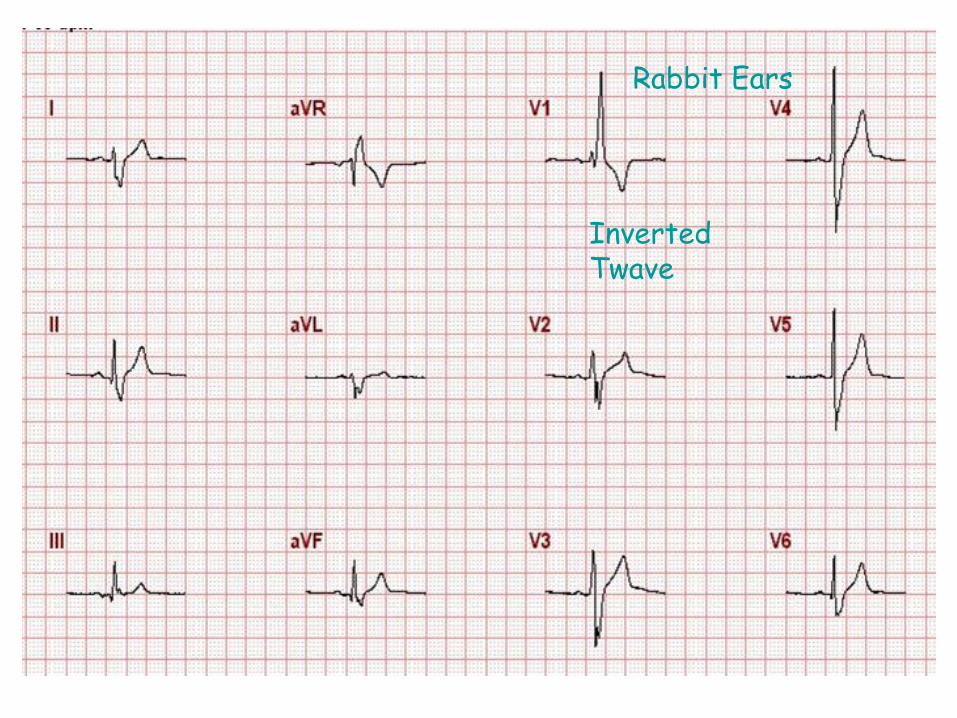
Rabbit Ears
Inverted Twave
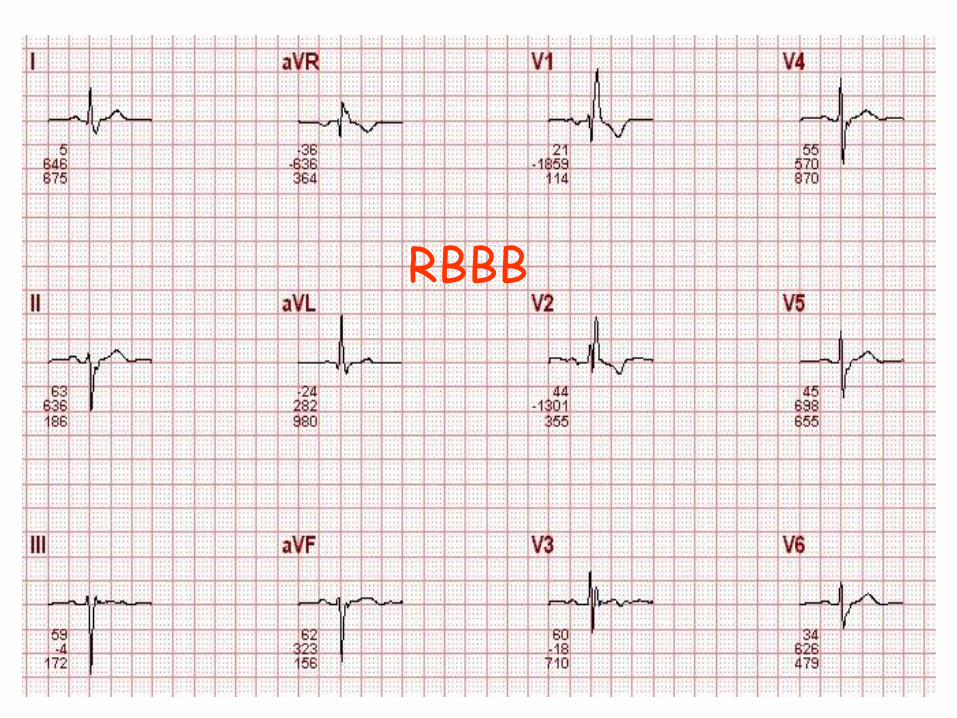
RBBB

LBBB

Rabbit Ears
Inverted Twave

IVCD
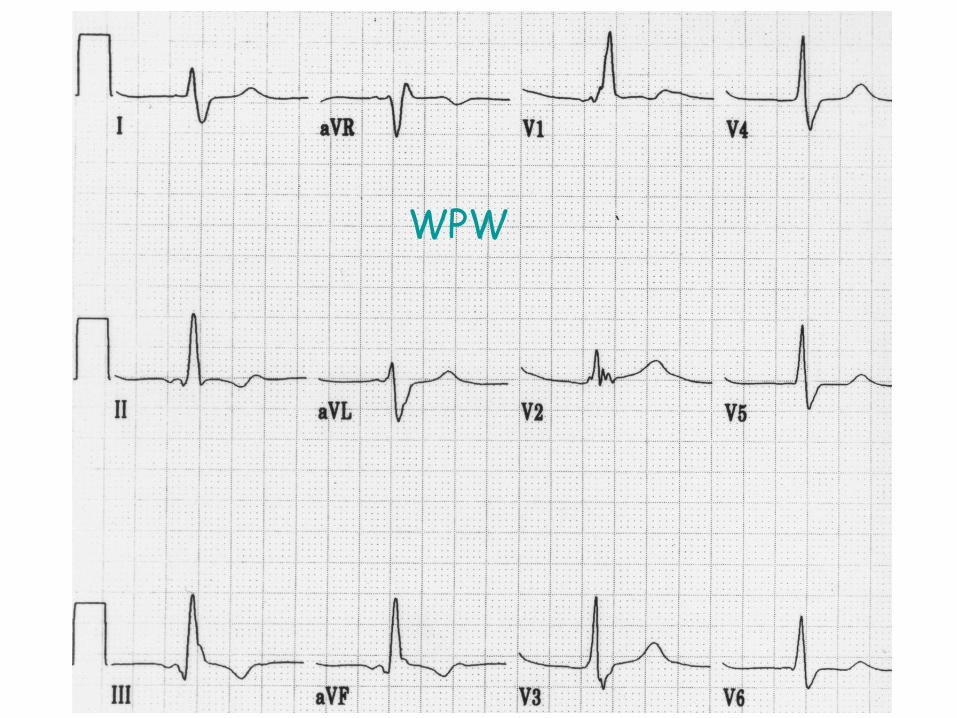
WPW

WPW
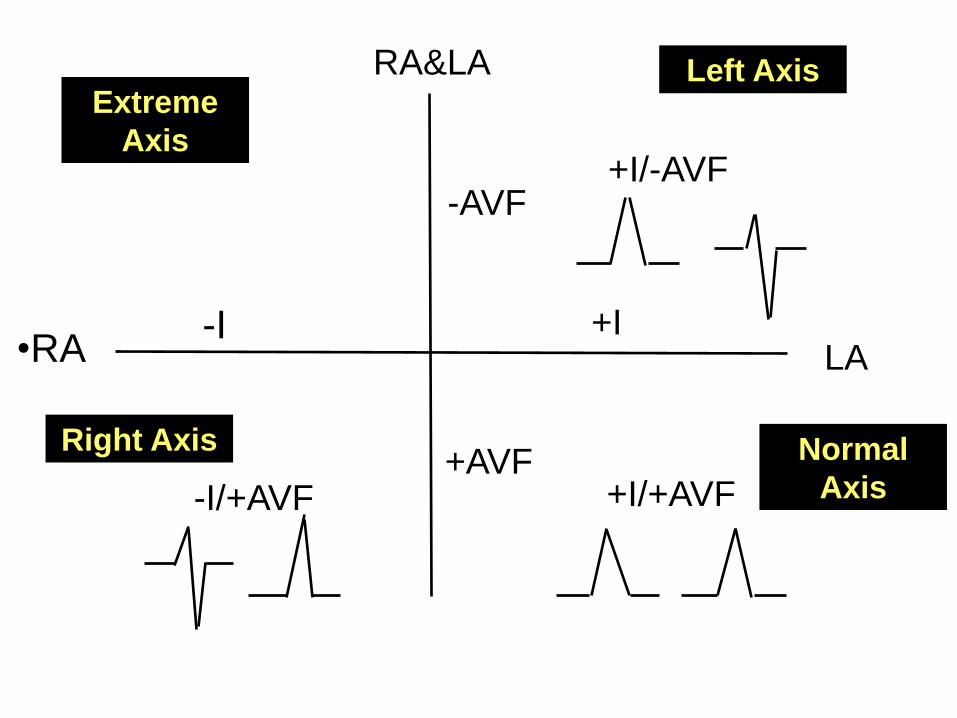
-I •RA LA
+I
+AVF
-AVF
RA&LA
+I/+AVF
+I/-AVF
-I/+AVF
Left Axis
Right Axis
Extreme
Axis
Normal
Axis
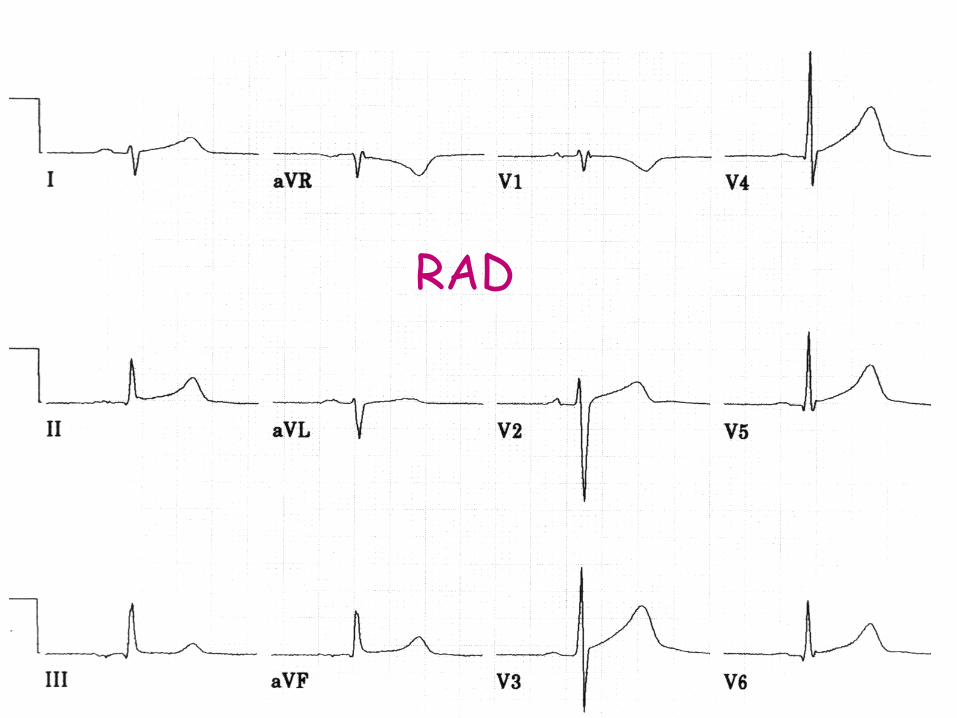
RAD
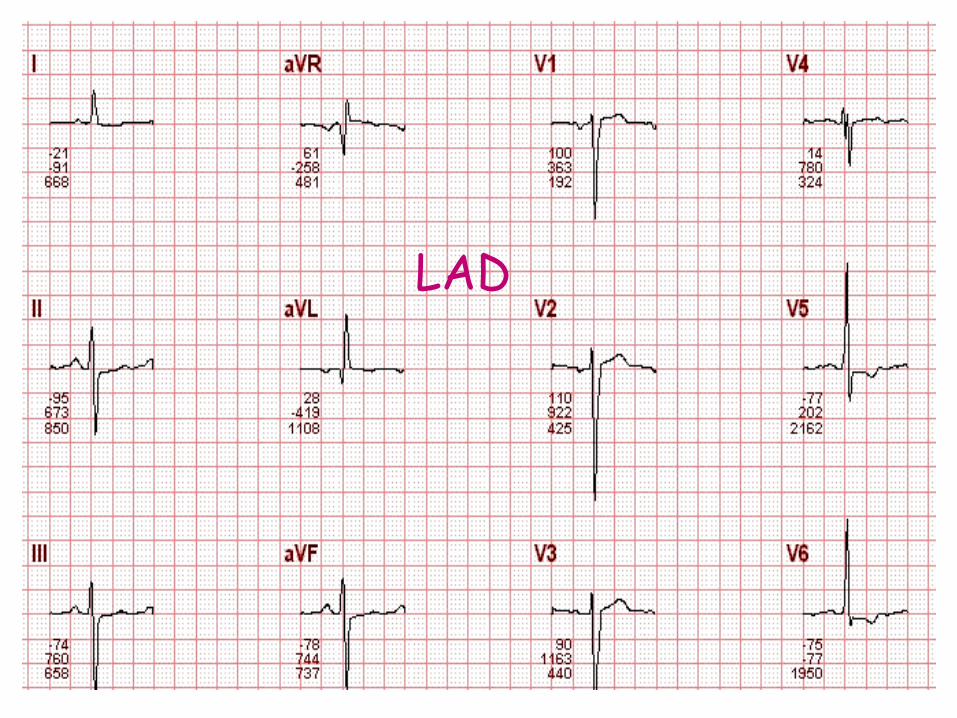
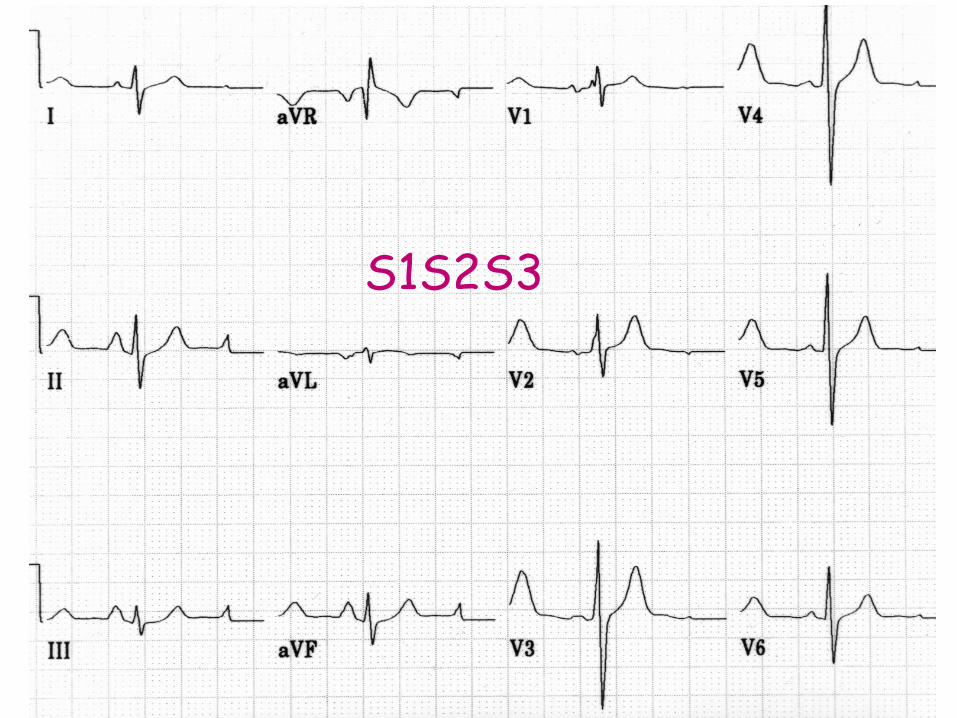
S1S2S3
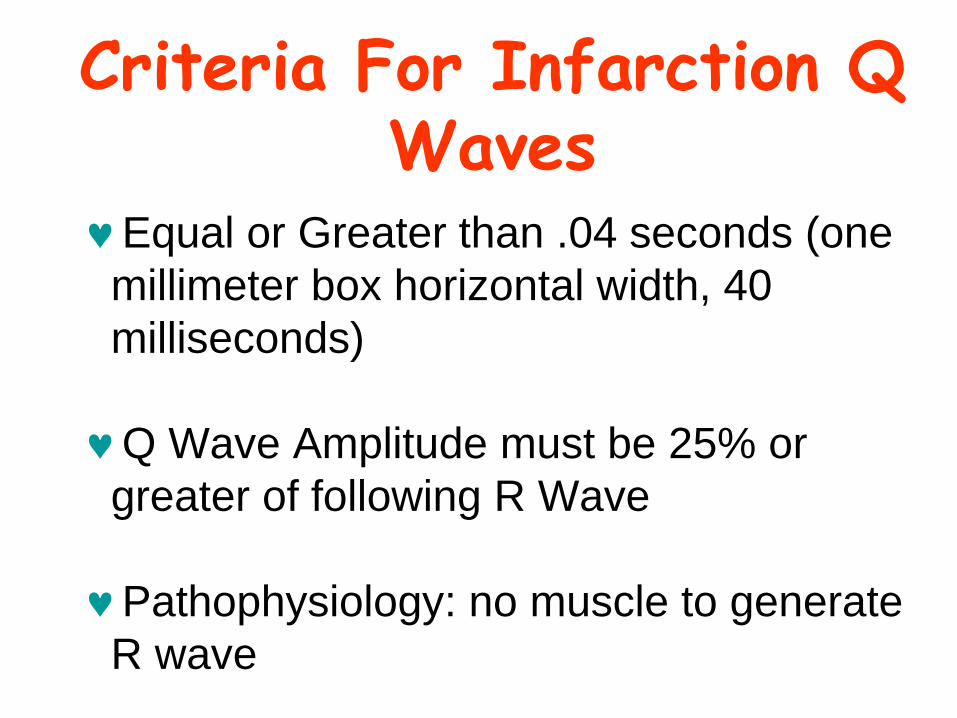
Criteria For Infarction Q Waves
Equal or Greater than .04 seconds (one
millimeter box horizontal width, 40
milliseconds)
Q Wave Amplitude must be 25% or
greater of following R Wave
Pathophysiology: no muscle to generate
R wave


Basic Principles of ECG Interpretation
Place electrodes correctly (??)
Be Careful to Get Correct Data
Consider Clinical Context/Setting Chest pain? … consider ST segments
Compare to Previous ECG
Be Systematic Rate, Rhythm, ?Pacemaker Spikes
QRS duration, Other intervals
Axis
Q waves
Pattern read
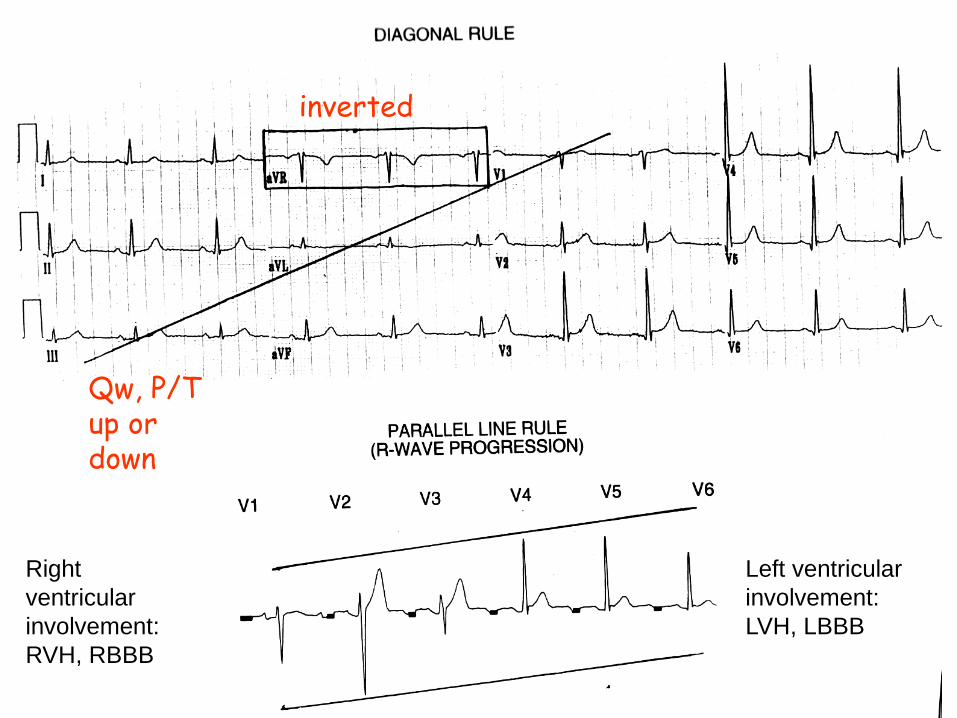
inverted
Qw, P/T up or down
Right
ventricular
involvement:
RVH, RBBB
Left ventricular
involvement:
LVH, LBBB

Pattern Reading of the ECG
Diagonal Line Rule box around aVR (everything inverted) line thru III, aVL, V1 every thing else upright
Parallel Line Rule R waves increase then drop off in V6 S waves decrease from greatest in V1 Rabbit ears on right side (V1-2) for RBBB, on left side for LBBB

The 5 Commandments of ECG
Interpretation
• Be systematic
• Put into the clinical context
• Find an old ECG
• Watch out for bad data
– Strive for good data
• Do NOT be afraid to get help
Watch out for bad data
Watch for bad data!!

RA/LA reversed
V1/V3 reversed
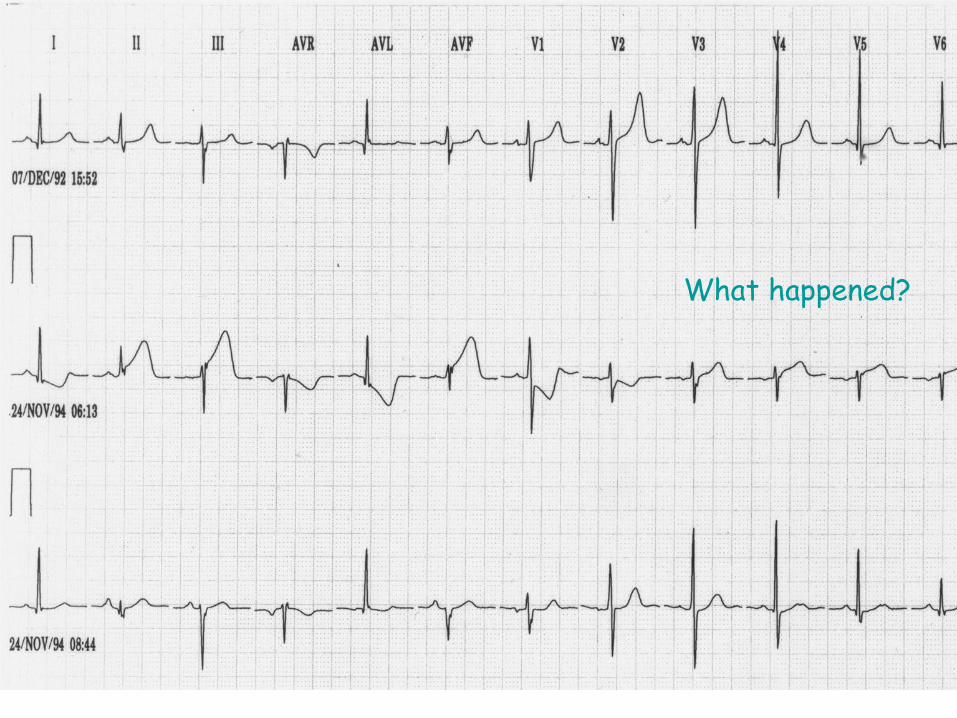
What happened?

Basic Principles of ECG Interpretation
Be Systematic Rate: Fast-Normal-Slow
Rhythm: Sinus, Blocks, Atrial, Ventricular
Axis: Normal, Right, Left
Intervals and Durations
Intervals and Durations: Short ? Long ?
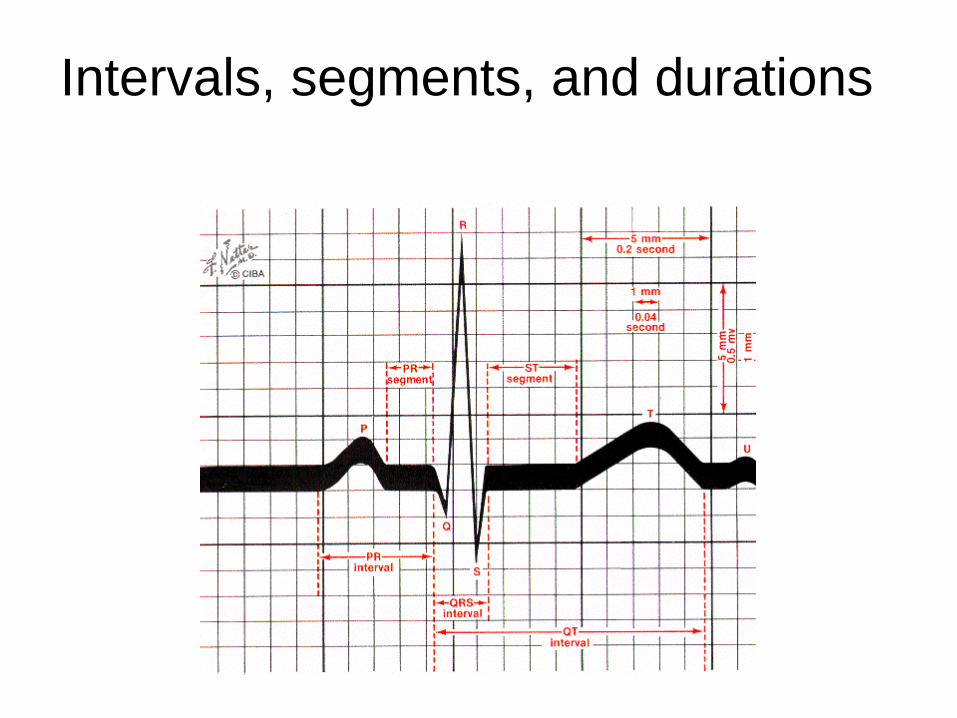
Intervals, segments, and durations

Intervals
QRS duration PR interval QT Interval Normal: .12-.20 sec
(3-5 small boxes) Normal: .07-
.10 sec
Normal (corrected for rate or QTc): .440-.470
sec
• QT Interval
• PR Interval
• QRS Duration

Intervals: Conduction
System Abnormalities
Congenital Syndromes
Electrolyte/Metabolic
Abnormalities
Intrinsic Cardiac Disease
Medications
CNS Disorders
Systemic Illnesses
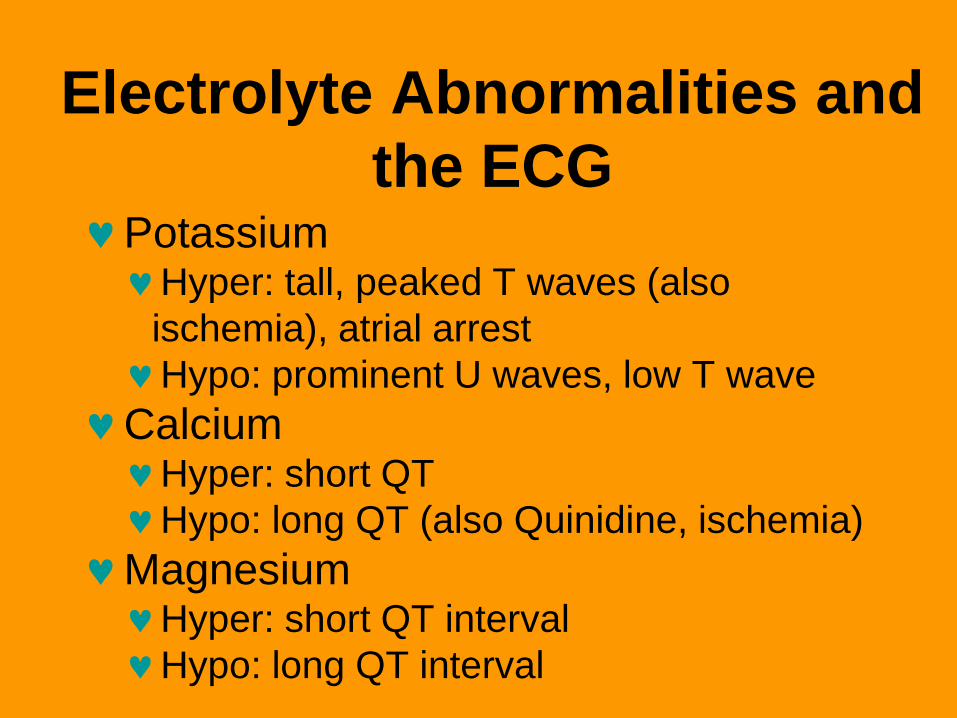
Electrolyte Abnormalities and
the ECG Potassium Hyper: tall, peaked T waves (also
ischemia), atrial arrest
Hypo: prominent U waves, low T wave
Calcium Hyper: short QT
Hypo: long QT (also Quinidine, ischemia)
Magnesium Hyper: short QT interval
Hypo: long QT interval
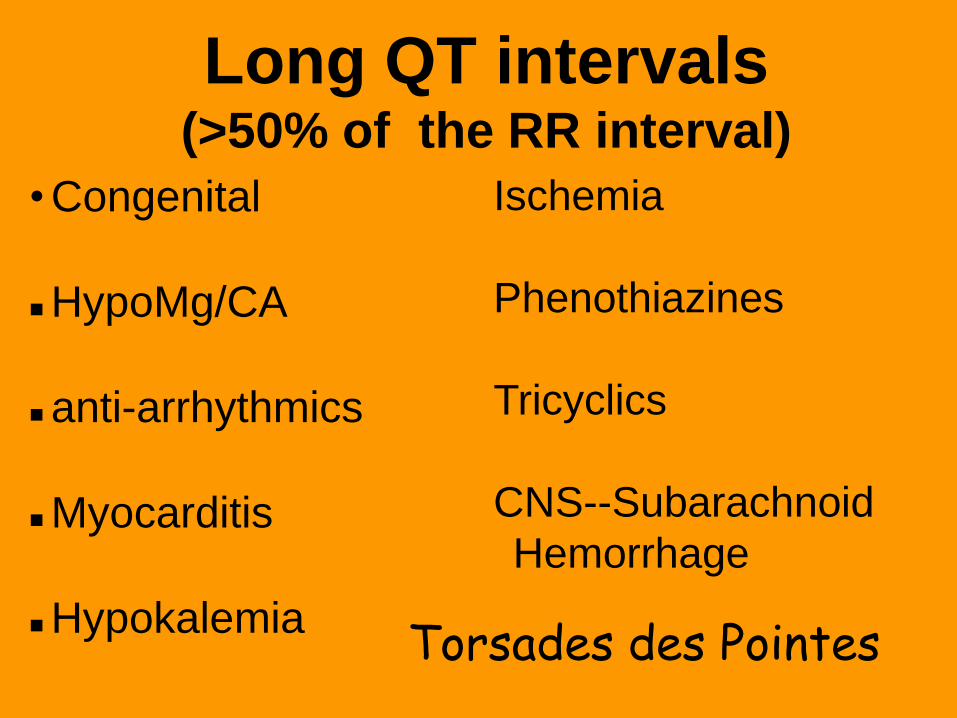
Long QT intervals (>50% of the RR interval)
• Congenital
HypoMg/CA
anti-arrhythmics
Myocarditis
Hypokalemia
Ischemia
Phenothiazines
Tricyclics
CNS--Subarachnoid
Hemorrhage
Torsades des Pointes
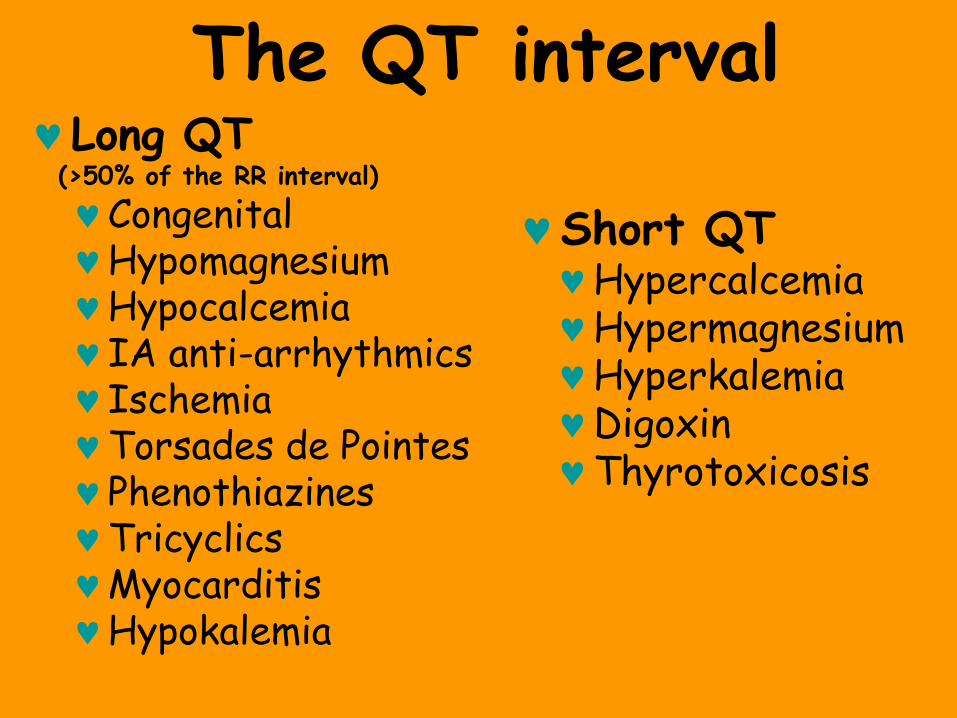
The QT interval Long QT (>50% of the RR interval)
Congenital Hypomagnesium Hypocalcemia IA anti-arrhythmics Ischemia Torsades de Pointes Phenothiazines Tricyclics Myocarditis Hypokalemia
Short QT Hypercalcemia Hypermagnesium Hyperkalemia Digoxin Thyrotoxicosis


Other Patterns
• Atrial Abnormalities
• R>S V1
http://medstat.med.utah.edu
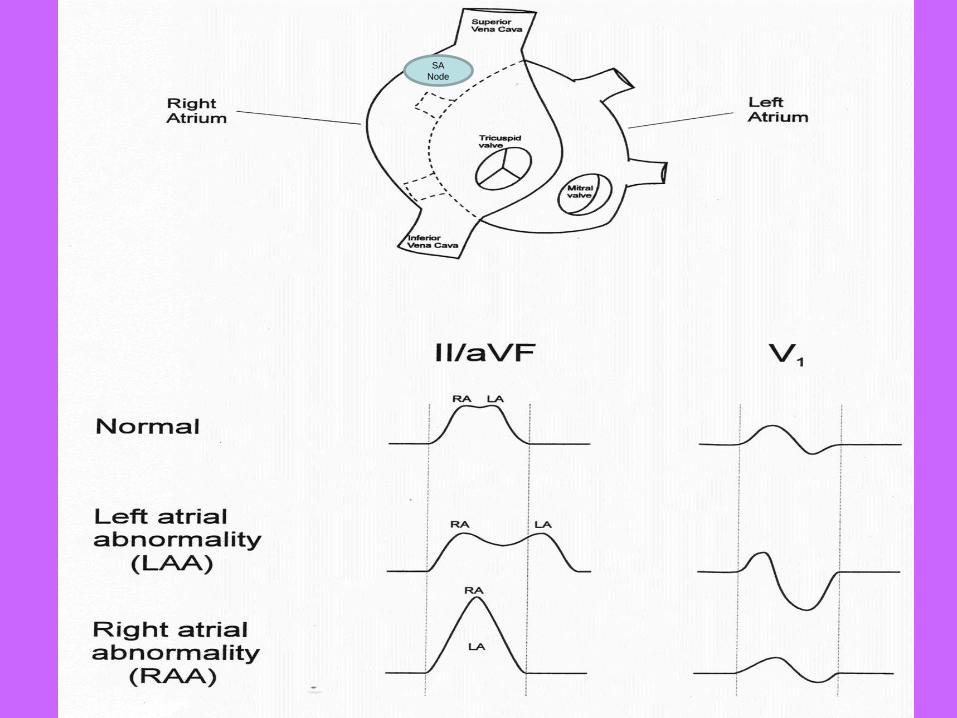
SA
Node
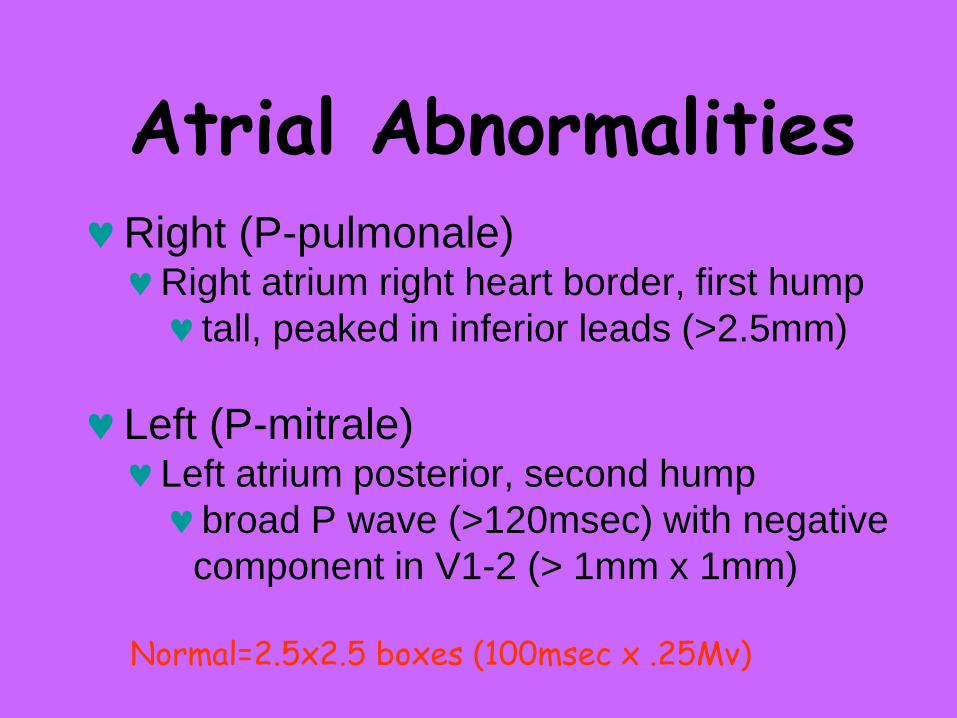
Atrial Abnormalities Right (P-pulmonale) Right atrium right heart border, first hump
tall, peaked in inferior leads (>2.5mm)
Left (P-mitrale) Left atrium posterior, second hump
broad P wave (>120msec) with negative
component in V1-2 (> 1mm x 1mm)
Normal=2.5x2.5 boxes (100msec x .25Mv)
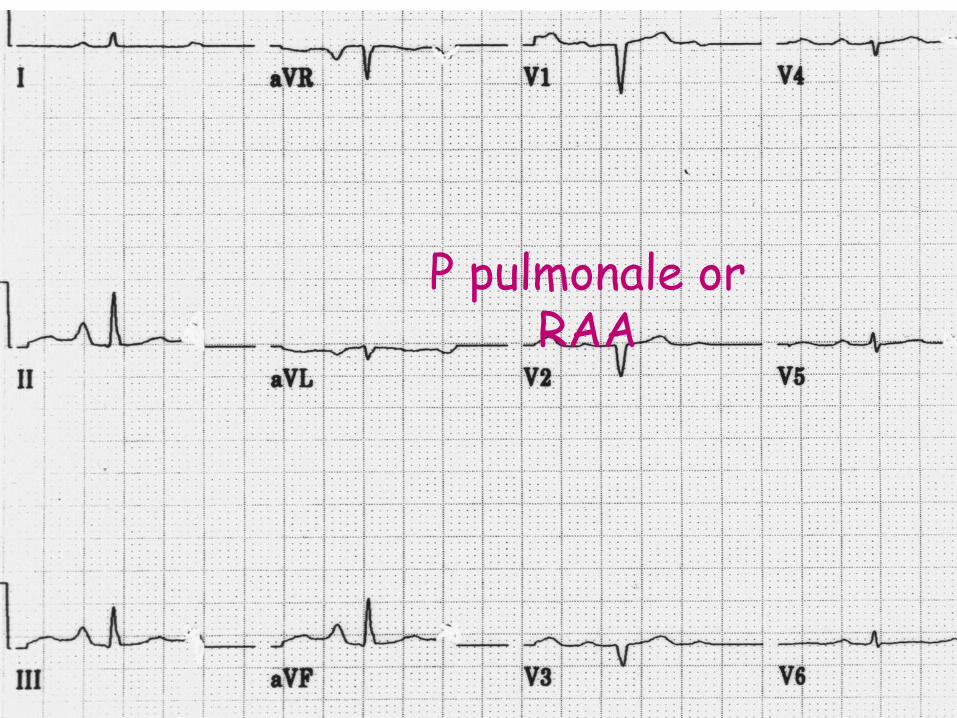
P pulmonale or RAA

P mitrale or LAA

0.0
0.2
0.4
0.6
0.8
1.0
0.0 2.0 4.0 6.0 8.0 10.0
Survival Plot
FUpYears
Surv
ival
a. LAA (-), P duration <120ms n=33,827 (1.3%)
b. LAA (-), P duration >120ms n=4,476 (2.0%)
c. LAA (+), P duration <120ms n=1,273 (3.5%)
d. LAA (+), P duration >120ms n=407 (4.7%)
Computerized LAA with/without P wave prolongation S
urv
ival
Years Follow up

R>S V1 RVH RBBB Inferior Posterior MI WPW Normal Variant