annual report 2010annual report 2010ccc.illinois.edu/s/2010_presentations/06_seong-mook cho...annual...
TRANSCRIPT
ANNUAL REPORT 2010ANNUAL REPORT 2010UIUC, August 12, 2010
Clogging Effects on
Asymmetric Flow and Vortex Formation
Seong-Mook Cho, Seon-Hyo KimDepartment of Materials Science and Engineering
Pohang University of Science and Technology
Rajneesh Chaudhary, Brian G. ThomasDepartment of Mechanical Science and EngineeringDepartment of Mechanical Science and Engineering
University of Illinois at Urbana-Champaign
Pohang University of Science and Technology •Materials Science and Engineering •Seong-Mook Cho •1
Research Scope
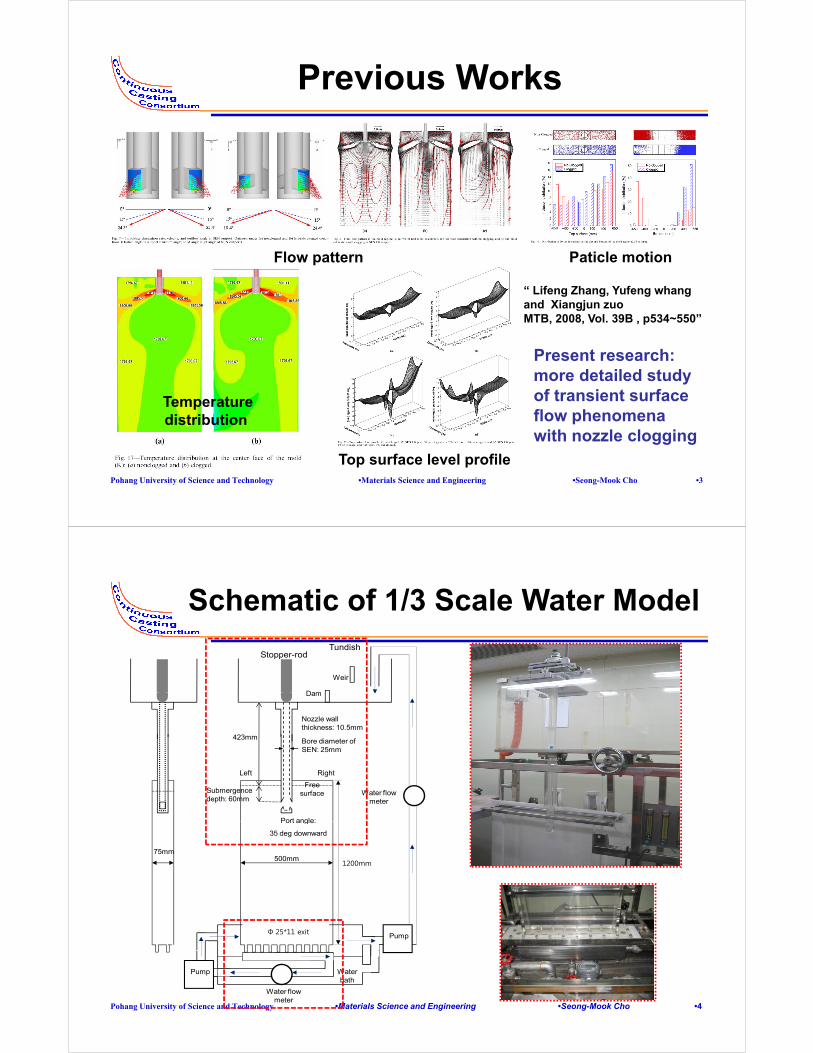
- Nozzle clogging influences asymmetric flow causing problems:
Vortex formation: can entrap mold flux andVortex formation: can entrap mold flux and cause defects in slab casterLevel fluctuation near NFs: disturbs the formation of the initial solidifying shell
- Objective: studying effect of asymmetric flow caused by nozzle clogging on:
mold flow pattern (computational model)mold flow pattern (computational model)surface velocity vortex formation frequency level fluctuation
ClogBack flow
- Methodology: water model experiments to quantify surface flow, vortex formation and level fluctuationNozzle clogging at
Pohang University of Science and Technology •Materials Science and Engineering •Seong-Mook Cho •2
flow, vortex formation and level fluctuation computational model to explain the flow pattern.
Nozzle clogging at recirculation region of port
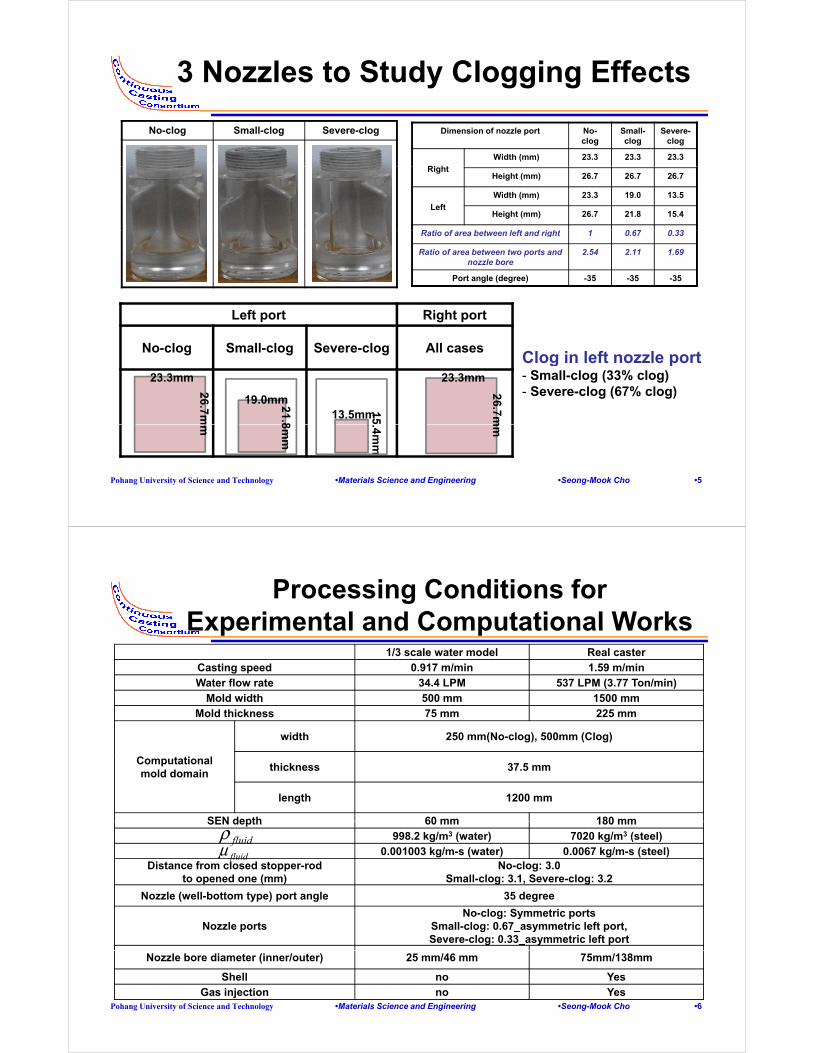
Previous Works
“ Lifeng Zhang, Yufeng whang
Flow pattern Paticle motion
g g, g gand Xiangjun zuoMTB, 2008, Vol. 39B , p534~550”
Present research:
Temperature distribution
Present research:more detailed study of transient surface flow phenomena
Pohang University of Science and Technology •Materials Science and Engineering •Seong-Mook Cho •3
distribution
Top surface level profile
with nozzle clogging
Schematic of 1/3 Scale Water Model Tundish
Stopper-rod
Dam
Weir
Bore diameter of SEN: 25mm
Dam
423mm
Nozzle wall thickness: 10.5mm
Free surfaceSubmergence
depth: 60mmWater flow
meter
Left Right
Port angle:
500mm75mm
1200mm
Port angle:
35 deg downward
PumpФ 25*11 exit
Water flow meter
Pump Water bath
Pohang University of Science and Technology •Materials Science and Engineering •Seong-Mook Cho •4
3 Nozzles to Study Clogging Effects
Dimension of nozzle port No-clog
Small-clog
Severe-clog
Ri ht
Width (mm) 23.3 23.3 23.3
No-clog Small-clog Severe-clog
RightHeight (mm) 26.7 26.7 26.7
Left
Width (mm) 23.3 19.0 13.5
Height (mm) 26.7 21.8 15.4
R ti f b t l ft d i ht 1 0 67 0 33Ratio of area between left and right 1 0.67 0.33
Ratio of area between two ports and nozzle bore
2.54 2.11 1.69
Port angle (degree) -35 -35 -35
Left port Right port
No-clog Small-clog Severe-clog All casesClog in left nozzle port
23.3mm
26.7m
23.3mm
26.7m
19.0mm21.8 13.5mm
15
Clog in left nozzle port- Small-clog (33% clog)- Severe-clog (67% clog)
Pohang University of Science and Technology •Materials Science and Engineering •Seong-Mook Cho •5
mmm 8m
m
.4mm
Processing Conditions for Experimental and Computational WorksExperimental and Computational Works
1/3 scale water model Real caster
Casting speed 0.917 m/min 1.59 m/min
Water flow rate 34.4 LPM 537 LPM (3.77 Ton/min)
Mold width 500 mm 1500 mm
Mold thickness 75 mm 225 mm
C t ti l
width 250 mm(No-clog), 500mm (Clog)
Computational mold domain
thickness 37.5 mm
length 1200 mm
SEN depth 60 mm 180 mmSEN depth 60 mm 180 mm
998.2 kg/m3 (water) 7020 kg/m3 (steel)
0.001003 kg/m-s (water) 0.0067 kg/m-s (steel)Distance from closed stopper-rod
to opened one (mm)No-clog: 3.0
Small-clog: 3.1, Severe-clog: 3.2
fluidρfluidμ
Nozzle (well-bottom type) port angle 35 degree
Nozzle portsNo-clog: Symmetric ports
Small-clog: 0.67_asymmetric left port, Severe-clog: 0.33_asymmetric left port
Pohang University of Science and Technology •Materials Science and Engineering •Seong-Mook Cho •6
Nozzle bore diameter (inner/outer) 25 mm/46 mm 75mm/138mm
Shell no Yes
Gas injection no Yes

Sensors for Measurements
Electromagnetic current sensor
Electromagnetic current sensor
Ultrasonic displacement
Specifications
Ultrasonic displacement sensors
current sensorsensor
Response time
1Hz 20Hz
Collecting data 1Hz 1Hzdata
frequency1Hz 1Hz
Collecting data time
1000sec 1000sec
Sensor head
dimension20mm 30mm
< Sensors in water model>
Measuringdirection
X,Y vector components
Vertical direction to sensor head
8mm 10mm
Pohang University of Science and Technology •Materials Science and Engineering •Seong-Mook Cho •7
< Sensors in water model>- 1 Electromagnetic current sensor for measuring surface flow velocity
- 2 Ultrasonic displacement sensors for measuring level fluctuations
Computational Model
- Single-phase flowSteady-state, 3-D and incompressible Navier-Stokes equations f t tifor momentum conservationStandard turbulence model for simulating time-averaged turbulent fluid flowUsing Fluent
εk −
Using Fluent
- Domain and convergence1/3 scale water model geometry1/3 scale water model geometryCombined computational domain of nozzle and mold assuming symmetrical flow (no-clog: quarter domain, clog: half domain)Hexa-cells used in the computational domain to model turbulent pnozzle and mold flow (no-clog: 0.107 million, small-clog: 0.205 million, severe-clog: 0.203 million)Convergence in almost all cases until scaled residuals were
Pohang University of Science and Technology •Materials Science and Engineering •Seong-Mook Cho •8
reduced to stable 410−

Geometry, Mesh and Boundary Conditions
No-clog Small-clog Severe-clog
0.175m 0.35m
ou da y Co d t o s
Velocity inlet:
0.35m
0.001195m/secinput to cylinder surfaces
0.423m
0.25m 0.50m
1.2m
Pohang University of Science and Technology •Materials Science and Engineering •Seong-Mook Cho •9
Pressure outlet: 0 Pa
Asymmetric Flow in the SEN with Nozzle Cloggingwith Nozzle Clogging
No-clog Small-clog Severe-clog
High t
High t momentum
flowmomentum
flow
No Back flow No back flow,
Spread jet 50% 75%25%52%48%
Pohang University of Science and Technology •Materials Science and Engineering •Seong-Mook Cho •10
- Nozzle port clogging causes asymmetric flow in a nozzle
50% 75%25%52%48%Flow rate ratio

Equations to Calculate Jet Characteristics
Weighted average velocity of each component
Vertical jet angle (degree) average jet speed
Weighted average turbulent kinetic energy Weighted average turbulent kinetic energy dissipation rate
Back flow zone fraction
“ Hua Bai and Brian G. Thomas, MTB, 2001, Vol. 32B , No. 2”
Pohang University of Science and Technology •Materials Science and Engineering •Seong-Mook Cho •11
Rate)(Flow QSpeed)Jet (Averaged UForce)(Jet F jetjetjet ×=
Jet Characteristics No-clog Small-clog Severe-clog
Left Right Left Right Left Right
Weighted average nozzle port velocity in x-Weighted average nozzle port velocity in x-direction (Outward) (m/sec)
0.450 0.451 0.568 0.550 0.542 0.636
Weighted average nozzle port velocity in y-direction (Horizontal) (m/sec)
0.042 0.042 0.017 0.009 0.022 0.015
Weighted average nozzle port velocity in z-di ti (D d) ( / )
0.315 0.315 0.343 0.404 0.327 0.497direction (Downward) (m/sec)
0.315 0.315 0.343 0.404 0.327 0.497
Vertical jet angle (degree) -35.0 -35.0 -31.2 -36.4 -31.1 -38.0
Horizontal jet angle (degree) 0 0 0 0 0 0
Average jet speed(m/sec) 0.55 0.55 0.66 0.68 0.63 0.81
Flow rate (kg/sec) 0.286 0.286 0.276 0.296 0.145 0.427
Averaged jet force (N) 0 157 0 157 0 182 0 201 0 091 0 346Averaged jet force (N) 0.157 0.157 0.182 0.201 0.091 0.346
Maximum velocity magnitude (m/sec) 0.98 0.98 1.10 1.17 0.87 1.28
Weighted average turbulent kinetic energy(m2/s2)
0.022 0.022 0.043 0.020 0.033 0.019
Pohang University of Science and Technology •Materials Science and Engineering •Seong-Mook Cho •12
gy( )
Weighted average turbulent kinetic energy dissipation rate (m2/s3)
0.782 0.783 2.12 0.797 1.47 0.731
Back-flow zone (%) 17.2 17.2 0 16.9 0 17.2

Jet Velocity Profiles
At port outlet plane0.04
m) No-clog_L, R
0.03
e p
ort
bo
tto
m(m Small-clog_L
Small-clog_R Severe-clog_L Severe-clog_R
0.01
0.02
nce
fro
m n
ozz
le
Jet force (Flow rate): N (kg/sec)0.0 0.5 1.0 1.5
0.00
Dis
tan
Velocity magnitude(m/sec)
- Flow rate at clogged port decreases, but flow rate at non-clogged port increases
- Faster jet at non-clogged port than clogged port because of increasing flow rate
Left Right Total
No-clog 0.157 (0.286) 0.157 (0.286) 0.314 (0.572)
Small-clog 0.182 (0.276) 0.201 (0.296) 0.383 (0.572)
Pohang University of Science and Technology •Materials Science and Engineering •Seong-Mook Cho •13
g- Increased flow rate and velocity magnitude induce
higher jet force
Small clog 0.182 (0.276) 0.201 (0.296) 0.383 (0.572)
Severe-clog 0.091 (0.145) 0.346 (0.427) 0.437 (0.572)
Asymmetric Flow in the Mold with Nozzle Clogginggg g
No-clog Small-clog Severe-clog
S dSpread jet Faster
jet
< m/sec >
N l l i t i fl i ld (U b l d d bl ll tt )
high speed of downward flow
Pohang University of Science and Technology •Materials Science and Engineering •Seong-Mook Cho •14
- Nozzle clogging causes asymmetric flow in a mold (Unbalanced double roll pattern)- With clogged nozzle, surface flow from right side cross the surface and suppress the uprising flow from left NF
- In severe-clog case, it is possible for inclusions to penetrate deeply down into a mold
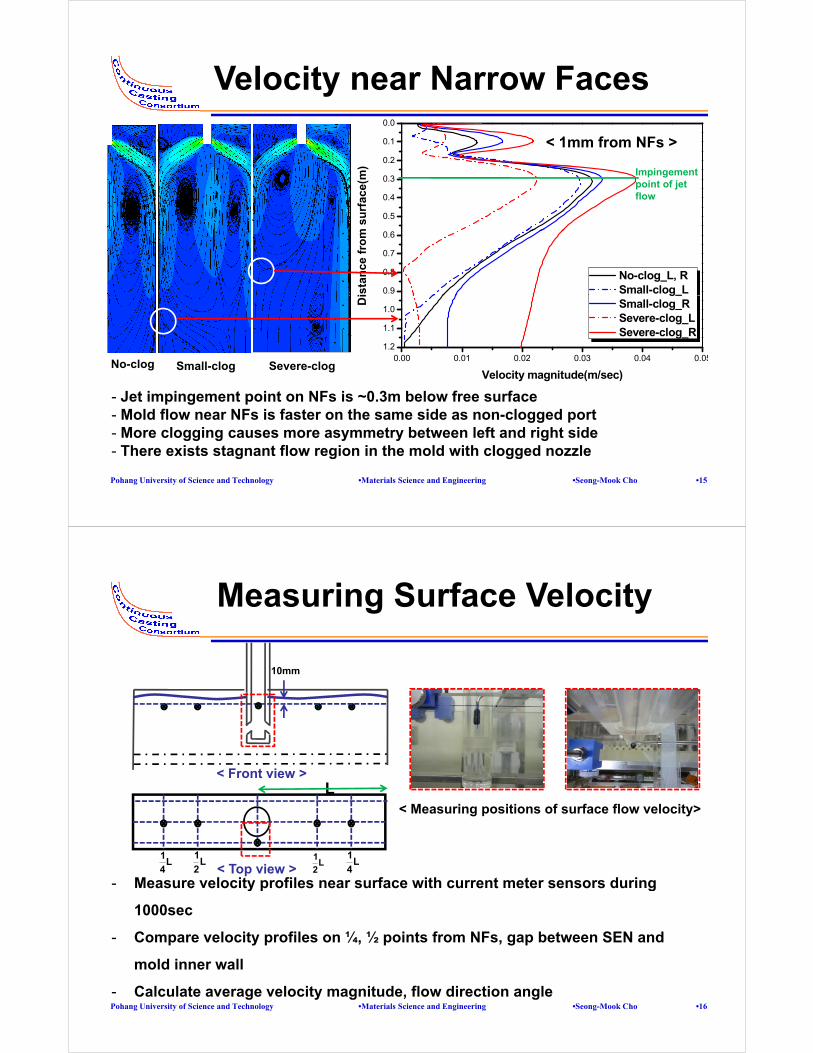
Velocity near Narrow Faces
0.2
0.1
0.0
< 1mm from NFs >
0.5
0.4
0.3
m s
urf
ace(
m) Impingement
point of jet flow
0.9
0.8
0.7
0.6
ista
nce
fro
m
No-clog_L, R Small-clog_L
0 00 0 01 0 02 0 03 0 04 0 051.2
1.1
1.0
Di g_
Small-clog_R Severe-clog_L Severe-clog_R
N l0.00 0.01 0.02 0.03 0.04 0.05
Velocity magnitude(m/sec)
- Jet impingement point on NFs is ~0.3m below free surface- Mold flow near NFs is faster on the same side as non-clogged port
No-clog Small-clog Severe-clog
Pohang University of Science and Technology •Materials Science and Engineering •Seong-Mook Cho •15
- More clogging causes more asymmetry between left and right side- There exists stagnant flow region in the mold with clogged nozzle
Measuring Surface Velocity
10mm
< Measuring positions of surface flow velocity>
L< Front view >
L2
1L
4
1L
2
1 L4
1
- Measure velocity profiles near surface with current meter sensors during< Top view >
Measure velocity profiles near surface with current meter sensors during
1000sec
- Compare velocity profiles on ¼, ½ points from NFs, gap between SEN and
Pohang University of Science and Technology •Materials Science and Engineering •Seong-Mook Cho •16
mold inner wall
- Calculate average velocity magnitude, flow direction angle

Quantifying Averaged Surface Velocity Vector
Outside +y axis
Flow direction angle
θ Right NF
Left NF
+x axis
g
Inside1/2 1/41/21/4x axis
Determining the flow direction angle from averaged velocity componentsDetermining the flow direction angle from averaged velocity components
Quantifying vector-averaged surface flow with flow direction angle and velocity magnitude
Pohang University of Science and Technology •Materials Science and Engineering •Seong-Mook Cho •17
Averaged Surface Flow Pattern (Experimental Results)(Experimental Results)
OR 0.1m/secMeasured at 10mm from free surface and averaged for 1000sec
No clog IR
NF NF0.090
0.012 0.057 0.0950.053
1/4 1/2 1/2 1/4No-clog IR
OR
NF NF
1/4 1/2 1/2 1/4
Small-clog IR
NF NF
0.1290.0650.0180.066 0.037
OR
NF NF
Pohang University of Science and Technology •Materials Science and Engineering •Seong-Mook Cho •18
Severe-clog IR
0.1690.1300.085
0.0040.026

Speed & Direction Variation with No-Clog NozzleNo Clog Nozzle
0.35
0.40
0.45
0.50
Velocity magnitude(m/sec) Flow direction angle(degree)
m/s
ec)
60
80
100
120
140
160
180
deg
ree)
0.35
0.40
0.45
0.50
Velocity magnitude(m/sec) Flow direction angle(degree)
m/s
ec)
60
80
100
120
140
160
180
deg
ree)
Left_1/4 Right_1/4
0 10
0.15
0.20
0.25
0.30
Vel
oci
ty m
agn
itu
de(
m
-100
-80
-60
-40
-20
0
20
40
60
ow
dir
ecti
on
an
gle
(d
0.10
0.15
0.20
0.25
0.30
Vel
oci
ty m
agn
itu
de(
m
120
-100
-80
-60
-40
-20
0
20
40
60
low
dir
ecti
on
an
gle
(d
0 100 200 300 400 500 600 700 800 900 10000.00
0.05
0.10
Time(sec)
V
-180
-160
-140
-120 Flo
0 100 200 300 400 500 600 700 800 900 10000.00
0.05
Time(sec)
V
-180
-160
-140
-120 Fl
0.50
Velocity magnitude(m/sec) 160
180 0.50
Velocit magnit de(m/sec) 160
180
Left 1/2 Right 1/2
0.25
0.30
0.35
0.40
0.45 Velocity magnitude(m/sec) Flow direction angle(degree)
agn
itu
de(
m/s
ec)
20
0
20
40
60
80
100
120
140
160
on
an
gle
(deg
ree
)
0.25
0.30
0.35
0.40
0.45 Velocity magnitude(m/sec) Flow direction angle(degree)
gn
itu
de(
m/s
ec)
0
20
40
60
80
100
120
140
160
on
an
gle
(deg
ree)
Left_1/2 Right_1/2
0 100 200 300 400 500 600 700 800 900 10000.00
0.05
0.10
0.15
0.20
Vel
oci
ty m
a
-180
-160
-140
-120
-100
-80
-60
-40
-20
Flo
w d
irec
tio
0.00
0.05
0.10
0.15
0.20
Vel
oci
ty m
ag
-180
-160
-140
-120
-100
-80
-60
-40
-20
Flo
w d
irec
tio
Pohang University of Science and Technology •Materials Science and Engineering •Seong-Mook Cho •19
0 100 200 300 400 500 600 700 800 900 1000
Time(sec)0 100 200 300 400 500 600 700 800 900 1000
Time(sec)
- Surface flow becomes slower and more chaotic toward SEN
Speed & Direction Variation with Small-Clog NozzleSmall Clog Nozzle
0.35
0.40
0.45
0.50
Velocity magnitude(m/sec) Flow direction angle(degree)
m/s
ec)
60
80
100
120
140
160
180
deg
ree)
0.35
0.40
0.45
0.50
Velocity magnitude(m/sec) Flow direction angle(degree)
m/s
ec)
60
80
100
120
140
160
180
(deg
ree)
Left_1/4 Right_1/4
0 10
0.15
0.20
0.25
0.30
elo
city
mag
nit
ud
e(m
-100
-80
-60
-40
-20
0
20
40
60
low
dir
ecti
on
an
gle
(
0.10
0.15
0.20
0.25
0.30
elo
city
mag
nit
ud
e(m
-100
-80
-60
-40
-20
0
20
40
60
low
dir
ecti
on
an
gle
(
0 100 200 300 400 500 600 700 800 900 10000.00
0.05
0.10
Time(sec)
Ve
-180
-160
-140
-120 Fl
0 100 200 300 400 500 600 700 800 900 10000.00
0.05
0.10
Time(sec)
Ve
-180
-160
-140
-120 F
0.50
Velocity magnitude(m/sec) 160
180
0.45
0.50
Velocity magnitude(m/sec)Fl di ti l (d ) 140
160
180
Left 1/2 Right 1/2
0.25
0.30
0.35
0.40
0.45y g ( )
Flow direction angle(degree)
agn
itu
de(
m/s
ec)
-20
0
20
40
60
80
100
120
140
on
an
gle
(deg
ree)
0 20
0.25
0.30
0.35
0.40
0.45 Flow direction angle(degree)
agn
itu
de(
m/s
ec)
-20
0
20
40
60
80
100
120
140
tio
n a
ng
le(d
egre
e)
Left_1/2 g _
0 100 200 300 400 500 600 700 800 900 10000.00
0.05
0.10
0.15
0.20
Vel
oci
ty m
a
-180
-160
-140
-120
-100
-80
-60
-40
-20
Flo
w d
irec
tio
0 100 200 300 400 500 600 700 800 900 10000.00
0.05
0.10
0.15
0.20
Vel
oc
ity
ma
-180
-160
-140
-120
-100
-80
-60
-40
Flo
w d
irec
t
Pohang University of Science and Technology •Materials Science and Engineering •Seong-Mook Cho •20
0 100 200 300 400 500 600 700 800 900 1000
Time(sec)
0 100 200 300 400 500 600 700 800 900 1000
Time(sec)
- Surface flow from right NF is faster and more consistent than left NF- Surface flow at the left (slower) side is more chaotic than right side
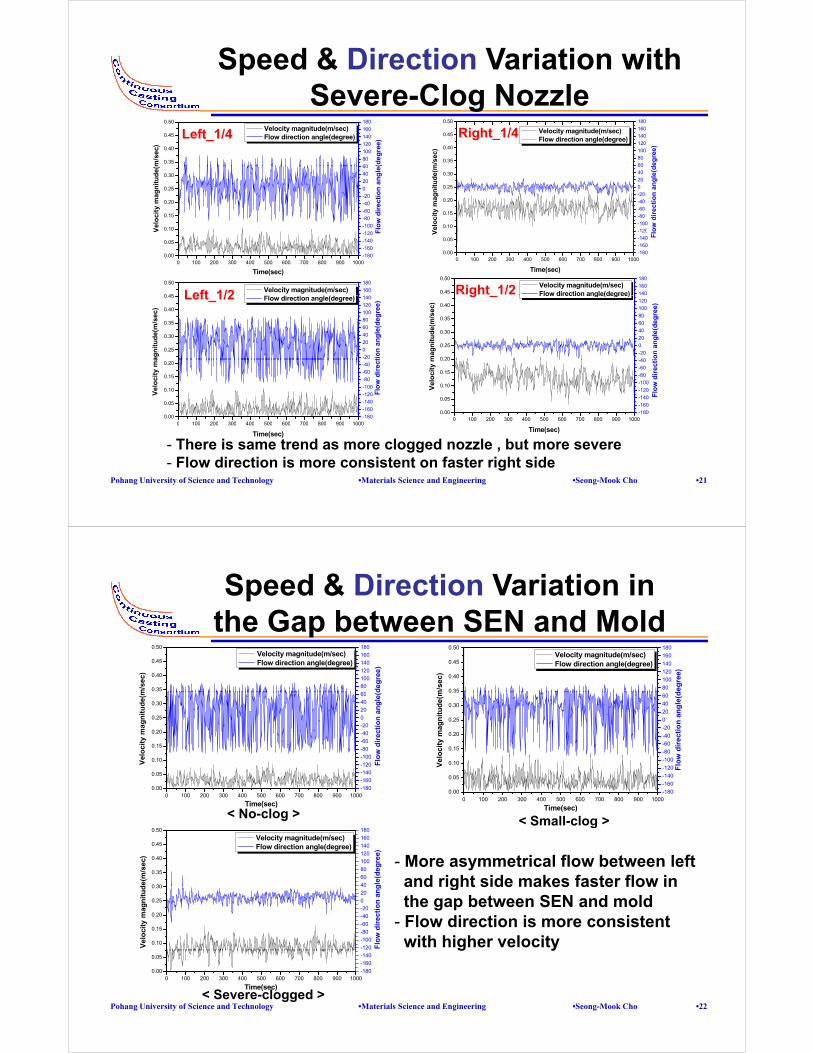
Speed & Direction Variation with Severe-Clog NozzleSevere Clog Nozzle
0.35
0.40
0.45
0.50
Velocity magnitude(m/sec) Flow direction angle(degree)
m/s
ec)
60
80
100
120
140
160
180
(de
gre
e)
0.35
0.40
0.45
0.50
Velocity magnitude(m/sec) Flow direction angle(degree)
m/s
ec)
60
80
100
120
140
160
180
deg
ree)
Left_1/4 Right_1/4
0.10
0.15
0.20
0.25
0.30
Vel
oci
ty m
agn
itu
de(
m
-100
-80
-60
-40
-20
0
20
40
60
Flo
w d
irec
tio
n a
ng
le(
0.10
0.15
0.20
0.25
0.30
Vel
oci
ty m
agn
itu
de(
m
120
-100
-80
-60
-40
-20
0
20
40
60
ow
dir
ecti
on
an
gle
(d
0 100 200 300 400 500 600 700 800 900 10000.00
0.05
Time(sec)
V
-180
-160
-140
-120 F
0 100 200 300 400 500 600 700 800 900 10000.00
0.05
Time(sec)
V
-180
-160
-140
-120
Flo
0 45
0.50
Velocity magnitude(m/sec) 160
180
0.45
0.50
Velocity magnitude(m/sec)Flow direction angle(degree) 140
160
180
Left 1/2 Right 1/2
0.25
0.30
0.35
0.40
0.45 Flow direction angle(degree)
ag
nit
ud
e(m
/sec
)
-20
0
20
40
60
80
100
120
140
tio
n a
ng
le(d
egre
e)
0.20
0.25
0.30
0.35
0.40
Flow direction angle(degree)
mag
nit
ud
e(m
/sec
)
40
-20
0
20
40
60
80
100
120
ion
an
gle
(deg
ree)
Left_1/2 g _
0 100 200 300 400 500 600 700 800 900 10000.00
0.05
0.10
0.15
0.20
Vel
oci
ty m
a
-180
-160
-140
-120
-100
-80
-60
-40
Flo
w d
irec
t
0 100 200 300 400 500 600 700 800 900 10000.00
0.05
0.10
0.15
0.20
Vel
oci
ty m
-180
-160
-140
-120
-100
-80
-60
-40
Flo
w d
irec
ti
Pohang University of Science and Technology •Materials Science and Engineering •Seong-Mook Cho •21
0 100 200 300 400 500 600 700 800 900 1000
Time(sec)Time(sec)
- There is same trend as more clogged nozzle , but more severe- Flow direction is more consistent on faster right side
Speed & Direction Variation in the Gap between SEN and Moldthe Gap between SEN and Mold
0.35
0.40
0.45
0.50
Velocity magnitude(m/sec) Flow direction angle(degree)
m/s
ec)
60
80
100
120
140
160
180
deg
ree)
0.35
0.40
0.45
0.50
Velocity magnitude(m/sec) Flow direction angle(degree)
m/s
ec)
80
100
120
140
160
180
deg
ree)
0.15
0.20
0.25
0.30
elo
city
mag
nit
ud
e(m
100
-80
-60
-40
-20
0
20
40
60
ow
dir
ecti
on
an
gle
(d
0.15
0.20
0.25
0.30
0.35
loci
ty m
agn
itu
de(
m
-80
-60
-40
-20
0
20
40
60
w d
irec
tio
n a
ng
le(d
0 100 200 300 400 500 600 700 800 900 10000.00
0.05
0.10
Time(sec)
Ve
-180
-160
-140
-120
-100
Flo
0 100 200 300 400 500 600 700 800 900 10000.00
0.05
0.10
Time(sec)
Vel
-180
-160
-140
-120
-100
Flo
w
< No-clog > < Small-clog >
0 30
0.35
0.40
0.45
0.50
Velocity magnitude(m/sec) Flow direction angle(degree)
de(
m/s
ec)
40
60
80
100
120
140
160
180
gle
(deg
ree)
- More asymmetrical flow between left and right side makes faster flow in
< Small-clog >
0.10
0.15
0.20
0.25
0.30
Ve
loci
ty m
agn
itu
d
-120
-100
-80
-60
-40
-20
0
20
40
Flo
w d
irec
tio
n a
ng and right side makes faster flow in
the gap between SEN and mold - Flow direction is more consistent with higher velocity
Pohang University of Science and Technology •Materials Science and Engineering •Seong-Mook Cho •22
0 100 200 300 400 500 600 700 800 900 10000.00
0.05
Time(sec)
-180
-160
-140
g y
< Severe-clogged >

Velocity Magnitude and
Turbulent Kinetic Energy (TKE)gy ( )
Velocity magnitudem/sec 22/secm
No-clog
TKE
No clogVelocity magnitude
TKE
Small-clog
TKE
V l it it dVelocity magnitude
TKE
Smaller vortex area, Severe
Pohang University of Science and Technology •Materials Science and Engineering •Seong-Mook Cho •23
Severe-clog
asymmetry
Surface Velocity Results (Prediction and Measurement)
Right Left
Outside
(Prediction and Measurement)
NFLeft NF
Inside1/2 1/41/21/410mm from surface
0.20
, , ,
No-clog Small-clog Severe-clog
Predicted
Measured
- Prediction well-matches with measurement - Nozzle clogging induces the asymmetric surface flow in a mold
0.15
nit
ud
e(m
/sec
)
SEN
surface flow in a mold- Surface flow at the same side as non-clogged port is faster than clogged port
- More asymmetry of flow between left and right id i d f t fl i th b t
0.05
0.10
Vel
oci
ty m
agn side induces faster flow in the gap between
SEN and mold- Surface flow at the ¼ region is faster than ½ region in measurement (slope of flow speed
Pohang University of Science and Technology •Materials Science and Engineering •Seong-Mook Cho •24
-0.25 -0.20 -0.15 -0.10 -0.05 0.00 0.05 0.10 0.15 0.20 0.250.00
Distance from center of mold(m)
g ( p pdecreasing is not so steep as prediction)

Comparison of Predicted Averaged Surface Velocity with Measured OneVelocity with Measured One
Left Gap between SEN and mold inner wall
Right
1/4 1/2 1/2 1/4
Velocity magnitude (m/sec)
mold inner wall1/4 1/2 1/2 1/4
No-clogPredicted 0.078 0.080 0.013 0.080 0.078
Measured 0.090 0.053 0.012 0.057 0.095
Small-clogPredicted 0.018 0.015 0.117 0.126 0.111
Measured 0.066 0.037 0.018 0.065 0.129
Severe-clogPredicted 0.032 0.033 0.180 0.167 0.142
Severe clogMeasured 0.026 0.004 0.085 0.130 0.169
- Model over-predicts experiments in the gap between SEN and mold inner wall; Standard model can’t accommodate flow speed with direction variation (Real turbulent flow decreases the averaged surface flow)
εk −(Real turbulent flow decreases the averaged surface flow)
- In severe-clog case, model predicts that surface flow from right side crosses the surface and suppresses the uprising flow from left NF
Pohang University of Science and Technology •Materials Science and Engineering •Seong-Mook Cho •25
- Computational model predicts the region of the fastest surface flows at ½ L region
Comparison of Predicted Turbulent Kinetic Energy (TKE) with Measured One
Left Gap between SEN and Right
Energy (TKE) with Measured One Turbulent kinetic energy ( )224 /secm10−
mold inner wall1/4 1/2 1/2 1/4
No-clogPredicted 2.30 1.77 0.414 1.77 2.30
Measured 5.05 6.18 5.42 5.29 5.46
Small-clogPredicted 0.620 0.920 3.79 3.40 5.65
Measured 6.38 9.59 10.8 9.63 6.53
Predicted 1.48 2.00 7.64 6.56 10.9Severe-clog
ed cted 8 00 6 6 56 0 9
Measured 4.42 7.32 8.20 6.21 5.19
- Measured TKE is greater than predicted one; anisotropy of real turbulence; directional variation of surface flow affects TKE together with speed variation
- Vortexing flow pattern causes higher turbulent kinetic energy at left region near SEN in measurement
Pohang University of Science and Technology •Materials Science and Engineering •Seong-Mook Cho •26

Counting Vortex Formation
1 2
Outside
RightLeft
4 3
SEN
Inside
Right NF
Left NF
-Visualization of vortex formation:
Scatter sesame seeds (tracer particles) at surface of water-model mold
Record videos and take picturesRecord videos and take pictures
- Counting vortex formation
Divide the four region near SEN
1 4 2 3
Count the number of each region in a time interval
( Criterion of vortex: over 2 rotations)
Left region VS Right region: + VS +
Pohang University of Science and Technology •Materials Science and Engineering •Seong-Mook Cho •27
1 4 2 3
1 2 3 4
Left region VS Right region: + VS +
Outside region VS Inside region : + VS +
Vortex Formation with Clogged Nozzle
< No-clog > < Small-clog >
- Most vortices are formed at 4 regions near SEN in the
cases of no and small-clog cases.
< No clog > < Small clog >
- All vortices are formed at left region near SEN with
severe-clog case
- Nozzle clogging causes asymmetric vortex formation
Pohang University of Science and Technology •Materials Science and Engineering •Seong-Mook Cho •28
- More vortices form at the left region of SEN with the
nozzles with clogged left port < Sever-clog >
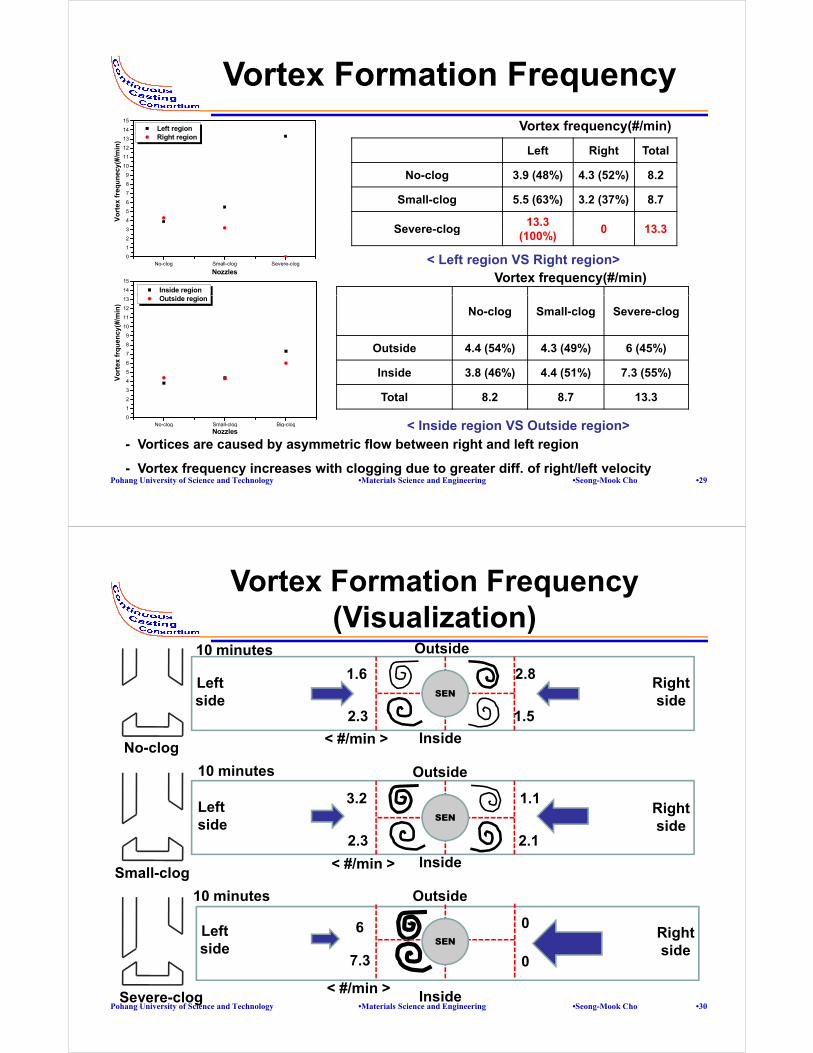
Vortex Formation Frequency
Left Right Total10
11
12
13
14
15
Left region Right region
y(#/
min
)
Vortex frequency(#/min)
No-clog 3.9 (48%) 4.3 (52%) 8.2
Small-clog 5.5 (63%) 3.2 (37%) 8.7
Severe-clog13.3
0 13 33
4
5
6
7
8
9
10
Vo
rtex
fre
qu
nec
y
Severe clog(100%)
0 13.3
< Left region VS Right region>
14
15
Inside region
No-clog Small-clog Severe-clog0
1
2
3
NozzlesVortex frequency(#/min)
No-clog Small-clog Severe-clog
Outside 4.4 (54%) 4.3 (49%) 6 (45%)7
8
9
10
11
12
13
Outside region
x fr
qu
ency
(#/m
in)
Inside 3.8 (46%) 4.4 (51%) 7.3 (55%)
Total 8.2 8.7 13.3
< Inside region VS Outside region>No clog Small clog Big clog0
1
2
3
4
5
6
Vo
rtex
Pohang University of Science and Technology •Materials Science and Engineering •Seong-Mook Cho •29
< Inside region VS Outside region>- Vortices are caused by asymmetric flow between right and left region
- Vortex frequency increases with clogging due to greater diff. of right/left velocity
No-clog Small-clog Big-clog
Nozzles
Vortex Formation Frequency(Visualization)( sua at o )
Right Left
Outside
SEN
1.6 2.8
10 minutes
sidesideSEN
Inside
2.3 1.5
No-clog< #/min >
Right id
Left id
Outside
SEN
3.2 1.1
10 minutes
Small-clog
sideside
Inside
2.3 2.1
< #/min >
Right side
Left side
Outside
6 0SEN
10 minutes
Pohang University of Science and Technology •Materials Science and Engineering •Seong-Mook Cho •30Severe-clog
sideside
Inside
7.3 0
< #/min >

Measuring Level Fluctuation
15mm15mm
< Measuring positions of level fluctuation >
- Measure level fluctuation on the surface near NFs with ultrasonic displacement
sensors
Compare fluctuation profiles at 15mm position from both NFs- Compare fluctuation profiles at 15mm position from both NFs
- Calculate average level and standard deviation of level
- Transfer level fluctuation profiles to power spectrum by FFT (Fast Fourier
Pohang University of Science and Technology •Materials Science and Engineering •Seong-Mook Cho •31
Transform) analysis
Histories of Level Fluctuation
-2
-3
-4
-5
mm
)
Left side Right side
-2
-3
-4
-5
mm
)
Left side Right side
2
1
0
-1
2
Lev
el f
luct
uat
ion
(m
2
1
0
-1
2
evel
flu
ctu
atio
n(m
< No-clog >Slightly higher averaged
< Small-clog >
Di t f l t t ( )
0 100 200 300 400 500 600 700 800 900 10005
4
3
L
Time(sec)0 100 200 300 400 500 600 700 800 900 1000
5
4
3
Le
Time(sec)
Left Right
No-clogAvg 61 60
Stdev 0 9 0 8
averaged level with nozzle clogging
Distance from nozzle port top(mm)( )
-1
-2
-3
-4
-5
on
(mm
)
Left side Right side
Stdev 0.9 0.8
Small-clogAvg 62 61
Stdev 0.7 0.9
gg g
3
2
1
0
-1
Lev
el f
luct
uat
io
Pohang University of Science and Technology •Materials Science and Engineering •Seong-Mook Cho •32
Severe-clogAvg 62 62.5
Stdev 0.7 0.9< Severe-clog >
0 100 200 300 400 500 6005
4
Time(sec)

Characteristics of Level Fluctuation
2
-3
-4
-5
m
)
Left side Right side
2
-3
-4
-5
mm
)
Left side Right side
2
1
0
-1
-2
vel
flu
ctu
atio
n(m
m
2
1
0
-1
-2
evel
flu
ctu
atio
n(m
490 500 5105
4
3
2
Lev
Time(sec)490 500 510
5
4
3
Le
Time(sec)5
< No-clog > < Small-clog >
( )
-2
-3
-4
-5
on
(mm
)
Left side Right side
- Smooth level fluctuation with non-clogged nozzleAbruptly severe level fluctuation with
2
1
0
-1
Lev
el f
luct
uat
io - Abruptly severe level fluctuation with clogged nozzle (more severe with more clogged nozzle)
290 300 3105
4
3
Time(sec)Pohang University of Science and Technology •Materials Science and Engineering •Seong-Mook Cho •33
< Severe-clog >Severe level fluctuation disturbs uniform initial solidifying shell
Power Spectrum of Level Fluctuation
0.01
0.1
2)
1E 3
0.01
0.1
2)
0.25Hz
1E-6
1E-5
1E-4
1E-3
er s
pec
tru
m(m
m^
1E-6
1E-5
1E-4
1E-3
we
r sp
ectr
um
(mm
2
1E-3 0.01 0.1
1E-9
1E-8
1E-7
Po
we
Frequency(Hz)
No_clog, L No-clog, R
1E-3 0.01 0.1
1E-9
1E-8
1E-7
Po
w
Frequency(Hz)
Small-clog, L Small-clog, R
< No-clog > < Small-clog >
Frequency(Hz) Frequency(Hz)
1E-3
0.01
0.1
(mm
2)
- Level fluctuation with non-clogged nozzle shows more turbulent trend
- With clogged nozzle there is higher power at
0.25Hz
1E-7
1E-6
1E-5
1E-4
Po
wer
sp
ectr
um
( - With clogged nozzle, there is higher power at the right NF (non-clogged port side)
- Asymmetric flow by nozzle clogging creates periodic asymmetric fluctuation (high power
< Se ere clog >
1E-3 0.01 0.1
1E-9
1E-8
Frequency(Hz)
Severe-clog, L Severe-clog, R
Pohang University of Science and Technology •Materials Science and Engineering •Seong-Mook Cho •34
at 0.25 Hz)< Severe-clog >

Summary- Nozzle clogging effects has been studied with 3
cases nozzles (No, Small and Severe-clog)- Asymmetric flow
Level fluctuation with higher power
More frequent vortex formation Asymmetric flow
Asymmetric jet from clogged nozzle cause asymmetric flow in a moldThe surface flow at the side with non-clogged port is faster than clogged port
formation
Asymmetric flow
faster than clogged portMore asymmetry of flow between left and right side induces faster flow at the gap between SEN and mold
- Vortex formationVortices are caused by the asymmetric flow between
Higher jet force
Vortices are caused by the asymmetric flow between right and left sideMore vortices form at the left region of SEN with the nozzle having clogged left port
Level fluctuation“Phenomena in the mold
ith l d l ” - Level fluctuationThe surface level at the same side as non-clogged port is higher with higher power
with clogged nozzle”
- Comparison of results between experimental and computational worksSt d d d l h th ll t h d t d ith tk
Pohang University of Science and Technology •Materials Science and Engineering •Seong-Mook Cho •35
Standard model shows the well matched trend with measurementReal vortexing flow pattern makes the difference of turbulent kinetic energy between measurement and prediction (need of studying transient modeling)
εk −
Acknowledgements
• Continuous Casting Consortium Members(ABB Arcelor-Mittal Baosteel Corus LWB(ABB, Arcelor-Mittal, Baosteel, Corus, LWB Refractories, Nucor Steel, Nippon Steel, Postech, Posco, ANSYS-Fluent), )
• POSCO: Ho-Jung Shin, Woong-Ryul Choi, Sung-OSCO o Ju g S , oo g yu C o , Su gKwhang Kim, Joong-Wook Cho, Shin-Eon Kang
• POSTECH: Hyoung-Jun Lee, Soo-Young Seo
Pohang University of Science and Technology •Materials Science and Engineering •Seong-Mook Cho •36
• UIUC: Chuanbo Ji