annual report and accounts 2007 a leading support … report and accounts 2007 a leading support...
TRANSCRIPT

Making tomorrow a better place
Annual report and accounts 2007A leading support services company

Our Company
One of the UK’s leading support services, Public Private Partnershipproject and construction companies
Our mission
Making tomorrow a better place
Our vision
To be the leader in delivering integrated solutions for infrastructure,buildings and services
Our values
> Openness> Collaboration> Mutual dependency> Professional delivery> Sustainable, profitable growth> Innovation.
Our strategy is to deliver sustainable, profitable growth through
> growing support services and Public Private Partnership projectsorganically and by acquisition
> developing and marketing integratedsolutions tailored to the needs ofcustomers, including project finance,design and construction, maintenanceand lifetime asset management
> maintaining a strong and selectiveconstruction capability focused onhigher added-value contracts for long-term customers.
Section 05Financial statements60 Consolidated
income statement 61 Consolidated
balance sheet62 Consolidated cash
flow statement63 Reconciliation of net
cash flow to movementin net borrowing
63 Consolidated statement of recognised income and expense
64 Notes to theconsolidated financialstatements
108 Company balance sheet 109 Notes to the Company
financial statements115 Shareholder information
and Advisers 116 Five year reviewBack cover
Further information
Section 012007 highlights01 Financial and strategic highlights
Section 02What we do04 Revenue by market sector
and financial reporting segment06 Market sectors
Section 03Our performance14 Five years of growth15 Chairman’s statement16 Group Chief Executive’s review20 Operating and financial review
22 Support services24 Public Private
Partnership projects26 Middle East
construction services28 Construction services
(excluding the Middle East)33 Sustainability review
Section 04Governance38 Board of Directors40 Report of the Directors43 Corporate Governance Report48 Remuneration Report56 Statement of Directors’
Responsibilities in respect of the Annual Report andFinancial Statements
57 Independent auditors’ report to the members of Carillion plc
Section 01
012007 highlights
01 Financial and strategic highlights

Financial and strategic highlights
Support services
+26%increase in underlying operating profit(2)
In this segment we report the results of our facilitiesmanagement, facilities services, rail, road maintenance and consultancy businesses.
Public Private Partnership projects
-4%decrease in underlying operating profit(2)
In this segment we report the equity returns on ourinvestments in Public Private Partnership projects in our chosen sectors of Defence, Health, Education, Transport, Secure and other Government accommodation.
Revenue(1)
2007 2006£m £m
Group 1,569.4 1,314.8Share of Joint Ventures 224.2 143.9Total 1,793.6 +23% 1,458.7
Underlying operating profit (2)
2007 2006£m £m
Group 62.4 51.5Share of Joint Ventures 11.5 7.3Total 73.9 +26% 58.8
Reported operating profit (1)
2007 2006£m £m
Group 48.0 33.6Share of Joint Ventures 11.5 7.3Total 59.5 +45% 40.9
Revenue(1)
2007 2006£m £m
Group 0.9 1.3Share of Joint Ventures 153.2 146.7Total 154.1 +4% 148.0
Underlying operating profit (2)
2007 2006£m £m
Group 0.7 7.1Share of Joint Ventures 24.7 19.4Total 25.4 -4% 26.5
Reported operating profit (1)
2007 2006£m £m
Group (1.2) 6.5Share of Joint Ventures 24.7 19.4Total 23.5 -9% 25.9
KeySupport servicesPublic Private Partnership projectsMiddle East construction servicesConstruction services (excluding the Middle East)
(1) Continuing operations (2) Continuing operations before intangible amortisation, impairment,
restructuring costs and non-operating items(3) Before Group eliminations, unallocated items and Joint Venture
net financial expense and taxation.
45%of total
53%of total(3)
49%of total(3)
4%of total
18%of total(3)
20%of total(3)
Net present value (£m)
Discount rate
Dec 2007 £266m(Dec 2006: £238m)
5% 6% 7% 8% 9% 10% 11% 12%0
50
100
150
200
250
300
350
400
450
+12% increase in Directors’ valuation of equity infinancially closed Public Private Partnership projects

Construction services (excluding the Middle East)
-14%decrease in underlying operating profit(2)
In this segment, we report the results of our UK building, civil engineering and developments businesses and of our construction activities in Canada and the Caribbean.
Middle East construction services
+83%increase in underlying operating profit(2)
In this segment, we report the results of our building and civil engineering activities in the Middle East.
Revenue(1)
2007 2006£m £m
Group 1,660.4 1,625.5Share of Joint Ventures 6.6 11.5Total 1,667.0 +2% 1,637.0
Underlying operating profit (2)
2007 2006£m £m
Group 12.3 10.1Share of Joint Ventures 3.7 8.4Total 16.0 -14% 18.5
Reported operating profit (1)
2007 2006£m £m
Group 8.1 5.0Share of Joint Ventures 3.7 8.4Total 11.8 -12% 13.4
Revenue(1)
2007 2006£m £m
Group 100.0 42.3Share of Joint Ventures 237.0 226.4Total 337.0 +25% 268.7
Underlying operating profit (2)
2007 2006£m £m
Group 9.6 1.3Share of Joint Ventures 15.8 12.6Total 25.4 +83% 13.9
Reported operating profit (1)
2007 2006£m £m
Group 9.6 1.3Share of Joint Ventures 15.8 12.6Total 25.4 +83% 13.9
9%of total
18%of total(3)
21%of total(3)
42%of total
11%of total(3)
10%of total(3)
+24% increase in underlying profit from operations Revenue(1) Underlying profit(2) Reported profit(1)
2007 2006 2007 2006 2007 2006£m £m £m £m £m £m
Group 3,330.7 2,983.9 85.0 70.0 64.5 46.4Share of Joint Ventures 621.0 528.5 55.7 47.7 55.7 47.7Total revenue and operating profit 3,951.7 +13% 3,512.4 140.7 117.7 120.2 94.1
Group eliminations and unallocated items (20.6) (20.3) (35.8) (36.5)Profit from operations before Joint Venturesnet financial expense and taxation 120.1 97.4 84.4 57.6Share of Joint Ventures net financial expense (9.9) (8.0) (9.9) (8.0)Share of Joint Ventures taxation (9.0) (8.1) (9.0) (8.1)Profit from operations 101.2 +24% 81.3 65.5 +58% 41.5

Total revenue(1)
2006: £3.5bn
£4.0bn+13%
Underlying profit before tax(2)
2006: £82.6m
£101.8m+23%
Underlying earnings per share(2)
2006: 23.7p
28.9p+22%
Reported profit before tax(1)
2006: £68.1m
£94.4m+39%
Reported earnings per share(3)
2006: 21.6p
27.1p+25%
Total dividend2006: 9.0p
11.0p+22%
Order book2006: £16.0bn
£16.0bn
> Successful integration of Mowlem earlier than expected –integration savings ofat least £26m per yearachieved, 73% aboveoriginal expectation
> Strong growth insupport services –revenue up 23%
> Construction marginsimproving – totalunderlying construction margin up to 2.1%(2006: 1.7%)(2)
> £16.0bn order book(2006: £16.0bn) –pipeline of probableorders increased to£3.6bn (2006: £1.6bn)
> Opportunities tosubstantially increaseMiddle East revenue,from the 2007 level of £337m to more than £600m, over the next two years
> Alfred McAlpineacquisition completed in February 2008 –integration underway
> Overall outlook in main markets remainspositive – supportservices, Public PrivatePartnership projects and Middle Eastactivities now represent 89% of theGroup’s underlyingoperating profit
01 Carillion plcAnnual Report and Accounts 2007
2007 highlightsFinancial and strategic highlights
Section
01 – 2007 hig
hlig
hts
(1) Continuing operations(2) Continuing operations before
intangible amortisation,impairment, restructuring costs and non-operating items
(3) Continuing and discontinuedoperations.

02 Carillion plcAnnual Report and Accounts 2007
Section 02
02What we do
04 Revenue by market sector and financial reporting segment
06 Market sectors
Todholm School, Renfrewshire, one of 10 nursery, primary and secondaryschools being provided for RenfrewshireCouncil through a Carillion PublicPrivate Partnership project.

03 Carillion plcAnnual Report and Accounts 2007
13%growth in total revenue during the year to £4.0 billion
Section
02 – Wh
at we d
o

Canada and the Caribbean market sectors
Revenue by market sector and financial reporting segment
Road maintenance and Facilities Management and Services
Middle East market sectors
Revenue by market sector and financial reporting segment
Construction £337m
Facilities Management and Services £5m
UK market sectors
Revenue by market sector and financial reporting segment
Defence £458m
Education £93m
Health £200m
Facilities Management and Services £837m
Rail £280m
Roads £276m
Building £887m
Civil Engineering £239m
Public Private Partnership projects £154m
£73m
Public Private Partnership projects and other construction £113m
04 Carillion plcAnnual Report and Accounts 2007
What we doRevenue by market sector andfinancial reporting segment
Carillion employs some 50,000 people and operates in nine principal marketsectors in the UK and also in the MiddleEast and in Canada and the Caribbean.
We report the financial results of our activities in these sectors in foursegments, in which activities of a similar type and risk profile are reportedtogether to make it easier to value theGroup’s earnings on a consistent basis.
> Support services – facilitiesmanagement and services, rail services and road maintenance
> Public Private Partnership projects – equity returns on our investments in Public Private Partnership projects
> Middle East construction services –building and civil engineering activities in this region
> Construction services (excluding the Middle East) – building and civil engineering activities in the UKand in Canada and the Caribbean
£4.0billion 13% increase in total revenue during the year
Support services£1,794m
Public Private Partnership projects£154m
Middle East construction services £337m
Construction services (excluding the Middle East) £1,667m
Total £3,952m
Revenue

£113m
£73m
£337m
£5m
£263m £195m
£15m £78m
£132m £68m
£837m
£280m
£189m £87m
£887m
£239m
£154m
05 Carillion plcAnnual Report and Accounts 2007
Section
02 – Wh
at we d
o

06 Carillion plcAnnual Report and Accounts 2007
What we doMarket sectors
Carillion’s principal market sectors togetherwith their 2007 revenues in the UK,Middle East and Canada and theCaribbean are described in more detail on the following pages.
The overall outlook across these market sectors is positive.
In our UK and international support services sectors we continueto target revenue growth at stable margins of between four andfive per cent.
In Private Finance, we continue to use the strong positions wehave established in our chosen sectors in both the UK and Canadato win and deliver Public Private Partnership projects in which our equity investments create significant value for the Group.
In the Middle East, we are focused on revenue growth and expectto increase the revenue we generate in this region from the 2007level of £337 million to over £600 million over the next two years,at margins of some six per cent.
In our UK construction sectors we are focused on improvingmargins by maintaining a selective approach to the projects we undertake.
In Canada and the Caribbean, we expect to deliver healthy growthin our construction services sectors at stable margins.
Overall, we expect to improve the combined margins of ourconstruction activities in the UK, Canada and the Caribbean andthe Middle East towards three per cent over the next three years.
DefenceIn this sector we provide project finance, design,construction, maintenance, facilities management andconsultancy services, together with integrated servicesolutions, which combine our wide range of skills and resources, to meet the specific needs of our Ministry of Defence customers.
In 2007, the revenue we generated from the Defence sectorincreased by 97 per cent to £458 million (2006: £232 million),as we benefited from full-year contributions from a number of Joint Venture contracts that were mobilised in 2006. Theseinclude two Public Private Partnership projects – the £12 billionAllenby Connaught project and the £0.9 billion PermanentJoint Headquarters project – that are expected to generate inthe region of £10 billion of revenue for Carillion over the next35 years, and two support services contracts – the HousingPrime and Regional Prime Central contracts, together worth in excess of £600 million to Carillion over seven years.
The outlook in this sector is for further growth. In 2007,Carillion was awarded £100 million of construction work in association with our Regional Prime Central contract. The £280 million Royal School of Military Engineering project,for which Carillion is the preferred bidder, is expected to reach financial close in 2008. In addition, potential extensionsto our Housing Prime and Regional Prime Central contracts,together with further major expenditure by the Ministry ofDefence on upgrading military accommodation across ourother projects, could increase contract revenues by up to afurther £650 million.
2007 revenue
£458m
01.

07 Carillion plcAnnual Report and Accounts 2007
HealthIn this sector we provide project finance, design,construction, maintenance, facilities management andconsultancy services, together with integrated servicesolutions, which combine our wide range of skills andresources, to meet the specific needs of our NHS andprivate sector customers.
In 2007, we generated £200 million of revenue from theHealth sector (2006: £229 million). Overall, revenue from thissector reduced, due to the timing of construction contractstarts and completions. However, support services revenuefrom this sector increased substantially as a result of full-yearcontributions from non-clinical facilities management in threeof our Public Private Partnership hospitals – the John RadcliffeHospital, Oxford, Queen Alexandra Hospital, Portsmouth and Lewisham Hospital – and from our £330 million contractto provide non-clinical facilities management for the Barts and the London Hospital. During 2007 we were awarded our third Local Improvement Finance Trust (LIFT) project forDudley Infracare worth approximately £27 million.
The outlook in this sector remains positive. Carillion is thepreferred bidder for two Independent Sector Treatment Centreprojects – Hertfordshire and North London – that are expectedto reach financial close in 2008 and generate some £300million of revenue over the next five years. We are also thepreferred bidder for a further five LIFT projects worth around£75 million. We continue to target selected projects in theGovernment’s £7 billion investment programme for PublicPrivate Partnership hospitals and Carillion is currentlyshortlisted for one project, North Bristol, worth around £300 million. As a framework contractor appointed by the Office of Government Commerce for public sectoroutsourcing, we also expect further opportunities to providefacilities management services for Primary Care Trusts.
2007 revenue
£93m2007 revenue
£200mEducationIn this sector we provide project finance, design,construction, maintenance, facilities management andconsultancy services, together with integrated servicesolutions, which combine our wide range of skills andresources, to meet the specific needs of our LocalAuthority, University and private sector customers.
In 2007, we generated £93 million of revenue from theEducation sector (2006: £162 million), with the reduction due to the timing of construction contract starts andcompletions. However, we reached financial close on two new contracts in 2007 – the £76 million South Ayrshire Schools Public Private Partnership project and the £175 million South Tyneside and Gateshead project, which is part of the UK Government’s Building Schools for the Future (BSF) programme. We also won other newcontracts during 2007 for schools, colleges and universitiesworth around £60 million.
Going forward, we expect the BSF programme, in which some £45 billion has still to be invested, to be a major driverof growth. During 2007, Carillion was shortlisted for threefurther BSF projects – Nottingham, Tameside and Durham –together worth in the region of £850 million. Since the yearend, Carillion has been appointed as the preferred bidder for the £208 million Nottingham BSF project. Following ourappointment as a framework contractor for the £1.6 billionAcademy Schools programme, Carillion has been shortlisted to provide Academy Schools in Nailsea, Somerset, and EastBasildon, Essex, which we estimate would generate up to£100 million of revenue. With the UK Government alsoplanning to commence a £10 billion investment programme in primary schools in 2008, the outlook in this sectorcontinues to be positive.
01. RAF Valley, Anglesey, where Carillionprovides support services as part of itsRegional Prime Central contract for theMinistry of Defence.
02. Sandhill School, Barnsley, one of 13new schools provided through a CarillionPublic Private Partnership project.
03. The new Queen Alexandra Hospital,Portsmouth, a Carillion Public PrivatePartnership project.
02. 03.
Section
02 – Wh
at we d
o

08 Carillion plcAnnual Report and Accounts 2007
What we doMarket sectorscontinued
Facilities management and servicesWe provide public and private sector customers with awide range of facilities management and other supportservices for buildings and infrastructure, from singleservices such as mechanical and electrical engineeringmaintenance to fully integrated property lifecyclesolutions for major estates.
We generated £837 million of revenue from this sector in2007 (2006: £656 million). This substantial organic growthwas due primarily to full-year contributions from major new contracts won in the second half of 2006, including a £110 million, five-year contract for Virgin Media and a £360 million, three-year contract for Norwich Union tomanage insurance claims.
New order intake in 2007 remained healthy and we won a number of new contracts for both private and public sector customers. Our appointment as an Office ofGovernment Commerce framework contractor for Local and Central Government is a major market opportunity. For example, in 2007 Carillion was awarded contracts byNorthamptonshire County Council and the Forensic ScienceService that are initially worth in excess of £60 million overfour years, with the potential for this to increase as the scopeof work develops under the terms of the framework contract.
We ended the year with an unprecedented level ofopportunities for new orders that have since been converted into contracts worth around £0.9 billion in the first two months of 2008. We expect to continue tobenefit from these positive market conditions and deliversignificant growth in this sector in 2008 and beyond.
RailIn this sector, we provide services for networkenhancements to Network Rail, the Channel Tunnel Rail Link (CTRL), Passenger Transport Executives andTransport for London, and also maintenance services for the CTRL.
We generated £280 million of revenue from this sector in2007 (2006: £368 million). As expected, the outlook in thesector remained uncertain in 2007 and the overall decline inrail infrastructure investment experienced in 2006 continuedduring the year.
However, in view of the investment proposed by Network Rail in its 2007 Business Plan and the benefits of havingrestructured our rail business to reduce overheads and focus on sustainable areas of the rail infrastructure sector, we expect to achieve modest growth in this sector in 2008.The proposed investment over the next two years, the last of the Office of Rail Regulation’s current five-year controlperiod, is expected to offer sufficient opportunities to morethan offset the effect of losing around £80 million of annualrevenue as a result of Carillion ceasing to provide trackrenewal services to Network Rail from January 2008.
2007 revenue
£837m2007 revenue
£280m
01. 02.

09 Carillion plcAnnual Report and Accounts 2007
Building Our building activities in the UK are focused on long-term key customers in selected sectors of the non-housing new-build market, including airportdevelopments, retail, offices, mixed used developments,nuclear, prisons, industrial and urban regeneration.
Revenue from UK building in 2007 was £887 million (2006: £848 million). Trading conditions across our key sectorsof the UK non-housing new-build market remained positiveand we continued to focus on growing margins ahead ofrevenue through a selective approach to the projects weundertake. New order intake in 2007 reflected this selectiveapproach, with significant new contracts secured for keycustomers across our target sectors. These included a pre-construction contract for BAA for the £300 million, secondsatellite at Heathrow Terminal 5, a £90 million contract for thefirst phase of the £2 billion King’s Cross Central Regenerationproject, a £70 million contract for the new Rolls Building inLondon, a £47 million contract for the Scottish Prison Serviceand a £20 million contract to provide new offices for theWelsh Assembly. In 2007, we were also appointed preferredbidder for the £155 million Lumiere Development in Leeds, for which we were awarded the contract in March 2008.
The outlook for the UK non-housing, new-build marketremains positive, with real terms growth forecast over the next three years. We shall continue to adopt a selectiveapproach to the contracts we undertake in order to maintainour focus on improving margins ahead of revenue.
RoadsIn this sector we provide road management andmaintenance services to the Highways Agency and Local Highway Authorities, together with constructionservices for new roads and improvement schemes,primarily under the Government’s Early ContractorInvolvement (ECI) programme.
Revenue from this sector increased to £276 million in 2007(2006: £224 million), largely due to increased activity on ECIconstruction contracts and increased expenditure on roadmaintenance. In 2007, Carillion secured a 20-year extension to its contract for maintenance of the 123 kilometres of the M40 between Junction 1, Denham, and Junction 15,Warwick, worth in the region of £100 million and aframework contract for the Midlands Highway Alliance, which comprises ten Local Highway Authorities and theHighways Agency, worth up to an estimated £16 million a year to Carillion.
Going forward we have a healthy pipeline of new prospects,but we expect revenue from this sector to reduce slightly aswe continue to apply a selective approach to the projects forwhich we bid, particularly in respect of new constructionwhere we will remain focused on ECI road contracts. Carillioncontinues to be an equity partner in a consortium that hasbeen shortlisted for the £5 billion Design, Build, Finance andOperate project for widening and maintaining the M25. Our interests in this project lie in being an equity investor and in providing road maintenance services over the life of the concession contract. The Highways Agency is expectedto select a preferred bidder for this project during 2008.
2007 revenue
£276m2007 revenue
£887m
03. 04.
01. Carillion provides a total facilitiesmanagement service for BT’s 7,000properties in the UK.
02. The new St Pancras internationalstation for which Carillion providedextensive rail infrastructure services.
03. Carillion provides routinemaintenance and incident supportservices for a substantial proportion of the UK motorways, trunk and local roads network.
04. The Hilton Hotel, Beetham Tower,Manchester, a Carillion building projectcompleted in 2007.
Section
02 – Wh
at we d
o

10 Carillion plcAnnual Report and Accounts 2007
What we doMarket sectorscontinued
Civil engineeringWe provide civil engineering services, includingintegrated solutions, for customers in a wide range ofsectors, notably transport infrastructure, marine works,coastal and river defences, industrial developments,water, wind energy, micro-tunnelling and piling.
In 2007, we generated £239 million of revenue from our civil engineering activities (2006: £241 million). Revenueremained broadly unchanged as we continued to consolidateour activities in this sector through applying strict selectivitycriteria to the projects undertaken by our civil engineeringbusiness, which we acquired with Mowlem in 2006. Theprocess of consolidation is now complete and the business is moving forward following a number of notable successes in 2007. These included new contracts for transportinfrastructure projects including the Rugby Western Bypassand Bedford Western Bypass, together worth around £55 million, a £19 million contract for London City Airportand an £11 million contract for Northumberland Water.
We believe the outlook for our civil engineering business ispositive and we expect continuing opportunities for growth in 2008 in our chosen areas of this market, particularlyhighways, the water sector, wind farms and rail civilengineering.
Public Private Partnership projectsCarillion has played a leading role in the developmentof the UK Private Finance Initiative since its inception in the early 1990s. Today, we have strong positions inour chosen sectors of the Private Finance and PublicPrivate Partnership projects market, namely Defence,Health, Education, Transport, Prisons and otherGovernment accommodation in the UK and the Health sector in Canada.
Our ability to win and deliver projects successfully, byintegrating our skills and resources in project finance, design,construction, maintenance and facilities management,continues to create substantial value for the Group, throughthe equity we invest in these projects and also from providingconstruction, maintenance and facilities management servicesover the life of concession contracts, typically 25 to 35 years.
At 31 December 2007, we had a portfolio of 23 financiallyclosed projects, in which we had invested, or hadcommitments to invest, £175 million of equity. The Directors’valuation of these investments at 31 December 2007 was£266 million, based on discounting the cash flows from these investments at an average of eight per cent, whichreflects the different discount rates applied to equity invested in projects that are in operation and projects that are stillunder construction. Carillion has also played a leading role in establishing the value of equity investments in Public PrivatePartnership projects through a number of equity sales, whichhave helped to create a strong secondary market for theseinvestments and demonstrate the significant value beingcreated for shareholders.
The overall outlook in our chosen sectors of the Public PrivatePartnership projects market is for continuing growth, both in the UK and Canada, and we expect to continue to build a portfolio of good quality investments.
2007 revenue
£239m2007 revenue
£154m
01. 02.

11 Carillion plcAnnual Report and Accounts 2007
Middle East Our well-established Joint Venture businesses in the Middle East provide construction and facilitiesmanagement services for high quality developments in Dubai and Oman and in 2008 we will extend ouroperations to Abu Dhabi and Egypt.
In 2007, Carillion’s share of the revenues of these JointVenture businesses was £342 million (2006: £274 million),which has more than doubled over the last three years (2005:£165 million). Over the next two years we expect a furthersubstantial increase in revenue to over £600 million, atmargins of around six per cent. This strong growth reflects both the high level of demand in our principal market sectorsand our robust business model in the region, in particular the strong relationship we have with the Al Futtaim Group, a key Joint Venture partner and customer.
In 2007, Al Futtaim Carillion was appointed preferred bidderfor two major contracts – a £220 million contract for the first phase of the £2 billion Cairo Festival City project and a£250 million contract for the initial phase of the £10 billion Al Raha Beach development in Abu Dhabi for Aldar, one ofthe Emirates premier developers. Al Futtaim Carillion alsosigned a new framework agreement for the next phase ofDubai Festival City, worth around £3.5 billion over the next six years.
We are well positioned to build on our success in 2007 withpotential framework agreements for the remainder of CairoFestival City, worth around £1.8 billion, and for a secondmajor project for Aldar in Abu Dubai – the £250 millionRacetrack Hotel on Yas island – which is expected to start inearly 2008. We also expect opportunities to secure furtherphases of the Al Raha Beach development in Abu Dhabi and a number of major projects for established customers inDubai, including Union Properties, Emaar and Dubal.
Canada and the CaribbeanIn Canada we have market leading positions in PublicPrivate Partnership hospital projects and in roadmaintenance. In the Caribbean we have well establishedpositions in building and civil engineering.
We generated revenue of £186 million from this region in2007 (2006: £163 million), with growth driven primarily byPublic Private Partnership projects and road maintenance inCanada and general construction in the Caribbean. In 2007, a Carillion Joint Venture completed the new William OslerHospital in Toronto, our second Public Private Partnershiphospital in Canada, which moved successfully into theoperational phase, with Carillion providing non-clinical facilitiesmanagement. A Carillion Joint Venture also achieved financialclose on a third Public Private Partnership hospital in Canada,the £200 million Sault Area Hospital, which is now underconstruction. In the Caribbean, we continued to make progressin our construction and facilities management markets.
The outlook in our principal markets in this region is positive.In Canada, we are shortlisted for two more Public PrivatePartnership hospitals, the Niagara and Woodstock hospitals inOntario, estimated to be worth up to £450 million of revenue,and in which we would invest up to £14 million of equity.With opportunities to bid for further Public Private Partnershiphospitals and road maintenance contracts in Canada and tobuild on the progress we have made in the Caribbean, we expect continuing growth in 2008.
2007 revenue
£342m2007 revenue
£186m
03. 04.
01. Lyme Regis, where Carillion hascarried out extensive sea defence works.
02. The new John Radcliffe Hospital,Oxford, a recent Carillion Public PrivatePartnership project and an outstandingexample of sustainable development.
03. Marsa Plaza, part of the DubaiFestival City development, being built byAl Futtaim Carillion.
04. The Royal Ottawa Hospital, Carillion’sfirst Public Private Partnership hospital in Canada.
Section
02 – Wh
at we d
o

12 Carillion plcAnnual Report and Accounts 2007
Section 03
03Our performance
14 Five years of growth15 Chairman’s statement16 Group Chief Executive’s review20 Operating and financial review
22 Support services24 Public Private Partnership projects26 Middle East construction services28 Construction services
(excluding the Middle East)33 Sustainability review
A Carillion Joint Venture is providingnew accommodation and other facilitiesfor the British Army across the South ofEngland through a Public PrivatePartnership project.

13 Carillion plcAnnual Report and Accounts 2007
22%growth in underlying earnings per share during the year to 28.9 pence
Section
03 – Ou
r perfo
rman
ce

14 Carillion plcAnnual Report and Accounts 2007
Our performanceFive years of growth
07
06
05
04
03
3,951.7
3,512.4
2,249.1
1,954.4
1,956.4
07
06
05
04
03
94.4
68.1
51.8
67.9
21.7
07
06
05
04
03
101.8
82.6
55.4
49.2
48.7
07
06
05
04
03
27.1
21.6
18.7
27.1
4.4
07
06
05
04
03
28.9
23.7
20.4
19.1
17.9
07
06
05
04
03
11.0
9.0
8.0
7.5
6.75
Total revenue(1) (£m) +13% Reported profit before tax(1) (£m) +39%
Underlying profit before tax(2) (£m) +23%
Underlying earnings per share(2) (p) +22%
Reported earnings per share(3) (p) +25%
Dividend per share (p) +22%
(1) Continuing operations (2) Continuing operations before intangible amortisation,
impairment, restructuring costs and non-operating items (3) Continuing and discountinued operations.
Winter maintenance is a vital part of the service provided by Carillion for theHighways Agency and Local HighwayAuthorities in the UK and for ProvincialGovernments in Canada.

Total revenue, including Joint Ventures, increased by 13 per cent to nearly £4 billion (2006: £3.5 billion), primarily due to organicgrowth in support services and Middle East construction servicestogether with a full twelve months revenue contribution from thebusinesses acquired with Mowlem in February 2006.
Underlying profit before tax from continuing operations increasedby 23 per cent to £101.8 million (2006: £82.6 million) andunderlying earnings per share from continuing operations on the same basis rose by 22 per cent to 28.9 pence per share (2006: 23.7 pence).
Underlying cash flow from operations of £135.7 million (2006: £99.1 million) comfortably exceeded underlying operatingprofit. Net borrowing at 31 December 2007 was £44.9 million (2006: £108.0 million) and average net borrowing in 2007 was £130.3 million (2006: £148.0 million post the acquisition of Mowlem).
The Group has continued to develop the strong positions it holdsin a wide range of growth markets, winning new orders duringthe year worth some £4.0 billion. At 31 December 2007 the Group’sforward order book stood at £16.0 billion (2006: £16.0 billion)and its pipeline of probable new orders had increased significantlyto £3.6 billion (2006: £1.6 billion).
Given the strength of the Group’s performance in 2007 and prospects for 2008 and the medium term, the Board isrecommending a final ordinary dividend for 2007 of 7.5 pence per share, making the total full-year dividend for 2007 11.0 penceper share, an increase of 22 per cent on the total paid in respect of 2006 (9.0 pence). The final dividend will be paid on 20 June 2008 to shareholders on the register at close of businesson 25 April 2008.
As I announced in my 2006 report to shareholders, Chris Girlingretired from the Board in April 2007 and was succeeded as GroupFinance Director by Richard Adam who joined the Board fromAssociated British Ports Holdings plc where he had been GroupFinance Director since 1999. In January 2008, we were delightedto welcome David Hurcomb to the Board as an Executive Director.David joined Carillion in 2005 having held a number of seniorpositions in our industry. With extensive experience of our keymarket sectors, David will make a valuable contribution toCarillion’s development.
The credit for what Carillion has achieved is due to the leadership of our management team and the commitment andprofessionalism of our people. On behalf of the Board I should like to thank all our employees for the contribution they havemade to Carillion’s success in 2007.
The acquisition of Alfred McAlpine in February 2008 hasfurther strengthened Carillion’s position as a leading supportservices and integrated solutions business and the Boardexpects the Group to make further strong progress in 2008and deliver materially enhanced earnings in 2009.
Philip Rogerson Chairman5 March 2008
Philip RogersonChairman
2007 was another strong year forCarillion. The Group delivered recordprofits and continued its strategicdevelopment to support sustainable,profitable growth. In particular, thesuccessful integration of the Carillion and Mowlem businesses has created a stronger, more resilient business, with enhanced positions in selectedgrowth markets.
15 Carillion plcAnnual Report and Accounts 2007
Our performanceChairman’s statement
Section
03 – Ou
r perfo
rman
ce

16 Carillion plcAnnual Report and Accounts 2007
Our performanceGroup Chief Executive’s review
More specifically, in 2007 we said that going forward we will focus on
• growing revenue in support services at stable margins ofbetween four and five per cent
• using the strong positions we have established in our chosensectors of the Private Finance market in the UK and Canada to win projects in which equity investments will createsignificant value for the Group
• more than doubling Carillion’s share of revenues from our Joint Venture businesses in the Middle East from £274 million in 2006 to over £600 million within the next three years, at margins of some 6 per cent
• improving the combined margins of our construction activities in the UK, Canada and the Caribbean and the Middle Easttowards 3 per cent over the next three years.
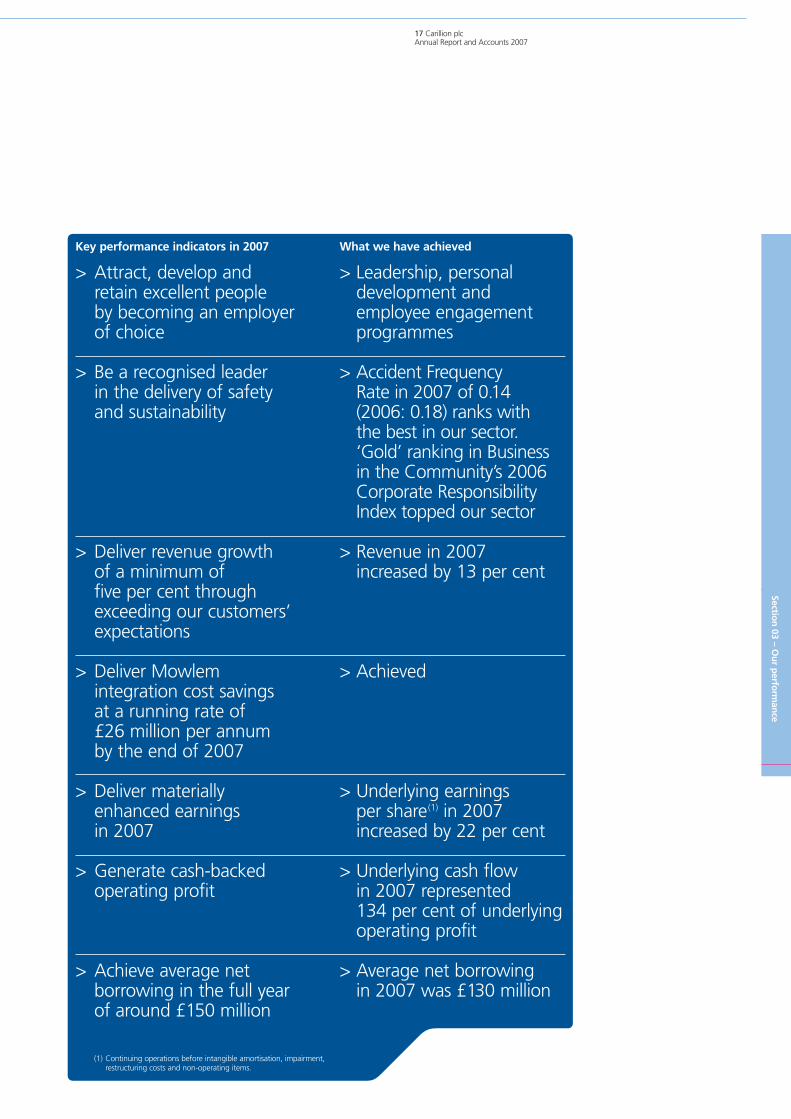
We also set seven key performance indicators for 2007 in respectof which Carillion has performed strongly, as we continued tobuild on the step change in Carillion’s development that weachieved in 2006 through the acquisition and successfulintegration of Mowlem.
Key performance indicators in 20071. Attract, develop and retain excellent people by becoming an employer of choiceDelighting our customers by meeting or exceeding theirexpectations depends primarily on the quality of our people.Therefore, our ability to attract, develop and retain excellentpeople by becoming an employer of choice continues to be ourtop priority.
In 2007, we made further good progress towards this objectivethrough the leadership, personal development and employeeengagement programmes we have introduced across the Group to help all our people fulfil their potential and contribute to Carillion’s success.
Creating a culture of trust and open communication is essential to the success of our people policies and programmes. Ourmanagers and supervisors seek to engage with all our peoplethrough regular one-to-one meetings, individual performance and development reviews and monthly team talks, supported by newsletters and our Company newspaper, Spectrum that once again received the top national award in 2007 from‘Communicators in Business’ as the best UK company newspaper.
Listening to what our people tell us and acting upon it is vital togood communication. To that end and to help us monitor andmeasure our progress, we conduct employee surveys. For example,every year we hold ‘The Great Debate’, an interactive survey inwhich our people, selected randomly from across the Group, share their views on a wide range of issues, which are importantto their development and satisfaction and to the success ofCarillion. In 2007, around 2,500 people took part in ‘The GreatDebate’, the results of which showed that we are making goodoverall progress on these issues and that our average scorescompared favourably with those of other top UK companies.
Carillion’s success continues to be basedon implementing our consistent andsuccessful strategy for sustainable,profitable growth of
> growing support services and PublicPrivate Partnership (PPP) projectsorganically and by acquisition
> developing and marketing integratedsolutions tailored to the needs ofcustomers, including project finance,design and construction, maintenanceand lifetime asset management, and
> maintaining a strong and selectiveconstruction capability focused onhigher added-value contracts for longterm customers.
John McDonoughGroup Chief Executive
17 Carillion plcAnnual Report and Accounts 2007
Key performance indicators in 2007
> Attract, develop and retain excellent people by becoming an employer of choice
> Be a recognised leader in the delivery of safety and sustainability
> Deliver revenue growth of a minimum of five per cent through exceeding our customers’ expectations
> Deliver Mowlem integration cost savings at a running rate of £26 million per annum by the end of 2007
> Deliver materially enhanced earnings in 2007
> Generate cash-backedoperating profit
> Achieve average netborrowing in the full year of around £150 million
What we have achieved
> Leadership, personaldevelopment andemployee engagementprogrammes
> Accident Frequency Rate in 2007 of 0.14(2006: 0.18) ranks with the best in our sector.‘Gold’ ranking in Businessin the Community’s 2006Corporate ResponsibilityIndex topped our sector
> Revenue in 2007 increased by 13 per cent
> Achieved
> Underlying earnings per share(1) in 2007increased by 22 per cent
> Underlying cash flow in 2007 represented 134 per cent of underlyingoperating profit
> Average net borrowing in 2007 was £130 million
(1) Continuing operations before intangible amortisation, impairment, restructuring costs and non-operating items.
Section
03 – Ou
r perfo
rman
ce

18 Carillion plcAnnual Report and Accounts 2007
Our performanceGroup Chief Executive’s reviewcontinued
2. Be the recognised leader in the delivery of safetyand sustainabilityThe Health and Safety of our people and everyone who workswith us or is affected by our operations is paramount. In 2005, we set the demanding objective of eliminating reportableaccidents by 2010.
Known as ‘Target Zero’, this objective is led by our Board andrequires the constant vigilance and commitment of everyone inCarillion to ensure that safe working practices are consistentlyadopted and supported by rigorous reviews, audits and training.
We are pleased to report that in 2007 we made further progresstowards ‘Target Zero’. The Group’s Accident Frequency Rate (AFR)reduced by 22 per cent to 0.14 reportable accidents per 100,000man hours worked (2006 AFR: 0.18), which ranks with the best in our sector. This follows year on year reductions in our AFR of 25 per cent in 2006 and 35 per cent in 2005.
Despite a nine per cent increase in the total number of hoursworked in 2007 to over 210 million, the total number ofreportable accidents under RIDDOR (Reporting of Injuries, Diseases and Dangerous Occurrences Regulations 1995) reducedby 15 per cent to 295 (2006: 347) and also follows year on yearreductions of 24 per cent in 2006 and 27 per cent in 2005.
We deeply regret that one fatal traffic accident, involving a Joint Venture employee, occurred on one of our internationalproject sites in 2007. One prosecution of Carillion and one of its sub-contractors by the Health and Safety Executive, relating to incidents that occurred in 2004, was concluded in 2007. No other enforcement notices were received by Carillion or any of its sub-contractors in 2007 in respect of work being carried out by Carillion or on the Company’s behalf.
In 2007, Carillion once again submitted information on the Health and Safety performance of all its UK business units to the Corporate Health and Safety Performance Index, having been the first and only major construction company to do so in2006. This Index, which is sponsored by the Health and SafetyCommission, covers all aspects of Health and Safety managementand performance. A wide range of industries participate in theIndex, which enables us to benchmark our performance beyondour own industry sector. In 2007, we improved our Index score to 7.4 (2006: 6.4), which was well above the mean score of 6.7.
Our commitment to sustainability has made Carillion therecognised leader in the development and adoption of responsiblebusiness practices, as we demonstrated by topping our sector with a Gold performance ranking in Business in the Community’s2006 Corporate Responsibility Index. We say more about ourprogramme for sustainable development on pages 33 to 35 of this report.
More detailed information on Health and Safety and sustainabilitywill be published in our 2007 Sustainability Report on our websiteat www.carillionplc.com/sustainability in April 2008.
3. Deliver revenue growth of a minimum of five per centthrough exceeding our customers’ expectations In 2007, revenue increased by 13 per cent, which after allowingfor a full year contribution from the businesses acquired withMowlem in February 2006, means we achieved organic growth of eight per cent and ahead of our objective of five per cent.Organic growth was driven mainly by a 20 per cent increase in UK support services revenue, particularly in the defence andprivate sector facilities management sectors, and a 25 per centincrease in Middle East construction services revenue, reflectingour strong markets in both Dubai and Oman.
4. Deliver Mowlem integration cost savings at a run rate of £26 million per annum by the end of 2007 We delivered integration cost savings at a run rate of £26 million ayear, in line with our objective and significantly above the originaltarget run rate of £15 million a year, which we announced at the time of acquisition. These hard, measurable savings wereachieved in a number of areas, including eliminating managementduplication, the adoption of Carillion’s shared services model forcentral and back office functions, property rationalisation andmore efficient and effective supply chain management.
5. Deliver materially enhanced earnings in 2007Revenue and margin growth resulted in 23 and 22 per cent increases in underlying profit before tax and underlying earningsper share, respectively. Increasing margins, particularly in thebusinesses acquired with Mowlem, through applying Carillion’sstrict project selectivity criteria and risk management processes wasidentified at the time of acquisition as an important opportunityfor earnings growth. Overall operating margins increased to 2.6 per cent (2006: 2.3 per cent), with increases in groupconstruction services (excluding the Middle East) to 0.7 per cent(2006: 0.6 per cent) and in Middle East construction services to7.5 per cent (2006: 5.2 per cent).
6. Generate cash-backed operating profitUnderlying cash flow from operations of £135.7 millioncomfortably exceeded underlying profit from operations of £101.2 million. Strong cash management is fundamental todelivering sustainable profitable growth and the consistent delivery of cash-backed profit remains a key performance indicator for the Group.
7. Achieve average net borrowing in the full-year of around £150 millionAverage net borrowing was £130.3 million and well below our full-year target. Achieving this objective and reducing netborrowing at 31 December to £44.9 million (2006: £108.0 million)follows our success in delivering a strong cash flow fromoperations, in line with our continuing focus on cashmanagement.

19 Carillion plcAnnual Report and Accounts 2007
Key performance indicators in 2008In order to maintain the Group’s strong momentum we have set the following key performance indicators for 2008
• continue to attract, develop and retain excellent people by being an employer of choice
• be the recognised leader in the delivery of safety and sustainability
• deliver revenue growth of a minimum of five per cent • successfully integrate Alfred McAlpine and deliver
integration cost savings that put us on track to achieve savings at a run rate of £30 million by the end of 2009
• achieve earnings per share growth that puts us on track to deliver materially enhanced earnings per share in 2009 following the Alfred McAlpine acquisition
• generate cash-backed operating profit• achieve year-end net borrowing in the region of £300 million.
Acquisition of Alfred McAlpineIn December 2007, we announced the terms of a recommendedshares and cash offer for the acquisition of Alfred McAlpine plc.The acquisition, which received the overwhelming support of Carillion and Alfred McAlpine shareholders, was completed on 12 February 2008 and valued Alfred McAlpine’s share capital at £554.5 million. The acquisition was funded by the issue of 112.9 million new Carillion shares, £171.7 million in cash and £1.3 million of loan notes.
Alfred McAlpine is an excellent strategic fit and the acquisition isexpected to deliver significant value for shareholders by generatingsubstantial synergy cost savings and enhanced operationalperformance. Combining the complementary skills and marketstrengths of Carillion and Alfred McAlpine will create
• a leading UK support services business with annual supportservices revenues of approximately £2.6 billion (based on 2007 revenues)
• an enhanced capability to provide integrated solutions, includingdesign, construction, maintenance, facilities management andprivate finance
• a strong and selective construction business that will continue to target margin improvement through the application ofCarillion’s project selectivity and risk management processes
• synergy cost savings at a run rate of £30 million per annum by the end of 2009 for a one-off cost of £30 million
• financial returns well ahead of Carillion’s weighted average cost of capital
• materially enhanced earnings in 2009.
The integration of the Carillion and Alfred McAlpine businesseshas already commenced and is progressing very well. We lookforward to working with our 8,500 new colleagues during 2008and beyond in order to create an even stronger business fromwhich all stakeholders can benefit.
Outlook and prospects Through the acquisition of Mowlem we have created a stronger,more resilient business, with enhanced positions in a wide rangeof growth markets.
At 31 December 2007 we had a £16 billion order book, of which£13.5 billion is for support services and Public Private Partnershipsprojects, and a pipeline of probable new orders worth £3.6 billion.
KeySupport servicesPublic Private Partnership projectsMiddle East construction servicesConstruction services (excluding the Middle East)
The overall outlook in our principal market sectors in the UK and international regions, which are described in more detail on pages 4 to 11 of this report, is expected to remain positive. In summary
• the UK support services market is forecast to grow in real termsby between two and three per cent per annum over the nextfive years from £115 billion in 2007 to £130 billion by 2012
• we expect continuing opportunities for Public Private Partnershipprojects in 2008 and over the medium term in both the UK and Canada and to continue to build a portfolio of good quality investments
• in the Middle East we expect our markets to remain very strong and we are confident of growing revenues from this region to over £600 million, from the 2007 level of £337 million, within the next two years, at margins of some six per cent
• the UK non-housing new-build construction market is forecast to grow in real terms by over two per cent per annumover the next three years
• in Canada and the Caribbean we expect continuing healthygrowth driven by Public Private Partnership projects and roadsmaintenance services.
In view of the Group’s strengths and positive outlook, I believe we are well positioned to make further strong progress in 2008 and deliver materially enhanced earnings in 2009.
John McDonough Group Chief Executive 5 March 2008
Order book
£16bn
£16bn
31 December 2007
31 December 2006
£3.6bn
£1.6bn
Probable orders
31 December 2007
31 December 2006
Section
03 – Ou
r perfo
rman
ce

20 Carillion plcAnnual Report and Accounts 2007
Our performanceOperating and financial review
In 2007, Carillion has again delivered strong earnings growth fromits UK and International businesses and we remain well placed tomake further strong progress in 2008 and over the medium term.
Carillion provides support services and integrated solutions,including design, construction, maintenance and private finance, to deliver life-time asset management for buildings andinfrastructure. The Group has operations in the UK, Middle Eastand Canada and the Caribbean and our principal market sectorsand activities are described on pages 4 to 11 of this report.
Accounting policiesThe Group’s annual consolidated financial statements have beenprepared in accordance with International Financial ReportingStandards and there have been no changes in accounting policiesduring 2007, except for disclosures in respect of financialinstruments in accordance with International Financial ReportingStandard, IFRS 7, which are set out in Note 28 on pages 93 to 95.The Group’s significant accounting policies are described on pages64 to 67.
Group overview Total revenue from continuing operations in 2007 increased by 13 per cent to £3,951.7 million (2006: £3,512.4 million),including revenue from Joint Ventures of £621.0 million (2006: £528.5 million).
Total underlying profit from continuing operations increased by 24 per cent to £101.2 million (2006: £81.3 million), includingprofit from Joint Ventures of £36.8 million (2006: £31.6 million).
The underlying profit from operations margin increased to 2.6 per cent (2006: 2.3 per cent) and reflected our continuingdrive to improve margins through contract selectivity, costreduction and greater efficiency. In particular, improving marginsover time in the businesses acquired with Mowlem and increasingthe contribution from our businesses in the Middle East continueto represent opportunities for enhancing earnings growth.
After a net financial income of £0.6 million, underlying profitbefore tax was £101.8 million, an increase of 23 per cent (2006: £82.6 million). Underlying earnings per share on the same measure increased by 22 per cent to 28.9 pence (2006: 23.7 pence).
Intangible amortisation and impairment of other investmentsamounted to £21.5 million (2006: £17.2 million including goodwill impairment), restructuring costs £14.2 million (2006: £22.6 million) and non-operating income £28.3 million(2006: £25.3 million), leaving reported profit before tax of £94.4 million (2006: £68.1 million).
I am pleased to report that Carillion made good progress in 2007 and that we either achieved or exceeded all of our key financial and strategic objectives.
Richard AdamGroup Finance Director

21 Carillion plcAnnual Report and Accounts 2007
Group taxation of £8.3 million (2006: £7.2 million) whencombined with Joint Ventures taxation of £9.0 million (2006: £8.1 million) represented an underlying effective tax rate of 25 per cent and profit after tax was £86.1 million. After a lossfrom discontinued operations of £7.6 million (2006: £0.5 million)and minority interests of £2.5 million (2006: £2.2 million), profit attributable to Carillion shareholders was £76.0 million(2006: £58.2 million). Basic earnings per share from continuingand discontinued operations were 27.1 pence (2006: 21.6 pence).
Underlying cash flow from operations of £135.7 millioncomfortably exceeded underlying profit from operations of £101.2 million. After payments of £46.3 million to pension funds in line with our pension deficit recovery plan, a net inflowfrom assets of £4.4 million, restructuring and other costs of £9.9 million, interest tax and dividend payments of £30.4 millionand a net cash inflow from acquisitions and disposals of £9.6 million, net borrowing at 31 December reduced by £63.1 million to £44.9 million (31 December 2006: £108.0 million). Average net borrowing was £130.3 million (2006 post the acquisition of Mowlem: £148.0 million) andsignificantly better than our objective of £150 million.
Segmental reporting and analysisOperating profit by financial reporting segment is summarised in the table on this page and a detailed segmental analysis of the Group’s businesses is provided in Note 2 to the financialstatements on page 68. Operating performance in each of our financial reporting segments is discussed in more detail onpages 22 to 29.
We have made two changes to the way we report our financialresults and how we group together activities of a similar type and risk profile in order to make it easier to value our earnings on a consistent basis. Previously, we reported our results in three segments – support services, investments and constructionservices. We now report our activities in four segments – support services, Public Private Partnership projects, Middle Eastconstruction services and construction services (excluding theMiddle East). Our Middle East construction activities, which were previously included within construction services, are nowbeing reported separately, because of their higher margins andlower risk profile compared with construction services in the UK.In addition, to provide greater clarity, the investments segment has been re-named Public Private Partnership projects, but therehas been no change to the results we report in this segment,namely the equity returns on our investments in Public PrivatePartnership projects.
Operating profit by financial reporting segment
Change from
2007 2006 2006£m £m %
Support services 73.9 58.8 26Public Private Partnership projects 25.4 26.5 (4)Middle East construction services 25.4 13.9 83Construction services (excluding the Middle East) 16.0 18.5 (14)
140.7 117.7 20Group eliminations and unallocated items (20.6) (20.3) (1)Profit from operations before Joint Ventures net financial expense and taxation 120.1 97.4 23Share of Joint Ventures net financial expense (9.9) (8.0) (24)Share of Joint Ventures taxation (9.0) (8.1) (11)Underlying profit from operations(1) 101.2 81.3 24Intangible amortisation and impairment of goodwill and other investments (21.5) (17.2) (25)Restructuring costs (14.2) (22.6) 37Reported profit from operations(2) 65.5 41.5 58
(1) Continuing operations before intangible amortisation, impairment, restructuring costs and non-operating items
(2) Continuing operations.
Section
03 – Ou
r perfo
rman
ce

Support servicesIn this segment we report the results of our facilitiesmanagement, facilities services, rail, road maintenance and consultancy businesses.
Revenue in support services increased by 23 per cent to £1,793.6 million of which some 20 per cent was due to organic growth, with the remainder attributable to having a full 12 months’ contribution from the businesses acquired withMowlem in February 2006. Organic growth was due primarily to increased revenues from facilities management and services,both for public and private sector customers, notably the Ministry of Defence, BT, Virgin Media and Norwich Union, and from highways maintenance in the UK and Canada, partially offset by lower volumes in rail infrastructure.
Underlying operating profit increased by 26 per cent to £73.9 million, reflecting revenue growth, particularly in theDefence sector, including Joint Venture contracts, and in the facilities management and road maintenance sectors.
Overall, new order intake in support services has remained healthy and the value of our order book for this segment at 31 December 2007 was £8.4 billion (December 2006: £8.4 billion).
The outlook in this segment continues to be very positive withforecast real growth in the UK support services market of betweentwo and three per cent per annum over the next five years.Outscourcing by public and private sector customers is expected to continue to provide significant opportunities for growth infacilities management and services and roads maintenance. This is already evident in the number of major new orders won by Carillion and its Joint Venture partners in the first twomonths of 2008 for established ‘blue chip’ customers, includingBT, AXA and Philips, worth around £0.9 billion.
We also expect modest growth in our UK rail infrastructureactivities as a result of planned increases in expenditure onnetwork and station enhancement projects. We expect to achievegrowth despite the effects of ceasing to provide track renewalservices to Network Rail from the beginning of 2008 and the saleof our rail operations in Scandinavia, which together generatedaround £100 million of revenue in 2007.
In addition, growth in the outsourcing of roads maintenance inCanada and in our facilities management markets in the MiddleEast and in Canada continue to offer opportunities for ourbusinesses in these regions to increase the contributions theymake to this segment.
22 Carillion plcAnnual Report and Accounts 2007
Our performanceOperating and financial reviewcontinued
KeySupport servicesPublic Private Partnership projectsMiddle East construction servicesConstruction services (excluding the Middle East)
(1) Continuing operations (2) Continuing operations before intangible amortisation,
impairment, restructuring costs and non-operating items(3) Before Group eliminations, unallocated items and
Joint Venture net financial expense and taxation.
Revenue(1)
2007 2006£m £m
Group 1,569.4 1,314.8Share of Joint Ventures 224.2 143.9Total 1,793.6 +23% 1,458.7
Underlying operating profit (2)
2007 2006£m £m
Group 62.4 51.5Share of Joint Ventures 11.5 7.3Total 73.9 +26% 58.8
Reported operating profit (1)
2007 2006£m £m
Group 48.0 33.6Share of Joint Ventures 11.5 7.3Total 59.5 +45% 40.9
45%of total
53%of total(3)
49%of total(3)

23 Carillion plcAnnual Report and Accounts 2007
+26%increase in underlying operating profit
Carillion provides non-clinical services for major acute hospitals and otherhealthcare facilities throughout the UK.
Section
03 – Ou
r perfo
rman
ce

Public Private Partnership projectsIn this segment we report the equity returns on ourinvestments in Public Private Partnership (PPP) projects in our chosen sectors of Defence, Health, Education,Transport, Secure and other Government accommodation.
At 31 December 2007, we had a portfolio of 23 equity investments(31 December 2006: 24) in financially closed PPP projects in which we had already invested some £78 million of equity andcommitments to invest a further £97 million, which will bring our total equity investment in these projects to £175 million. The Directors’ valuation of our portfolio at 31 December 2007increased by 12 per cent to £266 million (31 December 2006: £238 million), based on discounting the cash flows from theseinvestments and commitments at 8 per cent.
As expected, underlying operating profit in this segment reducedslightly to £25.4 million, with growing returns from our maturingportfolio of investments offset by two principal factors. First, the sale of eight equity investments in September 2006, at anexceptional profit of £25.6 million, reduced operating profit in2007 by some £7 million. Second, Group operating profit in 2006 benefited from a one-off fee as a result of achieving financialclose on the £12 billion Allenby Connaught project for the Ministry of Defence in April 2006.
We also sold investments in a further three mature PPP projects,namely the Great Western Hospital, Swindon, Harplands Hospital,North Staffordshire and Glasgow Southern General Hospital, inDecember 2007. The sale generated proceeds of £21.5 million and an exceptional profit of £23.6 million. The proceeds reflecteda net present value for the cash flows from these investmentsbased on a discount rate of under 5.5 per cent. Once again thesale of equity in mature projects has demonstrated the substantialvalue being generated for the Group through our ability to win and deliver PPP projects successfully by integrating our skills in project finance, design, construction, maintenance andfacilities management.
During the year, Carillion Joint Ventures achieved financial close onthe £200 million Sault Area Hospital in Ontario, Canada, in whichwe will invest £3.5 million of equity, and on the £175 millionSouth Tyneside and Gateshead Building Schools for the Future(BSF) project, in which we will invest £0.9 million of equity.
Since the year end, a Carillion Joint Venture has been appointedpreferred bidder for the £208 million Nottingham BSF project inwhich we expect to invest approximately £2.0 million of equity.We are also the preferred bidder for two NHS Independent SectorTreatment Centre projects – London North and Hertfordshire – inwhich we expect to invest up to £6 million of equity. In addition,we are shortlisted for a further 10 projects with a potential equity requirement of up to £96 million. Beyond that we expectcontinuing opportunities to bid for further PPP projects in the UK and in Canada.
Overall, the outlook in our chosen sectors of the PPP market, bothin the UK and Canada, remains positive and we expect furtheropportunities in 2008 and over the medium term to continue tobuild a portfolio of good quality investments that will generatesignificant value for the Group.
24 Carillion plcAnnual Report and Accounts 2007
Our performanceOperating and financial reviewcontinued
Net present value (£m)
Discount rate
Dec 2007 £266m(Dec 2006: £238m)
5% 6% 7% 8% 9% 10% 11% 12%0
50
100
150
200
250
300
350
400
450
+12% increase in Directors’ valuation of equity infinancially closed Public Private Partnership projects
KeySupport servicesPublic Private Partnership projectsMiddle East construction servicesConstruction services (excluding the Middle East)
(1) Continuing operations (2) Continuing operations before intangible amortisation,
impairment, restructuring costs and non-operating items(3) Before Group eliminations, unallocated items and
Joint Venture net financial expense and taxation.
Revenue(1)
2007 2006£m £m
Group 0.9 1.3Share of Joint Ventures 153.2 146.7Total 154.1 +4% 148.0
Underlying operating profit (2)
2007 2006£m £m
Group 0.7 7.1Share of Joint Ventures 24.7 19.4Total 25.4 -4% 26.5
Reported operating profit (1)
2007 2006£m £m
Group (1.2) 6.5Share of Joint Ventures 24.7 19.4Total 23.5 -9% 25.9
4%of total
18%of total(3)
20%of total(3)

25 Carillion plcAnnual Report and Accounts 2007
+12%increase in Directors’ valuation
Kyle Academy, one of six schools beingprovided for South Ayrshire Councilthrough a Carillion Public PrivatePartnership project.
Section
03 – Ou
r perfo
rman
ce

Middle East construction servicesIn this segment, we report the results of our building and civil engineering activities in the Middle East.
Revenue from our businesses in the Middle East increased by 25 per cent and underlying operating profit by 83 per cent as a result of continuing strong organic growth in our existingmarkets in Dubai and Oman, with operating margins improvingfrom 5.2 per cent to 7.5 per cent.
Carillion and its Joint Venture partners have continued to use their strong market positions and reputation for high qualityservices to negotiate substantial new work in our existing marketsin Dubai and Oman and also in Abu Dhabi and Egypt, where we will begin construction work on major new projects in 2008. At 31 December 2007, our Middle East order book stood at £0.7 billion (2006: £0.3 billion) and we had a pipeline ofprobable new orders worth over £1.0 billion (2006: £0.1 billion).
There were a number of notable successes in 2007. Theseincluded a £120 million contract for Carillion Alawi to build theHouse of Musical Arts for the Oman Royal Court Affairs and theappointment of Al Futtaim Carillion as the preferred bidder fortwo major contracts – a £250 million, 24-month contract for the first phase of the £10 billion Al Raha Beach development inAbu Dhabi and a £220 million, 30-month contract for the firstphase of the £2 billion Cairo Festival City development. Al FuttaimCarillion also signed a six-year framework agreement for a further£3.5 billion of work on the Dubai Festival City development.
The outlook in our markets in the Middle East is for continuingstrong growth. Current opportunities include the remainder of the Cairo Festival City development, worth around £1.8 billion, further contracts in Dubai worth up to £700 million, a £250 million contract for the Racetrack Hotel on Yas Island in Abu Dhabi and contracts in Qatar worth in the region of £300 million.
Given the major contracts, preferred bidder positions andframework agreements already secured, together with numerousopportunities for further work in this region, we remain confidentthat we will substantially increase our share of revenues from the Middle East from £337 million in 2007 to over £600 millionover the next two years, at margins of around 6 per cent.
26 Carillion plcAnnual Report and Accounts 2007
Our performanceOperating and financial reviewcontinued
KeySupport servicesPublic Private Partnership projectsMiddle East construction servicesConstruction services (excluding the Middle East)
(1) Continuing operations (2) Continuing operations before intangible amortisation,
impairment, restructuring costs and non-operating items(3) Before Group eliminations, unallocated items and
Joint Venture net financial expense and taxation.
Revenue(1)
2007 2006£m £m
Group 100.0 42.3Share of Joint Ventures 237.0 226.4Total 337.0 +25% 268.7
Underlying operating profit (2)
2007 2006£m £m
Group 9.6 1.3Share of Joint Ventures 15.8 12.6Total 25.4 +83% 13.9
Reported operating profit (1)
2007 2006£m £m
Group 9.6 1.3Share of Joint Ventures 15.8 12.6Total 25.4 +83% 13.9
9%of total
18%of total(3)
21%of total(3)

27 Carillion plcAnnual Report and Accounts 2007
+83%increase in underlying operating profit
The Intercontinental Hotel and CrownePlaza, part of the prestigious DubaiFestival City development, built by AlFuttaim Carillion.
Section
03 – Ou
r perfo
rman
ce

Construction services (excluding the Middle East)
In this segment, we report the results of our UK building,civil engineering and developments businesses and ourconstruction activities in Canada and the Caribbean.
Revenue in construction services increased by 2 per cent to £1,667 million, due to having a full 12 months’ contribution from the businesses acquired with Mowlem in February 2006. The substantial organic growth we achieved in the UK defenceand roads sectors was more than offset by reduced activity in UK building, where our focus is on increasing margins ahead of revenue.
Underlying operating profit reduced by 14 per cent, because the contribution from Joint Ventures was substantially lower than in 2006, which benefited from a number of contractsettlements not repeated in 2007. Underlying Group operatingprofit increased by 22 per cent, reflecting revenue growth andimproved margins, in line with our selective approach to theprojects we undertake.
While overall opportunities for new orders in this segment have remained strong, we have maintained our focus on longterm customers and projects that enable us to improve marginsrather than simply growing revenue. Notable new contracts in2007 included a pre-construction contract for the £300 millionsecond satellite at Heathrow Terminal 5 and a £90 million contract for the first phase of the £2 billion Kings Cross Centralregeneration project. This disciplined approach to project selectivity was reflected in our order book for construction services (excluding the Middle East), which stood at £1.8 billion at 31 December 2007 (December 2006: £2.6 billion).
The outlook in our construction markets is for continuing growth.In the UK, the non-housing new construction market is forecast to grow in real terms by an average of over two per cent perannum over the next three years. However, we shall continue to focus on using these buoyant market conditions to improvemargins ahead of revenues. In Canada, there are also prospects for further healthy growth, primarily from the construction ofPublic Private Partnership projects, particularly hospitals.
28 Carillion plcAnnual Report and Accounts 2007
Our performanceOperating and financial reviewcontinued
KeySupport servicesPublic Private Partnership projectsMiddle East construction servicesConstruction services (excluding the Middle East)
(1) Continuing operations (2) Continuing operations before intangible amortisation,
impairment, restructuring costs and non-operating items(3) Before Group eliminations, unallocated items and
Joint Venture net financial expense and taxation.
Revenue(1)
2007 2006£m £m
Group 1,660.4 1,625.5Share of Joint Ventures 6.6 11.5Total 1,667.0 +2% 1,637.0
Underlying operating profit (2)
2007 2006£m £m
Group 12.3 10.1Share of Joint Ventures 3.7 8.4Total 16.0 -14% 18.5
Reported operating profit (1)
2007 2006£m £m
Group 8.1 5.0Share of Joint Ventures 3.7 8.4Total 11.8 -12% 13.4
42%of total
11%of total(3)
10%of total(3)

29 Carillion plcAnnual Report and Accounts 2007
-14%reduction in underlying operating profit
No. 150 Cheapside, a landmark officedevelopment being built by Carillion in the heart of London.
Section
03 – Ou
r perfo
rman
ce

30 Carillion plcAnnual Report and Accounts 2007
Our performanceOperating and financial reviewcontinued
Intangible amortisation and impairment of goodwill and other investmentsIntangible amortisation and impairment of £21.5 million (2006: £17.2 million including goodwill impairment) continues to predominantly reflect the acquisition of Mowlem in 2006.
Restructuring costsA summary of restructuring costs is provided in the table below.
2007 2006£m £m
Mowlem integration costs 9.5 18.4Operational structure review costs 4.5 –Rail activities review costs 0.2 4.2
14.2 22.6
The integration of the Carillion and Mowlem businesses wascompleted earlier than expected in 2007, at a total one-off cost of £27.9 million, of which £18.4 million was incurred in 2006 and £9.5 million in 2007. This will generate savings of at least £26million per annum from the beginning of 2008 – substantiallymore than the £15 million that was originally expected at the timeof the Mowlem acquisition. Following the Group’s rapid growth,both organically and by acquisition, we reviewed and rationalisedour operational structure at the end of 2007 at a cost of £4.5million. This will generate further operational efficiencies andincrease the Group’s profitability in 2008 and beyond.
Non-operational itemsNon-operational items amounted to £28.3 million in 2007 (2006: £25.3 million) and largely related to the disposal ofinvestments in mature Public Private Partnership projects, asdescribed on page 24.
Net financial income The Group had a net financial income of £0.6 million (2006: £1.3 million). This comprised a net expense of £11.1 million inrespect of borrowings, interest received in respect of loans toSpecial Purpose Companies for Public Private Partnership projectsof £4.9 million and a net interest credit from retirement benefitschemes of £6.8 million.
TaxationThe effective tax rate on the Group’s and Joint Venture’sunderlying profit was 25 per cent and we currently expect tomaintain this rate over the medium term. Our effective tax ratereflects the agreement of certain prior year tax issues with the tax authorities, together with a mechanism for the use of certaintax losses acquired with Mowlem plc, both in 2007 and in futureyears. At 31 December 2007 the Group had £232 million ofcorporate tax losses in the UK that are available to reduce future tax liabilities.
Earnings per shareUnderlying earnings per share from continuing operationsincreased by 22 per cent to 28.9 pence (2006: 23.7 pence). This substantial increase reflected strong organic growth in theGroup’s operations and the benefits of successfully integrating the Carillion and Mowlem businesses earlier than originallyexpected, in particular the delivery of integration cost savings
at a run rate of £26 million by the end of 2007. The 22 per centincrease in underlying earnings per share from continuingoperations achieved in 2007 also comfortably exceeded the profit forecast made by the Group on 12 December 2007 as partof the process of acquiring Alfred McAlpine plc, when the Groupforecast that its 2007 growth in underlying earnings per sharefrom continuing operations would be at least 20 per centcompared with 2006.
Discontinued operationsThree non-core businesses were sold in 2007 and treated asdiscontinued, namely, Pall Mall, Sovereign Soft Services and theGroup’s rail activities in Sweden and Denmark. These salesgenerated a net loss of £6.2 million together with £1.4 million of trading losses in 2007 up to the dates of sale. Details of thesesales are given in Note 8 to the consolidated financial statementson page 76.
Dividend Carillion has a progressive dividend policy of increasing thedividend paid to shareholders broadly in line with earnings growth,after taking account of the investment needs of the business.Consistent with this policy, the Board has recommended a finaldividend in respect of 2007 of 7.5 pence, making the full-yeardividend 11.0 pence, an increase of 22 per cent on the total paid in respect of 2006 (9.0 pence). Underlying dividend cover was 2.6 times and similar to that in 2006.
Cash flowA summary of the Group’s cash flows is shown below.
2007 2006(1)
£m £m
Underlying Group operating profit 64.4 49.7Depreciation and other non-cash items 15.9 18.5Working capital 31.7 15.2Dividends received from Joint Ventures 23.7 15.7Total underlying cash inflow from operations 135.7 99.1Deficit pension contributions (46.3) (31.8)Restructuring costs (6.5) (18.2)Interest, tax and dividends (30.4) (25.7)Net inflow/(outflow) from assets/capital expenditure 4.4 (28.2)Acquisitions and disposals 9.6 (190.9) Other – including discontinued operations (3.4) (3.1)Change in net borrowing 63.1 (198.8)Net (borrowing)/cash at 1 January (108.0) 90.8Net borrowing at 31 December (44.9) (108.0)
Average net borrowing (130.3) (148.0)
(1) Restated to exclude discounted operations.(2) Post acquisition of Mowlem plc.
Carillion’s focus on cash management and the delivery of cash-backed profit was again reflected in our underlying cash flow from operations of £135.7 million, which was significantly ahead of underlying profit from operations of £101.2 million.
(2)

Five-year total shareholder return
One-year total shareholder return
Retirement benefitsThe Group’s ongoing pensions charge against profit in 2007 was£29.3 million (2006: £35.1 million) calculated on the basis ofInternational Accounting Standard 19. After the additional cashpayments of £46.3 million that were made to the Group’s pensionsschemes in line with our pension deficit recovery plan, the Group’spension schemes had a deficit net of tax at 31 December 2007 of £13.8 million (31 December 2006: £75.8 million).
Committed bank facilitiesIn September 2007, Carillion renegotiated and increased its maincorporate borrowing facility from £329 million to £590 million to support the ongoing development of the Group. This new five year facility, which is repayable on 30 September 2012, was over-subscribed and secured on attractive terms. Syndication of the new facilities was led by four core banks, The Royal Bank ofScotland, Bank of Scotland plc, Bayerische Landesbank, LondonBranch, and Lloyds TSB Bank plc. It was particularly pleasing to secure these facilities during the challenging conditions of the global debt markets, which demonstrated the bankingcommunity’s strong support for, and confidence in, the Carillion Group. These new facilities also proved to be more than adequate to finance the £171.7 million cash element of the total £554.5 million consideration for the acquisition of Alfred McAlpine plc that completed in February 2008.
31 Carillion plcAnnual Report and Accounts 2007
Additional cash payments to the Group’s pension’s schemesincreased to £46.3 million in line with our pension deficit recoveryplan. There was a net cash inflow from assets of £4.4 million,because capital expenditure of £25.1 million was more than offset by income from the sale of assets, including rail plant andproperty. The substantial cash outflow in respect of acquisitionsand disposals in 2006 was due to the acquisition of Mowlem; the net inflow in 2007 reflected proceeds from the disposal ofbusinesses, including the three mature Public Private Partnershipprojects disposed of during the year, partially offset by investmentsin Public Private Partnership projects and a Joint Venture businessin Canada.
Balance sheet Carillion’s balance sheet remains strong and is summarised below.
December December2007 2006
£m £mProperty, plant and equipment 131.5 146.6Intangible assets 555.8 596.1Investments in Joint Ventures 185.9 178.8
873.2 921.5Inventories, receivables and payables (286.5) (282.0)Net retirement benefits liability (net of tax) (13.8) (75.8)Other (25.1) (22.0)Net operating assets 547.8 541.7Net borrowing (44.9) (108.0)Net assets 502.9 433.7
The reduction in property, plant and equipment was due to assetdisposals, including rail plant and property. Intangible assetsreduced, reflecting amortisation and the disposal of Pall Mall. The increase in investments in Joint Ventures reflected the Group’s equity investments in Public Private Partnership projects.
The substantial reduction in the Group’s net retirement benefitsliability, reflected the substantial improvement in equity valuesduring the year, together with the additional cash payments madeto our pensions schemes under our deficit recovery plan.
Share price Carillion’s share price closed at 351.25 pence on 31 December2007, a reduction of 11.5 per cent on the closing price on 31 December 2006.
In common with many companies in our sector, Carillion’s totalshareholder return reduced in 2007. The overall reduction of 9.4 per cent compared with an increase of 5.9 per cent for the FTSE 350. However, over the last five years Carillion’s totalshareholder return has significantly outperformed that of the FTSE 350. The FTSE 350 was chosen by the Board as the bestcomparator to illustrate Carillion’s performance against a broadequity market index.
Carillion Total ReturnFTSE 350 Total Return
01 Feb
01 Jan
01 Mar
01 Apr
01 May
01 Jun
01 Jul
01 Aug
01 Sep
01 Oct
01 Nov
01 Dec
31 Dec
85
90
95
100
105
110
115
2003 2004 2005 2006 2007 2008406080
100120140160180200220240260280300320340360380400420440460480
Section
03 – Ou
r perfo
rman
ce

32 Carillion plcAnnual Report and Accounts 2007
Our performanceOperating and financial reviewcontinued
the Joint Venture partners and secured on the assets of the SPC. A number of SPCs have entered into interest rate derivatives as ameans of hedging interest rate risk. These derivatives are interestrate swaps that effectively fix the rate of interest payable.
Operational risk managementCarillion has rigorous policies and processes in place to identify,mitigate and manage operational risks. These enable us to address strategic risks and those specific to individual businessesand contracts, including economic, social, environmental andethical risks.
The more significant areas of risk where our failure to perform well or changes to macro-economic or market environmentswould affect our business, can be summarised as follows
• attracting, developing and retaining excellent people: the success and growth of our business depends primarily on the quality of our people
• winning new work: our ability to remain competitive byadapting our strategy and service offering to the changingneeds of our markets and customers is essential to thecontinuing success of our business
• managing major contracts: completing contracts on time and to the required standards avoids financial penalties anddamage to our brand and reputation
• managing our pension schemes: the costs to Carillion of funding its pension schemes depends on the macro-economicenvironment, equity market stability and regulatory requirements
• financial discipline: strong cash management and the delivery of cash-backed profits remain fundamental to the success of our business
• integration of the Carillion and Alfred McAlpine businesses:delivery of the substantial cost synergy and operational benefits of the acquisition depends on the successful integration of these businesses.
We apply our risk management processes to every aspect of ouroperations from choosing our market sectors and the contracts we bid for to the selection of our suppliers and sub-contractors.We also apply them to every stage of a contract from inception to completion, in order to deliver the cash-backed profit we expectand high-quality services for our customers.
Going concernThe Directors confirm that, after making enquiries, they have areasonable expectation that the Company and the Group hasadequate resources to continue in operational existence for theforeseeable future. For this reason, they continue to adopt thegoing concern basis in preparing the financial statements.
Richard Adam FCAGroup Finance Director5 March 2008
Treasury policy and risk managementThe Group has a centralised Treasury function whose primary roleis to manage funding, liquidity and financial risks. In addition,Treasury sources and administers contract bond and guaranteefacilities for the Group. Treasury is not a profit centre and does notenter into speculative transactions. The Board sets policies withinwhich Treasury operates that ensure the most effective financingof the Group’s operations and limit exposure to financial risk.
Financial riskThe areas of significant financial risk facing the Group relate to funding, liquidity, counter party risk, foreign exchange andinterest rates.
Funding and liquidity In addition to Carillion plc’s principal borrowing facilities describedabove, money market and short-term overdraft facilities areavailable to Carillion plc and certain subsidiaries. Operating leases are also employed to fund longer-term assets. The quantum ofcommitted borrowing facilities available to the Group is regularlyreviewed by the Carillion Board and is designed to satisfy therequirements of the Group’s business plan.
Counter party riskThe Carillion Group undertakes significant financial transactionsonly with counter parties that have strong credit ratings. The limitsand requirements in respect of such transactions are reviewedregularly by the Board of Carillion plc.
Foreign exchangeThe Group hedges all significant currency transaction exposuresusing foreign exchange risk management techniques. In order toprotect the Group’s balance sheet from the impact of exchangerate volatility, foreign currency net assets are hedged usingmatching currency loans, where these assets exceed the equivalent of £10 million. Profits arising within overseassubsidiaries are not hedged unless it is planned to make adistribution. Such distributions are then treated as currencytransactions and hedged accordingly.
The average and year end exchange rates used to translate theGroup’s overseas operations were as follows:
Average year end
£sterling 2007 2006 2007 2006
Middle East (US Dollar) 2.00 1.85 1.99 1.96Oman (Rial) 0.77 0.71 0.77 0.75UAE (Dirhams) 7.63 6.79 7.31 7.19Canada (Dollar) 2.14 2.09 1.96 2.28Trinidad (Dollar) 12.64 11.68 12.52 12.17
Interest ratesThe Group’s borrowing facilities are at floating rates of interestlinked to the London Inter Bank Offered Rate. The Group has not entered into interest rate derivatives to fix or hedge interestrate risk and currently none are outstanding. Certain longer-termassets have been financed using fixed rate leases.
Carillion has invested equity in a number of Joint Venture SpecialPurpose Companies (SPC) to deliver Public Private Partnershipprojects. SPCs obtain funding for these projects in the form oflong-term bank loans or corporate bonds without recourse to

33 Carillion plcAnnual Report and Accounts 2007
Our performanceSustainability review
In this section of our Annual Report wehave summarised what we are doing to make our business more sustainable. A more detailed account will be publishedin our 2007 Sustainability Report, on ourwebsite, in April 2008.We believe that our leadership in sustainability will increasinglydifferentiate us from our competitors and help us to win moreorders, minimise our social, environmental and ethical risks, control costs and deliver better services to our customers.
StrategyWe have a well established strategy model for sustainabledevelopment, which is aligned with the four priority areas defined by the UK Government in its sustainable developmentstrategy, ‘Securing the Future’, namely
• sustainable communities• natural resource protection and environmental enhancement• climate change and energy• sustainable consumption and production.
We have identified 12 behaviours and activities across these four priority areas, as illustrated in our ‘sun diagram’ below, which affect the delivery of our business objectives.
Managing sustainability Our commitment to sustainability is driven by our Board,supported by a Sustainability Advisory Committee. This Committeeis chaired by our Group Chief Executive, John McDonough, andincludes a number of senior Directors, drawn from across ourbusinesses, to ensure that it maintains close links with the Group’soperational activities. The Committee also benefits from expertadvice from two external members, Jonathon Porritt, Chair of theUK Government’s Sustainable Development Commission, and JuliaCleverdon, Chief Executive of Business in the Community (BITC).
Hea
lth
and
Safe
ty
Our Peo
ple
Community
EnvironmentalImpacts
Bio-diversity
Resource
UseSupply
Chain
Governance
Customers
Valueand Risk
Design
Atm
osph
eric
Impa
cts
Makingtomorrowa better
place
Sustainable
Comm
unities
and Workforce
Susta
inable
Consumptio
n
and Pr
oduction
Natur
al Re
sour
ce Pr
otec
tion
and E
nviro
nmen
tal
Enha
ncem
ent
Climate
Change
and Energy
Behaviours and activitiesaffecting sustainable development
In 2007, we also established a forum in which our senior businessleaders can meet regularly to share best practice and support thedevelopment of our sustainability strategy and its disseminationacross the Group. In addition to the annual sustainability plans and objectives we set for all our businesses, we also organise a ‘sustainability week’, a Group-wide programme that coincides with World Environment Day that focuses on howindividuals and teams can adopt a more sustainable lifestyle and contribute to making Carillion a sustainable business.
Our performanceIn 2007, we continued to set specific targets for each of ourbusiness units and for the Group as a whole. In addition, wefocused on five key areas, namely
• communicating simply and consistently to all our people to ensure a common understanding of our strategy andobjectives for sustainability
• establishing new internal branding for sustainability• developing a clear policy for understanding and managing
our carbon emissions• introducing quarterly progress reviews of performance
against our key performance indicators and sustainabilityexcellence model and
• improving our performance in Business in the Community’sCorporate Responsibility Index.
The Group’s key sustainability objectives for 2007 were based on14 specific and measurable targets. In order to drive continuousimprovement, these were demanding targets and our performanceagainst them has been independently audited by Bureau Veritas. A full report on what we have achieved, including our scoresagainst these targets and key objectives, will be published in our2007 Sustainability Report in April 2008.
Participating in Business in the Community’s CorporateResponsibility Index enables us to benchmark our performanceexternally. Since the inception of the Index in 2003, Carillion hasimproved its score each year. In the 2006 Index (published in 2007)Carillion achieved a ‘gold’ performance ranking of 92.5 per cent,topping the construction and building materials sector. Theaverage score of all participating companies was 87 per cent,which demonstrates that Carillion not only continues to be theleader in its sector, but that our performance compares favourably with that of companies in all sectors.
Carillion continues to be a member of the FTSE4Good index and we were also delighted to be ranked among the top 20 most ethical firms in the UK in 2007 by The Observer’s‘Good Company Guide’.
Our sustainability strategy also won the top award for the bestCorporate Social Responsibility Strategy at both the CorporateCommunications magazine awards and the Midlands Region PRide Awards.
We say more about what we are doing to improve our impacts in the four priority areas of the Government’s sustainabledevelopment strategy, ‘Securing the Future’, on pages 34 and 35.
Section
03 – Ou
r perfo
rman
ce

34 Carillion plcAnnual Report and Accounts 2007
Our performanceSustainability reviewcontinued
Sustainable Communities and WorkforceCreating a sustainable business requires the commitmentof all our people – the ‘Carillion community’. We seek toachieve this through our Health and Safety, leadership,personal development and employee engagementprogrammes, which are described in more detail onpages 16, 18, 40 and 41.
How we do business is based on our belief that it’s not onlywhat we do that matters, but also how we do it, which drivesour commitment to ‘living’ our values in everything we do.Through our Values Awards we recognise the outstandingcontributions our people make to our success in delivering an excellent service to our customers and 1,500 Carillionpeople received these awards in 2007.
Our commitment to sustainable communities extends beyondour own people. We have a community engagement strategyfor all our major worksites and projects and we encourage our people to understand how we can have positive impactson the communities in which we operate and to participate in community activities.
Carillion is a member of Business in the Community’s ‘PerCentClub’, which comprises companies that contribute over oneper cent of their pre-tax profits in cash or in kind to communityactivities. We support the Business Action on Homelessnesscampaign designed to help homeless people break the cycle of‘no home, no job’ and in 2007, we supported 57 peoplethrough the ‘Ready to Work’ programme.
As one of the UK’s leading providers of training for supportservices and construction skills, we contribute to thedevelopment of individuals and communities. In 2007, around1,200 apprentices successfully completed their training in oneof our 18 UK training centres and some 200 people receivedtraining for entry level jobs in the construction industry.
Natural Resource Protection and Environmental EnhancementCarillion has developed and implemented environmentalmanagement systems across the Group and over 99 per cent of our UK operations are now accredited to ISO 14001 by a registered third party.
What we do and how we do it can have significant impactson the use of natural resources and the environment and we use our knowledge and skills in developing sustainablesolutions to create positive impacts in these areas.
The preservation of natural habitats and the wildlife theysupport is important both socially and environmentally. Sevenyears ago we entered into a partnership with the WildlifeTrusts and established the Carillion Natural Habitats Fund. To date we have contributed over £185,000 to the fund tofinance 32 projects and provide opportunities for our peopleto volunteer and support the preservation of natural habitats.
In recognition of our leadership in sustainability, Carillion wasrepresented on two of the working groups that supported the UK Government’s Sustainable Procurement Taskforce and helped in the development of its ‘Flexible Framework’.Under the framework there are four ‘levels’ of achievement in respect of sustainable procurement. We were delighted toachieve Level 1 in 2007 and plan to achieve Level 4 by 2010.
Carillion continues to be a member of the WWF-UK Forestand Trade Network and we purchase timber from ForestStewardship Council certified sources wherever possible. Wealso report the volumes and sources of the timber we use tothe WWF annually.
01. 02.

35 Carillion plcAnnual Report and Accounts 2007
Climate change and energyGlobal warming and climate change are now widelyaccepted as areas of major international concern.Carillion is committed to addressing these issues and in 2007 we calculated our carbon footprint for ouremissions in 2006.
This focused on all the areas relevant to our business,including air, train and road travel (company cars, commercialvehicles and hire cars), the consumption of electricity, gas, fuel oil and paper and the production, re-use andrecycling of waste.
This was our first major step towards gaining a comprehensiveunderstanding of our carbon footprint. Our findings from this study showed that we generated 62,296 tonnes of CO2in 2006, which has set the benchmark for our programme to reduce emissions year on year.
We employ around 50,000 people in the Group and as the nature of our business involves extensive travel we arestudying the effects of our travel policies on our carbonfootprint. We have already introduced Company policies topromote diesel powered vehicles and to reduce overall travel.
Our commitment to tackling climate change is also reflectedin the way we work with our customers to provide sustainablebuildings, infrastructure and lifetime facilities managementand services.
Carillion’s Joint Venture business, ‘Aspire Defence CapitalWorks’, which is responsible for the construction element ofour £12 billion Allenby Connaught Public Private Partnershipproject for the Ministry of Defence, won the top awards forSustainable Development of the Year and Best SustainableInitiative for the Public Sector, at the 2007 Building magazineSustainability Awards.
Sustainable Consumption and ProductionCarillion’s leadership in developing and implementingits sustainability strategy model, which relates ourimpact on the environment and on society to businessperformance, has made a major contribution to theGroup’s risk management policies and processes. Theseaddress strategic risks and those specific to individualbusinesses and contracts, including economic, socialenvironmental and ethical risks, and are thereforefundamental to the management of the Group at every level of our activities.
In 2007 we undertook a Group-wide customer perceptionsurvey, which sought the views of our customers on a widerange of issues, including the importance of sustainability. 68 per cent of our customers believe sustainability and ourability to deliver sustainable solutions to be very important.
We believe that our leadership in sustainability differentiatesus from competitors. We seek to understand the needs of our customers and their objectives in respect of sustainabilityand use our knowledge and skills to meet their needs bydeveloping sustainable solutions. We also seek to promotesustainable solutions by explaining to all our customers how a sustainable approach can not only create positive impacts on the environment and on society, but also reduce costs,increase efficiency and improve the quality of the services we offer.
The Eco-Depot in York, completed in 2007 and picturedabove, is an outstanding example of what can be achievedthrough applying the principles of sustainable design andconstruction. This is the largest timber frame straw bale cladbuilding in Europe, which uses 76 per cent less energy than a traditional air-conditioned office.
01. Theeba Regunathan, a member ofthe Carillion legal team, receivingBusiness in the Community’s ‘IndividualVolunteer of the Year’, South East,award.
02. Implementing Biodiversity ActionPlans is fundamental to the success of Carillion projects.
03. Hadyard Hill Wind Farm, SouthAyrshire, one of the UK’s largest windfarms, built by Carillion for Scottish &Southern Energy.
04. The EcoDepot in York, designed andbuilt by Carillion, is an award-winning,national exemplar of sustainableconstruction.
03. 04.
Section
03 – Ou
r perfo
rman
ce

36 Carillion plcAnnual Report and Accounts 2007
Section 04
04Governance
38 Board of Directors40 Report of the Directors43 Corporate Governance Report48 Remuneration Report56 Statement of Directors’ Responsibilities
in respect of the Annual Report andFinancial Statements
57 Independent auditors’ report to the members of Carillion plc
PME, a wholly owned subsidiary ofCarillion, is a UK leader in the provisionof mechanical and electrical engineeringmaintenance services.

37 Carillion plcAnnual Report and Accounts 2007
22%growth in dividend
Section
04 – Go
vernan
ce

38 Carillion plcAnnual Report and Accounts 2007
01. Philip Rogerson Chairman Age 63. Philip was appointed to the Board in October 2004becoming Chairman in May 2005. He is Chairman of theNominations Committee. Philip is also Chairman of Aggreko plc,THUS Group plc and Northgate plc and a Non-Executive Directorof The Davis Service Group plc. He was an Executive Director ofBG plc from 1992 to 1998, latterly as Deputy Chairman.
02. John McDonough Group Chief Executive Age 56. John was appointed Group Chief Executive in January2001 having formerly been Vice President, Integrated FacilitiesManagement, Europe, the Middle East and Africa of JohnsonControls Inc. He is Chairman of the CBI’s Public Services Forum,Vice-Chairman of the CBI’s Public Services’ Strategy Board and a member of the CBI’s President’s Committee. He is also a Non-Executive Director of Tomkins plc.
03. Richard Adam Group Finance Director Age 50. Richard Adam was appointed Group Finance Director inApril 2007. He qualified as a chartered accountant with KPMG in 1982 and gained broad experience in a number of public and private company finance director roles from the age of 30.Immediately prior to joining Carillion, Richard was Group FinanceDirector of Associated British Ports Holdings plc. He is also a Non-Executive Director and the chairman of the Audit Committeeof SSL International plc.
04. David Garman Senior Independent Non-Executive Director Age 56. Appointed to the Board in September 2004, David is Chairman of the Remuneration Committee and a member of the Audit and Nominations Committees. David is Group ChiefExecutive of TDG plc which he joined in 1999 from AssociatedBritish Foods plc where he was an Executive Director, havingpreviously held senior positions in a number of leading UK food companies.
05. David Hurcomb Executive DirectorAge 44. David was appointed to the Board on 1 January 2008.David has responsibility for Carillion’s Building business. A graduateengineer and chartered accountant, he joined Carillion in March2005 from Balfour Beatty Plc. From 1990 to 2003, David wasemployed in a number of senior positions by Mansell plc, latterlyas an Executive Director. Prior to 1990, David worked for KPMG.
GovernanceBoard of Directors
01 02 03 04 05

39 Carillion plcAnnual Report and Accounts 2007
06. Don Kenny Executive DirectorAge 53. Don was appointed to the Board in September 2006 and is responsible for Carillion’s Services businesses. He joinedCarillion from Johnson Controls Inc in 2002, having held a number of senior positions in Johnson Controls and prior to that in Mowlem plc. Don was also a Director of Aspire DefenceFinance PLC, a Joint Venture between Carillion, Kellogg Brownand Root and HSBC to deliver Project Allenby Connaught, theMinistry of Defence’s largest Estates Public Private Partnershipcontract to date.
07. David Maloney Non-Executive DirectorAge 52. David was appointed to the Board in November 2005 and is Chairman of the Audit Committee and a member of theNominations and Remuneration Committees. David is Chairman of Hoseasons Holdings Ltd and a Non-Executive Director of MicroFocus International plc, Ludorum plc and Cineworld Group plc. He is also Chairman of the Board of Trustees for Make a WishFoundation UK. Before taking up these appointments, David held senior positions in a number of services sector companies,including Chief Financial Officer for Le Meridien Hotels and Resorts Limited, Chief Financial Officer for Thomson Travel Group(Holdings) plc and Group Finance Director of Avis Europe plc.
08. Steve Mogford Non-Executive DirectorAge 51. Steve was appointed to the Board in September 2006and is a member of the Audit, Nominations and RemunerationCommittees. Steve is Chief Executive of Selex Sensors andAirborne Systems SpA, a Finmeccanica company, which he joined in May 2007. From April 2000 to May 2007, he was aDirector of BAE Systems plc with responsibility latterly for UK naval sector consolidation.
09. Vanda Murray OBE Non-Executive DirectorAge 47. Vanda was appointed to the Board in June 2005 and is a member of the Audit, Nominations and RemunerationCommittees. Vanda is Non-Executive Chairman of EazyfoneLimited, Deputy Chairman Elect of the North West DevelopmentAgency, a Director of The Cheshire Building Society and is a Fellowof the Chartered Institute of Marketing. Vanda was a Director ofUltraframe plc prior to its takeover in 2006 and was previouslyChief Executive of Blick plc and until April 2007, was a trustee andNon-Executive Director of The Manufacturing Institute. She wasappointed OBE in 2002 for Services to Industry and to Export.
10. Roger Robinson Executive Director Age 56. Roger joined Tarmac Construction as Contracts Director in 1989 subsequently becoming Managing Director of Tarmac Civil Engineering, International and Rail. Roger was appointed to the Board of Carillion plc in May 1999 and has Groupwideresponsibility for infrastructure, international, commercial andhealth and safety matters. He is a Fellow of the Institution of Civil Engineers and was a member of the GovernmentTaskforce on Modern Apprenticeships.
06 07 08 09 10
Section
04 – Go
vernan
ce

40 Carillion plcAnnual Report and Accounts 2007
GovernanceReport of the Directors
The Directors of Carillion plc present their annual report, togetherwith the audited financial statements for the year ended31 December 2007.
The Directors of the Company at the date of the approval of thisDirector’s Report confirm, that, so far as they are individuallyaware, there is no relevant audit information of which theCompany’s auditors are unaware; and each Director has taken all the steps that he or she ought to have taken as a Director tomake himself or herself aware of any relevant audit informationand to establish that the Company’s auditors are aware of that information.
Principal activities and business reviewCarillion is a leading company delivering support services,construction and public private partnership projects throughoutthe UK and in a number of overseas regional markets.
A review of the Group’s businesses, financial performance andfuture developments is contained in the Chairman’s statement, Group Chief Executive’s review and the Operating and financialreview.
The following specific issues are discussed in the sections shown in brackets
• the acquisition of Alfred McAlpine (Chairman’s statement and the Group Chief Executive’s review)
• key objectives and performance in 2007 and 2008 objectives(Group Chief Executive’s review)
• performance in the financial year (Operating and financial review)
• treasury policy and risk management (Operating and financial review)
• social, community and environmental issues (Sustainabilityreview)
• principal risks and uncertainties facing the Group (Operating and financial review)
• resources/employees (Group Chief Executive’s review and Report of the Directors)
• financial risk (Operating and financial review).
Analysis of turnover and net assets by business segment andgeographical location are given in Note 2 on page 68.
Share capitalAt the Extraordinary General Meeting of the Company held on 14 January 2008 to approve the Alfred McAlpine acquisition, the authorised share capital of the Company was increased to525,000,000 ordinary shares of 50p each. At 5 March 2008, the issued ordinary share capital of the Company was 394,191,964 shares. Carillion has only one class of shares, with one vote for every share.
Profits and dividendsThe consolidated income statement is shown on page 60. Profit before tax was £94.4 million (2006: £68.1 million).
A 2007 interim dividend of 3.5 pence per ordinary share (2006: 3.1 pence) was paid in November 2007. It is proposed to pay a final dividend of 7.5 pence per ordinary share (2006: 5.9 pence) on 20 June 2008 to shareholders on the register at the close of business on 25 April 2008. Thepayment of these 2007 interim and final dividends amounts to £39.4 million (2006: £25.3 million).
A dividend reinvestment plan (DRIP) will also be offered.
DirectorsThe Directors of the Company who served during 2007 are shownon page 49 of the Remuneration Report. Biographical details foreach Director at 31 December 2007 and for David Hurcomb whowas appointed on 1 January 2008 are given on pages 38 and 39.
Mr Hurcomb will hold office until the Annual General Meeting atwhich, being eligible, he offers himself for election. Mr Hurcombhas a contract of service which is subject to one year’s notice oftermination by the Company.
In accordance with the Articles of Association, Philip Rogerson and David Garman retire by rotation and, being eligible, offerthemselves for re-election at the Annual General Meeting on 7 May 2008.
The interests of the Directors and their families in the share capital of the Company are shown in the Remuneration Report on page 55.
EmployeesInformation relating to employee numbers and remuneration isgiven in Note 6 on page 74.
Employees are key to achieving Carillion’s business strategy andthe Group is committed to improving their skills through trainingand development and nurturing a culture in which employees feel valued for their contribution and are motivated to achievetheir full potential.
Carillion’s core values of openness, collaboration, mutualdependency, sustainable profitable growth, professional deliveryand innovation have been developed to emphasise the changingworking practices required to succeed in an environment wherepartnership and integrated solutions are becoming the norm.
It is Carillion’s aim to foster a working environment in which allemployees are treated with courtesy, dignity and respect. Carillionstrives continually to eliminate all bias and unlawful discriminationin relation to job applicants, employees, business partners andmembers of the public. Employees who become disabled are,wherever possible, retrained or provided with equipment so thatthey can continue their employment.

41 Carillion plcAnnual Report and Accounts 2007
The objectives of Carillion’s Equal Opportunity and Diversity Policy are
• to have a workforce that represents and responds to thediversity of customers and today’s society
• improved safety and quality provided by a balanced andproductive workforce
• better public image and market position, leading to improvedlinks with the community in which Carillion works
• adherence to legal requirements• lower staff turnover, absenteeism and sickness levels leading
to cost savings• to provide a fair working environment in which discrimination
will not be tolerated• to create a working environment free from discrimination,
harassment, victimisation and bullying• to work towards finding ways for under represented groups
to fully realise their potential within the Carillion Organisationand to take reasonable steps to help such groups
• to ensure that all employees are aware of the Group EqualOpportunities and Diversity Policy and to provide any necessaryongoing training to enable them to meet their responsibilitiesunder it
• Carillion plc also recognises the merit of developing a workforcethat incorporates the many diverse skills and backgroundsavailable from within the total population and accordingly, willstrive to become an organisation that will recognise, value andunderstand diversity and to provide its employees with genuineopportunities to improve and reach their full potential.
Carillion places great importance on open and regularcommunication with employees through both formal and informalprocesses. As part of this commitment, a Group newspaper,‘Spectrum’, is produced on a regular basis for all employees.
The views of employees on matters affecting their interests arealso sought through ‘The Great Debate’. This is a major exercisewhich was undertaken by the Group in each of the last five yearsto capture the feelings and views of as wide a range of employeesas possible. These views are then taken into account in thedevelopment of work related initiatives as part of Carillion’sstrategy to become an employer of choice. In 2007, around 2,500 UK employees attended ‘The Great Debate’ sessions.
Carillion stages ‘The Great Debate’ as part of the ongoing questfor cultural change and to produce step changes which
• raise understanding of what drives motivation, morale,engagement and performance
• allows employees to take ownership and be empowered tobuild and implement solutions
• demonstrates Carillion’s desire to change attitudes andbehaviours based on listening to the views of its employees.
Additionally, ‘Team Talk’ which is held monthly provides Carillionemployees with a face-to-face communication with their linemanagers and facilitates two-way communication, discussion and feedback. It focuses on local issues and key corporatemessages and information.
One-to-one meetings between individual employees and their line managers are also held to discuss performance and progress.
Employees can also exchange best practice information via aKnowledge Management Forum on the Group intranet.
Carillion seeks to involve all employees in its leading edgeprogrammes to integrate safety into everything it does and to improve its environmental performance, including theunderstanding and application of the principles of sustainability.Further information on Health and Safety is given in the GroupChief Executive’s review on page 18 and on Sustainability in theSustainability review on pages 33 to 35.
Carillion also involves, engages and consults with employeesthrough ‘People Forums’ across the Group which give employeesthe opportunity to express their views on business issues.Specifically, the objectives of the ‘People Forums’ are to
• improve employee information and consultation• help employees feel more involved and valued• support the continued education and development
of employees• improve business performance by enabling employees to be
better aware of the business climate in which they operate• help employees to be responsive to and better prepared
for change.
Substantial share interestsAt 5 March 2008, the Company had received formal notificationof the following persons interested directly or indirectly in three per cent or more of the issued ordinary share capital of theCompany (being the threshold for notifications of interests inshares in the Disclosure and Transparency Rules of the UKLA):
Number of shares held Percentage
Schroder plc 66,441,975 16.86Standard Life Investments Ltd 49,449,913 12.54F & C Asset Management plc 14,247,566 3.61HBOS plc 14,036,048 3.56UBS Investment Bank 13,424,716 3.41
Section
04 – Go
vernan
ce

42 Carillion plcAnnual Report and Accounts 2007
GovernanceReport of the Directorscontinued
Policy for payment of suppliersIt is the policy of the Group that each business agrees terms andconditions for transactions with its suppliers and for payment to be made on these terms providing the suppliers meet theirobligations to the businesses’ satisfaction. The Group as a whole does not apply a general recognised code with regard to the payment of all suppliers. The Company does not have any trade creditors.
The number of days credit outstanding for the Group averaged 59 days at 31 December 2007 (80 days at 31 December 2006).
Charitable and political contributionsPayments for charitable purposes made by the Group during the year ended 31 December 2007 amounted to £150,000 (2006: £145,000). The primary beneficiaries of these charitabledonations were The Wildlife Trust, Business in the Community, the British Heart Foundation and CRASH, the construction andproperty industry charity for the homeless.
The Carillion Group also contributes more than one per cent ofprofits per annum in cash or in-kind (staff time on communityprojects) to community activities and is a member of the Businessin the Community PerCent Club.
The Company and its subsidiaries made no political donationsduring the period under review.
Financial InstrumentsInformation on the Carillion Group’s use of financial instruments,financial risk management objectives and policies and exposure is given in Note 28 on page 93 of the consolidated financialstatements.
Annual General MeetingThe Annual General Meeting will be held at 12 noon onWednesday 7 May 2008 at Austin Court, 80 Cambridge Street,Birmingham B1 2NP. The notice of the Annual General Meetingaccompanies this Annual Report and Accounts.
Amongst the business to be transacted are proposals to (i) renew the authority for the Company to purchase its own shares. As at 31 December 2007, the Company had authority fromshareholders for the purchase of 28,124,273 of its own shares and(ii) amend the Company’s Articles of Association for the provisionsof the Companies Act 2006. Amendments to the Articles ofAssociation are subject to shareholder approval.
AuditorResolutions to re-appoint KPMG Audit Plc as auditor and toauthorise the Directors to determine its remuneration will beproposed at the Annual General Meeting.
Approved by order of the Board.
R F TappSecretary5 March 2008

43 Carillion plcAnnual Report and Accounts 2007
General principlesThe Board is firmly committed to high standards of corporategovernance. During the year to 31 December 2007 and asdetailed below and in the Remuneration Report, the Companycomplied with the provisions set out in Section 1 of the CombinedCode on Corporate Governance (June 2006).
Ethics and Business Integrity PolicyCarillion has a clear and unequivocal approach to businessintegrity and ethics which underlies the Carillion values ofopenness, collaboration, mutual dependency, sustainable,profitable growth, professional delivery and innovation. The Ethics and Integrity Policy demonstrates how Carillion will conduct its business to the highest ethical standards.
The policy applies to all employees of any Carillion groupcompany. The way Carillion delivers this policy is and will bereflected in the way the Group competes for business, through the quality and value of its work and through the reliability and reputation of its employees.
The policy is
• business integrity: we do not give or accept bribes. We do not sanction or accept any illegal payments, allowances, orgifts-in-kind. We will investigate fully all alleged breaches. We will dismiss any employee who has breached this policy
• mutual respect: we do what we say we will do. We treat our people fairly and with respect at all times, avoidingdiscrimination and bullying. We provide a safe and healthyworking environment, and respect sustainable principles in all our dealings
• trust: we engender trust within our work groups andcompanies, respecting diverse traditions and cultures. We respect the trust placed in us by others, not least when we are asked to take responsibility for aspects of their business or resources. We maintain and demand high professionalstandards and demand honesty and openness. We avoidconflicts of interest wherever possible, and we proactivelydeclare any unavoidable conflicts for open scrutiny andresolution
• legality: we respect the rule of law in all our dealings. We clearly communicate procedures for disciplining those who do not comply with the law or our standards and policies. We maintain a system for confidential reporting of breaches of our standards and policies
• human rights: we support the belief that human rights areuniversal and adhere to the principles of human rights in ouroperations. We support the United Nations UniversalDeclaration on Human Rights.
This policy is carried into Carillion’s business through a series ofdetailed procedures. They allow Carillion to carry into practice its reputation for conducting business to the highest ethicalstandard which is essential to its relationships with customers,business partners, employees, shareholders and the public. The detailed procedures reflect the way Carillion competes forbusiness, through the quality and value of its work and throughthe reliability and reputation of its people.
The Ethics and Business Integrity Policy and its implementation is reviewed annually by the Board.
GovernanceCorporate Governance Report
DirectorsThe BoardWith effect from 1 January 2008, the Company is led by a Boardcomprising five Executive and five Non-Executive Directors.Throughout 2007, however, the Chairman and the Non-ExecutiveDirectors comprised more than half of the Board. The Chairmanand each of the Non-Executive Directors are considered to beindependent of management. They each have wide areas ofexperience and have no business or other relationship that couldmaterially interfere with their independent judgement. DavidGarman is the Senior Independent Non-Executive Director.
In accordance with the Combined Code, the Executive Directors’service contracts are terminable by one year’s notice.
A detailed internal evaluation of the Board’s corporate governanceprocedures and compliance was again conducted in 2007 by theChairman in conjunction with the Company Secretary. The internalevaluation took into account the views of each of the Directors on (i) the role of Directors, (ii) the performance of the Board, theChairman and the Non-Executive Directors, (iii) Board Committees,(iv) leadership and culture, (v) Corporate Governance (vi) Directors’remuneration, (vii) relations with shareholders and (viii) Boardaccountability and audit. The Board at its meeting in November2007 reviewed the results of the internal evaluation and, whererequired, issues were acted upon in order to further enhance theeffectiveness of the Board’s procedures and working practices.
This is the sixth year that this process has taken place and will be repeated annually as the Board considers it satisfactory. In addition, reviews of the performance of each of the Directors has taken place.
The division of responsibilities between the Chairman and theGroup Chief Executive has been agreed by the Board andencompasses the following parameters
• the primary job of the Chairman of a public company is toprovide continuity, experience and governance while the Group Chief Executive provides leadership, energy, imaginationand the driving force
• the Chairman is viewed by investors as the ultimate steward of the business and the guardian of the interests of all theshareholders. Nonetheless, it is essential that the outline of their respective roles encourages the Chairman and Group Chief Executive to work well together to provideeffective and complementary stewardship
• the Chairman must:– take overall responsibility for the composition and capability
of the Board– consult regularly with the Group Chief Executive and be
available on a flexible basis for providing advice, counsel andsupport to the Group Chief Executive.
• the Group Chief Executive must: – manage the Executive Directors and the Group’s day to
day activities– prepare and present to the Board strategic options for
growth in shareholder value– set the operating plans and budgets required to deliver
the agreed strategy– ensure that the Group has in place appropriate risk
management and control mechanisms.
Section
04 – Go
vernan
ce

44 Carillion plcAnnual Report and Accounts 2007
GovernanceCorporate Governance Reportcontinued
The Board had a programme of ten meetings in 2007 and alsomeets on an ad hoc basis as required.
A formal schedule of matters reserved to the Board forconsideration and decision is maintained. These matters include
• statutory matters such as the approval of final and interimfinancial statements and the recommendation of dividends
• appointments to, and removals from, the Board and the terms of reference and membership of Board committees
• approval of Group strategy and annual budgets• approval of authority levels, financial and treasury policies• authorisation for any acquisition or disposal• review of the internal control arrangements and risk
management strategies• review of corporate governance arrangements.
The Executive Directors and the Carillion subsidiary companiesoperate within clearly defined limits of authority delegated by the Board and any matters outside of these limits must be referredto the Board for consideration.
All Directors have access to the Company Secretary, who isresponsible to the Board for ensuring that agreed procedures and applicable rules and regulations are observed. The Boardapproves the appointment and removal of the Company Secretary.
Any Director may, in furtherance of his duties, take independent professional advice when necessary, at the expense of the Company.
The Board is provided with regular and timely information on the financial performance of businesses within the Group, and of the Group as a whole, together with reports on tradingmatters, markets, sustainability and other relevant issues.
Board CommitteesThe principal Board Committees are the Remuneration Committee,the Audit Committee and the Nominations Committee. TheCompany Secretary acts as secretary to each of these committees.The terms of reference of each of the Board Committees areavailable on the Carillion website at www.carillionplc.com or onrequest from the Company Secretary.
The membership of each of the principal committees is as follows:
Remuneration CommitteeDavid Garman, ChairmanDavid MaloneySteven MogfordVanda Murray
The Committee consists entirely of independent Non-ExecutiveDirectors and has a key role in reviewing and advising the Boardon the appropriate remuneration for the Executive Directors ofCarillion plc. Further details on remuneration issues are given on pages 48 to 55.
Audit CommitteeDavid Maloney, ChairmanDavid GarmanSteven MogfordVanda Murray
This Committee consists entirely of independent Non-ExecutiveDirectors. For further information see the Report of the AuditCommittee on pages 45 to 47.
Nominations Committee Philip Rogerson, ChairmanDavid Garman David MaloneyJohn McDonoughSteven MogfordVanda Murray
The Committee reviews the structure, size, composition, balance of skills, knowledge and experience of the Board and makesrecommendations to the Board with regard to any changes that are deemed desirable. The Committee also reviews successionplanning to ensure that processes and plans are in place with regard to both Board and senior appointments.
Attendance at meetings in 2007The number of full scheduled Board and Committee meetingsattended by each Director during 2007 was as follows:
Audit Remuneration NominationsBoard Committee Committee Committee
Number ofmeetings held 10 4 2 3Richard Adam(1) 8 – – –David Garman 10 4 2 3Christopher Girling(2) 2 – – –Donald Kenny 10 – – –David Maloney 10 4 2 3John McDonough 10 – – 3Steven Mogford 9 3 2 3Vanda Murray 10 4 2 3Roger Robinson 10 – – –Philip Rogerson 10 – – 3
(1) Appointed on 2 April 2007.(2) Left the Company on 2 April 2007.
Other Board mattersPolicy on external appointmentsRecognising that external appointments can broaden theirknowledge and so be of benefit to the Company, ExecutiveDirectors are permitted, at the discretion of the Board, to accept a limited number of such appointments and retain the fees received for such appointments. John McDonough is a Non-Executive Director of Tomkins plc and Richard Adam is a Non-Executive Director of SSL International plc.

45 Carillion plcAnnual Report and Accounts 2007
Nomination and remuneration of DirectorsThe appointment of a Director is a matter for resolution by the Board as a whole, taking advice from the NominationsCommittee.
For the Board appointment made in 2007, the NominationsCommittee used the services of the executive recruitmentconsultant JCA. Details of potential candidates were provided by JCA and initially reviewed by a sub-committee of theNominations Committee. Meetings with selected candidates were then held with Directors. Subsequently, the NominationsCommittee met to recommend an appointment, which was then approved by the Board.
In the case of Non-Executive Directors, initial appointments arenormally for three years; re-appointment is subject to review and is not automatic.
The fees of Non-Executive Directors are determined by the Board as a whole, taking into account the commitment required andparticipation in the work of committees and other advisory services in relation to the business of the Group. In advising theBoard on such fees, it is the policy of the Executive Directors to seek independent external advice concerning the appropriateness of the amounts by comparison with general practice. The level of fees currently payable to the Non-Executive Directors is based onindependent external advice.
The remuneration of the Directors is dealt with in the Remuneration Report on pages 48 to 55.
Retirement of Directors by rotationAll Directors are required to submit themselves for re-election at least every three years. The Directors retiring and seeking re-election at the Annual General Meeting to be held on 7 May 2008 are Philip Rogerson and David Garman.
Additionally, new Directors are subject to election by shareholdersat the first opportunity following their appointment. Accordingly,David Hurcomb will seek election at the 2008 Annual GeneralMeeting.
The service contracts of the Executive Directors and the terms and conditions of appointment of the Non-Executive Directors areavailable for inspection at the registered office of the Companyduring normal business hours on any weekday (bank holidaysexcepted) and at the Annual General Meeting.
Induction and development of DirectorsDirectors are provided with a comprehensive information pack on joining the Company and are advised of their legal and otherduties and obligations as a director of a listed company. Inaddition, all new Directors receive induction on their appointmentcovering such matters as the operation and activities of the Group, the role of the Board and the Company’s corporategovernance procedures. Directors are also briefed by theCompany’s external advisors, where appropriate, on changes to legislation or regulation or market practice as well as receiving briefings from business groups throughout the year.
At least once a year, the Board visits an operational site and inNovember 2007 the Directors visited the Group’s operations inDubai. Directors also visit other operations and staff.
The regular updating of Directors’ skills and knowledge isencouraged and a procedure has been established whereby theCompany Secretary is notified by Directors of their requirements in this respect.
Relations with shareholdersIn addition to communicating with shareholders generally fromtime to time, the Executive Directors and the Director of GroupCorporate Affairs meet regularly with representatives of majorshareholders in order to foster the mutual understanding ofobjectives. The details of these meetings are reported to the Board. The Chairman and Senior Independent Non-ExecutiveDirector are available for meetings with representatives of majorshareholders as required.
Private and institutional shareholders are encouraged to attend the Company’s Annual General Meeting.
The Company complies fully with the provisions of the CombinedCode in respect of the notice, content of agenda and conduct ofits Annual General Meetings. The Chairmen of the Remunerationand Audit Committees will be present at the Annual GeneralMeeting on 7 May 2008 to respond to shareholders’ questions.
Accountability and AuditReport of the Audit CommitteeThe Audit Committee consists entirely of independent Non-Executive Directors:
David Maloney, Chairman David GarmanSteve MogfordVanda Murray
David Maloney is an accountant who previously held a number of senior finance posts including Chief Financial Officer for Le Meridien Hotels and Resorts, Chief Financial Officer for the Thomson Travel Group (Holdings) plc and Group Finance Director of Avis Europe plc. David was appointed to the AuditCommittee in December 2005.
David Garman is Chief Executive of TDG plc and was appointed to the Audit Committee in October 2004.
Vanda Murray is Non-Executive Chairman of Eazyfone Group,Deputy Chairman elect of the North West Development Agencyand a Director of The Cheshire Building Society. Vanda wasappointed to the Audit Committee in July 2005.
Steve Mogford is Chief Executive of Selex Sensors and AirborneSystems SpA and was appointed to the Audit Committee inSeptember 2006.
Appointments to the Committee are made by the Board.
Section
04 – Go
vernan
ce

46 Carillion plcAnnual Report and Accounts 2007
GovernanceCorporate Governance Reportcontinued
The Audit Committee has in attendance at meetings, by invitationof the Committee, Executive Directors, representatives of theexternal auditors (KPMG Audit Plc), the Group Head of Risk and the Head of Internal Audit. It is also able to invite others as it requires from time to time. The Committee also meetsprivately with both the external and internal auditors.
The responsibilities of the Audit Committee include
• the review of the annual and interim financial statements• consideration of the impact of changes to accounting
regulations and the financial and accounting policies of theCarillion Group
• compliance with statutory and other external requirements• reviewing the role of the internal audit function and the
results of its audit work and the response of management • reviewing the scope and results of the external audit and
its cost-effectiveness• ensuring that the internal and external audit functions are
complementary• monitoring the independence and objectivity of the external
auditors and ensuring that the services provided (including non-audit services) provide a proper balance betweenobjectivity and value for money
• recommending to the Board the external auditors to beproposed to shareholders for appointment.
The Committee is authorised by the Board to (i) seek anyinformation necessary to fulfil its duties, (ii) call any member of staff to be questioned at a meeting of the Committee as andwhen required and (iii) obtain external professional advice, at the Company’s expense, which might be necessary for thefulfilment of its duties.
In 2007, the Committee met on four occasions and dealt with thefollowing matters
• internal audit reports including control of risk • annual and interim financial statements • KPMG audit review • top ten risks • reappointment of KPMG • 2007 audit plan • internal audit review • assessment of the going concern basis • review of compliance with the Combined Code • the external audit fee.
The members of the Committee receive fees as Non-ExecutiveDirectors which also reflect their membership of the AuditCommittee and other Board committees. See page 49 for details.
Main activities of the Audit Committee in the year to 31 December 2007Financial statementsThe Audit Committee reviews and discusses with managementand the external auditors the annual and interim statements. In this context, the Committee also reviews the written reports of KPMG on issues arising from the annual audit and the review of the interim results.
Internal controlsThe Board is ultimately responsible for the Group’s system ofinternal control. This responsibility includes clearly determining thecontrol environment and reviewing annually the effectiveness ofthe internal control system. However, such a system can provideonly reasonable and not absolute assurance against materialmisstatement or loss.
In accordance with the Turnbull Guidance for Directors ‘InternalControl: Guidance for Directors on the Combined Code’, the Board confirms that there is an ongoing process for identifying,evaluating and managing the significant risks (both financial andnon-financial and including Corporate Social Responsibility risks)faced by the Group (including Joint Ventures and overseasbusinesses). The process has been in place for the year underreview and up to the date of approval of the Annual Report and Accounts and is regularly reviewed by the Board. Assurance over the design and operation of internal controlsacross the Group is provided through a combination of techniques
• Internal Audit carries out audits to assess the adequacy andeffectiveness of internal controls over the key risks faced by the business and reports its findings to management, theExecutive Directors and the Audit Committee. The Audit Plan is presented to and approved by the Audit Committee annually
• recommendations to improve the system of control are madeby Internal Audit. The implementation of theserecommendations is followed up and reported on quarterly
• Internal Audit independently reviews the risk identificationprocedures and control processes implemented bymanagement
• a process of Control Risk Self-Assessment is used in the Group where Directors and senior managers are required todetail and certify controls in operation to ensure the controlenvironment in their business areas is appropriate. They alsoconfirm annually, in writing, that risk management processesand appropriate controls are in place and are operatingeffectively
• Internal Audit advises on aspects of the design and applicationof internal controls in key business projects and on policy andprocedure changes.
Internal Audit reports to the Audit Committee on a regular basis.The Audit Committee reviews the assurance procedures andensures that the level of confidence required by the Board isobtained. It also ensures the financial reporting process is credible and reliable. The Audit Committee presents its findings to the Board regularly and the Head of Internal Audit has directaccess to the Audit Committee members.
Any significant internal control issues would be disclosed in this report.
Risk managementThe Group Head of Risk is responsible for advising on strategic risk issues across the Group, and for oversight of risk training. The Group Head of Risk is also responsible for carrying out anindependent appraisal of all projects before submission to theMajor Projects Committee (see below). This appraisal ensures that the differentiating factors of the Group’s offer have beenproperly identified so maximising the opportunities available; it also involves ensuring that all inherent and residual risksassociated with the project have been properly identified and considered.
47 Carillion plcAnnual Report and Accounts 2007
In addition, the Risk Forum, a committee of risk professionals fromeach of the business groups, meets on a quarterly basis to assessthe strategic risks facing the Carillion Group. The conclusions ofthe Risk Forum are reported to the Audit Committee.
The Major Projects Committee, a committee of the Board, acts as the sanctioning body for major commitments and transactionsincluding capital expenditure, major contracts and company andbusiness acquisitions and disposals. This committee has delegatedauthority up to specified levels of risk as determined by a riskassessment matrix, beyond which Board approval is required.
Practical guidance for all staff is maintained in Group policy andprocedure documents regarding the authorisation levels forcommitments, contract selectivity and bidding, the provision ofguarantees and management accounting as well as reporting and resolution of suspected fraudulent activities. The Board has a policy to prosecute individuals found to have defrauded theCompany or its subsidiaries. Learning points for management are identified and action plans implemented to minimise therecurrence of fraud.
Employees are encouraged to raise genuine concerns aboutmalpractice at the earliest possible stage and a confidential‘whistleblowing’ hotline provided by an independent third party is available.
Management is responsible for the identification and evaluation of significant risks applicable to its areas of business together with the design, operation and monitoring of suitable internalcontrols. These risks are assessed on a continual basis and may be associated with a variety of internal or external sources,including control breakdowns, disruption in information systems,competition, corporate social responsibility, natural catastropheand regulatory requirements. Management is also responsible for timely and accurate reporting of business performance and for ensuring compliance with the policies set by the Board in itsareas of business. Regular performance review meetings are held where management reports to the Executive Directors on business performance, risk and internal control matters. The results of these meetings are presented to the Board.
The Executive Directors report to the Board on material changes inthe business and the external environment that affect significantrisks. The Group Finance Director provides the Board with regularfinancial information, which includes key performance indicatorsand a summary of risk. These key performance indicators and risksare listed in the Group Chief Executive’s Review on pages 16 to19. Where areas for improvement are identified, the Boardconsiders the recommendations made both by the ExecutiveDirectors and by the Audit Committee.
This report is reviewed and approved by the Audit Committee.
Audit independenceThe Audit Committee and Board place great emphasis on theobjectivity of the Group’s auditor, KPMG Audit Plc, in theirreporting to shareholders.
The KPMG audit director and manager are present at AuditCommittee meetings to ensure full communication of mattersrelating to the audit.
The overall performance of the auditor is reviewed annually by the Audit Committee, taking into account the views ofmanagement, and feedback is provided to senior members ofKPMG unrelated to the audit. This activity also forms part ofKPMG’s own system of quality control. The Audit Committee also has discussions with the auditor, without management beingpresent, on the adequacy of controls and on any judgmentalareas. These discussions have proved satisfactory to date.
The scope of the forthcoming year’s audit is discussed in advanceby the Audit Committee. Audit fees are reviewed by the AuditCommittee after discussions between the businesses and the local KPMG offices and are then referred to the Board forapproval. Rotation of audit director’s responsibilities within KPMG is required by their profession’s ethical standards. Thecurrent audit director responsible for the Carillion engagement isin his third year of signing the report.There is also rotation of keymembers within the audit team.
Assignments awarded to KPMG and its associates have been and are subject to controls by management that have been agreed by the Audit Committee so that audit independence is not compromised. In summary, the procedures are
• audit related services: as auditor this is the main area of workof KPMG and its associates. If any additional accountingsupport is required then this is considered competitively
• tax consulting: in cases where they are best suited, Carillionuses KPMG and its associates but the Group also uses other tax consultancies. Significant pieces of tax work are evaluatedcompetitively
• general and systems consulting: all significant consultingprojects are subject to competitive tender.
Other than audit, the Group Finance Director is required to giveprior approval of work carried out by KPMG and its associates in excess of a predetermined threshold; part of this review is todetermine that other potential providers of the services have been adequately considered.
These controls provide the Audit Committee with adequateconfidence in the independence of KPMG in their reporting on the audit of the Group.
Health and safetyA review of the Group’s progress on health and safety is providedin the Group Chief Executive’s report on page 18 and the Group’sSustainability performance is contained in the Sustainability reviewon pages 33 to 35.
R F TappSecretary5 March 2008
Section
04 – Go
vernan
ce

48 Carillion plcAnnual Report and Accounts 2007
GovernanceRemuneration Report
This report has been prepared in accordance with the CompaniesAct (Schedule 7a) and Section 1 of the Combined Code onCorporate Governance (June 2006).
The Board is responsible for determining policy for remunerationof the Directors of Carillion plc and key members of the seniormanagement team. The Remuneration Committee consistsexclusively of independent Non-Executive Directors, namely David Garman (Chairman), David Maloney, Steve Mogford andVanda Murray and is responsible for formulating policy andrecommending to the Board the remuneration of the ExecutiveDirectors. The Board determines the fees of the Non-ExecutiveDirectors based on independent external advice.
The Remuneration Committee is assisted in remuneration decisionsby Susan Morton, Group HR Director and by John McDonough,Group Chief Executive. The Group Chief Executive is consulted onthe remuneration of his direct reports and other senior executives.No Executive Director or employee is present when his or herremuneration is being discussed.
Additionally, the Remuneration Committee uses Deloitte & ToucheLLP to provide salary survey and benchmarking information.Deloitte & Touche LLP, which was appointed in 2005, also advisesthe Company on pensions investment but otherwise has no otherconnections with the Company.
Remuneration policy It is the policy of the Company to ensure that remuneration andother benefits attract, motivate and retain Executive Directors andsenior managers of the required calibre to achieve the Board’sobjectives, including that of achieving growth in shareholder value. Remuneration and other benefits are determined withregard to competitive market practice and, where consideredappropriate, are supported by external independent surveys. The main elements of remuneration of the Executive Directors arebasic salary and pension benefits, together with an annual bonuslinked to the Group’s financial performance and share basedincentives linked to both financial and share price performance to ensure that the interests of the Executive Directors are aligned to those of shareholders. It is anticipated that the Company willcontinue this approach to the structure of remuneration for theforeseeable future.
The Group’s remuneration policy is also based upon Carillion’sstrategic objectives, which specifically include achieving highstandards in respect of sustainability, which encompasses Carillion’shealth and safety, environmental and social performance.
Service contractsEach of the Executive Directors’ service contracts are terminable by one year’s notice from the Company. On termination of theiremployment, Executive Directors of the Company have noadditional entitlement to compensation for loss of their office as Directors. The service contracts contain provision for earlytermination. In determining compensation for early termination ofa service contract, the Remuneration Committee will consider thespecific circumstances together with the Company’s commitmentsunder the individual’s contract (including future bonuses).
NoticeName Commencement Period Term
John McDonough 1 January 2001 12 months rollingRichard Adam 2 April 2007 12 months rollingRoger Robinson 29 July 1999 12 months rollingDon Kenny 1 July 2006 12 months rollingDavid Hurcomb 1 January 2008 12 months rolling
Non-Executive Directors are not employed under contracts ofservice, but are generally appointed for fixed terms of three yearsrenewable for further terms of one to three years if both partiesagree. David Maloney, Steve Mogford and Vanda Murray are in their initial three year terms.
Basic salary and other benefitsThe basic salaries and other benefits of the Executive Directors are set by the Remuneration Committee and are determined taking into account individual performance and informationprovided by independent sources on the rate of salary for similarposts in comparable companies. The aim is to reward Directors fairly and competitively.
Other benefits typically include a company car, private healthcareand salary supplements in place of approved pension provision forsalary over the internal earnings cap.
Annual performance bonus and deferred bonus planAnnual bonuses are reviewed each year by the RemunerationCommittee, which sets performance targets geared to key financialindicators and individual performance objectives. In 2007, theExecutive Directors had the potential to earn annual bonuses up to a maximum of 100 per cent of their basic salary foroutstanding performance. The bonus arrangement for 2007 set a financial performance target based on earnings per share andindividual, detailed and confidential personal performance objectivesthat support the strategic objectives of the Company. The maximumbonus opportunity of 100 per cent comprises an annual cashpayment limited to 30 per cent of salary with a deferred bonus of shares of the Company with a value of up to 70 per cent ofsalary vesting after two years. The number of shares allocated is determined by the price prevailing at the date the bonus isconfirmed and the amount by which the bonus earned exceeds 30 per cent of basic salary at the end of the bonus year in question.The shares are released on the condition that the recipient makesfunds available to the Company at the point of transfer to allow the Company to meet its tax and National Insurance obligations onthe value of the shares transferred. The potential bonus available in 2008 will be 100 per cent of basic salary comprised of a cashpayment of up to 30 per cent of basic salary with a deferred bonusof shares with Company up to the value of 70 per cent of salaryvesting after two years. Richard Adam will participate in these bonus arrangements during 2007 and, for 2007 only, will beguaranteed to receive a minimum bonus payment of 33 per cent of his annual salary.

49 Carillion plcAnnual Report and Accounts 2007
In relation to the 2006 bonus arrangement, the ExecutiveDirectors, on 7 April 2007 received a deferred bonus of shares as follows:
Number of shares
John McDonough 75,911Roger Robinson 47,857Don Kenny 15,794
These shares will be held in Trust for two years for JohnMcDonough and Roger Robinson and then transferred in April2009 following payment of the tax and National Insuranceobligations. Don Kenny’s shares will be held in Trust for one year and will be transferred to him in April 2008.
Pension benefits With the exception of Richard Adam and David Hurcomb, theGroup makes contributions to a Registered defined benefit schemeon behalf of the Executive Directors in respect of earnings up tothe internal earnings cap. In addition, a salary supplement is paidin respect of earnings over the internal cap equal to the paymentsthe Group would have paid to the Registered defined benefitscheme had the cap not been in operation. Salary supplements are taxed at source. For Richard Adam and David Hurcomb, the Company makes contributions to a Registered definedcontribution pension plan (up to the internal earnings cap) and a salary supplement in respect of earnings in excess of the internal cap. During the year, the Company contributed£35,220 to the Carillion Pension Plan for Richard Adam.
Directors’ remunerationThe remuneration of the Directors of Carillion plc for the year ended 31 December 2007 is set out in the table below.
AnnualBasic performance Other Total Total
salary/fees bonus benefits 2007 2006£000 £000 £000 £000 £000
John McDonough 580 574 173 1,327 878Richard Adam(1) 285 372 78 735 –Chris Girling(2) 83 – 28 111 537Roger Robinson 341 334 94 769 547Don Kenny 275 270 75 620 344Total for Executive Directors 1,564 1,550 448 3,562 2,306Philip Rogerson 167 – – 167 125David Garman 52 – – 52 45Vanda Murray 43 – – 43 40David Maloney 50 – – 50 45Steve Mogford(3) 43 – – 43 13Total for Non-Executive Directors 355 – – 355 268Total for all Directors 1,919 1,550 448 3,917 2,574
(1) Richard Adam was appointed to the Board on 2 April 2007.(2) Chris Girling left the Company on 2 April 2007.(3) Steve Mogford was appointed to the Board on 6 September 2006.
There were no termination benefits in the year to 31 December 2007.
There are no long term benefits other than pensions (see page 50) and share incentives (see pages 51 to 54).
The auditors are required to report on the information contained in the above table.
Included in ‘Other benefits’ is a salary supplement for John McDonough of £156,055 (2006: £117,970),for Roger Robinson of £75,852 (2006:£15,489 to FURBS and £45,360 salary supplement), for Chris Girling £24,640 (2006:£15,070 to FURBS and £44,100 salary supplement), for Don Kenny £53,575 (2006: £34,809) and for Richard Adam £66,175 (2006:Nil) in respect of salary over the internal pensions earnings cap.
Section
04 – Go
vernan
ce

50 Carillion plcAnnual Report and Accounts 2007
GovernanceRemuneration Reportcontinued
The bonus figures shown above are paid in two elements; up to30% of basic salary is paid in cash and the balance in the form ofdeferred shares in the Company vesting after two years. Theamounts shown above were therefore split as follows:
Cash payment Value of deferred shares £000 £000
Executive DirectorJohn McDonough 174 400Richard Adam 114 258Roger Robinson 102 232Don Kenny 83 187
John McDonough retains the fee of £34,000 he was paid in 2007as a Non-Executive Director of Tomkins plc and Richard Adamretains the fee of £39,500 paid as a Non-Executive Director of SSL International plc.
Executive pensionsUntil April 2003, it was the Company’s policy to offer membershipof the Carillion ‘B’ Pension Scheme to Executive Directors andother senior employees. This scheme was operational from 1 October 1999. The scheme is a funded, HMRC Registered,defined benefit scheme to which members contribute 7% ofpensionable earnings. The main features are
• pension payable at the normal retirement age of 60 (save in cases of ill health or early retirement)
• pension accrual rate for Executive Directors of 1/30th of final pensionable salary for each year of service subject to a limit on pension of two thirds of final pensionable salary
• increases to pensions in payment (in excess of the StateGuaranteed Minimum Pension) in line with price indexation up to five per cent per annum for service to 5 April 2006 and 2.5% per annum for service after that date
• life assurance of four times salary • pensions payable in the event of ill health, and• on death (in service or after retirement), spouse’s and/or
dependent’s pension at two thirds of member’s prospective pension.
The Carillion ‘B’ Pension Scheme was closed to new entrants with effect from 1 April 2003. Pension provision for seniormanagers and Executives is now through their existing Carillionscheme (for current employees) or the Carillion Pension Plan (for new employees and existing employees who opted formembership). The Carillion Pension Plan is a defined contributionpension arrangement that provides members with pensions atretirement based on the accumulated value of their notionalpension account within the plan.
The current Executive Directors are subject to an internal earningscap and their pensionable salary is limited accordingly. They areprovided with additional benefits by way of a salary supplementequal to the contribution the Group would have made to theRegistered scheme had the earnings cap not been in operation. In all cases, any contributions made to these arrangements inrespect of the year are disclosed separately above. As theseadditional arrangements are limited to the balance of basic salaryin excess of the earnings cap, bonus paid to Executive Directorsdoes not count towards pension benefits. The Company does not contribute to any pension arrangements for Non-ExecutiveDirectors. The Company agreed with the Trustees of the Carillionpension schemes to continue to operate an earnings cap afterApril 2006 when the external cap was removed. The Carillion capcommenced at the level of £110,000 for the tax year 2006/07 and will rise in line with the published increases in HMRC’s LifeTime Allowance up until 2010 in line with the table below.
CapYear £
2006-07 110,0002007-08 117,4002008-09 121,3002009-10 129,0002010-11 132,700
All the Executive Directors will be subject to this cap on salarypensioned through the Carillion B Pension Scheme or, in the case of Richard Adam and David Hurcomb, the Carillion Pension Plan.
Directors’ pensionsPensions accruing during the year to Executive Directors in their capacity as Directors of Carillion plc are set out below.
Increase in Increase inaccrued accrued Value ofpension pension pension Increase in
over year over year accrued transfer valueAccrued excluding including during 2007 over year
pension at inflation inflation less member Transfer value Transfer value after member31 Dec 2007 allowance allowance contributions at start of year at end of year contributions
£ per annum £ per annum £ per annum £ £ £ £
John McDonough 27,393 5,393 4,503 57,786 346,127 433,211 78,995Roger Robinson 66,318 7,539 5,161 72,684 974,444 1,118,668 136,135Don Kenny 20,871 4,982 4,339 47,390 218,017 286,225 60,119
The total number of Directors to whom retirement benefits accrued during the year was 5 (2006: 4).
The auditors are required to report on the information contained in the above table.

51 Carillion plcAnnual Report and Accounts 2007
Share incentive schemesFollowing a review of share incentives, a new long term incentiveplan for senior executives, the Carillion plc 2006 Long TermIncentive Plan was approved at the Annual General Meeting in2006. Following the introduction of the Carillion plc 2006 LongTerm Incentive Plan, no further share awards have been madeunder the existing Long Term Incentive Plan and Executive ShareOption Scheme.
The objective of the Carillion plc 2006 Long Term Incentive Plan(known internally as the Leadership Equity Award Plan (LEAP)) is to motivate employees and to encourage them to invest in thefuture success of the Group. It has a challenging performancecriterion which applies similarly to all participants.
A Sharesave Scheme also operates to give UK employees theopportunity to have a financial stake in the Company.
Carillion plc Long Term Incentive Plan 2006 (LEAP)The Leadership Equity Award Plan (LEAP) provides key persons inthe Company with the opportunity to earn a potentially higherlevel of reward but only where there is commitment by thoseindividuals and stretching performance targets are met.
Executive Directors may receive an award under the LEAP in anyfinancial year over shares worth 150% of their basic annual salary(excluding bonuses, commissions and benefits in kind), othersenior executives may receive an award under the Plan in anyfinancial year over shares worth up to 100% of their basic annualsalary. The extra 50% awarded to Executive Directors will only vest if exceptional performance is achieved.
The rules allow for higher awards, but only if exceptionalcircumstances exist which justify a first award of up to 200% ofsalary will such an award be made. Richard Adam participated atthis level in the 2007 scheme. For subsequent years, the maximumopportunity will be 150% of basic salary.
Under the terms of the Plan, awards of ordinary shares in theCompany or grants of options over ordinary shares (with a zero or 0.01 pence per share exercise price) can be made.
No payment will be required for the grant of an award. TheCommittee will determine the exercise price of an option whichshall be zero or 0.01 pence per share, provided that where newissue shares are involved, the exercise price is not less than thenominal value of a share.
The participants will not be entitled to receive the shares for aperiod determined by the Committee which is generally no earlierthan three years from the date of award.
The vesting of awards at the end of the performance period willbe subject to the relevant participant remaining in employmentand the achievement of specified stretching performanceconditions. Each Executive Director will be required to hold anyshares acquired through this Plan until the value of their totalshareholding is at least equal to the value of their annual salary(with the exception of shares sold to meet the tax liability on theshares acquired through the Plan).
The awards are subject to achievement of a performance targetbased on annual average growth in earnings per share above theRetail Price Index. The progression is linear between each of thetarget levels specified.
Growth in earnings per share:
Growth in earnings per share:
Level 1 RPI + 3% pa 30% vestsLevel 2 RPI + 7% pa 50% vests Level 3 RPI + 12% pa 100% vests Level 4 RPI + 25% pa Extra 50% vests
Levels 1 to 3 apply to all participants, level 4 applies to theExecutive Directors.
Awards were made in July 2006 and April 2007. At 31 December2007 a total of 1,862,063 shares were outstanding under the LEAP.
Executive Share Option Scheme Share options have been granted to the Executive Directors and certain senior managers under the Executive Share OptionScheme. The options were granted at an exercise price equal tothe market value of the Company’s shares on the three businessdays immediately preceding the date of grant.
Options under the Inland Revenue Approved Executive ShareOption Scheme 1999 (which carries certain tax advantages for UK employees) and the Executive Share Option Scheme 1999 are exercisable normally between three and 10 years after the date of grant, subject to the achievement of the performancecondition. For options granted in 2001 and 2002, theperformance condition required that the earnings per share of Carillion over a rolling three-year period must increase by apercentage that is not less than the increase in the UK Retail Price Index over the same period, expressed as a percentage, plusfour percentage points per annum. This performance conditionwas selected in order to provide an incentive which aligns theinterests of executives with those of shareholders in growing theCompany’s earnings per share. However, as this performancecondition no longer complied with best practice, at the 2003Annual General Meeting, shareholders resolved that future options granted under both schemes become exercisable inaccordance with the following table:
Average compound annual earnings per share growth (before exceptional items) in excess of RPI over the three year period Percentage of optionfollowing grant that becomes exercisable
Less than 4% 0%4% 30%Above 4% and below 10% 30% to 100%
(straight-line basis)10% or more 100%
To the extent that this performance condition is not met in full at the end of the three-year period following grant, there is the opportunity for no more than one re-test of performance(from a fixed base) at the end of the following year.
Section
04 – Go
vernan
ce

52 Carillion plcAnnual Report and Accounts 2007
GovernanceRemuneration Reportcontinued
Grants of options using this new performance condition weremade in 2003, 2004 and 2005.
The aggregate value of options granted to an employee under the Executive Share Option Schemes cannot normally exceed their basic salary in any year without the prior approval of theRemuneration Committee.
With regard to the options granted on 1 July 2003, Carillion metthe performance target such that 80% of the shares under optionare now exercisable. Similarly, the performance target relating tothe options granted on 31 March 2004 was met such that 71% of the options are exercisable.
At 31 December 2007, Executive Share Options were outstandingover 2,073,978 shares (2006: 2,705,579 shares) under bothschemes at exercise prices ranging from 125.2 pence to 242.75 pence.
Long Term Incentive PlanConditional awards under the Long Term Incentive Plan weremade to the Executive Directors and key members of seniormanagement, in recognition of the contribution that theseindividuals can make to the Group’s success.
There is no subscription price for the shares, the award of which is conditional on the Company’s performance during a three-yearperiod in delivering Total Shareholder Return (TSR) against acomparator group of companies in the Construction and BuildingMaterials and Support Services sectors or, in respect of the awardsmade in 2005, the FTSE 250 index.
The companies comprising the comparator group for Long TermIncentive Plan awards made in January 2002 were Amec plc, WSAtkins plc, Balfour Beatty plc, Interserve plc, Jarvis plc, Kier Groupplc, Alfred McAlpine plc, Mowlem plc and Taylor Woodrow plc.(Amey plc was in the comparator group but was removed as itdelisted from the London Stock Exchange in June 2003).
Carillion subsequently came second in this comparator group atthe end of the three-year performance period for these 2002awards with the result that 85% of the awards vested and a totalof 172,913 shares transferred to two participants in March 2005.
Following review in 2003, the Remuneration Committeeconsidered that with a comparator group of 10 companies, theremoval of one company (through take-over or otherwise) wouldhave a proportionately greater impact on the extent of the vestingof awards than if the comparator group was larger. Consequently,shareholders at the 2003 Annual General Meeting approved thatfuture awards granted under the Long Term Incentive Plan wouldbe subject to Carillion’s TSR performance against an expandedgroup of companies as follows:
Carillion ranking at Percentage ofend of three years award that will vest
First place 100%Between the median and first place Straight line vesting
between 30% at the median and 100%
for first placeMedian 30%Below the median No award
The comparator group for awards made in accordance with this 2003 shareholder approval were Amec plc, WS Atkins plc,Balfour Beatty plc, Interserve plc, Jarvis plc, Kier Group plc, AlfredMcAlpine plc, Mowlem plc Morgan Sindall plc, John Laing plc andSerco Group plc. (Again, Amey plc was in this comparator groupuntil it was delisted, as were Mowlem plc and John Laing plc untilthey were taken over.)
Awards with this performance condition were made on 1 July 2003 and 31 March 2004.
With regard to the awards made on 1 July 2003, Carillion camefourth in the comparator group at the end of the three-yearperformance period with the result that 61.8% of the awardsvested. A total of 324,727 shares vested to nine participants on 12 September 2006. The Carillion plc share price on 12 September 2006 was 326.5p.
Similarly, the awards made on 31 March 2004 came third in thecomparator group with 72% of the awards vesting. A total of499,283 shares vested to 11 participants on 2 April 2007. TheCarillion plc share price on 2 April 2007 was 402p.
Awards equivalent to 100% of annual salary were also made to Executive Directors on 15 March 2005: the RemunerationCommittee resolved that these 2005 awards will have aperformance condition based on Carillion’s TSR performanceagainst the FTSE 250.
The performance conditions were chosen in order to align the interests of Directors and senior managers with those ofshareholders in growing total shareholder return againstcomparator companies and sectors.
At 31 December 2007, Long Term Incentive Plan awards were outstanding over a total of 993,975 shares (2006: 1,696,417 shares).
Conditional awards made to Executive Directors under the LongTerm Incentive Plan are set out in the table of share incentives on page 53. The awards represent the maximum number of shares that could be awarded to Executive Directors under theperformance periods commencing on 1 January 2004 and 1 January 2005. The monetary value of the conditional awards attributed to each Director was based on their annual basic salary at the date of award and the number of shares wascalculated using the share prices of 143 pence and 225 pence, the average share prices over the six weeks immediately before the commencement of the respective performance periods.

53 Carillion plcAnnual Report and Accounts 2007
Share incentives of Directors of Carillion plcThe awards held by Executive Directors of the Company under the Long Term Incentive Plan as at 31 December 2007 are shown below.
MidLong Term market
Incentive Plan shareAs at awards Awards Awards/options As at price
1 January granted during vesting during lapsing during 31 December on date2007 this year the year the year 2007 Date of of award
Number Number Number Number Number award Pence
John McDonoughLTIP 2004 (maximum) 141,608 – 101,957 39,651 – 31.03.2004 187.0LTIP 2005 (maximum) 191,043 – – – 191,043 15.03.2005 244.5LEAP (maximum) 218,354 – – – 218,354 06.07.2006 319.0LEAP (maximum) – 206,773 – – 206,773 10.04.2007 420.8Richard AdamLEAP (maximum) – 180,629 – – 180,629 10.04.2007 420.8Roger RobinsonLTIP 2004 (maximum) 90,909 – 65,454 25,455 – 31.03.2004 187.0LTIP 2005 (maximum) 122,178 – – – 122,178 15.03.2005 244.5LEAP (maximum) 137,658 – – – 137,658 06.07.2006 319.0LEAP (maximum) – 121,675 – – 121,675 10.04.2007 420.8Don KennyLTIP 2004 (maximum) 61,188 – 17,133 44,055 – 31.03.2004 187.0LTIP 2005 (maximum) 81,637 – – – 81,637 15.03.2005 244.5LEAP (maximum) 71,202 – – – 71,202 06.07.2006 319.0LEAP (maximum) – 98,039 – – 98,039 10.04.2007 420.8
On 2 April 2007, 101,957 shares vested to John McDonough, 65,454 shares to Roger Robinson and 44,055 shares to Don Kenny. The market price of Carillion shares on 2 April 2007 was 402.3p. The net asset value received by these Directors was therefore,respectively, £410,173, £263,321 and £177,233.
The auditors are required to report on the information contained in the above table.
Total Shareholder Return (TSR) Performance GraphThe following graph shows the TSR of Carillion plc compared withthe TSR of the FTSE 350 Index for the period from 1 January 2003to 31 December 2007.
The FTSE 350 was chosen as the comparator group in order toillustrate the Company’s TSR performance against a broad equitymarket index of the UK’s leading companies.
The Sharesave SchemeThe Company operates a Sharesave Scheme which provides asavings and investment opportunity for employees in the UK. The options may normally be exercised on completion of a threeor five-year savings contract, at a price equivalent to not less than 80% of the market value of the shares at the time of grant.Options were granted in November 1999 over 6,140,194 shares,in October 2002 over 3,995,803 shares and in November 2006over 2,580,461 shares.
The five-year options granted in November 1999 becameexercisable for a six month period commencing 1 January 2005 at an option price 109.1p. A total of 983,369 shares were issuedfollowing maturity.
The three-year options granted in October 2002 becameexercisable for a six month period commencing 1 January 2006 at an option price of 126.6p. A total of 1,829,888 shares were issued following maturity.
At 31 December 2007, options over 2,167,635 ordinary shares of 50p each were outstanding under the Sharesave Scheme (2006: 2,580,181 ordinary shares of 50p each).
The Carillion share option and share incentive schemes complywith the share dilution guidelines.
Carillion Total ReturnFTSE 350 Total Return
2003 2004 2005 2006 2007 2008406080
100120140160180200220240260280300320340360380400420440460480
Section
04 – Go
vernan
ce

54 Carillion plcAnnual Report and Accounts 2007
GovernanceRemuneration Reportcontinued
The number of options over Carillion plc shares held by Executive Directors of the Company under the Executive Share Option andSharesave schemes as at 31 December 2007 are shown below.
Options Mid marketAs at Granted lapsing As at Earliest share price
1 January during during 31 December Exercise date from on date2007 the year Exercised the year 2007 price which Expiry of grant
Number Number Number Number Number Pence exercisable date Pence
John McDonoughESOS 2001 501,930 – – – 501,930 129.5 09.01.04 09.01.11 135.5ESOS 2002 254,532 – – – 254,532* 210.7 19.03.05 19.03.12 197.5ESOS 2003 150,795 – – – 150,795 163.4 01.07.06 01.07.13 159.0ESOS 2004 175,229 – – 50,501 124,728 184.9 31.03.07 31.03.14 187.0Roger RobinsonESOS 2004 112,493 – 80,072 32,421 – 184.9 31.03.07 31.03.14 187.0Don KennyESOS 2002 123,801 – – 123,801 125.2 17.10.05 17.10.12 128.0ESOS 2003 60,709 – – – 60,709 163.4 01.07.06 01.07.13 159.0ESOS 2004 75,716 – – 21,882 53,894 184.9 31.03.07 31.03.14 187.0
On 2 April 2007, Roger Robinson exercised an option over 80,072 shares at 184.9p. The market price of Carillion shares on 2 April 2007was 402.3p. The net gain was therefore £174,077.
The auditors are required to report on the information contained in the above table.
* The option over 254,532 shares at an option price of 210.7p granted to John McDonough in March 2002 under the Executive Share Option Scheme 1999 was made later in the year than had beenspecified at the time of his appointment which resulted in an increased option price of 67.3p. Therefore, in order to ensure that he will be in no worse nor better a position as a result of the delay in thegrant, a maximum cash adjustment of 67.3p per share (less tax) will be made when and if the option is exercised.
There have been no changes to the interests of Executive Directorsin share incentives and options in the period 1 January to 5 March2008. The performance conditions for the options shown in thetable are as detailed in this Remuneration Report in the summariesof the relevant schemes.
Employee Benefit TrustsAn employee benefit trust has been established to acquire sharesin Carillion plc and hold them for the benefit of participants in theshare incentive and share option schemes. At 31 December 2007,the Trust held 61,909 Carillion shares (2006: 1,137,177 shares)0.02% of the issued share capital and a nominal value of £31,000 (2006: 0.4% and £0.6million) acquired over a period inthe open market and which have a carrying value of £0.7 million.The market value of the shares held at 31 December 2007 was£0.2 million (2006: £4.5 million).
Additionally, a Qualifying Employee Share Ownership Trust (QUEST)operates in conjunction with Carillion in providing shares toemployees under its Sharesave Scheme. At 31 December 2007,the QUEST held 219,763 Carillion shares (2006: 222,406 shares)(0.08% of the issued share capital and a nominal value of £0.1 million) (2006: 0.08% and £0.1million) at subscription prices ranging from 115.5 pence to 296.25 pence per share, to enable it to satisfy, as and when required, options grantedunder the Sharesave Scheme. The market value of the shares held by the QUEST at 31 December 2007 was £0.8 million (2006: £0.9 million).
For details of dividends paid to the above trusts see Note 24 to the consolidate financial statements on pages 90 and 91.

55 Carillion plcAnnual Report and Accounts 2007
Directors’ share interestsOrdinary sharesThe beneficial interests of the Directors and their immediate families in the ordinary share capital of the Company as at 31 December2007 are shown below.
As at As at1 January 31 December
2007 2007Fully paid 50p ordinary shares owned: Number Number
Executive DirectorsJohn McDonough 551,917 651,271Richard Adam – 15,044Roger Robinson 96,941 96,941Don Kenny 41,318 48,832Non-Executive DirectorsDavid Garman 10,000 14,300Philip Rogerson 19,630 29,630David Maloney 5,000 10,000Vanda Murray 11,000 11,000Steve Mogford – –
There has been no change in Directors’ interests in the period 1 January to 5 March 2008.
The closing mid-market price of Carillion shares at 31 December 2007 and the highest and lowest mid-market prices during the year wereas follows:
Share pricePence
31 December 2007 351.3 High (16, 21 and 23 May) 435.0 Low (20 November) 330.5
Approved by order of the Board
D N C GarmanChairman of the Remuneration Committee5 March 2008
Section
04 – Go
vernan
ce

56 Carillion plcAnnual Report and Accounts 2007
GovernanceStatement of Directors’ Responsibilities in respect of the Annual Report and Financial Statements
The Directors are responsible for preparing the Annual Report and the Group and Parent Company financial statements, inaccordance with applicable law and regulations.
Company law requires the Directors to prepare Group and ParentCompany financial statements for each financial year. Under thatlaw the Directors are required to prepare the Group financialstatements in accordance with IFRS as adopted by the EU andapplicable law and have elected to prepare the Parent Companyfinancial statements in accordance with UK Accounting Standardsand applicable law (UK Generally Accepted Accounting Standards).
The Group financial statements are required by law and IFRS asadopted by the EU to present fairly the financial position andperformance of the Group; the Companies Act 1985 provides in relation to such financial statements that references in therelevant part of that Act to financial statements giving a true and fair view are references to their achieving a fair presentation.
The Parent Company financial statements are required by law to give a true and fair view of the state of affairs of the ParentCompany. In preparing each of the Group and Parent Companyfinancial statements, the Directors are required to
• select suitable accounting policies and then apply themconsistently
• make judgments and estimates that are reasonable andprudent
• for the Group financial statements, state whether they havebeen prepared in accordance with IFRS as adopted by the EU
• for the Parent Company financial statements, state whetherapplicable UK Accounting Standards have been followed,subject to any material departures disclosed and explained in the Parent Company financial statements
• prepare the financial statements on the going concern basis unless it is inappropriate to presume that the Group and the Parent Company will continue in business.
The Directors are responsible for keeping proper accountingrecords that disclose with reasonable accuracy at any time thefinancial position of the Parent Company and enable them toensure that its financial statements comply with the CompaniesAct 1985. They have general responsibility for taking such steps as are reasonably open to them to safeguard the assets of theGroup and to prevent and detect fraud and other irregularities.
Under applicable law and regulations, the Directors are alsoresponsible for preparing a Directors’ Report, Directors’Remuneration Report and Corporate Governance Statement that comply with that law and those regulations.
The Directors are responsible for the maintenance and integrity of the corporate and financial information included on theCompany’s website. Legislation in the UK governing thepreparation and dissemination of financial statements may differ from legislation in other jurisdictions.

57 Carillion plcAnnual Report and Accounts 2007
GovernanceIndependent auditors’ report tothe members of Carillion plc
We have audited the Group and Parent Company financialstatements (the ‘financial statements’) of Carillion plc for the yearended 31 December 2007 which comprise the ConsolidatedIncome Statement, the Consolidated and Parent Company BalanceSheets, the Consolidated Cash Flow Statement, the ConsolidatedStatement of Recognised Income and Expense and the relatednotes. These financial statements have been prepared under theaccounting policies set out therein. We have also audited theinformation in the Remuneration Report that is described ashaving been audited.
This report is made solely to the Company’s members, as a body,in accordance with Section 235 of the Companies Act 1985. Ouraudit work has been undertaken so that we may state to theCompany’s members those matters we are required to state tothem in an auditor’s report and for no other purpose. To the fullestextent permitted by law, we do not accept or assume responsibilityto anyone other than the Company and the Company’s membersas a body, for our audit work, for this report, or for the opinionswe have formed.
Respective responsibilities of Directors and AuditorsThe Directors’ responsibilities for preparing the Annual Report and the Group financial statements in accordance with applicablelaw and International Financial Reporting Standards (IFRSs) asadopted by the EU, and for preparing the Parent Companyfinancial statements and the Remuneration Report in accordancewith applicable law and UK Accounting Standards (UK GenerallyAccepted Accounting Practice) are set out in the Statement ofDirectors’ Responsibilities on page 56.
Our responsibility is to audit the financial statements and the part of the Remuneration Report to be audited in accordance withrelevant legal and regulatory requirements and InternationalStandards on Auditing (UK and Ireland).
We report to you our opinion as to whether the financialstatements give a true and fair view and whether the financialstatements and the part of the Remuneration Report to be audited have been properly prepared in accordance with theCompanies Act 1985 and, as regards the Group financialstatements, Article 4 of the IAS Regulation. We also report to you whether in our opinion the information given in theDirectors’ Report is consistent with the financial statements.Theinformation given in the Directors’ Report includes that specificinformation presented in the Operating and Financial Review that is cross referred from the Principal Activities and BusinessReview section of the Directors’ Report.
In addition we report to you if, in our opinion, the Company hasnot kept proper accounting records, if we have not received all theinformation and explanations we require for audit, or informationspecified by law regarding Director’s remuneration and othertransactions is not disclosed.
We review whether the Corporate Governance Statement reflectsthe Company’s compliance with the nine provisions of the 2006Combined Code specified for our review by the Listing Rules ofthe Financial Services Authority, and we report if it does not. Weare not required to consider whether the Board’s statements oninternal control cover all risks and controls, or form an opinion onthe effectiveness of the Group’s corporate governance proceduresor its risk and control procedures,
We read the other information contained in the Annual Reportand consider whether it is consistent with the audited financialstatements. We consider the implications for our report if webecome aware of any apparent misstatements or materialinconsistencies with the financial statements. Our responsibilitiesdo not extend to any other information.
Basis of audit opinionWe conducted our audit in accordance with the InternationalStandards for Auditing (UK and Ireland) issued by the AuditingPractices Board. An audit includes examination, on a test basis, of evidence relevant to the amounts and disclosures in thefinancial statements and the part of the Remuneration Report to be audited. It also includes an assessment of the significantestimates and judgements made by the Directors in preparation of the financial statements, and of whether the accounting policies are appropriate to the Group’s and the Company’scircumstances, consistently applied and adequately disclosed.
We planned and performed our audit so as to obtain all theinformation and explanations which we considered necessary inorder to provide us with sufficient evidence to give reasonableassurance that the financial statements and the part of theRemuneration Report to be audited are free from materialmisstatement, whether caused by fraud or other irregularity or error. In forming our opinion we also evaluated the overalladequacy of the presentation of information in the financialstatements and the part of the Remuneration Report to be audited.
OpinionIn our opinion
• the Group financial statements give a true and fair view, inaccordance with IFRSs as adopted by the EU, of the state ofthe Group’s affairs as at 31 December 2007 and of its profitfor the year then ended
• the Group financial statements have been properly prepared in accordance with the Companies Act 1985 and Article 4 of the IAS Regulation
• the Parent Company financial statements give a true and fairview, in accordance with UK Generally Accepted AccountingPractice, of the state of the Parent Company’s affairs as at 31 December 2007
• the Parent Company financial statements and the part ofthe Remuneration Report to be audited have been properlyprepared in accordance with the Companies Act 1985
• the information given in the Directors’ Report is consistent with the financial statements.
KPMG Audit PlcChartered AccountantsRegistered Auditor2 Cornwall StBirminghamB3 2DL
5 March 2008
Section
04 – Go
vernan
ce

05Financial statements
60 Consolidated income statement 61 Consolidated balance sheet62 Consolidated cash flow statement63 Reconciliation of net cash flow to
movement in net borrowing63 Consolidated statement of
recognised income and expense64 Notes to the consolidated
financial statements108 Company balance sheet109 Notes to the Company
financial statements115 Shareholder information and Advisers 116 Five year reviewBack cover Further information
Section 05
58 Carillion plcAnnual Report and Accounts 2007
Carillion provides a total claimsmanagement service for NorwichUnion’s property-related insuranceclaims.

59 Carillion plcAnnual Report and Accounts 2007
Section
05 – Finan
cial statemen
ts
23%growth in underlying profit before tax to £101.8 million

Financial statementsConsolidated income statementFor the year ended 31 December 2007
60 Carillion plcAnnual Report and Accounts 2007
2007 2006(1)
Continuing operations Note £m £m
Total revenue 3,951.7 3,512.4Less: Share of jointly controlled entities revenue (621.0) (528.5)Group revenue 2 3,330.7 2,983.9Cost of sales (3,092.0) (2,789.3)Gross profit 238.7 194.6Administrative expenses (219.5) (186.6)Other operating income 3 9.5 1.9Group operating profit 3 28.7 9.9Analysed between:Group operating profit before intangible amortisation, impairment of goodwill and
other investments and restructuring costs 64.4 49.7Intangible amortisation and impairment of goodwill and other investments 2 (21.5) (17.2)Restructuring costs 4 (14.2) (22.6)
Share of results of jointly controlled entities 2 36.8 31.6Analysed between:Operating profit 55.7 47.7Net financial expense (9.9) (8.0)Taxation (9.0) (8.1)
Profit from operations 65.5 41.5Analysed between:Profit from operations before intangible amortisation, impairment of goodwill and
other investments and restructuring costs 101.2 81.3Intangible amortisation and impairment of goodwill and other investments 2 (21.5) (17.2)Restructuring costs 4 (14.2) (22.6)
Non-operating items 4 28.3 25.3Net financial income 5 0.6 1.3Analysed between:Financial income 99.8 87.0Financial expense (99.2) (85.7)
Profit before taxation 94.4 68.1Analysed between:Profit before taxation, intangible amortisation, impairment of goodwill and
other investments, restructuring costs and non-operating items 101.8 82.6Intangible amortisation and impairment of goodwill and other investments 2 (21.5) (17.2)Restructuring costs 4 (14.2) (22.6)Non-operating items 4 28.3 25.3
Taxation 7 (8.3) (7.2)Profit from continuing operations 86.1 60.9Discontinued operations 8 (7.6) (0.5)Analysed between:Trading loss from discontinued operations (1.4) (0.5)Loss on disposal of discontinued operations (6.2) –
Profit for the year 78.5 60.4Profit attributable to:Equity holders of the parent 76.0 58.2Minority interests 2.5 2.2Profit for the year 78.5 60.4Earnings per share 9From continuing operationsBasic 29.8p 21.8pDiluted 29.5p 21.5pFrom continuing and discontinued operationsBasic 27.1p 21.6pDiluted 26.8p 21.3pTotal dividend declared for the year 10 11.0p 9.0p
(1) Restated in respect of discontinued operations (see note 8).

Financial statementsConsolidated balance sheetAs at 31 December 2007
61 Carillion plcAnnual Report and Accounts 2007
2007 2006Note £m £m
AssetsNon-current assetsProperty, plant and equipment 11 131.5 146.6Intangible assets 12 555.8 596.1Retirement benefit assets 32 17.3 10.9Investments in jointly controlled entities 13 185.9 178.8Other investments 14 14.5 15.0Deferred tax assets 15 9.3 55.4Total non-current assets 914.3 1,002.8
Current assetsInventories 16 30.5 38.5Trade and other receivables 18 858.7 875.3Cash and cash equivalents 19 327.5 144.5Income tax receivable 2.2 0.2Derivative financial instruments 28 – 0.8Total current assets 1,218.9 1,059.3Total assets 2,133.2 2,062.1
LiabilitiesCurrent liabilitiesBorrowing 20 (13.9) (12.6)Derivative financial instruments 28 (0.7) –Trade and other payables 21 (1,175.7) (1,195.8)Provisions 22 (6.9) (2.4)Income tax payable (2.3) (13.0)Total current liabilities (1,199.5) (1,223.8)
Non-current liabilitiesBorrowing 20 (358.5) (239.9)Retirement benefit liabilities 32 (41.6) (123.8)Deferred tax liabilities 15 (24.0) (37.4)Provisions 22 (6.7) (3.5)Total non-current liabilities (430.8) (404.6)Total liabilities (1,630.3) (1,628.4)Net assets 502.9 433.7
EquityIssued share capital 23 140.6 140.6Share premium 24 8.6 8.6Other reserves 24 150.0 172.7Retained earnings 24 202.4 110.8Equity attributable to shareholders of the parent 501.6 432.7Minority interests 24 1.3 1.0Total equity 502.9 433.7
The financial statements were approved by the Board of Directors on 5 March 2008 and were signed on its behalf by:
Richard Adam FCAGroup Finance Director
Section
05 – Finan
cial statemen
ts

Financial statementsConsolidated cash flow statementFor the year ended 31 December 2007
62 Carillion plcAnnual Report and Accounts 2007
2007 2006(1)
Note £m £m
Continuing operationsCash flows from operating activitiesGroup operating profit 28.7 9.9Depreciation, amortisation and impairment 46.8 36.4Profit on disposal of property, plant and equipment (9.5) (1.9)Share based payment expense 2.8 1.3Other non-cash movements (2.7) (0.2)Restructuring costs 14.2 22.6Operating profit before changes in working capital and provisions 80.3 68.1Decrease in inventories 7.2 –Increase in trade and other receivables (2.9) (58.0)Increase in trade and other payables 27.4 73.2Increase in provisions – 0.1Cash generated from operations before pension deficit recovery payments and restructuring costs 112.0 83.4Deficit recovery payments to pension schemes (46.3) (31.8)Restructuring costs (6.5) (18.2)Cash generated from operations 59.2 33.4Financial income received 13.7 15.3Financial expense paid (19.9) (17.4)Taxation 4.4 1.9Net cash flows from operating activities 57.4 33.2
Cash flows from investing activitiesDisposal of property, plant and equipment 29.5 12.1Disposal of investments in jointly controlled entities 22.0 47.3Dividends received from jointly controlled entities 23.7 15.7Disposal of businesses, net of cash disposed of 31 8.2 30.4Acquisition of subsidiary, net of cash acquired 31 – (122.3)Acquisition of intangible assets (1.6) (1.8)Acquisition of property, plant and equipment (23.5) (38.5)Acquisition of equity in and loan advances to jointly controlled entities (19.6) (19.7)Acquisition of other non-current asset investments (1.0) (0.5)Net cash flows from investing activities 37.7 (77.3)
Cash flows from financing activitiesProceeds from issue of share capital – 0.4Draw down of bank and other loans 309.8 321.3Repayment of bank loans (193.3) (276.6)Payment of finance lease liabilities (10.9) (9.6)Dividends paid to equity holders of the parent (26.4) (23.2)Dividends paid to minority interests (2.2) (2.3)Net cash flows from financing activities 77.0 10.0
Net increase/(decrease) in cash and cash equivalents from continuing operations 172.1 (34.1)Discontinued operationsIncrease in cash and cash equivalents from discontinued operations 8 12.4 6.9Net increase/(decrease) in cash and cash equivalents 184.5 (27.2)Cash and cash equivalents at 1 January 141.4 169.7Effect of exchange rate fluctuations on cash held (2.1) (1.1)Cash and cash equivalents at 31 December 19 323.8 141.4
(1) Restated in respect of discontinued operations (see note 8).

Financial statementsReconciliation of net cash flow to movement in net borrowingFor the year ended 31 December 2007
63 Carillion plcAnnual Report and Accounts 2007
2007 2006(1)
£m £m
Increase/(decrease) in cash and cash equivalents for the year 184.5 (27.2)Draw down of bank and other loans (309.8) (321.3)Repayment of bank loans 193.3 276.6Payment of finance lease liabilities 10.9 9.6Decrease/(increase) in net borrowing resulting from cash flows 78.9 (62.3)Net borrowing in subsidiaries acquired – (126.1)Finance lease additions (5.5) (13.3)Currency translation differences (10.3) 2.9Change in net borrowing during the year 63.1 (198.8)Net (borrowing)/cash at 1 January (108.0) 90.8Net borrowing at 31 December (44.9) (108.0)
(1) Restated in respect of discontinued operations (see note 8).
Consolidated statement of recognised income and expenseFor the year ended 31 December 2007
2007 2006£m £m
Net (loss)/gain on hedge of net investment in foreign operations (2.7) 4.1Currency translation differences for foreign operations 2.6 (7.0)Actuarial gains on defined benefit pension schemes 30.2 34.6
30.1 31.7Taxation in respect of the above (8.3) (11.5)Share of change in fair value of effective cash flow hedges within jointly controlled entities (net of taxation) (5.3) 0.2Income and expense recognised directly in equity 16.5 20.4Profit for the year 78.5 60.4Total recognised income and expense for the year 95.0 80.8
Attributable to:Equity holders of the parent 92.5 78.6Minority interests 2.5 2.2
95.0 80.8
Section
05 – Finan
cial statemen
ts

Financial statementsNotes to the consolidated financial statements
64 Carillion plcAnnual Report and Accounts 2007
1. Significant accounting policies
Carillion plc (the ‘Company’) is a company domiciled in the UnitedKingdom (UK). The consolidated financial statements of theCompany for the year ended 31 December 2007 comprise theCompany and its subsidiaries (together referred to as the ‘Group’)and the Group’s interest in jointly controlled entities.
The consolidated financial statements were authorised for issuanceon 5 March 2008.
Statement of complianceThe Group’s financial statements have been prepared andapproved by the Directors in accordance with InternationalFinancial Reporting Standards as adopted by the EU (‘AdoptedIFRSs’). The Company has elected to prepare its parent companyfinancial statements in accordance with UK Generally AcceptedAccounting Principles (GAAP). These are presented on pages 108to 114.
Basis of preparationThe following accounting policies have been applied consistently in dealing with items which are considered material in relation to the Group’s financial statements.
The financial statements are presented in pounds sterling. They are prepared on the historical cost basis except that the followingassets and liabilities are stated at their fair value: derivativefinancial instruments, pension scheme assets and financialinstruments classified as available-for-sale.
The company has adopted IFRS 7 ‘Financial instruments: Disclosure’and the amendment to IAS 1 ‘Presentation of financial statements’which are mandatory for years ending 31 December 2007. This hasresulted in additional disclosures but no impact on reported profitor net assets.
The following standards and interpretations have been endorsedby the EU by the year end but are not yet effective for the yearending 31 December 2007
• International Financial Reporting Interpretations Committee 11‘Group and treasury share transactions’
• International Financial Reporting Standard 8 ‘Operating Segments’.
The Group has considered the impact of these new standards and interpretations in future periods and no significant impact isexpected on reported profit or net assets. The Group has chosennot to early adopt any of the above standards and interpretations.
Presentational changes have been made to the income statement,cash flow statement and segmental reporting note compared with the presentation in the Annual Report and Accounts for theyear ended 31 December 2006 in order to facilitate a greaterunderstanding and improve the transparency of the Group’sreported results.
Basis of Consolidation(a) SubsidiariesThe consolidated financial statements comprise the financialstatements of the Company and subsidiaries controlled by theCompany drawn up to 31 December 2007. Control exists whenthe Group has direct or indirect power to govern the financial andoperating policies of an entity so as to obtain economic benefitsfrom its activities. Subsidiaries are included in the consolidatedfinancial statements from the date that control transfers to theGroup until the date that control ceases. The financial statementsof subsidiaries used in the preparation of the consolidated financialstatements are prepared for the same reporting year as the Parent Company.
The purchase method is used to account for the acquisition of subsidiaries.
(b) Joint VenturesA Joint Venture is a contractual arrangement whereby the Groupundertakes an economic activity that is subject to joint controlwith third parties. The Group’s interests in jointly controlled entities are accounted for using the equity method. Under this method theGroup’s share of the profits less losses of jointly controlled entitiesis included in the consolidated income statement and its interest in their net assets is included in investments in the consolidatedbalance sheet. Where the share of losses exceeds the interest inthe entity the carrying amount is reduced to nil and recognition offurther losses is discontinued. Interest in the entity is the carryingamount of the investment together with any long-term intereststhat, in substance, form part of the net investment in the entity.
Financial statements of jointly controlled entities are prepared forthe same reporting period as the Group except for
• Carillion Enterprise Ltd• Modern Housing Solutions (Prime) Ltd.
Both of these entities now have 31 March year ends.
Where a Group company is party to a jointly controlled operation,that company accounts for the assets it controls, the liabilities andexpenses it incurs and its share of the income. Such arrangementsare reported in the consolidated financial statements on the same basis.
Other non-current asset investmentsOther non-current asset investments are classified as available-for-sale financial assets and are recognised at fair value. Changesin fair value in the year are recognised directly in the statement of recognised income and expense. Dividend income frominvestments is recognised when the right to receive payment is established.
Goodwill and other intangible assetsGoodwill arising on acquisitions that have occurred since 1 January 2004 represents the difference between the fair value of the cost of acquisition and the fair value of the identifiableassets, liabilities and contingent liabilities of an acquired entity.

65 Carillion plcAnnual Report and Accounts 2007
1. Significant accounting policies (continued)
Consideration includes the attributable costs of the acquisition. In respect of acquisitions prior to 1 January 2004 goodwill isincluded on the basis of its deemed cost, which represents the amount recorded under previous Generally AcceptedAccounting Principles.
Positive goodwill is recognised as an asset in the consolidated balance sheet and is subject to an annual impairment review.Goodwill arising on the acquisition of subsidiaries is recognisedseparately as an intangible asset in the consolidated balance sheet.Goodwill arising on the acquisition of jointly controlled entities is included within the carrying value of the investment. Negativegoodwill is recognised in the income statement immediately.
Other intangible assets are stated at cost less accumulatedamortisation and impairment losses. Amortisation is based on the useful economic lives of the assets concerned, which areprincipally as follows.
Computer software and licences• Straight line over three to five years.
Customer contracts and lists• Planned Maintenance Group
Consumption of economic benefits over six years• Mowlem plc
Consumption of economic benefits over 35 years.
ImpairmentAssets that have an indefinite useful life are not subject toamortisation and are tested for impairment at each balance sheetdate. Assets subject to depreciation and amortisation are reviewedfor impairment whenever events or circumstances indicate that thecarrying amount may not be recoverable. An impairment loss isrecognised in the income statement based on the amount bywhich the carrying amount exceeds the recoverable amount. The recoverable amount is the higher of fair value less costs to sell and value in use.
In assessing value in use, the estimated future cash flows arediscounted to their present value using a pre-tax discount rate thatreflects current market assessments of the time value of moneyand the risks specific to the asset.
Construction contractsWhen the outcome of a construction contract can be estimatedreliably, contract revenue and costs are recognised by reference to the degree of completion of each contract, as measured by the proportion of total costs at the balance sheet date to theestimated total cost of the contract.
Insurance claims, incentive payments and variations arising fromconstruction contracts are included where they have been agreedwith the client.
When the outcome of a construction contract cannot beestimated reliably, contract revenue is recognised to the extent of contract costs incurred where it is probable those costs will be recoverable.
The principal estimation technique used by the Group inattributing profit on contracts to a particular period is thepreparation of forecasts on a contract by contract basis. These focus on revenues and costs to complete and enable anassessment to be made of the final out-turn of each contract.Consistent contract review procedures are in place in respect ofcontract forecasting.
When it is probable that total contract costs will exceed totalcontract revenue, the expected loss is recognised immediately.Contract costs are recognised as expenses in the period in whichthey are incurred.
Where costs incurred plus recognised profits less recognised lossesexceed progress billings, the balance is shown as due fromcustomers on construction contracts within trade and otherreceivables. Where progress billings exceed costs incurred plusrecognised profits less recognised losses, the balance is shown as due to customers on construction contracts within trade andother payables.
Pre-contract costsPre-contract costs are expensed as incurred until the Group isappointed preferred bidder. Provided the contract is expected to generate sufficient net cash inflows to enable recovery and the award of the contract is probable, pre-contract costs incurredpost the appointment as preferred bidder are included in amountsowed by customers on construction contracts. Where pre-contractbid costs are reimbursed at financial close, the proceeds are initiallyapplied against the asset included in amounts owed by customerson construction contracts. Any excess recoveries are carriedforward as deferred income and released to profit over the period of the contract.
Revenue recognitionRevenue represents the fair value of consideration receivable,excluding Value Added Tax, for services supplied to externalcustomers. It also includes the Group’s proportion of work carried out under jointly controlled operations during the year.Revenue from service contracts is recognised by reference toservices performed to date as a percentage of total services to be performed. Revenue from construction contracts isrecognised in accordance with the Group’s accounting policy on construction contracts.
Property, plant and equipmentDepreciation is based on historical cost, less the estimated residualvalues, and the estimated economic lives of the assets concerned.Freehold land is not depreciated. Property, plant and equipment is depreciated in equal annual instalments over the period of theirestimated economic lives, which are principally as follows:
Freehold buildings 40-50 yearsLeasehold buildings and improvements Period of leasePlant, machinery and vehicles 3-10 years
Assets held under finance leases are depreciated over the shorterof the term of the lease or the expected useful life of the asset.
Section
05 – Finan
cial statemen
ts

Financial statementsNotes to the consolidated financial statementscontinued
66 Carillion plcAnnual Report and Accounts 2007
1. Significant accounting policies (continued)
LeasingOperating lease rental charges are charged to the incomestatement on a straight-line basis over the life of each lease.
Assets held under finance leases are included in property, plantand equipment at the lower of fair value at the date of acquisitionor present value of the minimum lease payments. The capitalelement of outstanding finance leases is included in financialliabilities. The finance charge element of rentals is charged to theincome statement at a constant periodic rate of charge on theoutstanding obligations.
InventoriesInventories comprise raw materials and land for development andare valued at the lower of cost and net realisable value. Cost iscalculated using the weighted average method.
TaxationIncome tax comprises current and deferred tax. Income tax isrecognised in the income statement except to the extent that it relates to items recognised directly in equity, in which case it is recognised in equity.
Current tax is the expected tax payable on taxable income for the year, using tax rates enacted or substantively enacted at thebalance sheet date, and any adjustment to tax payable in respectof previous years.
Deferred tax is provided using the balance sheet liability method,providing for temporary differences between the carrying amountsof assets and liabilities for financial reporting purposes and theamounts used for taxation purposes. The amount of deferred taxprovided is based on the expected manner of realisation orsettlement of the carrying amount of the assets and liabilities,using tax rates enacted or substantively enacted at the balancesheet date.
A deferred tax asset is recognised only to the extent that it isprobable that future taxable profits will be available against which the asset can be utilised. Deferred tax assets are reduced to the extent that it is no longer probable that the related taxbenefit will be realised.
Foreign currenciesIn individual entities, transactions denominated in foreigncurrencies are translated into sterling and recorded using theexchange rate prevailing at the date of the transaction. Monetaryassets and liabilities denominated in foreign currencies aretranslated into sterling at the exchange rates ruling at the balancesheet date and the gains and losses on translation are included in the income statement.
On consolidation, the balance sheets of overseas entities aretranslated into sterling at the rates of exchange ruling at thebalance sheet date. Income statements and cash flows of overseasentities are translated into sterling at rates approximating to theforeign exchange rates at the date of the transaction. Gains orlosses arising from the consolidation of overseas entities arerecognised in the translation reserve.
Net investment hedging of overseas operations is achievedthrough borrowings denominated in the relevant foreigncurrencies. Gains and losses arising from the effective portionof the hedges are recognised in equity and ineffective portionsare recognised immediately in the income statement.
Employee benefits(a) Retirement benefit obligationsFor defined contribution pension schemes operated by the Group, amounts payable are charged to the income statement as they fall due.
For defined benefit pension schemes, the International AccountingStandard (IAS) 19 cost of providing benefits is calculated annuallyby independent actuaries using the projected unit credit method. The charge to the income statement reflects the current servicecost of such obligations and, where applicable, past service cost.The expected return on plan assets and the interest cost of schemeliabilities are included within financial income and expenses in theincome statement.
The retirement benefit obligation recognised in the balance sheetrepresents the excess of the present value of the scheme liabilitiesover the fair value of scheme assets. When the calculation resultsin an asset to the Group, the amount recognised is limited to thenet total of any unrecognised past service costs and the presentvalue of any future refunds from the plan or reductions in futurecontributions to the plan. Differences between the actual andexpected returns on assets and experience gains and losses arising on scheme liabilities during the year, together withdifferences arising from changes in assumptions, are recognised in the statement of recognised income and expense in the year.
The Group’s contributions to the scheme are paid in accordancewith the scheme rules and the recommendations of the actuary.
(b) Other post-retirement benefit obligations Certain Group companies provide post-retirement healthcarebenefits to their employees. The expected costs of providing these benefits are accrued over the period of employment and are calculated by independent actuaries based on the presentvalue of the expected liability.
(c) Share-based paymentsMembers of the Group’s senior management team are entitled toparticipate in the Executive Share Option Scheme (ESOS), the LongTerm Incentive Plan (LTIP) and the Leadership Equity Award Plan(LEAP). In addition, UK employees are able to participate in theSharesave scheme.

67 Carillion plcAnnual Report and Accounts 2007
1. Significant accounting policies (continued)
The fair value of the ESOS, LEAP and Sharesave schemes at the date of grant are estimated using the Black-Scholes pricingmodel. The fair value of the LTIP scheme is estimated using abespoke model that factors in the probabilities of achieving Total Shareholder Return (TSR) performance conditions. For allschemes the fair value determined at grant date is expensed on a straight-line basis over the period in which any performanceconditions are fulfilled, ending on the date on which the relevantemployees become fully entitled to the award (vesting date).
Borrowing costsBorrowing costs are capitalised where the Group constructsqualifying assets. All other borrowing costs are written off to the income statement as incurred.
Borrowing costs incurred within the Group’s jointly controlledentities relating to the construction of assets in PPP projects are capitalised until the relevant assets are brought intooperational use.
Borrowing costs are charged to the income statement using theeffective interest method.
Share capitalThe ordinary share capital of the Company is recorded at the proceeds received, net of directly attributable incremental issue costs.
Consideration paid for shares in the Company held by theEmployee Share Ownership Plan (ESOP) Trust are deducted fromthe retained earnings reserve. Where such shares subsequentlyvest in the employees under the terms of the Group’s share optionschemes or are sold, any consideration received is included in theretained earnings reserve.
ProvisionsA provision is recognised in the balance sheet when the Group has a present legal or constructive obligation as a result of a pastevent, and where it is probable that an outflow will be required to settle the obligation.
Provisions for restructuring are recognised when the Group has anapproved restructuring plan that has either commenced or beenannounced publicly. Future operating costs are not provided for.
Financial instrumentsFinancial instruments are recognised when the Group becomes aparty to the contractual provisions of the instrument. The principalfinancial assets and liabilities of the Group are as follows:
(a) Trade receivablesTrade receivables are initially recognised at fair value and then are stated at amortised cost.
(b) Cash and cash equivalentsCash and cash equivalents are carried in the balance sheet atamortised cost. For the purposes of the cash flow statement, cash and cash equivalents comprise cash at bank and in hand,including bank deposits with original maturities of three months or less. Bank overdrafts are also included as they are an integralpart of the Group’s cash management.
(c) Trade payablesTrade payables are initially recognised at fair value and then are stated at amortised cost.
(d) Bank and other borrowingInterest-bearing bank loans and overdrafts and other loans arerecognised initially at fair value less attributable transaction costs.All borrowings are subsequently stated at amortised cost with the difference between initial net proceeds and redemption value recognised in the income statement over the period to redemption.
(e) Derivative financial instrumentsDerivatives are initially recognised at fair value on the date thecontract is entered into and subsequently re-measured in futureperiods at their fair value. The method of recognising the resultingchange in fair value is dependent on whether the derivative isdesignated as a hedging instrument.
A number of the Group’s Public Private Partnership jointlycontrolled entities have entered into interest rate derivatives as a means of hedging interest rate risk. The effective part of thechange in fair value of these derivatives is recognised directly inequity. Any ineffective portion is recognised immediately in theincome statement. Amounts accumulated in equity are recycled to the income statement in the periods when the hedged itemswill affect profit or loss. The fair value of interest rate swaps is the estimated amount that the Group would receive or pay toterminate the swap at the balance sheet date.
The Group also enters into forward contracts in order to hedgeagainst small and infrequent transactional foreign currencyexposures. In cases where these derivative instruments aresignificant, hedge accounting is applied as described above. Where hedge accounting is not applied, movements in fair valueare recognised in the income statement. Fair values are based on quoted market prices at the balance sheet date.
Section
05 – Finan
cial statemen
ts

Financial statementsNotes to the consolidated financial statementscontinued
68 Carillion plcAnnual Report and Accounts 2007
2. Segmental reporting
Segment information is presented in respect of the Group’s business segments, which are the primary basis of segment reporting. The business segment reporting format reflects the Group’s management and internal reporting structure.
Inter-segment pricing is determined on an arm’s length basis. Segment results include items directly attributable to a segment as well as those that can be allocated on a reasonable basis.
Business SegmentsThe Group is comprised of the following main business segments
• Support Services: Rail infrastructure, roads maintenance, facilities management and other support services • Construction Services: UK Building, development and civil engineering and international regional construction • Public Private Partnership projects: Equity returns on investments in Public Private Partnership (PPP) projects
Segmental revenue and profitYear ended 31 December 2007
Operatingprofit before
intangibleamortisation,
impairment andrestructuring
Revenue costs
UK, Canada UK, Canadaand the and the
Caribbean(1) Middle East Total Caribbean(1) Middle East TotalContinuing operations £m £m £m £m £m £m
Support services(2)
Group 1,569.4 – 1,569.4 62.4 – 62.4Share of jointly controlled entities 218.8 5.4 224.2 11.0 0.5 11.5
1,788.2 5.4 1,793.6 73.4 0.5 73.9Inter-segment 64.7 – 64.7 – – –Total 1,852.9 5.4 1,858.3 73.4 0.5 73.9
Public private partnership projectsGroup 0.9 – 0.9 0.7 – 0.7Share of jointly controlled entities 153.2 – 153.2 24.7 – 24.7
154.1 – 154.1 25.4 – 25.4Inter-segment – – – – – –Total 154.1 – 154.1 25.4 – 25.4
Construction servicesGroup 1,660.4 100.0 1,760.4 12.3 9.6 21.9Share of jointly controlled entities 6.6 237.0 243.6 3.7 15.8 19.5
1,667.0 337.0 2,004.0 16.0 25.4 41.4Inter-segment 32.0 – 32.0 – – –Total 1,699.0 337.0 2,036.0 16.0 25.4 41.4
Group eliminations and unallocated items (96.7) – (96.7) (20.6) – (20.6)
ConsolidatedGroup 3,230.7 100.0 3,330.7 54.8 9.6 64.4Share of jointly controlled entities 378.6 242.4 621.0 39.4 16.3 55.7Total 3,609.3 342.4 3,951.7 94.2 25.9 120.1
(1) includes Rest of the World(2) Support services excludes the results of discontinued operations as disclosed in note 8.

69 Carillion plcAnnual Report and Accounts 2007
2. Segmental reporting (continued)
Segmental revenue and profit (continued)Year ended 31 December 2006
Operatingprofit before
intangibleamortisation,
impairment andrestructuring
Revenue costs
UK, Canada UK, Canadaand the and the
Caribbean(1) Middle East Total Caribbean(1) Middle East TotalContinuing operations £m £m £m £m £m £m
Support services(2)
Group 1,314.8 – 1,314.8 51.5 – 51.5Share of jointly controlled entities 138.3 5.6 143.9 7.1 0.2 7.3
1,453.1 5.6 1,458.7 58.6 0.2 58.8Inter-segment 30.2 – 30.2 – – –Total 1,483.3 5.6 1,488.9 58.6 0.2 58.8
Public private partnership projectsGroup 1.3 – 1.3 7.1 – 7.1Share of jointly controlled entities 146.7 – 146.7 19.4 – 19.4
148.0 – 148.0 26.5 – 26.5Inter-segment – – – – – –Total 148.0 – 148.0 26.5 – 26.5
Construction servicesGroup 1,625.5 42.3 1,667.8 10.1 1.3 11.4Share of jointly controlled entities 11.5 226.4 237.9 8.4 12.6 21.0
1,637.0 268.7 1,905.7 18.5 13.9 32.4Inter-segment 4.0 – 4.0 – – –Total 1,641.0 268.7 1,909.7 18.5 13.9 32.4
Group eliminations and unallocated items (34.2) – (34.2) (20.3) – (20.3)
ConsolidatedGroup 2,941.6 42.3 2,983.9 48.4 1.3 49.7Share of jointly controlled entities 296.5 232.0 528.5 34.9 12.8 47.7Total 3,238.1 274.3 3,512.4 83.3 14.1 97.4
(1) includes Rest of the World(2) Support services excludes the results of discontinued operations as disclosed in note 8.
Section
05 – Finan
cial statemen
ts

Financial statementsNotes to the consolidated financial statementscontinued
70 Carillion plcAnnual Report and Accounts 2007
2. Segmental reporting (continued)
Segmental revenue and profit (continued)2007 2006
£m £m
Group and share of jointly controlled entities’ operating profit before intangible amortisation, impairment of goodwill and other investments and restructuring costs 120.1 97.4
Net financial income/(expense)– Group 0.6 1.3– Share of jointly controlled entities (9.9) (8.0)Share of jointly controlled entities’ taxation (9.0) (8.1)Underlying profit before taxation from continuing operations 101.8 82.6Intangible amortisation and impairment of goodwill and other investments(1) (21.5) (17.2)Restructuring costs(1) (14.2) (22.6)Non-operating items(1) 28.3 25.3Profit before taxation from continuing operations 94.4 68.1Taxation (8.3) (7.2)Profit from continuing operations 86.1 60.9Discontinued operations (7.6) (0.5)Analysed between:Trading loss from discontinued operations (1.4) (0.5)Loss on disposal of discontinued operations (6.2) –
Profit for the year 78.5 60.4
(1) Intangible amortisation and impairment, restructuring costs and non-operating items arise in the following segments.2007 2006
Intangible Intangibleamortisation Non- amortisation Non-
and Restructuring operating and Restructuring operatingimpairment costs items impairment costs items
£m £m £m £m £m £m
Support services (13.9) (0.5) – (11.9) (6.0) (0.3)Public private partnership projects (1.9) – 24.1 (0.4) (0.2) 25.6Construction services (4.2) – 4.2 (3.6) (1.5) –Unallocated Group items (1.5) (13.7) – (1.3) (14.9) –Total (21.5) (14.2) 28.3 (17.2) (22.6) 25.3
Depreciation, amortisation and impairment and capital expenditure arise in the following segments.2007 2006
Depreciation, Depreciation,amortisation Capital amortisation Capital
and impairment(2) expenditure and impairment(2) expenditure£m £m £m £m
Support services 28.3 15.0 23.5 28.9Public private partnership projects 1.9 – 0.4 –Construction services 7.5 4.2 7.0 4.7Unallocated Group items 9.1 11.2 5.5 19.7Total 46.8 30.4 36.4 53.3
(2) Includes impairment of goodwill and other investments within Public Private Partnership projects of £1.9m (2006: £0.4m).

71 Carillion plcAnnual Report and Accounts 2007
2. Segmental reporting (continued)
The share of results of jointly controlled entities arises in the following segments.2007 2006
£m £m
Support services 8.5 5.2Public Private Partnership projects 9.4 7.3Construction services 18.9 19.1
36.8 31.6
Segmental net assets2007 2006
Net Netoperating operating
Operating Operating assets/ Operating Operating assets/assets liabilities (liabilities) assets liabilities (liabilities)
£m £m £m £m £m £m
Support servicesOperating assets 716.3 – 716.3 761.5 – 761.5Investments in jointly controlled entities 4.4 – 4.4 2.1 – 2.1Total operating assets 720.7 – 720.7 763.6 – 763.6Total operating liabilities – (392.4) (392.4) – (420.2) (420.2)Net operating assets 720.7 (392.4) 328.3 763.6 (420.2) 343.4
Public Private Partnership projectsOperating assets 7.8 – 7.8 7.0 – 7.0Investments in jointly controlled entities 134.9 – 134.9 130.9 – 130.9Total operating assets 142.7 – 142.7 137.9 – 137.9Total operating liabilities – (10.0) (10.0) – (22.0) (22.0)Net operating assets 142.7 (10.0) 132.7 137.9 (22.0) 115.9
Construction servicesOperating assets 750.4 – 750.4 832.0 – 832.0Investments in jointly controlled entities 46.6 – 46.6 45.8 – 45.8Total operating assets 797.0 – 797.0 877.8 – 877.8Total operating liabilities – (678.2) (678.2) – (709.9) (709.9)Net operating assets 797.0 (678.2) 118.8 877.8 (709.9) 167.9
ConsolidatedOperating assets 1,474.5 – 1,474.5 1,600.5 – 1,600.5Investments in jointly controlled entities 185.9 – 185.9 178.8 – 178.8Total operating assets 1,660.4 – 1,660.4 1,779.3 – 1,779.3Total operating liabilities – (1,080.6) (1,080.6) – (1,152.1) (1,152.1)
Net operating assets/(liabilities) before Group items 1,660.4 (1,080.6) 579.8 1,779.3 (1,152.1) 627.2
Group itemsDeferred tax assets/(liabilities) 9.3 (24.0) (14.7) 55.4 (37.4) 18.0Net borrowing 327.5 (372.4) (44.9) 144.5 (252.5) (108.0)Retirement benefit assets/ (liabilities) (gross of taxation) 17.3 (41.6) (24.3) 10.9 (123.8) (112.9)Income tax payable 2.2 (2.3) (0.1) 0.2 (13.0) (12.8)Other net assets/(liabilities) 116.5 (109.4) 7.1 71.8 (49.6) 22.2Net assets 2,133.2 (1,630.3) 502.9 2,062.1 (1,628.4) 433.7
Section
05 – Finan
cial statemen
ts

Financial statementsNotes to the consolidated financial statementscontinued
72 Carillion plcAnnual Report and Accounts 2007
2. Segmental reporting (continued)
Geographic segments2007 2006
£m £m
United KingdomTotal revenue from external customers 3,385.4 2,991.6Less: share of jointly controlled entities’ revenue (334.7) (260.6)Revenue from external customers 3,050.7 2,731.0
Total operating assets 1,361.9 1,515.5Capital expenditure 22.1 31.7
Middle EastTotal revenue from external customers 342.4 274.3Less: share of jointly controlled entities’ revenue (242.4) (232.0)Revenue from external customers 100.0 42.3
Total operating assets 75.6 38.9Capital expenditure 2.2 1.3
Canada and the CaribbeanTotal revenue from external customers 186.0 163.5Less: share of jointly controlled entities’ revenue (7.5) (7.3)Revenue from external customers 178.5 156.2
Total operating assets 146.9 117.2Capital expenditure 5.9 20.2
Rest of the WorldTotal revenue from external customers 37.9 83.0Less: share of jointly controlled entities’ revenue (36.4) (28.6)Revenue from external customers 1.5 54.4
Total operating assets 76.0 107.7Capital expenditure 0.2 0.1
ConsolidatedTotal revenue from external customers 3,951.7 3,512.4Less: share of jointly controlled entities’ revenue (621.0) (528.5)Revenue from external customers 3,330.7 2,983.9
Total operating assets 1,660.4 1,779.3Capital expenditure 30.4 53.3

73 Carillion plcAnnual Report and Accounts 2007
3. Group operating profit
2007 2006£m £m
Group operating profit has been arrived at after charging/(crediting):Depreciation of property, plant and equipment(1) 24.3 20.4Amortisation of intangible assets 20.6 17.8Impairment of goodwill relating to jointly controlled entities – 0.4Impairment reversal in respect of property, plant and equipment – (2.1)Impairment of other non-current asset investments 1.9 0.2Other operating income – profit on disposal of property, plant and equipment (9.5) (1.9)Operating lease charges 81.6 79.4Foreign exchange (gains)/losses (5.6) 1.0Auditors’ remuneration:Fees payable to the Company’s auditor for the audit of the annual accounts 0.4 0.5Fees payable to the Company’s auditor and its associates for other services– Audit of the Company’s subsidiaries, pursuant to legislation 1.1 1.4– Other services pursuant to legislation – 0.4– Taxation services 0.3 0.5– Services relating to information technology – 0.1– Services relating to corporate finance transactions – 0.1Fees in respect of Group pension schemes– Audit 0.1 0.1
(1) Excludes depreciation of £0.4m (2006: £0.4m) relating to discontinued operations.
Carillion’s share of the fees paid to KPMG Audit plc and its associates by Group jointly controlled entities in respect of audit servicesamounted to £0.1m (2006: £0.1m).
4. Restructuring costs and non-operating items
Restructuring costs2007 2006
£m £m
Mowlem integration costs 9.5 18.4Operational structure review costs 4.5 –Rail activities review costs 0.2 4.2
14.2 22.6
Mowlem integration costs in 2007 primarily relate to property exit costs arising from a review of the Group’s requirements following the acquisition of Mowlem plc in 2006.
Following a period of rapid growth, the Group undertook a rationalisation of the operating structure at the end of 2007 at a cost of £4.5 million.
An income tax credit of £2.7m (2006: £5.0m) relating to the above restructuring costs has been included within income tax in the income statement.
Non-operating items2007 2006
£m £m
Profit on disposal of investments in jointly controlled entities 24.5 26.0Profit/(loss) on disposal of businesses 3.7 (0.7)Other 0.1 –
28.3 25.3
Further disclosure on the Group’s sale of businesses and investments in jointly controlled entities during 2007 can be found in Note 31.
The loss on disposal of businesses in 2006 of £0.7m relates to the closure of a small rail businesss in Norway.
There is no income tax associated with any of the non-operating items in either 2007 or 2006.
Section
05 – Finan
cial statemen
ts

Financial statementsNotes to the consolidated financial statementscontinued
74 Carillion plcAnnual Report and Accounts 2007
5. Financial income and expenses
2007 2006£m £m
Financial incomeBank interest receivable 5.1 8.0Other interest receivable 8.6 7.3Expected return on pension scheme assets 86.1 71.7
99.8 87.0
Financial expensesInterest payable on bank loans and overdrafts (15.4) (13.3)Other interest payable and similar charges (4.5) (4.2)Interest cost on pension scheme liabilities (79.3) (68.2)
(99.2) (85.7)
Net financial income 0.6 1.3
Other interest payable and similar charges includes finance lease charges of £2.8m (2006: £2.7m).
6. Payroll costs and employee numbers
2007 2006£m £m
Wages and salaries 649.9 641.3Social security costs 63.4 63.8Pension costs 29.3 35.1Equity settled transactions 2.8 1.3
745.4 741.5
Pension costs represent amounts in respect of the Group’s UK and overseas schemes as described in note 32 and includes £5.4m (2006: £5.5m) in respect of defined contribution schemes.
Detailed information concerning Directors’ remuneration, including their pension benefits and long-term incentive arrangements, is set out in the Remuneration Report on pages 48 to 55.
The average number of employees during each year, including Directors, was.2007 2006
Number Number
Support services 18,495 23,560Public private partnership projects 41 56Construction services 11,818 7,627Corporate centre 392 333
30,746 31,576
UK 23,434 27,649Overseas 7,312 3,927
30,746 31,576
In addition to the above there are 24,727 staff (2006: 14,684) employed within the Group’s jointly controlled entities located in theMiddle East.

75 Carillion plcAnnual Report and Accounts 2007
7. Income tax
Recognised in the income statement2007 2006
£m £m
Current tax expense/(credit)Current year– UK (7.4) 3.2– Overseas 3.0 2.7Adjustments for prior years– UK (9.0) (7.1)– Overseas (1.3) –Total current tax (14.7) (1.2)
Deferred tax expenseOrigination and reversal of temporary differences 21.5 8.6Adjustments for prior years 2.3 (0.2)Change in tax rate (0.8) –Total deferred tax 23.0 8.4Total income tax expense in the income statement 8.3 7.2
Reconciliation of effective tax rate2007 2006
£m £m
Profit before tax 94.4 68.1Tax of jointly controlled entities 9.0 8.1
103.4 76.2Income tax at UK standard corporation tax rate of 30% (2006: 30%) 31.0 22.9Permanent differences 4.5 5.8Unrelieved trade losses 4.0 1.4Capital items not taxable (11.5) (7.9)Amortisation of intangible assets 0.3 0.8Effect of tax losses utilised (2.1) (0.2)Effect of tax rates in foreign jurisdictions (0.1) 0.2Over provided in prior years (8.0) (7.3)Change in rate (0.8) –Effect of unrecognised timing differences – (0.4)Total tax (including tax of jointly controlled entities) 17.3 15.3Tax of jointly controlled entities (9.0) (8.1)Group income tax expense 8.3 7.2
The release of the over-provision in prior years of £8.0m is attributable to the agreement of certain tax issues with the tax authorities. The over-provision relating to prior years in 2006 of £7.3m principally arose from agreement being reached on various projects with the UK and Republic of Ireland tax authorities and the release of a potential overseas tax liability in respect of the ownership of CarillionAlawi based in Oman.
Tax asset recognised directly in equity2007 2006
£m £m
Deferred tax on actuarial gains and losses on defined benefit pension schemes 9.1 10.3Current tax on foreign exchange translation adjustments (0.8) 1.2Tax recognised in statement of recognised income and expense 8.3 11.5Deferred tax on equity settled transactions 0.8 0.4Total tax recognised in equity 9.1 11.9
Section
05 – Finan
cial statemen
ts

Financial statementsNotes to the consolidated financial statementscontinued
76 Carillion plcAnnual Report and Accounts 2007
8. Discontinued operationsThe Group disposed of non-core rail activities in Sweden and Denmark in July 2007 and Pall Mall Holdings Limited and Sovereign SoftServices Limited in September 2007. The disposal of the rail businesses in Sweden and Denmark marks the Group’s exit from activities in the region. The disposal of Pall Mall Holdings Limited and Sovereign Soft Services Limited reflects the divestment of non-core activitiesacquired with Mowlem plc in 2006. On this basis, these operations have been classified as discontinued and the income statement andcash flow statement for 2006 have been restated accordingly.
The results of these operations in total, which were previously reported in the support services segment, were as follows.2007 2006
£m £m
Revenue 64.9 81.0Cost of sales (59.5) (72.9)Gross profit 5.4 8.1Administrative expenses (6.6) (8.7)Operating loss (1.2) (0.6)Net financial income – 0.1Loss before tax (1.2) (0.5)Taxation (0.2) –Trading loss for the year (1.4) (0.5)Loss on disposal (6.2) –Loss from discontinued operations (7.6) (0.5)
The disposal of discontinued operations had the following effect on the financial position of the Group.
Net assets and liabilities disposedCarrying
value£m
Property, plant and equipment (1.3)Intangible assets (19.6)Deferred tax assets (0.3)Inventories (0.3)Trade and other receivables (18.2)Cash and cash equivalents (2.9)Current borrowing 1.2Trade and other payables 15.0Income tax payable 0.4Net assets disposed of (26.0)Consideration receivable (net of disposal costs of £5.4m) 19.8Loss on disposal (6.2)
The consideration receivable of £19.8m was satisfied in cash and has been reflected in the cash flow statement within net cash flows from investing activities of discontinued operations as follows.
2007£m
Cash received 24.8Disposal costs paid (1.1)
23.7Cash and cash equivalents disposed of (1.7)Net cash inflow on disposal of discontinued operations 22.0
The net cash flows relating to discontinued operations during the year are as follows.2007 2006
£m £m
Net cash (outflow)/inflow from operating activities (9.3) 7.5Net cash inflow/(outflow) from investing activities 21.7 (0.6)Increase in cash and cash equivalents from discontinued operations 12.4 6.9

77 Carillion plcAnnual Report and Accounts 2007
9. Earnings per share
(a) Basic earnings per shareThe calculation of earnings per share for the year ended 31 December 2007 is based on the profit attributable to equity holders of theparent of £76.0m (2006: £58.2m) and a weighted average number of ordinary shares in issue of 280.6m (2006: 269.5m), calculated as follows.In millions of shares 2007 2006
Issued ordinary shares at 1 January 281.2 214.9Effect of own shares held by Employee Share Ownership Plan and Qualifying Employee Share Ownership Trust (0.6) (1.9)Effect of shares issued in the year – 56.5Weighted average number of ordinary shares at 31 December 280.6 269.5
(b) Underlying performanceA reconciliation of profit before taxation and basic earnings per share, as reported in the income statement, to underlying profit beforetaxation and earnings per share is set out below. The adjustments made in arriving at the underlying performance measures are made to illustrate the impact of non-trading and non-recurring items.
2007 2006
Profit Profit before tax Tax before tax Tax
£m £m £m £m
Profit before taxation – continuing operationsProfit before taxation as reported in the income statement 94.4 8.3 68.1 7.2Restructuring costs 14.2 2.7 22.6 5.0Amortisation of intangible assets arising from business combinations 19.6 7.3 16.8 4.4Impairment of goodwill and other investments 1.9 – 0.4 –Profit on disposal of investments and businesses (28.3) – (25.3) –Underlying profit before taxation – continuing operations 101.8 18.3 82.6 16.6Underlying taxation (18.3) (16.6)Minority interests (2.5) (2.2)Underlying profit attributable to shareholders – continuing operations 81.0 63.8Underlying loss attributable to shareholders – discontinued operations (7.6) (0.5)Underlying profit attributable to shareholders – continuing and discontinued operations 73.4 63.3
2007 2006Pence per Pence per
share share
Earnings per shareBasic earnings per share – continuing and discontinued operations 27.1 21.6Restructuring costs 4.1 6.5Amortisation of intangible assets arising from business combinations 4.4 4.6Impairment of goodwill and other investments 0.7 0.2Profit on disposal of investments and businesses (10.1) (9.4)Underlying basic earnings per share – continuing and discontinued operations 26.2 23.5Discontinued operations 2.7 0.2Underlying basic earnings per share – continuing operations 28.9 23.7Diluted earnings per share – discontinued operations (2.7) (0.2)
(c) Diluted earnings per shareThe calculation of diluted earnings per share is based on profit as shown in note 9(b) and a weighted average number of ordinary shares outstanding calculated as follows.In millions of shares 2007 2006
Weighted average number of ordinary shares 280.6 269.5Effect of share options in issue 3.0 3.1Weighted average number of ordinary shares (diluted) at 31 December 283.6 272.6
Section
05 – Finan
cial statemen
ts

Financial statementsNotes to the consolidated financial statementscontinued
78 Carillion plcAnnual Report and Accounts 2007
10. DividendsThe following dividends were paid by the Company.
2007 2006Pence per Pence per
£m share £m share
Previous year final dividend 16.6 5.9 14.5 5.2Current year interim dividend 9.8 3.5 8.7 3.1
26.4 9.4 23.2 8.3
The following dividends were proposed by the Company.2007 2006
Pence per Pence per£m share £m share
Interim 9.8 3.5 8.7 3.1Final 29.6 7.5 16.6 5.9
39.4 11.0 25.3 9.0
The final dividend for 2007 of 7.5 pence per share was approved by the Board on 5 March 2008 and will be paid on 20 June 2008 to shareholders on the register on 25 April 2008. The amount expected to be paid in respect of the 2007 final dividend of £29.6m includes the dividend payable on 112.9m new Carillion shares issued following the acquisition of Alfred McAlpine plc on 12 February 2008.
11. Property, plant and equipment
Plant,Land and equipmentbuildings and vehicles Total
£m £m £m
CostAt 1 January 2007 29.3 127.6 156.9Additions 3.6 25.5 29.1Disposals (17.5) (41.9) (59.4)Reclassification from intangible assets 2.6 (1.3) 1.3Effect of movements in foreign exchange rates 0.8 9.5 10.3At 31 December 2007 18.8 119.4 138.2
Depreciation and impairment lossesAt 1 January 2007 4.8 5.5 10.3Depreciation charge for the year 2.2 22.5 24.7Disposals (5.0) (26.2) (31.2)Reclassification 0.2 (0.2) –Effect of movements in foreign exchange rates 0.3 2.6 2.9At 31 December 2007 2.5 4.2 6.7
Net book valueAt 1 January 2007 24.5 122.1 146.6At 31 December 2007 16.3 115.2 131.5

79 Carillion plcAnnual Report and Accounts 2007
11. Property, plant and equipment (continued)
Plant,Land and equipmentbuildings and vehicles Total
£m £m £m
CostAt 1 January 2006 17.1 94.3 111.4Acquisitions 12.4 14.2 26.6Additions 5.9 46.6 52.5Disposals (7.0) (19.2) (26.2)Reclassification 1.7 (1.7) –Effect of movements in foreign exchange rates (0.8) (6.6) (7.4)At 31 December 2006 29.3 127.6 156.9
Depreciation and impairment lossesAt 1 January 2006 4.3 6.2 10.5Depreciation charge for the year 1.9 18.9 20.8Impairment reversal (1.1) (1.0) (2.1)Disposals (0.8) (15.2) (16.0)Reclassification 0.9 (0.9) –Effect of movements in foreign exchange rates (0.4) (2.5) (2.9)At 31 December 2006 4.8 5.5 10.3
Net book valueAt 1 January 2006 12.8 88.1 100.9At 31 December 2006 24.5 122.1 146.6
Acquisitions in 2006 of £26.6m relate to the acquisition of Mowlem plc.
Included in the net book value of plant, equipment and vehicles is £40.9m (2006: £46.8m) in respect of assets held under finance leases and hire purchase contracts. The leased equipment secures lease obligations as disclosed in note 20.
Section
05 – Finan
cial statemen
ts

Financial statementsNotes to the consolidated financial statementscontinued
80 Carillion plcAnnual Report and Accounts 2007
12. Intangible assets
Customer Total arising Computercontracts and from business software
Goodwill lists combinations and licences Total£m £m £m £m £m
CostAt 1 January 2007 484.4 125.6 610.0 10.1 620.1Additions – – – 1.6 1.6Disposals (18.0) (3.0) (21.0) (0.1) (21.1)Reclassification to property, plant and equipment – – – (1.3) (1.3)Exchange rate changes – – – 0.1 0.1At 31 December 2007 466.4 122.6 589.0 10.4 599.4
Amortisation and impairment lossesAt 1 January 2007 – 19.3 19.3 4.7 24.0Amortisation for the year – 19.6 19.6 1.0 20.6Disposals – (0.9) (0.9) (0.1) (1.0)At 31 December 2007 – 38.0 38.0 5.6 43.6
Net book valueAt 1 January 2007 484.4 106.3 590.7 5.4 596.1At 31 December 2007 466.4 84.6 551.0 4.8 555.8
CostAt 1 January 2006 53.6 6.2 59.8 8.7 68.5Acquisitions (see note 31) 430.8 119.0 549.8 – 549.8Additions – 0.4 0.4 1.4 1.8At 31 December 2006 484.4 125.6 610.0 10.1 620.1
Amortisation and impairment lossesAt 1 January 2006 – 2.5 2.5 3.7 6.2Amortisation for the year – 16.8 16.8 1.0 17.8At 31 December 2006 – 19.3 19.3 4.7 24.0
Net book valueAt 1 January 2006 53.6 3.7 57.3 5.0 62.3At 31 December 2006 484.4 106.3 590.7 5.4 596.1
Goodwill of £430.8m and customer contracts and lists of £119.0m arose in 2006 on the acquisition of Mowlem plc as disclosed in note 31.

81 Carillion plcAnnual Report and Accounts 2007
12. Intangible assets (continued)
Impairment tests for cash-generating units containing goodwillThe following units have significant amounts of goodwill.
2007 2006
Rail Projects 12.1 12.1Citex Management Services contracts 7.0 7.0Planned Maintenance Group 34.5 34.5Regional Building 122.0 122.0Regional Civil Engineering 70.0 70.0Facilities Management 97.8 97.8Facilities Services 42.0 42.0Rail 40.0 40.0National Building 41.0 41.0Pall Mall (sold September 2007) – 18.0
466.4 484.4
In 2007, as in each year or whenever events or a change in the economic environment indicates a risk of impairment, in accordance withIAS 36, the Group has reviewed the value of goodwill balances allocated to its cash-generating units. In the absence of any identifiedimpairment risks, tests were performed based on internal valuations of each cash-generating unit.
The recoverable amount of goodwill attaching to cash-generating units is based on value in use calculations using discounted cash flows. Those calculations use cash flows based on three-year business plans and forecasts and a perpetual growth rate of five per cent (2006: five per cent) thereafter, discounted at the Group’s estimated weighted average cost of capital of 12.0 per cent (2006: 9.5 per cent).
As at 31 December 2007, based on internal valuations, Carillion plc management concluded that the recoverable value of the cashgenerating units tested exceeded their carrying amount.
Amortisation chargeThe amortisation charge of £20.6m (2006: £17.8m) is recognised in administrative expenses in the income statement. Amortisation of the intangible asset of £119.0m arising on the acquisition of Mowlem plc is in line with the expected discounted cash flows arising from the intangible asset and will be 79 per cent complete by 2016. The remaining amortisation charge is incurred over thefollowing 25 years.
Section
05 – Finan
cial statemen
ts

Financial statementsNotes to the consolidated financial statementscontinued
82 Carillion plcAnnual Report and Accounts 2007
13. Investments in jointly controlled entities
Equity Loan Totalinvestments advances investments Goodwill Total
£m £m £m £m £m
CostAt 1 January 2007 117.9 42.7 160.6 1.1 161.7Exchange rate movements 1.5 – 1.5 – 1.5Equity investments 7.7 – 7.7 – 7.7Disposals – (7.5) (7.5) (1.1) (8.6)Net loans advanced – 11.7 11.7 – 11.7At 31 December 2007 127.1 46.9 174.0 – 174.0
Share of post acquisition resultsAt 1 January 2007 18.2 – 18.2 – 18.2Share of results for the year after taxation 36.8 – 36.8 – 36.8Share of change in fair value of cash flow hedges (net of tax) (5.3) – (5.3) – (5.3)Distributions received (38.0) – (38.0) – (38.0)Disposals 0.1 – 0.1 – 0.1Other movements 0.1 – 0.1 – 0.1At 31 December 2007 11.9 – 11.9 – 11.9
Impairment lossesAt 1 January 2007 – – – 1.1 1.1Disposals – – – (1.1) (1.1)At 31 December 2007 – – – – –
Net book valueAt 1 January 2007 136.1 42.7 178.8 – 178.8At 31 December 2007 139.0 46.9 185.9 – 185.9

83 Carillion plcAnnual Report and Accounts 2007
13. Investments in jointly controlled entities (continued)Equity investments of £7.5m, includes £7.3m paid in cash relating to the acquisition of 25 per cent interests in a number of development jointly controlled entities in Canada. No goodwill arose on any of these investments. During the year, the Group disposed of a portfolio of PPP investments as disclosed in note 31.
Equity Loan Totalinvestments advances investments Goodwill Total
£m £m £m £m £m
CostAt 1 January 2006 30.9 24.8 55.7 1.1 56.8Exchange rate movements (0.6) – (0.6) – (0.6)Acquisitions (see note 31) 94.2 13.2 107.4 – 107.4Equity investments 8.8 – 8.8 – 8.8Disposals (14.7) (6.2) (20.9) – (20.9)Net loans advanced – 10.9 10.9 – 10.9Other movements (0.7) – (0.7) – (0.7)At 31 December 2006 117.9 42.7 160.6 1.1 161.7
Share of post acquisition resultsAt 1 January 2006 6.6 – 6.6 – 6.6Exchange rate movements (1.8) – (1.8) – (1.8)Share of results for the year after taxation 31.6 – 31.6 – 31.6Share of change in fair value of cash flow hedges (net of tax) 0.2 – 0.2 – 0.2Disposals (2.7) – (2.7) – (2.7)Distributions received (15.7) – (15.7) – (15.7)At 31 December 2006 18.2 – 18.2 – 18.2
Impairment lossesAt 1 January 2006 – – – 0.7 0.7Impairment charge – – – 0.4 0.4At 31 December 2006 – – – 1.1 1.1
Net book valueAt 1 January 2006 37.5 24.8 62.3 0.4 62.7At 31 December 2006 136.1 42.7 178.8 – 178.8
Section
05 – Finan
cial statemen
ts

Financial statementsNotes to the consolidated financial statementscontinued
84 Carillion plcAnnual Report and Accounts 2007
13. Investments in jointly controlled entities (continued)The Group’s aggregate share of net assets of jointly controlled entities is analysed below. Borrowings within jointly controlled entitiesamounting to £1,683.1m (2006: £1,557.1m) are without recourse to the Carillion Group.
2007 2006
PPP PPPprojects Other Total projects Other Total
£m £m £m £m £m £m
Non-current assets 202.2 11.0 213.2 64.7 7.7 72.4Cash 197.0 18.5 215.5 217.6 6.7 224.3Other current assets 1,453.9 278.4 1,732.3 1,419.9 192.1 1,612.0Share of gross assets 1,853.1 307.9 2,161.0 1,702.2 206.5 1,908.7Current borrowing (9.4) (5.6) (15.0) (32.6) (0.3) (32.9)Current liabilities (66.7) (239.1) (305.8) (61.2) (128.5) (189.7)Non-current borrowing (1,655.9) (12.2) (1,668.1) (1,496.4) (27.8) (1,524.2)Non-current liabilities (0.1) – (0.1) (0.4) (2.0) (2.4)Provisions (16.9) – (16.9) (12.0) – (12.0)Share of gross liabilities (1,749.0) (256.9) (2,005.9) (1,602.6) (158.6) (1,761.2)Share of net assets excluding derivatives 104.1 51.0 155.1 99.6 47.9 147.5Financial instrument derivatives (16.1) – (16.1) (11.4) – (11.4)Share of net assets 88.0 51.0 139.0 88.2 47.9 136.1Loan advances 46.9 – 46.9 42.7 – 42.7Total investment in jointly controlled entities 134.9 51.0 185.9 130.9 47.9 178.8
Non-current assets and other current assets within PPP projects include cumulative capitalised interest amounting to £3.8m (2006: £3.8m) and £70.5m (2006: £62.6m) respectively.
Financial instrument derivatives within PPP projects relate to interest rate swaps entered into by the jointly controlled entities concerned as a means of hedging interest rate risk and are stated net of deferred tax. In accordance with IAS 39, these derivatives are accounted for as cash flow hedges with movements in fair value each year recognised in the hedging reserve.
14. Other investments
£m
Fair valueAt 1 January 2007 15.2Additions 1.6Disposals (0.3)Exchange rate movements 0.1At 31 December 2007 16.6
Impairment lossesAt 1 January 2007 0.2Impairment charge 1.9At 31 December 2007 2.1
Net book valueAt 1 January 2007 15.0At 31 December 2007 14.5
Other investments relate to non-quoted equity instruments and are classified as available-for-sale assets and recognised at fair value.
Fair value is calculated by discounting the expected future cash flows arising from the investments at a discount rate of 12.0 per cent.
During the year an impairment charge of £1.9m has been recognised within administrative expenses in the income statement following a reassessment of fair value by the Directors.

85 Carillion plcAnnual Report and Accounts 2007
14. Other investments (continued)
£m
Fair valueAt 1 January 2006 4.7Acquisitions (see note 31) 10.0Additions 0.5At 31 December 2006 15.2
Impairment lossesAt 1 January 2006 –Impairment charge 0.2At 31 December 2006 0.2
Net book valueAt 1 January 2006 4.7At 31 December 2006 15.0
15. Deferred tax assets and liabilities
Recognised deferred tax assets and liabilitiesDeferred tax assets and liabilities are attributable to temporary differences relating to the following.
Assets Liabilities Net
2007 2006 2007 2006 2007 2006£m £m £m £m £m £m
Property, plant and equipment 3.4 4.2 – – 3.4 4.2Intangible assets – – (23.5) (31.3) (23.5) (31.3)Other investments – – (0.4) (0.4) (0.4) (0.4)Employee benefits 15.2 40.7 (4.7) (3.6) 10.5 37.1Working capital 2.3 6.4 – – 2.3 6.4Other items – – (7.0) (8.0) (7.0) (8.0)Tax value of carry forward losses recognised – 10.0 – – – 10.0Tax assets/(liabilities) 20.9 61.3 (35.6) (43.3) (14.7) 18.0Set off of tax (11.6) (5.9) 11.6 5.9 – –Net tax assets/(liabilities) 9.3 55.4 (24.0) (37.4) (14.7) 18.0
Section
05 – Finan
cial statemen
ts

Financial statementsNotes to the consolidated financial statementscontinued
86 Carillion plcAnnual Report and Accounts 2007
15. Deferred tax assets and liabilities (continued)
Unrecognised deferred tax assetsDeferred tax assets have not been recognised in respect of the following items.
2007 2006£m £m
Tax losses 65.0 63.1
The tax losses do not expire under current tax legislation. Deferred tax assets have not been recognised in respect of these losses due to the lack of certainty concerning the quantum and timing of future years’ taxable profits of the companies concerned.
Deferred tax includes a liability associated with temporary differences arising from unremitted earnings from investments in overseassubsidiaries, branches and jointly controlled entities of £7.0m (2006: £5.7m).
Movement in temporary differences during the yearBalance Recognised Recognised Balance1 Jan 07 Disposals in income in equity 31 Dec 07
£m £m £m £m £m
Property, plant and equipment 4.2 – (0.8) – 3.4Intangible assets (31.3) 0.5 7.3 – (23.5)Other investments (0.4) – – – (0.4)Employee benefits 37.1 – (17.5) (9.1) 10.5Working capital 6.4 (0.3) (3.8) – 2.3Other items (8.0) – 1.0 – (7.0)Tax value of carry forward losses recognised 10.0 – (10.0) – –Equity-settled transactions – – 0.8 (0.8) –
18.0 0.2 (23.0) (9.9) (14.7)
Balance Recognised Recognised Balance1 Jan 06 Acquisitions in income in equity 31 Dec 06
£m £m £m £m £m
Property, plant and equipment 2.2 2.9 (0.9) – 4.2Intangible assets – (35.7) 4.4 – (31.3)Other investments (0.4) – – – (0.4)Employee benefits 20.4 34.9 (7.9) (10.3) 37.1Working capital 10.7 (6.0) 1.7 – 6.4Other items (3.7) 1.8 (6.1) – (8.0)Tax value of carry forward losses recognised – 10.0 – – 10.0Equity-settled transactions – – 0.4 (0.4) –
29.2 7.9 (8.4) (10.7) 18.0
16. Inventories
2007 2006£m £m
Raw materials and consumables 13.0 12.0Development work in progress 17.5 26.5
30.5 38.5
The amount of inventories recognised as an expense during the year was £29.6m (2006: £16.9m) and the amount of any write down ofinventories recognised as an expense was £0.3m (2006: £0.4m).

87 Carillion plcAnnual Report and Accounts 2007
17. Construction contracts
Contracts in progress at the balance sheet date.2007 2006
£m £m
Due from customers for contract work 508.8 562.5Due to customers for contract work (256.9) (169.6)
The aggregate amount of costs incurred and recognised profits (less recognised losses) for all contracts in progress at the balance sheet date was £4,331.0m (2006: £2,768.6m). Advances received from customers relating to contracts in progress amounted to £169.7m (2006: £112.1m).
The amount of contract revenue recognised in the year amounted to £2,183.5m (2006: £2,021.2m).
18. Trade and other receivables
2007 2006£m £m
Trade receivables 182.6 135.6Amounts owed by customers on construction contracts 508.8 562.5Other receivables and prepayments 111.1 117.2Amounts owed by jointly controlled entities 34.1 36.0Amounts owed under jointly controlled operations 22.1 24.0
858.7 875.3
At 31 December 2007, retentions of £69.2m (2006: £67.9m) relating to construction contracts and amounts recoverable after more than one year of £35.8m (2006: £45.5m) are included above.
19. Cash and cash equivalents and net borrowing
Cash and cash equivalents and net borrowing comprise.2007 2006
£m £m
Cash and cash equivalents 327.5 144.5Bank overdrafts (3.7) (3.1)Net cash and cash equivalents 323.8 141.4Bank loans (306.6) (190.7)Finance lease obligations (48.1) (47.9)Other loans (14.0) (10.8)Net borrowing (44.9) (108.0)
Section
05 – Finan
cial statemen
ts

Financial statementsNotes to the consolidated financial statementscontinued
88 Carillion plcAnnual Report and Accounts 2007
20. BorrowingThis note provides information about the contractual terms of the Group’s interest-bearing loans and borrowings. For more informationabout the Group’s exposure to interest rate and foreign currency risk, see note 28.
2007 2006£m £m
Current liabilitiesBank overdrafts 3.7 3.1Finance lease obligations 6.5 4.9Other loans 3.7 4.6
13.9 12.6
Non-current liabilitiesBank loans 306.6 190.7Finance lease obligations 41.6 43.0Other loans 10.3 6.2
358.5 239.9Total borrowing 372.4 252.5
All bank loans and overdrafts are unsecured and bear interest at floating rates linked to London Interbank Offered Rate. Other loans andfinance lease obligations are secured on the assets to which they relate.
Finance lease liabilitiesFinance lease liabilities are payable as follows.
Minimum Minimumlease lease
payments Interest Principal payments Interest Principal2007 2007 2007 2006 2006 2006
£m £m £m £m £m £m
Less than one year 8.9 (2.4) 6.5 7.2 (2.3) 4.9Between one and five years 37.8 (6.6) 31.2 33.1 (7.6) 25.5More than five years 11.5 (1.1) 10.4 18.5 (1.0) 17.5
58.2 (10.1) 48.1 58.8 (10.9) 47.9
Under the terms of the lease agreements, no contingent rents are payable.
21. Trade and other payables
2007 2006£m £m
Trade payables 478.0 584.6Amounts owed to customers on construction contracts 256.9 169.6Other tax and social security costs 40.3 35.0Amounts owed to jointly controlled entities 21.6 46.1Amounts owed under jointly controlled operations 4.9 0.1Other creditors 98.0 89.7Accruals and deferred income 276.0 270.7
1,175.7 1,195.8

89 Carillion plcAnnual Report and Accounts 2007
22. Provisions
OnerousRestructuring leases Total
£m £m £m
Balance at 1 January 2007 0.6 5.3 5.9Provisions created 4.5 3.2 7.7Balance at 31 December 2007 5.1 8.5 13.6
Disclosed within:Current liabilities 5.1 1.8 6.9Non-current liabilities – 6.7 6.7
5.1 8.5 13.6
The restructuring provision at 1 January 2007 relates primarily to property exit costs associated with a review of the enlarged Group’srequirements following the acquisition of Mowlem plc and is expected to be utilised in the next 12 months. The restructuring provisioncreated in the year of £4.5m arises from a rationalisation of the operating structure at the end of 2007.
The onerous lease provision relates to a number of onerous leases acquired with Mowlem plc and has been increased by £3.2m in theyear in relation to the former Mowlem Head Office. The provision is expected to be utilised over a period of eight years.
OnerousRestructuring leases Total
£m £m £m
Balance at 1 January 2006 – – –Acquisitions (see Note 31) – 1.7 1.7Provisions created 0.6 3.7 4.3Provisions utilised during the year – (0.1) (0.1)Balance at 31 December 2006 0.6 5.3 5.9
23. Share capital
2007 2006£m £m
Authorised423,000,000 (2006: 423,000,000) ordinary shares of 50p each 211.5 211.5
Issued and fully paid2007 2006
Number Numbermillion £m million £m
At 1 January 281.2 140.6 214.9 107.4New share capital subscribed – – 66.3 33.2At 31 December 281.2 140.6 281.2 140.6
Section
05 – Finan
cial statemen
ts

Financial statementsNotes to the consolidated financial statementscontinued
90 Carillion plcAnnual Report and Accounts 2007
24. Reserves and statement of changes in total equity
Reconciliation of movement in reservesEquityshare-
Share Share Translation Hedging Fair value Merger Retained holders’ Minority Totalcapital premium reserve reserve reserve reserve earnings funds interests equity
£m £m £m £m £m £m £m £m £m £m
At 1 January 2007 140.6 8.6 (3.4) (9.6) 0.9 184.8 110.8 432.7 1.0 433.7Total recognised income and expense – – 0.7 (5.3) – – 97.1 92.5 2.5 95.0Share options exercised by employees – – – – – – 0.9 0.9 – 0.9Equity settled transactions (net of deferred tax) – – – – – – 2.0 2.0 – 2.0Transfer to income statement – – (0.1) – – – – (0.1) – (0.1)Transfer between reserves – – – 0.6 – (18.6) 18.0 – – –Dividends paid – – – – – – (26.4) (26.4) (2.2) (28.6)At 31 December 2007 140.6 8.6 (2.8) (14.3) 0.9 166.2 202.4 501.6 1.3 502.9
At 1 January 2006 107.4 8.2 0.7 (10.8) 0.9 8.2 34.1 148.7 1.1 149.8Total recognised income and expense – – (4.1) 0.2 – – 82.5 78.6 2.2 80.8New share capital subscribed 33.2 0.4 – – – 191.3 – 224.9 – 224.9Share options exercised by employees – – – – – – 2.8 2.8 – 2.8Equity settled transactions (net of deferred tax) – – – – – – 0.9 0.9 – 0.9Transfer between reserves – – – 1.0 – (14.7) 13.7 – – –Dividends paid – – – – – – (23.2) (23.2) (2.3) (25.5)At 31 December 2006 140.6 8.6 (3.4) (9.6) 0.9 184.8 110.8 432.7 1.0 433.7
Translation reserveThe translation reserve comprises all foreign exchange differences arising from the translation of the financial statements of foreignoperations that are not integral to the operations of the Group, as well as from the translation of liabilities that hedge the Group’s netinvestment in foreign operations. The translation reserve also includes any related current taxation.
Hedging reserveThe hedging reserve comprises the effective portion of the cumulative net change in fair value of cash flow hedging instruments related to hedged transactions that have not yet occurred, together with any related deferred taxation.
Fair value reserveThe fair value reserve includes the cumulative net change in the fair value of available-for-sale investments until the investment isderecognised, together with any related deferred taxation.
Merger reserveThe merger reserve arose on the demerger from Tarmac plc on 29 July 1999. The reserve increased on the acquisition of Mowlem plc on 23 February 2006 whereby the consideration included the issue of 66.2m Carillion shares. The Group has credited the merger reserve as permitted by The Companies Act 1985 and prior year information has been restated accordingly. The £18.6m transfer to the retained earnings reserve during the year represents the amortisation of intangible assets recognised on the Mowlem acquisition.
Retained earningsRetained earnings include the reserve for the Company’s own shares which comprises of the cost of the Company’s shares held by theCarillion Employee Share Ownership Plan (ESOP). The shares held by the ESOP may subsequently be awarded to employees under theGroup’s share incentive schemes. The movements in the reserve for own shares included within retained earnings are as follows.
2007 2006£m £m
Balance at 1 January (1.6) (4.7)Share options exercised by employees (exercise price) 0.9 2.8LTIP options exercised (transfer to retained earnings) – 0.3Balance at 31 December (0.7) (1.6)
At 31 December 2007, the ESOP held 61,909 (2006: 1,137,177) of the Company’s shares. The ESOP has elected to waive all dividendsexcept for a total payment of 1p at the time each dividend is paid.

91 Carillion plcAnnual Report and Accounts 2007
In addition to the ESOP, the Company has also established a Qualifying Employee Share Ownership Trust (‘Quest’). During the year, 2,643ordinary shares in the Company held by the QUEST were transferred to employees of the Group following the exercise of options underthe Sharesave Scheme. At 31 December 2007 the total number of shares held under the QUEST amounted to 219,763 (2006: 222,406)and had a market value of £0.8m (2006: £0.9m). The QUEST has elected to waive all dividends in excess of 0.01 pence per share.
25. Reconciliation of movements in consolidated equity shareholders’ funds
2007 2006£m £m
Recognised income and expense 92.5 78.6New share capital subscribed – 224.9Share options exercised by employees 0.9 2.8Equity-settled transactions (net of deferred tax) 2.0 0.9Transfer to income statement (0.1) –Dividends paid to equity holders of the parent (26.4) (23.2)Net addition to equity shareholders’ funds 68.9 284.0Opening equity shareholders’ funds 432.7 148.7Closing equity shareholders’ funds 501.6 432.7
26. Share-based paymentsThe Group has established a share option programme that entitles key management personnel and senior employees to purchase shares in the entity. Full details of each option scheme can be found in the Remuneration Report on pages 48 to 55.
The recognition and measurement principles in IFRS 2 have not been applied to grants of options before 7 November 2002 in accordancewith the transitional provisions in IFRS 1 and IFRS 2.
The terms and conditions of option schemes within the scope of IFRS 2 are as follows, whereby all options are settled by physical delivery of shares.
Number of Contractual life ExerciseGrant date instruments Vesting conditions of options price
ESOS option grant at 1 July 2003 384,741 Three years of service and increase 10 years 163.4pin EPS of RPI plus a minimum of 4%over a rolling three-year period
ESOS option grant at 31 March 2004 282,026 Three years of service and increase 10 years 184.9pin EPS of RPI plus a minimum of 4%over a rolling three-year period
LTIP option grant at 15 March 2005 993,975 Three years of service based on 3 years nilTotal Shareholders Return comparedto comparator group
ESOS option grant at 15 March 2005 204,076 Three years of service and increase 10 years 242.75pin EPS of RPI plus a minimum of 4%over a rolling three-year period
LEAP option grant at 6 July 2006 920,817 Three years of service and increase 3 years nilin EPS of RPI plus a minimum of 3%over a rolling three-year period
Sharesave option grant at 8 November 2006 2,167,635 Three years of service 3 years 337.5pLEAP option grant at 10 April 2007 941,246 Three years of service and increase 3 years nil
in EPS of RPI plus a minimum of 3%over a rolling three-year period
Total share options 5,894,516
In addition to the above, the Group has four ESOS option schemes which have a grant date before 7 November 2002. The total numberof options outstanding at 31 December 2007 for these schemes amounted to 1,010,733 (2006: 1,010,733) with a remaining contractuallife of either three or four years.
Section
05 – Finan
cial statemen
ts

Financial statementsNotes to the consolidated financial statementscontinued
92 Carillion plcAnnual Report and Accounts 2007
26. Share-based payments (continued)The number and weighted average exercise prices of all of the Group’s share options is as follows.
Weighted Weightedaverage Number average Number
exercise price of options exercise price of options2007 2007 2006 2006
Outstanding at the beginning of the period 169.3p 7,903,274 108.8p 7,509,018Forfeited during the period 211.0p (975,701) 88.2p (468,566)Exercised during the period 89.1p (963,570) 116.7p (2,638,456)Granted during the period – 941,246 248.7p 3,501,278Outstanding at the end of the period 151.6p 6,905,249 169.3p 7,903,274Exercisable at the end of the period 158.5p 1,677,500 158.5p 1,469,413
The range of option prices for those options exercisable at the end of the period is 125.2 – 210.7p and the weighted average remainingcontractual term for these options exercisable is four years.
The fair value of services received in return for share options granted are measured by reference to the fair value of share options granted. The estimate of the fair value of the services received is measured based on a Black-Scholes model in respect of the ESOS,Sharesave and LEAP and a TSR model in respect of LTIP using the following assumptions.
2007 2006 2006 2005 2005LEAP Sharesave LEAP LTIP ESOS
Fair value of share options and assumptionsFair value at grant date 392.0p 102.0p 295.0p 149.0p 76.0pShare price at grant date 421.0p 385.0p 319.0p 245.0p 245.0pExercise price – 337.5p – – 243.0pExpected volatility 21.97% 27.44% 28.55% 40.07% 40.05%Option life 3 years 3 years 3 years 3 years 4 yearsExpected dividend yield 2.34% 2.45% 2.58% 2.55% 2.55%Risk-free interest rate (based on national government bonds) 5.35% 5.0% 4.8% n/a 4.86%
The expected volatility is based on the historic volatility (calculated based on the weighted average remaining life of the share options),adjusted for any expected changes to future volatility due to publicly available information.
Employee expenses2007 2006
£m £m
Equity-settled share options granted in:2003 – (0.1)2004 (0.2) 0.42005 0.4 0.52006 1.0 0.52007 1.6 –Total expense recognised as employee costs 2.8 1.3
The expected life of the options is taken to be the full vesting period, as historical exercise patterns have shown this to be appropriate. The estimate of the number of shares that will eventually vest ignores the possibility that market conditions will or will not be achievedgiven that these market conditions are already included in the fair value of the options.
27. Guarantees and contingent liabilities
2007 2006£m £m
Guarantees in respect of deferred equity payments in PPP jointly controlled entities 7.8 9.8Guarantees in respect of letters of credit issued by banks in relation to deferred equity
payments in PPP jointly controlled entities 88.7 93.2Guarantees in respect of letters of credit issued by banks in relation to performance
contracts in PPP jointly controlled entities 30.0 30.0Guarantees in respect of letters of credit issued by banks in relation to pension
scheme deficit recovery payments 21.0 44.0

93 Carillion plcAnnual Report and Accounts 2007
27. Guarantees and contingent liabilities (continued)
GroupCarillion JM Limited (CJM) (formerly Mowlem) has been the subject of the Office of Fair Trading’s (OFT) on-going investigation of coverpricing in the construction industry (under The Competition Act 1988). The investigation relates to CJM’s construction business and relates entirely to periods prior to CJM’s acquisition. No other member of the Group has been subject to the investigation. CJM has been co-operating fully with the OFT. Any fine ultimately arising would be subject to the statutory maximum financial penalty of 10 per cent of world wide revenue of the undertaking concerned in the business year prior to the infringement. Group managementbelieves that it is extremely unlikely that any fine that is imposed will approach this amount. Carillion also does not believe that customers have suffered any loss or damage as a result of any actions taken by CJM.
Guarantees and counter indemnities have been given to financial institutions in respect of the provision of performance and other contract-related bonds that are issued in the normal course of business.
Claims under contracts and other agreements, including joint arrangements, are outstanding in the normal course of business.
The Group, in the normal course of its construction activities, is the subject of certain legal proceedings. The resolution of theseproceedings is regarded as unlikely to succeed or to have a material effect on the Group’s financial position.
There are no contingent liabilities of Joint Ventures for which the Group is contingently liable.
28. Financial instruments
Financial risk managementFinancial risk management is an integral part of the way the Group is managed. In the course of its business, the Group is exposedprimarily to foreign exchange risk, interest rate risk, liquidity risk and credit risk. The overall aim of the Group’s financial risk managementpolicies is to minimise potential adverse effects on financial performance and net assets.
The Group’s treasury department manages the principal financial risks within policies and operating parameters approved by the Board of Directors. Treasury is not a profit centre and does not enter into speculative transactions.
Foreign currency riskThe Group operates in a number of overseas regions, primarily Canada, the Middle East and the Caribbean. In order to protect theGroup’s balance sheet from the impact of foreign exchange rate volatility, foreign currency denominated net assets that exceed £10m equivalent are hedged, as a minimum, to at least 50 per cent of the net asset value. Net investment hedging of overseas operationsis achieved through borrowing denominated in the relevant foreign currencies or where this is not practicable in a currency which therelevant currency closely follows. Group policy is to recognise gains and losses from the effective portions of the hedges in equity and torecognise ineffective portions immediately in the income statement.
Profits arising within overseas operations are not hedged unless it is planned to make a distribution. Such distributions are then treated as currency transactions and hedged accordingly.
Primarily the Group has small and infrequent transactional foreign currency exposures. Any individual exposures that are significant arehedged using forward contracts or other appropriate risk management techniques.
A general weakening of the Canadian Dollar (specifically a one per cent rise in the Sterling:Canadian Dollar rate) would have a nil impacton reported profit and an increase of £0.1m in equity.
Interest rate riskThe Group’s interest-bearing debt is predominantly sterling borrowing that arose from the acquisition of Mowlem plc, on-going workingcapital requirements and foreign currency denominated borrowing for hedging net assets of overseas operations. Such borrowing issubject to floating rates of interest linked to London Interbank Offered Rate. No interest rate hedging is currently undertaken by theGroup’s subsidiaries. However, a number of the Group’s Public Private Partnership jointly controlled entities have entered into interest rate swaps. A one percentage point rise in respect of US Dollar denominated borrowings interest rates would increase the annual netinterest charge by approximately £0.1m, in respect of Canadian Dollar denominated borrowings an increase of £0.2m, and in respect of Sterling denominated borrowings an increase of £1.1m.
Liquidity riskThe Group’s policy on liquidity risk is to ensure that sufficient borrowing facilities are available to fund ongoing operations without theneed to carry significant net debt over the medium-term. The Group’s principal borrowing facilities are provided by a group of corerelationship banks in the form of a syndicated loan and short-term overdraft facilities. The quantum of committed borrowing facilitiesavailable to the Group is reviewed regularly and is designed to exceed forecast peak gross debt levels.
Section
05 – Finan
cial statemen
ts

28. Financial instruments (continued)
Credit riskCredit risk arises on financial instruments such as trade receivables, short-term bank deposits and foreign currency hedging. Policies andprocedures exist to ensure that customers have an appropriate credit history. Short-term bank deposits and foreign currency hedgingtransactions are executed only with highly credit-rated authorised counterparties based on ratings issued by the major rating agencies.Counterparty exposure positions are monitored regularly so that credit exposures to any one counterparty are approved at main Boardlevel or within predetermined limits.
Trade and other receivables included in the balance sheet are stated net of a bad debt provision which has been estimated bymanagement following a review of individual receivable accounts and is based on prior experience and known factors at the balance sheet date. Receivables are written off against the bad debt provision when management considers that the debt is no longer recoverable.
An analysis of the provision held against trade receivables is set out below.2007 2006
£m £m
Provision as at 1 January 11.3 11.1Increase in provision during the year 4.9 3.8Provision utilised during the year (1.7) (3.0)Provision released during the year (1.1) (0.6)Provision as at 31 December 13.4 11.3
There are £26.2m of trade receivables that are past due at the balance sheet date that have not been provided against. There are noindications as at 31 December 2007 that debtors will not meet their payment obligations in respect of the amount of trade receivablesrecognised in the balance sheet that are past due and unprovided.
Overall, the Group considers that it is not exposed to a significant amount of credit risk.
Derivative financial instruments2007 2006
Assets Liabilities Assets Liabilities£m £m £m £m
Forward foreign currency contracts – 0.7 0.8 –
In addition to the above, a number of the Group’s Private Public Partnership (PPP) jointly controlled entities have entered into interest ratederivatives as a means of hedging interest rate risk. Interest-bearing debts and the associated interest rate derivatives within these PPPjointly controlled entities are without recourse to the Group. The life of these hedge arrangements track PPP contract terms and hedgefuture movements across a range spanning up until September 2035. At 31 December 2007 the Group’s share of the total net fair valueliability of interest rate derivatives in PPP jointly controlled entities amounted to £34.5m (2006: £27.8m) of which £23.0m (2006: £13.7m) (and the related deferred tax asset of £6.9m (2006: £4.1m)) has been recognised in the hedging reserve.
Effective interest ratesThe Group’s interest bearing borrowings were subject to effective interest rates at the balance sheet date as follows.
2007 2006Range (%) Range (%)
Bank overdrafts 3.20-6.50% 4.50 to 7.25Bank loans 5.46-7.31% 5.24 to 6.36Finance lease obligations 4.00-12.49% 4.00 to 12.49Other loans 5.84-6.76% 4.20 to 6.00
Foreign currency exposureThe carrying amount of the Group’s borrowings denominated in foreign currencies is as follows.
2007 2006£m £m
United States of America Dollars 12.6 12.8Canadian Dollars 57.9 54.1Other 0.1 0.2
70.6 67.1
Of the total foreign currency borrowings of £70.6m (2006: £67.1m), the amount of borrowings used for hedging overseas currency asset amounts to £32.6m (2006: £29.9m). The foreign exchange loss of £2.7m (2006: gain of £4.1m) on translation of the borrowingsinto sterling has been recognised in the translation reserve.
Financial statementsNotes to the consolidated financial statementscontinued
94 Carillion plcAnnual Report and Accounts 2007

95 Carillion plcAnnual Report and Accounts 2007
28. Financial instruments (continued)
The carrying amount of the Group’s other financial assets and liabilities denominated in foreign currency is as follows.Financial Financial Financial Financial
assets liabilities assets liabilities2007 2007 2006 2006
Canadian Dollars 47.0 (96.9) 40.1 (87.1)Oman Rials 56.5 (59.4) 26.9 (23.5)Trinidad and Tobago Dollars 11.0 (12.8) 9.2 (9.1)South Pacific Franc – (4.3) 2.0 –Euros 142.0 (188.7) 65.3 (38.8)
Fair valuesDifferences between the carrying and fair values of the Group’s principal financial instruments are shown below.
2007 2006
Carrying Carryingvalue Fair value value Fair value
£m £m £m £m
Amounts owed by customers on contracts 508.8 507.9 562.5 550.0Finance lease obligations (48.1) (36.7) (47.9) (36.0)
Fair value is calculated by discounting future cash flows using prevailing interest rates. The finance lease payables are valued by calculatingthe present value of the future minimum lease payments. There is no material difference between the carrying value and fair value of bank loans at the balance sheet date.
Maturity of financial liabilitiesThe maturity profile of the carrying amount of the Group’s non-current borrowing is as follows.
Bank Other Financeloans loans leases Total
31 December 2007 £m £m £m £m
Between one and two years – 5.8 5.4 11.2Between two and three years – 2.8 5.6 8.4Between three and four years – 1.7 9.8 11.5Between four and five years 306.6 – 10.4 317.0More than five years – – 10.4 10.4
306.6 10.3 41.6 358.5
Bank Other Financeloans loans leases Total
31 December 2006 £m £m £m £m
Between one and two years – 3.0 7.0 10.0Between two and three years – 2.5 4.9 7.4Between three and four years 190.7 0.7 5.0 196.4Between four and five years – – 8.6 8.6More than five years – – 17.5 17.5
190.7 6.2 43.0 239.9
Within trade and other payables are £5.2m of liabilities due after more than one year which represent retentions payable on construction contracts. All other trade and other payables are due within one year.
Borrowing facilitiesThe Group has the following undrawn committed borrowing facilities available at the year end in respect of which all conditions precedent had been met.
2007 2006£m £m
Expiring between two and five years 283.4 140.1
Drawings under the committed borrowing facility include £175m required to satisfy the ‘certain funds’ requirement for the cash element of the Alfred McAlpine plc acquisition which will not be required to be paid until March 2008.
Section
05 – Finan
cial statemen
ts

Financial statementsNotes to the consolidated financial statementscontinued
96 Carillion plcAnnual Report and Accounts 2007
29. Financial and capital commitments
2007 2006£m £m
Commitments for capital expenditure in subsidiaries 1.3 0.9Commitments for equity and subordinated debt in PPP jointly controlled entities 96.5 103.0
97.8 103.9
Non-cancellable operating lease rentals are payable as follows.2007 2006
Property Other Property Other£m £m £m £m
Within one year 11.8 13.5 11.4 14.2Between one and five years 35.1 18.4 28.2 20.3Over five years 25.0 0.2 35.7 –
71.9 32.1 75.3 34.5
The Group leases properties and vehicles for operational purposes. Property leases vary considerably in length up to a maximum period of 99 years. Vehicle leases typically run for a period of 3.5 years. None of the leases includes contingent rentals.
The total future minimum sub-lease payments expected to be received under non-cancellable sub-leases amount to £4.4m (2006: £5.7m) at the balance sheet date.
30. Related parties
Identity of related partiesThe Group has a related party relationship with its jointly controlled entities and key management personnel.
Transactions with key management personnelThe Group’s key management personnel are the Executive and Non-Executive Directors as identified in the Remuneration Report on page 49.
In addition to their salaries, the Group also provides non-cash benefits to Executive Directors, and contributes to a post-employmentdefined benefit plan on their behalf. Executive Directors also participate in the Group’s share option programme.
Non-Executive Directors receive a fee for their services to the Carillion plc Board.
Full details of key management personnel compensation is given in the Remuneration Report on pages 48 to 55.
Other than disclosed in the Remuneration Report, there were no other transactions with key management personnel in either the current or preceding year. The IFRS 2 cost charged to administrative expenses relating to share options of key management personnelamounted to £1.3m (2006: £0.6m).

97 Carillion plcAnnual Report and Accounts 2007
30. Related parties (continued)
Transactions with jointly controlled entitiesThe table below summarises the principal receivable and payable balances, together with sales to the Group’s jointly controlled entities,which are in the normal course of business and on commercial terms.
2007 2006
Sales Receivables Payables Sales Receivables Payables£m £m £m £m £m £m
PPP jointly controlled entitiesAccomodation Services (Holdings) Limited – 0.2 – – 0.4 –Ellenbrook Holdings Limited 2.5 0.2 – 2.0 – –The Hospital Company (Swindon & Marlborough)
Group Limited 9.6 – – 8.9 2.5 –The Hospital Company (Oxford John Radcliffe)
Holdings Limited 16.0 0.9 – 40.2 1.4 –The Hospital Company (QAH Portsmouth) Holdings Limited 85.8 3.6 – 71.5 3.7 –Sheppey Route (Holdings) Limited – 0.2 – 18.2 0.8 –Eastbury Park (Holdings) Limited 48.4 4.7 – 21.9 – –Education 4 Ayrshire (Holdings) Limited 37.9 1.8 – 4.9 0.9 –RSP (Holdings) Limited 22.9 – – 37.4 1.5 –Aspire Defence Holdings Limited 20.0 0.1 – 86.7 – (18.9)Aspire Construction Limited – 1.0 – – – –Aspire Services Limited – 1.5 – – – –Other 3.3 0.5 – 6.0 0.6 –
246.4 14.7 – 297.7 11.8 (18.9)
Other jointly controlled entitiesCR Thanet Limited Partnership – 14.3 (20.6) – 12.6 (11.9)Modern Housing Solutions (Prime) Limited 12.6 0.6 – 18.3 0.1 –Carillion Enterprise Limited 62.4 1.5 – 5.2 4.9 –Eurailscout GB Limited – 0.5 – – 0.7 –Wyseproperty Limited 0.2 0.6 – – – (14.7)Urban Catalyst LLP – – – – 5.4 –Others – 1.9 (1.0) 0.2 0.5 (0.6)
321.6 34.1 (21.6) 321.4 36.0 (46.1)
31. Acquisitions and disposals
Acquisitions in 2007There have not been any business acquisitions during 2007.
Acquisitions in 2006On 23 February 2006, the Company acquired the entire issued share capital of Mowlem plc for total consideration of £350.3m. Mowlem plc, its subsidiaries and jointly controlled entities operate in a number of sectors and industries, particularly construction, facilities management and Public Private Partnerships. In the period from acquisition to 31 December 2006, Mowlem plc contributed profit before tax of £16.0m to the consolidated profit for the year. If the acquisition had occurred on 1 January 2006, Group revenuewould have been £3,314.2m and profit before tax would have been £59.9m for the year ended 31 December 2006.
Effect of acquisitionsThe acquisitions had the following effect on the Group’s assets and liabilities. Sectio
n 05 – Fin
ancial statem
ents

Financial statementsNotes to the consolidated financial statementscontinued
98 Carillion plcAnnual Report and Accounts 2007
31. Acquisitions and disposals (continued)
Acquiree’s net assets at the acquisition dateAccounting
Carrying Fair value policy Recognisedamounts adjustments adjustments values
£m £m £m £m
Property, plant and equipment 25.9 0.7 – 26.6Intangible assets – 119.0 – 119.0Investments in jointly controlled entities 20.5 95.7 (8.8) 107.4Other investments 15.0 (5.0) – 10.0Deferred tax assets 30.9 6.4 6.3 43.6Inventories 17.9 (0.7) – 17.2Trade and other receivables 461.1 (26.4) – 434.7Assets held for sale 76.3 56.9 – 133.2Cash and cash equivalents 11.6 (8.1) – 3.5Borrowing (126.4) 0.4 – (126.0)Trade and other payables (560.2) 15.8 2.9 (541.5)Income tax (4.2) 6.3 – 2.1Retirement benefit liabilities (95.5) – (21.0) (116.5)Deferred tax liabilities – (35.7) – (35.7)Liabilities held for sale (125.9) (30.5) – (156.4)Provisions (1.7) – – (1.7)Net identifiable assets and liabilities (254.7) 194.8 (20.6) (80.5)Goodwill recognised on acquisition 430.8Consideration 350.3
The fair value adjustments made at acquisition relate to
• the recognition of an intangible asset in relation to customer contracts and lists acquired• market value adjustments to the carrying value of investments in PPP jointly controlled entities and other investments• the reclassification of Edgar Allen Limited and Charter Builders Ltd as available-for-sale assets and liabilities and the subsequent
adjustment to their net realisable value following the decision to dispose of the business post acquisition• the recognition of a deferred tax asset on a proportion of corporation tax trading losses• the recognition of a deferred tax liability on the future amortisation of the intangible assets acquired• reassessment of the recoverability of trade and other receivables
The accounting policy adjustments made relate to
• the reversal of the fair value uplift to finance debtors within PPP jointly controlled entities• the recognition of the full defined benefit pension scheme deficits on balance sheet following the reversal of the corridor approach
to the recognition of actuarial gains and losses• a realignment of the treatment of investment-related bid cost recoveries at financial close on PPP projects
Consideration for the acquisition comprises the following:£m
Cash 117.3Equity shares issued 224.5Attributable costs 8.5
350.3
The value of equity shares issued is based on the quoted mid-market price of Carillion plc shares at the close of business on the daypreceding the effective date of acquisition of 339p and the total number of equity shares issued of 66.2m. Attributable costs includedirect adviser costs incurred in relation to the acquisition contracts and due diligence procedures. Cash flows associated with theacquisition are included in the cash flow statement as follows.
£m
Cash paid (117.3)Attributable costs paid (8.5)
(125.8)Cash and cash equivalents acquired 3.5Net cash outflow on acquisition (122.3)

99 Carillion plcAnnual Report and Accounts 2007
31. Acquisitions and disposals (continued)
Disposals in 2007During the year, the Group disposed of certain non-core businesses which have been classified as discontinued operations. The effect on the Group of the disposal of these businesses is disclosed in note 8. In addition, in September 2007 the Group disposed of SovereignHarbour Marina Limited, generating cash consideration of £10.7m and a non-operating profit of £3.7m.
In December 2007, the Group disposed of equity investments in three Public Private Partnership jointly controlled entities. The disposal generated cash consideration of £21.5m (after deducting disposal costs of £50,000) and a non-operating profit of £23.6m.
Disposals in 2006During the acquisition of Mowlem plc, certain businesses were identified as being non-core operations for disposal. In addition, there were a number of businesses which had been identified as available for sale by Mowlem plc prior to acquisition.
In the post-acquisition period the Group disposed of the following Mowlem plc businesses:
Edgar Allen LimitedCharter Builders LtdMowlem Environmental Sciences GroupBarclay Mowlem LimitedCarillion Energy Limited (formerly Mowlem Energy Limited)Carillion Utility Services Limited (formerly Mowlem Utility Services Limited)
These businesses were included in the acquisition balance sheet of Mowlem plc as assets and liabilities held for sale and were thereforecarried at fair value, which represents proceeds on disposal less costs to sell. These fair values were realised on subsequent disposal andconsequently no profit or loss has arisen.
The cash effect has been reflected in the Group cash flow statement as follows.£m
Consideration received (net of disposal costs paid) 53.5Cash in businesses disposed of (23.1)Net cash inflow from disposal of businesses 30.4
In September 2006, the Group disposed of a portfolio of equity investments in Public Private Partnership jointly controlled entities. The disposal generated cash consideration of £46.7m (after deducting disposal costs of £0.4m) and a non-operating profit of £25.6m. The Group also disposed of equity interests in two small non-PPP jointly controlled entities for a total consideration of £0.6m, generating a profit of £0.4m.
32. Retirement benefit obligations
Carillion operates a number of pension schemes for eligible employees as disclosed below.
Principal defined benefit schemes
Carillion Staff and ‘B’ Pension SchemesBoth schemes are defined benefit schemes and were closed to new entrants on 1 April 2003. Existing members continue to accruebenefits for future service.
An actuarial valuation of the Staff and ‘B’ schemes was undertaken by the Trustees’ independent actuaries as at 31 December 2005 usingthe projected unit credit method. The market value of the schemes’ assets at the date were £485.0m and £106.4m respectively, whichrepresented approximately 90 per cent and 94 per cent of the benefits that had accrued to members at that date on an ongoing basis,after allowing for future increases in salaries. The regular on-going contributions paid during the year were £10.7m (2006: £10.8m) inrespect of the Carillion Staff Pension Scheme and £1.0m (2006: £1.4m) in respect of the Carillion ‘B’ Pension Scheme.
As part of the deficit recovery plan agreed with the Trustees of the Staff and ‘B’ schemes, payments were made to the schemes during2007 of £18.0m (2006 £15.0m) and £2.0m (2006: £2.0m) respectively. Further payments are due to the Staff and ‘B’ schemes in 2008 of £16.0m and £2.0m respectively. These payments are secured by a Letter of Credit to the Trustees. Recovery payments of £1.9m and £0.2m per annum to the Staff and ‘B’ schemes, respectively are scheduled to commence from March 2010 and cease at the end of 2015. The next actuarial valuations are normally due at 31 December 2008.
Section
05 – Finan
cial statemen
ts

Financial statementsNotes to the consolidated financial statementscontinued
100 Carillion plcAnnual Report and Accounts 2007
32. Retirement benefit obligations (continued)
The Group expects to pay regular ongoing contributions of approximately £10.7m to the Staff scheme and £1.0m to the ‘B’ scheme during 2008 representing contribution rates of 20.1 per cent and 36.5 per cent of payroll respectively.
The Pension Protection Fund (PPF) levy is payable in addition to the above. The PPF levies for the year ended 31 March 2007 were £0.3m (2006: £0.4m) for the Staff scheme and £0.2m (2006: nil) for the ‘B’ scheme.
Mowlem Staff Pension and Life Assurance and Mowlem (1993) Pension SchemesThe Mowlem Staff Pension and Life Assurance and Mowlem (1993) Pension schemes were part of Mowlem plc, which was acquired on 23 February 2006.
The majority of employees who participate in these schemes are in defined benefit arrangements. The defined benefit section of theMowlem Staff Pension and Life Assurance Scheme closed to new entrants on 1 January 2003.
A defined contribution section was opened for new employees from 1 April 2003. Existing final salary members could opt to continue on that basis from 1 April 2003 if they agreed to pay a higher member contribution or could pay the same rate and accrue benefits on a Career Average Revalued Earnings (CARE) basis from that date.
An actuarial valuation of the Mowlem Staff scheme was undertaken by independent actuaries as at 31 December 2006 using the attained age method. The market value of the schemes assets at that date were £459.6m, representing approximately 93 per cent of the benefits that had accrued to members at that date on an ongoing basis, after allowing for future increases in salaries. An actuarialvaluation of the Mowlem (1993) scheme was undertaken by independent actuary as at 31 December 2004 using the attained agemethod. The market value of the schemes assets at that date were £30.3m, representing approximately 71 per cent of the benefits that had accrued to members at that date on an ongoing basis, after allowing for future increases in salaries.
The regular ongoing contributions paid during the year were £7.1m (2006: £7.7m) in respect of the Mowlem Staff scheme and £2.5m (2006: £1.9m) in respect of the Mowlem (1993) scheme.
As part of the deficit recovery plan agreed with the Trustees, payments were made to the Mowlem Staff and Mowlem (1993) schemes in the year of £11.4m (2006: £9.5m) and £1.6m (2006: £1.3m) respectively. Recovery payments of £4.8m per annum have been agreed in respect of the Mowlem Staff scheme continuing until 2012 and £1.6m per annum in respect of the Mowlem (1993) scheme continuinguntil 2016.
The Group expects to pay regular ongoing contributions of approximately 20.3 per cent and 28.2 per cent to the Mowlem Staff andMowlem (1993) schemes during 2008. An actuarial valuation of the Mowlem (1993) scheme by the Trustees’ independent actuaries as at 31 December 2007 is currently being undertaken.
The Pension Protection Fund (PPF) levy is payable in addition to the funding plan. The PPF levies for the year ended 31 March 2007 were £1.9m (2006: £0.5m) for the Mowlem Staff scheme and £0.3m (2006: £0.25m) for the Mowlem (1993) scheme.
Carillion Public Sector Pension SchemesThe scheme is a defined benefit scheme. The Scheme remains open to eligible employees transferring from the public sector as part of thecommercial obligations under Private Finance Initiative, Public Private Partnership and Best Value contracts with public sector employers.
An actuarial valuation of the scheme was undertaken by the Trustees’ independent actuaries as at 31 December 2004 using the attained age method. The market value of the schemes’ assets at that date was £74.9m, which represented approximately 82 per cent of the benefits that had accrued to members at that date on an ongoing basis, after allowing for future increases in salaries. The regularongoing employer contributions paid during the year were £3.1m (2006: £2.7m).
As part of the deficit recovery plan agreed with the Trustees, additional payments of £4.3m (2006: £2.0m) were made during 2007. Further payments of £2.3m per annum are scheduled to be paid until 2015.
The Group expects to pay regular contributions of approximately £2.9m during 2008 representing 23.2 per cent of pensionable salaries at the end of 2007.
If any employees are admitted into the Scheme through PFI, PPP or Best Value contracts during 2008 the level of contributions willincrease. An actuarial valuation of the scheme by the Trustees’ independent actuaries as at 31 December 2007 is currently beingundertaken.

101 Carillion plcAnnual Report and Accounts 2007
32. Retirement benefit obligations (continued)
The Pension Protection Fund (PPF) levy is payable in addition to the funding plan. The PPF levy for the year ended 31 March 2007 was £0.1m (2006: £0.1m).
Shared Cost Sections of the Railways Pension Scheme (RPS)Employees of GTRM and Centrac, and former employees of British Rail transferred to these businesses, have pension provision via SharedCost Sections of the Railways Pension Scheme. Both the GTRM and Centrac Sections are closed to new entrants.
Shared cost arrangements are such that the employer and members share the cost of future service liabilities on a 60/40 split respectivelyand any surplus or deficit emerging over time is dealt with on a similar basis.
Independent actuaries appointed by the Railways Pension Trustee Company Limited carried out a formal valuation of the Railways PensionScheme at 31 December 2004 using the attained age method for GTRM and the attained age method for Centrac. The market values of the scheme assets of the GTRM Section and Centrac Section at 31 December 2004 were £195.4m and £27.4m respectively, whichrepresented approximately 94 per cent and 102 per cent of benefits that had accrued to members at that date on an ongoing basis, after taking account of future increases in salaries, contributions payable and reserves. The regular ongoing contributions paid by theemployer during the year were £3.1m (2006: £3.9m) for GTRM and £0.3m (2006: £0.3m) for Centrac.
As part of the deficit recovery plan agreed with the Trustees, a payment of £2.0m (2006: £2.0m) was made during 2007 to the GTRMsector. A further payment of £2.0m is due in January 2008.
The Group expects to pay regular on-going contributions in 2008 for both sections representing 16.02 per cent and 16.56 per cent ofpensionable salaries for GTRM and Centrac respectively. An actuarial valuation of the scheme by the Trustees’ independent actuaries as at 31 December 2007 is currently being undertaken.
The Pension Protection Fund (PPF) levy is payable in addition to the funding plan. The PPF levy for the year ended 31 March 2007 for both sections totalled £0.1m (2006: £0.1m).
Other defined benefit schemesThe PME Staff Pension and Life Assurance SchemeThe PME Staff Pension Scheme is a defined benefit scheme and is closed to new entrants. Existing members continue to accrue benefitsfor future service.
An actuarial valuation of the scheme was undertaken by the Trustee’s independent actuaries as at 31 December 2006 using the attained age method. The market value of the scheme’s assets at that date was £49.7m, which represented approximately 92 per cent of the benefits that had accrued to members at that date on an ongoing basis, after allowing for future increases in salaries. The regularongoing contributions paid during the year were £1.1m (2006: £1.2m).
As part of the deficit recovery plan agreed with the Trustees, a payment of £1.0m (2006: £1.0m) was made during 2007.
The Group expects to pay regular ongoing contributions in 2008 representing 22.7 per cent of pensionable salaries with a lump sum of £1.0m in addition. The next actuarial valuation is due at 31 December 2009.
The Pension Protection Fund (PPF) levy is payable in addition to the funding plan and was £0.1m for the year ended 31 March 2007 (2006: £0.02m).
Carillion Canada IncThe Carillion Group operates a defined benefit scheme for employees of Carillion Canada Inc managed locally. In addition supplemental arrangements are in place for certain executives, namely the Senior Executive Retirement Plan and the Post Retirement Benefit Plan. The net deficit in total for these three schemes at 31 December 2007, calculated in accordance with IAS 19, is £2.3m (2006: £0.5m surplus).
Contributions during the year were £nil (2006: £nil) in respect of the Carillion Canada Inc defined benefit scheme and £0.2m (2006: £0.2m) in respect of other post-retirement benefits for senior Canadian employees. Contributions for 2008 are estimated to be £0.2m.
Bower Group Retirement Benefit SchemeThe Bower Group Retirement Benefit Scheme was part of Mowlem plc, which was acquired on 23 February 2006. The scheme is a defined benefit arrangement and is closed to future accrual.
Section
05 – Finan
cial statemen
ts

Financial statementsNotes to the consolidated financial statementscontinued
102 Carillion plcAnnual Report and Accounts 2007
32. Retirement benefit obligations (continued)
An actuarial valuation of the scheme was undertaken by independent actuaries as at 29 February 2004. The deficit in the scheme at 31 December 2007 calculated in accordance with IAS 19 is £0.3m (2006: £2.1m). The Group has not made any regular ongoingcontributions to the scheme in the year. As part of the deficit recovery plan agreed with the Trustees, £0.3m was paid to the scheme in February 2007. An actuarial valuation of the scheme by the Trustees’ independent actuaries as at 31 December 2007 is currently being undertaken.
Other UK and overseas schemesThe Group operates four UK defined contribution schemes, the Carillion Pension Plan, the Mowlem Staff Scheme (defined contributionsection), the PME Defined Contribution Plan and the Carillion Retirement Plan (closed to new entrants since 2001). In addition, the Group operates a Stakeholder Plan (‘Stakeholder Plus’).
The Carillion Pension Plan commenced on 1 April 2003. The majority of new employees across the Group are eligible to join this Plan. Employees contribute a minimum of 5.0 per cent and the employer a minimum of 7.0 per cent of basic salaries. Up to 3.0 per centof any additional voluntary contributions paid by employees is matched by the employer, resulting in a maximum employer contribution of10.0 per cent of basic salary. The employer meets the cost of administration and managing the Plan equivalent to a further 2.0 per cent of basic pay. Contributions during the year were £2.2m (2006: £2.0m).
The defined contribution section of the Mowlem Staff Scheme commenced on 1 April 2003. The plan is principally only open to lateentrants on application. Employees contribute between 3.0 per cent and 5.0 per cent depending on their age and the employer between4.5 per cent and 8.0 per cent. The employer meets the cost of the administration and managing the Plan in addition to the cost of the lifeassurance premiums. Contributions during the year were £1.3m (2006: £1.5m).
Employees of Carillion Services Limited who are not eligible for the Carillion Pension Plan are invited to participate in the CarillionStakeholder Plus managed by BlackRock Pensions Limited. Employees contribute 5.0 per cent and the employer 6.5 per cent of basicsalary. Death in service lump sum benefits are provided in addition. Contributions during the year were £0.3m (2006: £0.5m).
The PME Defined Contribution Plan commenced in April 1999. All new PME employees are offered membership of the Plan. Employeescontribute 4.0 per cent of basic pay and the employer pays 5.0 per cent of basic pay (inclusive of a 1.0 per cent allowance for insurancepremiums and audit fees). Contributions during the year were £1.3m (2006: £1.2m).
Contributions to the Carillion Retirement Plan during the year were £0.1m (2006: £0.1m).
Stakeholder pensions are also provided by B&CE Insurance and Scottish Widows where required by Working Rule Agreements and defined contribution pensions provided where required by the Joint Industries Board Working Rules Agreements.
Various companies within the Group participate in admission agreements with local authorities in order to allow former public sectoremployees to continue membership of the Local Government Pension Scheme. Contributions during the year, which have been accounted for on a defined contribution basis, were £0.2m (2006: £0.2m).
IAS 19 disclosuresThe weighted average of the principal assumptions used by the independent qualified actuaries in providing the IAS 19 position were.
31 December 2007 31 December 2006UK Canada UK Canada
Rate of increase in salaries 4.90% 3.20% 4.25% 3.00%Rate of increase in pensions 3.40%(1) 2.20% 3.00% 2.00%Inflation rate 3.40% 2.20% 3.00% 2.00%Discount rate 5.60% 5.55% 5.00% 5.20%
(1) Where schemes have adopted the new 2.5 per cent per annum cap on increases to pensions in payment, the assumption is 2.4 per cent per annum (2006: 1.9 per cent) rather than the higher amountshown above.
The market values of the schemes’ assets, which are not intended to be realised in the short term, may be subject to significant changebefore they are realised. The present values of the schemes’ liabilities are calculated by reference to the investment return on Grade AAcorporate bonds. The assumptions used do not necessarily represent the investment return that may be achieved.
For all schemes the mortality basis is in line with the basis used by the respective Trustee at the last valuation. All the schemes, except the Railways Pension Scheme, have adopted a basis using the medium cohort tables on the recommendation of the Scheme Actuary. The Railways Pension Scheme uses scheme specific assumptions based on industry experience.

103 Carillion plcAnnual Report and Accounts 2007
32. Retirement benefit obligations (continued)
The Carillion Staff Scheme, the Carillion Public Sector Scheme, the Mowlem Staff Scheme and the Mowlem (1993) Scheme adopted the ‘PA92(YOB=1965)mc + 2 years’ table for non-retired member’s mortality and the ‘PA92(YOB=1935)mc + 2 years’ for retired members’ mortality at the last valuation. The previous bases were ‘PA92(Base) – 3 years’ and ‘PA92(Base) – 1 year’ respectively.
The life expectancies for a male aged 65 are shown below.2007 2006
PA92(YOB=1965)mc + 2 yrs PA92(YOB=1965)mc + 2 yearsNon-retired members 21.3 years 21.3 years
PA92(YOB=1935)mc + 2 yrs PA92(YOB=1935)mc + 2 yearsRetired members 19.7 years 19.7 years
The Canadian Actuary annually undertakes an actuarial valuation and accounting exercise for reporting on local employee benefits under local GAAP, CICA 3461. The same assumptions have been used for local medical and dental inflation rates in relation to the PostRetirement Benefit Plan. The immediate trend rate is 10 per cent per annum with an ultimate trend rate of five per cent per annum (2013).
An increase of one per cent in the valuation trend would increase liabilities by £0.6m and the total service cost by £0.1m. The decrease of one per cent in the valuation trend would reduce liabilities by £0.5m and total service cost by nil.
The overall expected rate of return on assets is determined by reference to local long-term interest rates, the yield on gilts or Treasury stock and the Actuary’s recommendation on the allowance for the potential long-term extra return from investing in equities.
Carillion has adopted immediate recognition of any actuarial gains or losses through the Statement of Recognised Income and Expense as permitted under IAS 19.
The IAS 19 position for the schemes is as follows.Expected
rate of Carillion Mowlem Mowlem Public Railways Otherreturn % Staff Staff ‘B’ (1993) Sector Pension Schemes Total
31 December 2007 UK Canada £m £m £m £m £m £m £m £m
Equities 7.65 7.00 226.1 298.4 32.5 30.6 63.5 118.6 45.0 814.7Government bonds 4.40 4.50 249.6 25.5 60.1 5.7 20.5 21.6 25.0 408.0Corporate bonds 5.60 – 82.4 148.8 16.6 15.4 19.1 22.9 6.3 311.5Other 5.50 2.50 5.1 5.2 1.1 0.7 2.0 18.8 1.9 34.8Market value of scheme assets 563.2 477.9 110.3 52.4 105.1 181.9 78.2 1,569.0Present value of funded scheme obligation (566.4) (490.4) (117.4) (61.9) (106.1) (166.2) (77.0) (1,585.4)Present value of unfunded scheme obligation – – – – – – (5.9) (5.9)Restriction on surplus recognised – – – – – (2.0) – (2.0)Total (deficit)/surplus (3.2) (12.5) (7.1) (9.5) (1.0) 13.7 (4.7) (24.3)Related deferred tax asset 10.5Net pension liability (13.8)
Expectedrate of Carillion Mowlem Mowlem Public Railways Other
return % Staff Staff ‘B’ (1993) Sector Pension Schemes Total31 December 2006 UK Canada £m £m £m £m £m £m £m £m
Equities 6.65 7.00 219.5 339.8 34.7 36.8 61.5 102.4 40.6 835.3Government bonds 4.15 4.00 219.5 23.0 56.3 2.3 18.5 45.3 22.6 387.5Corporate bonds 4.78 5.00 78.4 91.8 16.2 2.3 15.2 – 6.8 210.7Other 4.78 2.50 5.1 4.6 1.1 4.6 0.9 24.2 2.1 42.6Market value of scheme assets 522.5 459.2 108.3 46.0 96.1 171.9 72.1 1,476.1Present value of funded scheme obligation (560.4) (505.5) (117.1) (59.3) (103.9) (166.4) (73.4) (1,586.0)Present value of unfunded scheme obligation – – – – – – (3.0) (3.0)Total (deficit)/surplus (37.9) (46.3) (8.8) (13.3) (7.8) 5.5 (4.3) (112.9)Related deferred tax asset 37.1Net pension liability (75.8)
Section
05 – Finan
cial statemen
ts

Financial statementsNotes to the consolidated financial statementscontinued
104 Carillion plcAnnual Report and Accounts 2007
32. Retirement benefit obligations (continued)
Expense recognised in the Income Statement2007 2006
£m £m
(Charge)/credit to operating profitCurrent service cost relating to defined benefit schemes (27.2) (29.1)Past service cost relating to defined benefit schemes (0.4) (0.5)Settlements 0.7 –Curtailments 3.0 –Total (23.9) (29.6)
Credit/(charge) to other financial incomeExpected return on pension scheme assets 86.1 71.7Interest cost on pension scheme liabilities (79.3) (68.2)Net financial return 6.8 3.5
Total actuarial gains and losses recognised in the Statement of Recognised Income and Expense 30.2 34.6
2007 2006£m £m
Changes in defined benefit obligationObligation at 1 January (1,589.0) (963.7)Current service cost (27.2) (29.1)Interest cost (79.3) (68.2)Contributions from scheme members (8.2) (8.5)Past service cost (0.4) (0.5)Acquisition of Mowlem plc – (583.2)Benefits paid 59.0 49.3Settlements 6.3 –Curtailments 3.0 –Actuarial gains and losses 47.2 12.8Effect of exchange rate changes (2.7) 2.1Obligation at 31 December (1,591.3) (1,589.0)
2007 2006£m £m
Changes in the fair value of scheme assetsFair value at 1 January 1,476.1 895.8Expected return on scheme assets 86.1 71.7Contributions from the employer 75.7 63.0Contributions from scheme members 8.2 8.5Acquisition of Mowlem plc – 466.7Benefits paid (59.0) (49.3)Settlements (5.6) –Actuarial gains and losses (15.0) 21.8Restriction on surplus recognised (2.0) –Effect of exchange rate changes 2.5 (2.1)Fair value at 31 December 1,567.0 1,476.1

105 Carillion plcAnnual Report and Accounts 2007
32. Retirement benefit obligations (continued)
The amount included in the balance sheet in respect of defined benefit schemes is as follows.2007 2006
£m £m
Present value of defined benefit obligation (1,591.3) (1,589.0)Fair value of scheme assets 1,567.0 1,476.1Net deficit (24.3) (112.9)
Schemes in surplus (within non-current assets) 17.3 10.9Schemes in deficit (within non-current liabilities) (41.6) (123.8)
(24.3) (112.9)
The actual return on plan assets was £71.1m (2006: £93.5m).
History of experience gains and losses2007 2006 2005 2004 2003
£m £m £m £m £m
Present value of the defined benefit obligation (1,591.3) (1,589.0) (963.7) (862.0) (832.0)Fair value of scheme assets 1,567.0 1,476.1 895.8 776.8 722.6Net deficit (24.3) (112.9) (67.9) (85.2) (109.4)
Experience gains and losses on scheme obligation (£m) 47.2 12.8 (198.8) (1.7) (0.2)Percentage of defined benefit obligation (%) 30.0 1.0 21.0 – –Difference between expected and actual returns
on scheme assets (£m) (15.0) 21.8 205.5 28.0 66.3Percentage of scheme assets (%) (1.0) 1.0 23.0 3.0 9.0
The cumulative amount of actuarial gains and losses recognised since 1 January 2004 in the Group Statement of Recognised Income and Expense is £97.8m (2006: £67.6m). The Group is unable to determine how much of the pension scheme deficit recognised ontransition to IFRS of £85.2m and taken directly to total equity is attributable to actuarial gains and losses since inception of the schemes.Therefore, the Group is unable to determine the amount of actuarial gains and losses that would have been recognised in the GroupStatement of Recognised Income and Expense before 1 January 2004.
Section
05 – Finan
cial statemen
ts

Financial statementsNotes to the consolidated financial statementscontinued
106 Carillion plcAnnual Report and Accounts 2007
33. Accounting estimates and judgementsManagement has discussed with the Audit Committee the development, selection and disclosure of the Group’s critical accounting policies and estimates and the application of these policies and estimates.
The key assumptions concerning the future and other key sources of estimation uncertainty at the balance sheet date, that have asignificant risk of causing a material adjustment to the carrying amounts of assets and liabilities within the next financial year, arediscussed below:
Construction contractsIn determining the revenue and costs to be recognised each year for work done on construction contracts, estimates are made in relation to final out-turn on each contract. On major construction contracts, it is assessed, based on past experience, that their outcomecannot be estimated reliably during the early stages of the contract, but that costs incurred will be recoverable. Once the outcome can be estimated reliably the estimates of final out-turn on each contract may include cost contingencies to take account of the specific risks within each contract that have been identified during the early stages of the contract. The cost contingencies are reviewed on a regularbasis throughout the contract life and are adjusted where appropriate. However, the nature of the risks on contracts are such that theyoften cannot be resolved until the end of the project and therefore may not reverse until the end of the project. Management continuallyreviews estimated final out-turn on contracts and makes adjustments where necessary.
Intangible assetsIn determining the fair value of identifiable assets, liabilities and contingent liabilities of businesses acquired, judgement is required in relation to final out-turn on construction contracts, discount rates and expected future cash flows and profitability.
Determining whether intangible assets are impaired requires an estimation of the future cash flows expected to arise from the cash-generating unit to which the intangible assets are attached. Note 12 provides details of the carrying value of intangible assets.
Defined benefit pension scheme valuationsIn determining the valuation of defined benefit pension scheme assets and liabilities, a number of key assumptions have been made. The key assumptions, which are given below, are largely dependent on factors outside the control of the Group:
• Expected return on plan assets• Inflation rate• Mortality• Discount rate• Salary and pensions increases
Details of the assumptions used are included in note 32.
34. Post-balance sheet eventsOn 12 February 2008, the Company acquired 100 per cent of the issued share capital of Alfred McAlpine plc for a total consideration of £554.5m. The total consideration was satisfied by the issue of 112.9m Carillion plc shares valued at the quoted mid-market price at the close of business on the day preceding the effective date of acquisition of 337.75p and £171.7m in cash and £1.3m of loan notes. In addition, attributable costs are estimated to be £9.2m. The acquisition has had no impact on reported profit during 2007. Due to theshort period of time that Alfred McAlpine plc has been within the Group’s ownership prior to the approval of these financial statements, it has not been possible to determine the fair value of the business acquired. The fair value will be determined prior to the announcementof the 2008 interim results and full disclosure will be made in the 2008 interim financial statements.
35. Principal subsidiaries, jointly controlled entities and jointly controlled operations A list of significant investments in subsidiaries, jointly controlled entities and jointly controlled operations, including the name, country of incorporation and proportion of ownership interest is given on page 107.

107 Carillion plcAnnual Report and Accounts 2007
35. Principal subsidiaries, jointly controlled entities and jointly controlled operations (continued)Except where shown, all subsidiary undertakings and jointly controlled entities are incorporated in Great Britain and operate in the UK. All holdings are of ordinary shares and except where shown, all subsidiary undertakings are 100 per cent owned (with equivalent votingrights) and jointly controlled entities and jointly controlled operations are 50 per cent owned. Shares of those undertakings marked withan asterisk are directly owned by Carillion plc.
Principal subsidiary undertakings Nature of businessAsprea Ltd Insurance claim handlingCarillion (Aspire Construction) Holdings No. 2 Ltd Military accommodation at Aldershot and Salisbury PlainCarillion Canada Inc (Canada) Construction and infrastructure servicesCarillion (Caribbean) Ltd (Trinidad & Tobago) Construction and infrastructure servicesCarillion CR Limited Holding company for property developmentCarillion Construction Ltd* Construction and infrastructure managementCarillion Fleet Management Ltd* Supply and maintenance of vehiclesCarillion Highway Maintenance Ltd* Roads and ground maintenance and repairCarillion JM Ltd* Construction and infrastructure managementCarillion Private Finance Ltd* Holding company for PPP project companiesCarillion Services Ltd* Facilities managementCarillion Services 2006 Ltd Facilities managementMonteray Ltd 51% Property and facilities management servicesPlanned Maintenance Engineering Ltd Building services and maintenancePostworth Ltd* Supply of operatives to the construction industrySovereign Hospital Services Ltd Facilities management in healthcare sector
Principal jointly controlled entities Public Private Partnerships Associated ProjectAccommodation Services (Holdings) Ltd 40% GCHQ, CheltenhamAspire Defence Holdings Ltd Military accommodation at Aldershot and Salisbury PlainEastbury Park (Holdings) Ltd Permanent Joint Headquarters, NorthwoodEducation 4 Ayrshire (Holdings) Ltd 47.5% South Ayrshire SchoolsEllenbrook Holdings Ltd University of Hertfordshire Student AccommodationEndeavour SCH Holdings Ltd 19% James Cook Hospital, MiddlesbroughInspiredspaces StaG (Holdings 1) Ltd 40% South Tyneside and Gateshead SchoolsLCED (Sault) Limited Partnership 25% Sault Area Hospital, CanadaModern Schools (Barnsley) Holdings Ltd Barnsley SchoolsModern Schools (Exeter) Holdings Ltd Exeter SchoolsModern Schools (Redcar & Cleveland Holdings) Ltd Redcar and Cleveland SchoolsRavensbourne Health Services (Holdings) Ltd University Hospital, LewishamRSP (Holdings) Ltd 30% Renfrewshire SchoolsSheppey Route (Holdings) Ltd A249 KentThe Healthcare Infrastructure Company of Canada (ROH) Inc (Canada) Royal Ottawa Hospital, CanadaThe Healthcare Infrastructure Company of Canada (WOHC) Inc (Canada) William Osler Hospital, CanadaThe Hospital Company (Oxford John Radcliffe) Holdings Ltd John Radcliffe Hospital, OxfordThe Hospital Company (QAH Portsmouth) Holdings Ltd Queen Alexandra Hospital, PortsmouthUK Highways A55 (Holdings) Ltd A55 North WalesYorkshire Transformations Holdings Ltd 33.3% Swarcliffe social housing, Leeds
Others Nature of businessCarillionEnterprise Ltd 50.1% MoD buildingsModern Housing Solutions (Prime) Ltd MoD housingAl Futtaim Carillion LLC (UAE) 49% Building and civil engineering Arcadis Aqumen Facility Management BV Facilities managementCarillion Alawi LLC (Oman) 49% Building and civil engineering Carillion Richardson Partnership Property developmentCarillion Richardson Thanet Ltd Property developmentEmrill Services LLC (UAE)* 33% Facilities managementServus Ltd (Trinidad & Tobago) Facilities managementUK Highways Management Services Ltd Road management services
Jointly controlled operationsName, proportion of interest held and address of principal place of business:
Carillion-URS Joint Venture 70% Pytchley Maintenance Compound, Pegasus Court, Kettering South Business Park, Kettering, Northamptonshire, England
Carillion-WSP JV 60% Bradford, West Yorkshire, EnglandGTBB Rugby, Warwickshire, England
A complete list of Group subsidiary undertakings will be attached to the Company’s annual return to the Registrar of Companies.
Section
05 – Finan
cial statemen
ts

Financial statementsCompany balance sheetAs at 31 December 2007
108 Carillion plcAnnual Report and Accounts 2007
2007 2006Note £m £m
Fixed assetsInvestments in subsidiary undertakings and Joint Ventures 3 537.8 536.3
Current assetsDebtors 4 344.2 275.1Cash at bank and in hand 177.9 27.4
522.1 302.5
Creditors: amounts falling due within one year 5Borrowing (1.3) (1.7)Other creditors (266.1) (153.5)
(267.4) (155.2)
Net current assetsDue within one year 227.8 119.5Debtors due after more than one year 4 26.9 27.8
254.7 147.3Total assets less current liabilities 792.5 683.6Creditors: amounts falling due after more than one year 6Borrowing (313.5) (199.1)Net assets 479.0 484.5
Financed by:Capital and reservesIssued share capital 7 140.6 140.6Share premium 8 199.9 199.9Other reserve 8 1.5 –Profit and loss account 8 137.0 144.0Equity shareholders’ funds 479.0 484.5
The financial statements were approved by the Board of Directors on 5 March 2008 and were signed on its behalf by:
Richard Adam FCAGroup Finance Director

Financial statementsNotes to the Company financial statements
109 Carillion plcAnnual Report and Accounts 2007
1. Significant accounting policies
The following accounting policies have been applied consistently in dealing with items which are considered material in relation to the Company’s financial statements.
Basis of preparationThe financial statements are presented in pounds sterling. They are prepared on the historical cost basis, except for derivativefinancial instruments which are stated at fair value, and inaccordance with applicable UK accounting standards and law.
During the year the Company adopted Urgent Issues Task Force(UITF) Abstract 41 ‘Scope of FRS 20 share-based payments’. Theadoption of this abstract has no effect on reported profit but hasresulted in an increase to net assets of £1.5m.
TaxationDeferred tax assets or liabilities arise from timing differencesbetween the recognition of gains and losses in the financialstatements and their recognition in the tax computation that have arisen but not reversed by the balance sheet date, except as otherwise required by Financial Reporting Standard 19 ‘Deferred tax’. Liabilities are calculated on a non-discounted full provision basis. Assets are calculated on the same basis, but are recognised only to the extent that it is probable that they will be recovered.
Fixed asset investmentsIn the Company’s financial statements, investments in subsidiaryundertakings and Joint Ventures are stated at cost, less provisionfor any impairment.
LeasingThe Company enters into finance lease arrangements on behalf of subsidiary companies. As permitted by Statement of StandardAccounting Practice 21 ‘Accounting for leases and hire purchasecontracts’, the assets relating to the finance leases are included in the financial statements of the subsidiaries concerned. Thecapital element of outstanding finance leases is included withinborrowing. The finance charge element of rentals is charged to the profit and loss account at a constant periodic rate of chargeon the outstanding obligations.
Own sharesConsideration paid for shares in the Company held by theEmployee Share Ownership Plan (ESOP) Trust are deducted from the profit and loss account reserve. Where such sharessubsequently vest in the employees under the terms of theCompany’s share option schemes or are sold, any considerationreceived is included in the profit and loss account reserve.
Where the Company grants options over its own shares to theemployees of its subsidiaries it recognises, in its individual financialstatements, an increase in the cost of investment in its subsidiariesequivalent to the equity-settled share-based payment chargerecognised in its consolidated financial statements with thecorresponding credit being recognised directly in other reserves.Amounts recharged to the subsidiary are recognised as a reductionin the cost of investment in subsidiary. If the amount rechargedexceeds the increase in the cost of investment the excess isrecognised as a dividend to the extent that it reflects postacquisition profits of the subsidiary.
Foreign currenciesTransactions denominated in foreign currencies are translated intosterling and recorded using the exchange rate prevailing at thedate of the transaction.
Monetary assets and liabilities denominated in foreign currenciesare translated into sterling at the exchange rates ruling at thebalance sheet date and the gains and losses on translation areincluded in the profit and loss account.
Financial instrumentsThe Company’s principal financial assets and liabilities are cash at bank and in hand and borrowing. Cash at bank and in hand is carried in the balance sheet at amortised cost. Borrowingis recognised initially at fair value less attributable transaction costsand subsequently at amortised cost. In addition, the Companyenters into forward contracts in order to hedge against small andinfrequent transactional foreign currency exposures. The forwardcontracts are measured initially at amortised cost, with changes infair value during the year recognised in the profit and loss account.Fair values are based on quoted market prices at the balance sheet date.
Share-based paymentsMembers of the Company’s senior management team are entitledto participate in the Executive Share Option Scheme (ESOS), theLong Term Incentive Plan (LTIP) and the Leadership Equity AwardPlan (LEAP). In addition, UK employees are able to participate inthe Sharesave scheme.
The fair value of the ESOS, LEAP and Sharesave schemes at thedate of grant are estimated using the Black-Scholes pricing model.The fair value of the LTIP scheme is estimated using a bespokemodel that factors in the probabilities of achieving TotalShareholder Return (TSR) performance conditions. For all schemesthe fair value determined at grant date is expensed on a straight-line basis over the period in which any performance conditions arefulfilled, ending on the date on which the relevant employeesbecome fully entitled to the award (vesting date).
Financial guarantee contractsWhere the Company enters into financial guarantee contracts to guarantee the indebtedness of subsidiary companies, theCompany considers these to be insurance arrangements andaccounts for them as such. In this respect, the Company treats the guarantee contract as a contingent liability until such time as it becomes probable that the Company will be required to make a payment under the guarantee.
Retirement benefit obligationsPension costs are recognised in the financial statements inaccordance with the requirements of FRS 17 ‘Retirement benefits’.Employees of the Company participate in the Carillion ‘Staff’ and‘B’ schemes which provide pensions on a defined benefit basis. The assets and liabilities of these schemes relating to the Companycannot be readily ascertained on a reasonable and consistent basis as the schemes are operated for the benefit of the CarillionGroup as a whole. Consequently, the Company accounts for theseschemes as if they were defined contribution schemes. Details ofthe Group’s pension schemes are disclosed in note 32 of theconsolidated financial statements.
Cash flow statementA cash flow statement has not been presented as permitted byFRS 1 (revised) ‘Cash flow statements’.
Section
05 – Finan
cial statemen
ts

2. Profit for the year
As permitted by section 230 of the Companies Act 1985, the Company has elected not to present its own profit and loss account for the year. Carillion plc reported a profit for the financial year ended 31 December 2007 of £17.6m (2006: £31.8m).
Fees paid to KPMG Audit plc and its associates for services to the Company itself are not disclosed in the individual accounts of Carillionplc because the Company’s consolidated accounts are required to disclose such fees on a consolidated basis.
A final dividend, declared in the previous year, of 5.9p per share (2006: 5.2p) was paid during the year, amounting to £16.6m (2006:£14.5m). An interim dividend of 3.5p per share (2006: 3.1p) was paid during the year, amounting to £9.8m (2006: £8.7m). A finaldividend of 7.5p (2006: 5.9p) per share, amounting to £29.6m (2006: £16.6m), was approved by the Board on 5 March 2008 and will be paid on 20 June 2008 to shareholders on the register on 25 April 2008. The amount expected to be paid in respect of the 2007 final dividend of £29.6m, includes the dividend payable on 112.9m new Carillion shares issued following the acquisition of AlfredMcAlpine plc on 12 February 2008.
2007 2006Payroll costs and employee numbers £m £m
Wages and salaries 4.6 5.1Social security costs 1.0 0.5Pension costs 0.9 0.8Equity-settled transactions 1.3 1.0
7.8 7.4
Pension costs represent amounts paid in respect of the Company’s pension schemes as defined in note 11 and includes £0.4m (2006: £0.4m) in respect of defined contribution schemes. There were no outstanding or prepaid contributions at the beginning or end of the financial year.
The average number of employees during the year, including directors, was 66 (2006: 62).
Details of director’s remuneration can be found in the remuneration report on page 48.
3. Investments
Subsidiary Jointundertakings ventures Total
£m £m £m
CostAt 1 January 2007 552.8 0.2 553.0Additions 3.5 – 3.5Disposals (8.1) – (8.1)At 31 December 2007 548.2 0.2 548.4
Impairment lossesAt 1 January 2007 16.7 – 16.7Disposals (6.1) – (6.1)At 31 December 2007 10.6 – 10.6
Net book valueAt 31 December 2007 537.6 0.2 537.8At 31 December 2006 536.1 0.2 536.3
The principal subsidiary undertakings and Joint Ventures of the Company are shown on page 107.
Financial statementsNotes to the Company financial statementscontinued
110 Carillion plcAnnual Report and Accounts 2007

111 Carillion plcAnnual Report and Accounts 2007
4. Debtors
2007 2006£m £m
Amounts falling due within one yearAmounts owed by group undertakings 305.5 232.6Other debtors 6.8 0.1Other prepayments and accrued income – 5.1Income tax 5.0 8.7Derivative financial instruments – 0.8Amounts falling due within one year 317.3 247.3
Amounts falling due after more than one yearAmounts owed by Group undertakings 26.9 27.8Total debtors 344.2 275.1
The amounts owed by Group undertakings falling due after more than one year includes £7.0m (2006: £8.4m) relating to finance leasetransactions entered into with Carillion Construction Limited and Carillion Fleet Management Limited. Further details are disclosed in note 6.
5. Creditors: amounts falling due within one year
2007 2006£m £m
Bank overdrafts – 0.5Net obligations due under finance leases 1.3 1.2Borrowing 1.3 1.7Amounts owed to Group undertakings 227.9 122.1Amounts owed to Joint Ventures 36.8 30.3Accruals and deferred income 0.7 1.1Derivative financial instruments 0.7 –
267.4 155.2
6. Creditors: amounts falling due after more than one year2007 2006
£m £m
Bank loans 306.5 190.7Net obligations due under finance leases 7.0 8.4
313.5 199.1
Net obligations due under finance leases relate to financing agreements for fixed assets that are used by Carillion Construction Limitedand Carillion Fleet Management Limited, both wholly owned subsidiaries. The assets have been recognised in the accounts of thesubsidiaries in accordance with ‘SSAP 21 Accounting for leases and hire purchase contracts’, together with corresponding liabilities to the Company. The Company recognises these inter-company debts within amounts owed by Group undertakings in note 4.
Interest is charged on the above bank loans at floating rates linked to LIBOR.
All bank loans and overdrafts are unsecured. Net obligations due under finance leases are secured on the assets to which they relate.
The maturity profile of all borrowing is disclosed in note 13 on page 114. Section
05 – Finan
cial statemen
ts

7. Share capital
2007 2006£m £m
Authorised423,000,000 (2006: 423,000,000) ordinary shares of 50p each 211.5 211.5
Issued and fully paid2007 2006
Number Numbermillion £m million £m
At 1 January 281.2 140.6 214.9 107.4New share capital subscribed – – 66.3 33.2At 31 December 281.2 140.6 281.2 140.6
8. ReservesShare Profit
premium and loss Other account account reserve Total
£m £m £m £m
At 1 January 2007 199.9 144.0 – 343.9Profit for the year – 17.6 – 17.6Share options exercised by employees – 0.9 – 0.9Equity-settled transactions (net of deferred tax) – 0.9 1.5 2.4Dividend paid to shareholders – (26.4) – (26.4)At 31 December 2007 199.9 137.0 1.5 338.4
The profit and loss account reserve includes the reserve for the Company’s own shares which comprises of the cost of the Company’sshares held by the Carillion Employee Share Ownership Plan (ESOP). The shares held by the ESOP may subsequently be awarded toemployees under the Group’s share incentive schemes. The movements in the reserve for own shares included within the profit and loss account reserve are as follows.
2007 2006£m £m
Balance at 1 January (1.6) (4.7)Share options exercised by employees (exercise price) 0.9 2.8LTIP options exercised (transfer to retained earnings) – 0.3Balance at 31 December (0.7) (1.6)
At 31 December 2007, the ESOP held 61,609 (2006: 1,137,177) of the Company’s shares. The ESOP has elected to waive all dividendsexcept for a total payment of 1p at the time each dividend is paid.
In addition to the ESOP, the Company has also established a Qualifying Employee Share Ownership Trust (‘QUEST’). During the year, 2,643 ordinary shares in the Company held by the QUEST were transferred to employees of the Group following the exercise of options under the Sharesave Scheme. At 31 December 2007 the total number of shares held under the QUEST amounted to 219,763 (2006: 222,406) and had a market value of £0.8m (2006: £0.9m). The QUEST has elected to waive all dividends in excess of 0.01 pence per share.
The other reserve represents equity settled transactions for employees within subsidiaries on adoption of UITF 41 as at 1 January 2007.
9. Reconciliation of movement in shareholders’ funds
2007 2006£m £m
Profit for the year 17.6 31.8New share capital subscribed – 224.9Equity-settled transactions (net of deferred tax) 2.4 0.7Share options exercised by employees 0.9 2.8Dividends paid to shareholders (26.4) (23.2)Net (reduction in)/addition to shareholders’ funds (5.5) 237.0Shareholders’ funds at 1 January 484.5 247.5Shareholders’ funds at 31 December 479.0 484.5
Financial statementsNotes to the Company financial statementscontinued
112 Carillion plcAnnual Report and Accounts 2007

113 Carillion plcAnnual Report and Accounts 2007
10. Other guarantees and contingent liabilities
2007 2006£m £m
Guarantees in respect of borrowing of subsidiaries, Joint Ventures and joint arrangements 2.0 1.1Guarantees in respect of deferred equity payments in PPP Joint Ventures 7.8 9.8Guarantees in respect of letters of credit issued by banks in relation to deferred equity payments
in PPP Joint Ventures 88.7 93.2Guarantees in respect of letters of credit issued by banks in relation to performance contracts
in PPP Joint Ventures 30.0 30.0Guarantees in respect of letters of credit issued by banks in relation to pension scheme
deficit recovery payments 21.0 44.0
The Company has issued performance guarantees in respect of its subsidiaries, Joint Ventures and joint arrangements in the normal course of business.
11. Pension arrangements
As the Staff and ‘B’ defined benefit schemes are run for the Carillion Group as a whole, the Company is unable to identify its share of the schemes’ assets and liabilities on a consistent and reasonable basis. Hence, as permitted by FRS 17, the schemes are accounted for by the Company separately as if the schemes were defined contribution schemes. Details of the Group’s pension schemes are disclosedin note 32 to the consolidated financial statements.
12. Share-based payments
The Group has established a share option programme that entitles key management personnel and senior employees to purchase sharesin the Company. Details of the Group’s share option programme are disclosed in note 26 to the consolidated financial statements and in the Remuneration Report on page 48.
13. Financial instruments
Details of the Company’s principal financial instruments are discussed under accounting policies. The numerical financial instrumentdisclosures are set out below:
Derivative financial instruments2007 2006
Assets Liabilities Assets Liabilities£m £m £m £m
Forward foreign currency contracts – 0.7 0.8 –
Effective interest ratesThe Company’s interest bearing borrowings were subject to effective interest rates at the balance sheet date as follows.
2007 2006Range (%) Range (%)
Bank overdrafts 3.20-6.50% 5.50 to 7.25Bank loans 5.46-7.31% 5.24 to 6.36Finance lease obligations 4.00-6.54% 4.00 to 6.54
Foreign currency exposureThe carrying amount of the Company’s borrowings denominated in foreign currency is as follows.
2007 2006£m £m
United States of America Dollars 12.7 12.8Canadian Dollars 19.9 17.1
32.6 29.9
Foreign currency borrowing of £32.6m (2006: £29.9m) is used for hedging currency net assets of overseas operations of the Group. The foreign exchange loss of £2.7m (2006: £4.1m) on translation of borrowing into sterling has been recognised in the profit and loss account.
Section
05 – Finan
cial statemen
ts

13. Financial instruments (continued)
Fair valuesWhere there were differences between the carrying and fair values of the Company’s principal financial instruments at 31 December 2007,these are shown below.
Carryingvalue Fair value
£m £m
Finance lease obligations 8.7 7.1
Maturity of financial liabilitiesThe maturity profile of the carrying amount of the Group’s non-current borrowing is as follows.
Bank Financeloans leases Total
31 December 2007 £m £m £m
Between one and two years – 1.4 1.4Between two and three years – 1.5 1.5Between three and four years – 1.1 1.1Between four and five years 306.5 0.9 307.4More than five years – 2.1 2.1More than one year 306.5 7.0 313.5Less than one year – 1.3 1.3
306.5 8.3 314.8
Bank Bank Financeloans overdrafts leases Total
31 December 2006 £m £m £m £m
Between one and two years – – 1.3 1.3Between two and three years – – 1.4 1.4Between three and four years 190.7 – 1.5 192.2Between four and five years – – 1.1 1.1More than five years – – 3.1 3.1More than one year 190.7 – 8.4 199.1Less than one year – 0.5 1.2 1.7
190.7 0.5 9.6 200.8
Borrowing facilitiesThe Company has the following undrawn committed borrowing facilities available at the year end in respect of which all conditionsprecedent had been met.
2007 2006£m £m
Expiring between two and five years 283.5 140.1
Drawings under the commited borrowing facility include £175m required to satisfy the ‘certain funds’ requirement for the cash element of the acquisition of Alfred McAlpine plc, which will not be required to be paid until March 2008.
14. Related party transactions
The Company has received management fees of £0.4m (2006: £0.4m) from Carillion Services 2006 Ltd during the year.
15. Post-balance sheet events
On 12 February 2008, the Company acquired 100 per cent of the issued share capital of Alfred McAlpine plc for a total consideration of £554.5m. The total consideration was satisfied by the issue of 112.9m Carillion plc shares valued at the quoted mid-market price at the close of business on the day preceding the effective date of acquisition of 337.75p and £171.7m in cash and £1.3m of loan notes. In addition, attributable costs are estimated to be £9.2m.
Financial statementsNotes to the Company financial statementscontinued
114 Carillion plcAnnual Report and Accounts 2007

Financial statementsShareholder informationand Advisers
115 Carillion plcAnnual Report and Accounts 2007
Dividends Dividends are normally paid twice a year.The proposed final dividend in respect of the year to 31 December 2007 will be payable on 20 June 2008 to those shareholders on the register on 25 April 2008.
A dividend reinvestment plan (DRIP) willalso be offered.
For those shareholders who prefer not to participate in the DRIP, arrangementscan be made to pay your dividendsautomatically into your bank or buildingsociety account. This service has a numberof benefits
• there is no chance of the dividendcheque going missing in the post
• the dividend payment is received morequickly as the cash is paid directly intoyour account on the payment datewithout the need to wait for thecheque to clear
• you will help Carillion to improve itsefficiency by reducing printing andcheque clearing costs.
If you wish to register for this service,please call Equiniti on the number below to request a dividend mandate form.
ResultsHalf year to 30 June 2008: announced August 2008.
Full year to 31 December 2008:announced March 2009.
Shareholder EnquiriesEquiniti maintains the share register of the Company. If you have any queriesconcerning your shareholding, or if any of your details change, please contact Equiniti:
EquinitiAspect HouseSpencer RoadLancingWest SussexBN99 6DA
Telephone 0871 384 2522Textphone for shareholders with hearing difficulties 0871 384 2255
AuditorKPMG Audit Plc2 Cornwall StreetBirminghamB3 2DL
BankerNational Westminster Bank plc16 South ParadeNottinghamNG1 2JX
Joint BrokersMorgan Stanley25 Cabot SquareCanary WharfLondonE14 5QA
Oriel Securities125 Wood StreetLondon EC2V 7AN
Financial AdviserLazard 50 Stratton StreetLondonW1J 8LL
Legal AdviserSlaughter and MayOne Bunhill RowLondonEC1Y 8YY
Share RegistrarEquinitiAspect HouseSpencer RoadLancingWest SussexBN99 6DA
Share Dealing Service Carillion offers its UK shareholdersShareview Dealing, a telephone andinternet share sale service operated byEquiniti. For telephone sales call 0845 6037037 between 8.30am and 4.30pm,Monday to Friday, and for internet saleslog on to www.shareview.co.uk/dealing.You will need your shareholder referencenumber as shown on your share certificate.
Multiple Accounts on the Shareholder RegisterIf you have received two or more sets ofthe documents concerning the AnnualGeneral Meeting this means that there is more than one account in your name onthe shareholder register, perhaps becauseeither your name or your address appearon each account in a slightly different way. For security reasons, Equiniti will notamalgamate the accounts without yourwritten consent, so if you would like anymultiple accounts combined into oneaccount, please write to Equiniti at theaddress given on this page.
Shareview (Electronic Communications)www.shareview.co.uk is a service offeredby Equiniti that enables you to check your holdings in many UK companies andhelps you to organise your investmentselectronically. You can also notify Equinitiof a change of address or a change todividend mandate instructions. You canregister for this portfolio service which iseasy to use, secure and free as long as youhave access to the internet by logging onto www.shareview.co.uk and following asimple registration process.
Electronic Proxy AppointmentsFor the AGM to be held on 7 May 2008,you may, if you wish, register theappointment of a proxy electronically bylogging on to the websitewww.sharevote.co.uk.
You will need your voting referencenumbers (the three eight-digit numbersshown on your form of proxy).Alternatively, if you have registered for a Shareview portfolio, log on to yourportfolio at www.shareview.co.uk and click on ‘Company Meetings’.
Please note that any electroniccommunication that is found to contain a computer virus will not be accepted.
ShareGiftShareGift is a charity share donationscheme for shareholders, administered by the Orr Mackintosh Foundation. It isespecially for those who may wish todispose of a small parcel of shares whosevalue makes it uneconomic to sell on acommission basis. Further information can be obtained at www.sharegift.org or from Equiniti.
Section
05 – Finan
cial statemen
ts

Financial statementsFive year review
116 Carillion plcAnnual Report and Accounts 2007
Group income statement2007 2006 2005 2004 2003
Continuing operations £m £m £m £m £m
Total revenue 3,951.7 3,512.4 2,249.1 1,954.4 1,956.4Analysed between:Support services 1,793.6 1,458.7 953.6 886.5 891.9Public Private Partnership projects 154.1 148.0 65.4 62.5 67.5Middle East construction services 337.0 268.7 160.5 102.4 72.9Construction services (excluding the Middle East) 1,667.0 1,637.0 1,069.6 903.0 924.1
Underlying Group and Joint Ventures operating profit before intangible amortisation, impairment of goodwill and other investments, restructuring costs and jointly controlled entities net financial (expense)/income and taxation 120.1 97.4 55.3 57.9 55.6Analysed between:Support services 73.9 58.8 40.5 48.0 52.6Public Private Partnership projects 25.4 26.5 8.3 6.1 8.6Middle East construction services 25.4 13.9 4.2 1.8 4.4Construction services (excluding the Middle East) 16.0 18.5 12.7 10.7 1.2Group eliminations and unallocated items (20.6) (20.3) (10.4) (8.7) (11.2)
Share of jointly controlled entities net financial (expense)/income (9.9) (8.0) 1.1 (3.4) (4.9)Share of jointly controlled entities taxation (9.0) (8.1) (5.0) (2.2) (3.4)Underlying operating profit before intangible amortisation,impairment of goodwill and other investments and restructuring costs 101.2 81.3 51.4 52.3 47.3Group net financial income 0.6 1.3 4.0 4.1 1.4
Underlying profit before taxation 101.8 82.6 55.4 49.2 48.7Intangible amortisation and impairment of goodwill and other investments (21.5) (17.2) (2.8) (0.3) (36.9)Restructuring costs and other exceptional operating items (14.2) (22.6) – 7.2 –Non-operating items 28.3 25.3 (0.8) 11.8 9.9Profit before taxation 94.4 68.1 51.8 67.9 21.7Taxation (8.3) (7.2) (11.1) (8.6) (10.3)Profit from continuing operations 86.1 60.9 40.7 59.3 11.4
Discontinued operations (7.6) (0.5) 0.1 (1.1) (1.5)Analysed between:Trading loss from discontinued operations (1.4) (0.5) 0.1 (1.1) (1.5)Loss on disposal of discontinued operations (6.2) – – – –
Profit for the year 78.5 60.4 40.8 58.2 9.9
Group financial statisticsUnderlying operating profit margin Support services Percentage 4.1% 4.0% 4.2% 5.4% 5.9%Middle East construction services Percentage 7.5% 5.2% 2.6% 1.8% 6.0%Construction services
(excluding the Middle East) Percentage 1.0% 1.1% 1.2% 1.2% 0.1%Underlying profit from operations margin Total Group Percentage 2.6% 2.3% 2.3% 2.7% 2.5%
Prior year information for 2004 and 2003 has been restated following adoption of International Financial Reporting Standards in 2005.

Group balance sheet2007 2006 2005 2004 2003
£m £m £m £m £m
Property, plant and equipment 131.5 146.6 100.9 69.9 66.0Intangible assets 555.8 596.1 62.3 20.3 22.4Investments in Joint Ventures 185.9 178.8 62.7 65.1 78.8
873.2 921.5 225.9 155.3 167.2Inventories, receivables and payables (286.5) (282.0) (119.5) (79.1) (60.3)Net retirement benefit liability (net of deferred tax) (13.8) (75.8) (47.5) (59.7) (76.6)Other net assets/(liabilities) (25.1) (22.0) 0.1 (17.7) (20.6)Net operating assets/(liabilities) 547.8 541.7 59.0 (1.2) 9.7Net (borrowing)/cash (44.9) (108.0) 90.8 128.8 59.6Net assets 502.9 433.7 149.8 127.6 69.3
Group cash flow statementUnderlying group operating profit 64.4 49.7 35.0 44.7 36.6Depreciation and other non-cash items 15.9 18.5 14.4 20.0 12.4Working capital 31.7 15.2 36.0 26.4 38.3Dividends received from Joint Ventures 23.7 15.7 8.4 7.3 14.7Underlying cash flow from operations 135.7 99.1 93.8 98.4 102.0Deficit pension contributions (46.3) (31.8) (10.0) – –Restructuring costs (6.5) (18.2) – – (0.7)Interest, tax and dividends (30.4) (25.7) (35.3) (27.4) (12.2)Net capital expenditure 4.4 (28.2) (46.4) (19.1) (14.1)Acquisitions and disposals 9.6 (190.9) (35.4) 15.8 (5.3)Other (including discontinued operations) (3.4) (3.1) (4.7) 1.5 (8.0)Change in net liquidity 63.1 (198.8) (38.0) 69.2 61.7Net (borrowing)/cash at 1 January (108.0) 90.8 128.8 59.6 (2.1)Net (borrowing)/cash at 31 December (44.9) (108.0) 90.8 128.8 59.6
Prior year information for 2004 and 2003 has been restated following adoption of International Financial Reporting Standards in 2005.
Group financial statisticsEarnings per shareUnderlying earnings per share
– continuing operations Pence 28.9 23.7 20.4 19.1 17.9Underlying earnings per share
– continuing and discontinued operations Pence 26.2 23.5 20.4 18.6 17.2Basic earnings per share
– continuing and discontinued operations Pence 27.1 21.6 18.7 27.1 4.4
DividendsProposed full year dividend per share Pence 11.0 9.0 8.0 7.5 6.75Underlying proposed dividend cover
– continuing operations Times 2.6 2.6 2.5 2.5 2.7Basic proposed dividend cover
– continuing and discontinued operations Times 2.5 2.4 2.3 3.6 0.7
Prior year information for 2004 and 2003 has been restated following adoption of International Financial Reporting Standards in 2005. Section
05 – Finan
cial statemen
ts
This Annual Report is printed on Take 2 Offset, which contains 100% de-inked pulpfrom post-consumer recycled waste. This product is biodegradable, 100% recyclableand elemental chlorine free. Vegetable based inks were used during production.
Both the paper mill and printer involved in the production support the growth ofresponsible forest management and are both accredited to ISO 14001 whichspecifies a process for continuous environmental improvement.
Designed and produced by Carnegie Orr +44(0)20 7610 6140www.carnegieorr.co.uk

Want to find out more?visit: www.carillionplc.com
Home pagewww.carillionplc.com
Investorswww.carillionplc.com/investors
Health and Safetywww.carillionplc.com/safety
Sustainabilitywww.carillionplc.com/sustainability
Carillion plcBirch StreetWolverhampton WV1 4HYUnited Kingdom
T +44 (0)1902 422431F +44 (0)1902 316165www.carillionplc.com