bank of ireland credit presentation growth in core loan books 1core loan book growth excludes cash...
TRANSCRIPT

Bank of IrelandCredit PresentationAugust 2017


Bank of Ireland Overview

Bank of Ireland Group Highlights
Group holding company, Bank of Ireland Group plc (BOIG), introduced on top of the existing Group structure supporting the SRB/ BOE1 Single Point of Entry preferred resolution strategy
Ireland’s Leading Bank
Largest lender to Irish economy
Growing market shares in business banking and residential mortgages
Business Transformation
Transforming today to underpin and drive long term sustainability and competiveness
Enabled by technology investments
Strategic Diversification
International businesses continue to provide diversification and attractive business opportunities
Asset Quality
Positive trends continue
Impaired loans reduced to <7% of customer lending
Capital/ MRELStrong capital generation; increased fully loaded CET1 ratio to 12.5%
Based on current total capital levels and MREL “Informative Target”, modest new BOIG MREL issuance expected
2
1Single Resolution Board / Bank of England

Underlying profit before tax of €480 million - expanded NIM to 2.32%
Ongoing improvements in asset quality - impairment charge reduced to 14bps
New lending of €6.6 billion - core loan books continue to grow
Strong capital generation - interest rate volatility in IAS19 defined benefit pension schemes reducing
Fully loaded CET1 ratio of 12.5% is after a deduction of €70m for a potential dividend
3
Financial Highlights H1 2017Underlying profit before tax of €480m
Net interest margin Impaired loans Fully loaded CET1 ratio
11.3% 12.3% 12.5%
Dec 15 Dec 16 Jun 17
2.11% 2.27% 2.32%
H2 2016H1 2016 H1 2017
€9.6bn
Dec 15 Dec 16
€6.2bn
Jun 17
€5.4bn

Benefitting from Irish growth with international diversification
Ireland(~70% of total income)
Ireland’s leading retail and commercial bank and Ireland’s only bancassurer
Largest lender to the Irish economy. Growing market shares
#1 or #2 market positions across all principal product lines
Strong commercial discipline on lending and deposit margins
Continuing to support and benefit from economic growth in Ireland
United Kingdom(~20% of total income)
Focussed predominantly on consumer sector in Great Britain
Commission based business model provides flexibility to adapt to market developments
Long standing partnership with Post Office; partnership with AA continues to develop
Northern Ireland meeting business objectives; Northridge Finance performing well
BOI(UK) plc is a separately regulated, capitalised and self-funded business
International(~10% of total income)
Mid market US / European Acquisition Finance business; strong 20+ year track record
Good geographic and sectoral diversification. Provides attractive opportunities to deploy capital
Generates attractive margins and fee income within disciplined risk appetite
Residential Mortgages,
€24.0bn
Residential Mortgages,
€23.1bn
Acquisition Finance, €3.5bn
Non-Property, SME &
Corporate,€4.3bn
Property and Construction,
€6.2bn
Non-Property, SME &
Corporate, €11.5bn
Property and Construction,
€3.0bn
Consumer,€2.0bn
Consumer,€2.1bn
International Corporate /
Project Finance, €0.4bn
Gross Customer loans at June 2017
4

5Sources: Bank of Ireland Economic Research Unit, Central Statistics Office, Office for National Statistics, Nationwide
9.4%
7.9%
6.3%
5.4% 4.9% 4.6%
Irish and UK economies are growing albeit at different rates
Unemployment rate falling in Ireland, remains low in UK
Demand driven increase in house prices with constrained supply
5.1%
4.6% 4.5%
7.8%
11.9%
3.1%
4.5%
4.8%
1.6%1.8%
2016 2017f 2015 20152016 20162017f Mid 2017
Irish GDP grew by 5.1% in 2016, highest rate of growth of any euro area member for a third year running
Irish consumer spending, investment and exports all rose last year and are forecast to continue to do so
Unemployment continues to decline in Ireland and remains at a low level in the UK
UK economy has been growing, albeit the decision to leave the EU which has generated uncertainty and currency volatility is a headwind for the two economies
Our diversified business model ensures robustness and provides flexibility
n ROI GDP n UK GDP ROI unemployment rate UK unemployment rate n ROI residential property prices national (change, Dec on Dec) n UK residential property prices national (change, Dec on Dec)(annual real growth) (annual average)
Mid 2017 refers to May 2017 in ROI and June 2017 in UK (change, year on year)
Supportive economic backdropIrish and UK economies have been growing

Operating Performance

Income StatementNet interest income of €1,151m, in line with H1
2016 notwithstanding an adverse FX translation impact of c.€35m
Other income of €369m including sustainable and diversified business income of €328m
Operating expenses of €881m including FX translation impact benefit of c.€18m
Core Banking Platforms investment in H1 2017 of €105m (CET1 ratio impact of c.20bps); €55m expensed to income statement
Net impairment charge of 14bps for H1 2017; lower charge expected for H2 2017
Balance SheetNew lending of €6.6bn, broadly in line with H1 2016 Largest lender to the Irish economy; growing Irish
market shares in business banking and residential mortgages
Impaired loans reduced to €5.4bn; down c.65% from reported peak in June 2013
NPEs reduced by €1.3bn to €8.1bn Upgrades to bank ratings in H1 2017 from Moody’s, S&P
and DBRS to Baa1, BBB and A(low) respectively. Positive outlook from Moody’s and Fitch
Underlying profit before tax of €480m
Robust balance sheet metrics
Overview H1 2017
H1 2016 H1 2017
Jun-17Dec-16
Total Income
Customer loans (net)
€1,587m €1,520m
€76.9bn€78.5bn
Net Interest Margin (NIM)
Non-performing exposures (NPEs)
2.11% 2.32%
€8.1bn€9.4bn
Impairment charges (net)
Transitional Total Capital Ratio
(€95m) (€59m)
18.3%18.2%1
Underlying profit before tax
Liquidity metrics: NSFR LCR LDR
€560m €480m
122%113%104%
121%120%103%
Operating expensesCore Banking Platforms investmentLevies and Regulatory charges
CET1 ratios: Transitional Fully Loaded
(€882m)(€8m)(€62m)
(€881m)(€55m)(€63m)
14.0%1
12.3%14.4%12.5%
71Transitional CET1 ratio of 14% and total capital ratio of 18.2% are the pro-forma ratios as at 1 Jan 2017 allowing for the impact of CRD IV phasing in 2017

8
Net interest income - €1,151m Net interest income in line with H1 2016 notwithstanding
an adverse FX translation impact of c.€35m
NIMH1 2017 NIM of 2.32% (H2 2016: 2.27%) reflecting; Positive impact from new lending and strong
commercial discipline on pricing Lower cost of deposit funding, primarily in the UK,
offset by; Impact of excess liquidity and Dec 2016 credit risk
transfer transaction
Average interest earning assets (AIEAs)AIEAs in line with H2 2016; increase in liquid assets
primarily due to excess liquidity
Net interest incomeNIM benefitting from new lending and lower funding costs
Average interest earning assets
H1 2016 H2 2016 H1 2017
2.11% 2.27% 2.32%
n Average Loans & Advances n Average Liquid Assets
Net interest margin drivers
NIM Loan Asset Spread1 Liquid Asset Spread1
H2 2016 H1 2017H1 2016
€105.1bn€99.4bn €99.3bn
9bps 27bps 21bps
264bps 277bps 287bps
€22.5bn€20.5bn €21.6bn
€82.6bn €78.9bn €77.7bn
1Spread = Loan asset yield or Liquid asset yield less Group’s average cost of funds

9
Core loan books1 grew by €0.5bn in H1 2017
New lending2 of €6.6bn in H1 2017 broadly in line with H1 2016 on a constant currency basis;
Retail Ireland new lending increased by 9% to €2.5bn; ROI new mortgage lending up 31% with new lending market share growing to 26% in H1 2017
Corporate new lending of €1.9bn broadly in line with H1 2016
Retail UK new lending of £1.9bn declined by 7% vs. H1 2016 reflecting our discipline in pricing and risk
Customer loans decreased by c.€1.6bn to €76.9bn; reflects FX translation impact of €1.1bn
Redemptions of €7.2bn in H1 2017 include €1.0bn relating to redemptions of impaired loans, ROI tracker mortgages and GB non-core business banking loan books3
Maintaining an appropriate focus on risk and pricing
Loans and advances to customersContinued growth in core loan books
1Core loan book growth excludes cash from impaired loans, redemptions of low yielding ROI tracker mortgages and redemptions of GB non-core business banking loans2Excludes portfolio acquisitions (H1 2016 - €0.1bn; H1 2017 - Nil)
3GB business and corporate loan books, which BOI was required to run down under its EU approved Restructuring Plan (Remaining stock: H1 2016 - £1.0bn; H1 2017 - £0.7bn)
Group loan book movement in H1 2017
Dec 16Loan Volumes
Core loan book growth1
Redemptions on impaired loans, ROI
trackers, GB non-core
FX / Other Jun 17 Loan Volumes
€78.5bn
€0.5bn €1.0bn€1.1bn
€76.9bn
New lending volumes2
€6.8bn €6.6bn
H1 2016 H1 2017
n Retail UK n Retail Ireland n Corporate (incl. Ireland)
€2.6bn€2.2bn
€2.3bn €2.5bn
€1.9bn €1.9bn

Impaired loans and impairment charge Continued reduction during H1 2017
Impaired loans
Impairment charge on customer loans
55% 54%
Impaired loans coverage ratio, being specific impairment provisions divided by impaired loans
n Annual impairment charges on customer loans as a % of average gross loans for the period
Asset Quality continues to improveImpaired loans1 of €5.4bn €0.8bn reduction during H1 2017; down 65% from
reported peak in June 2013Non-performing exposures (NPEs) of €8.1bn (see slide 40) €1.3bn reduction during H1 20172
Reductions reflect the Group’s ongoing progress with resolution strategies and the positive economic environment
Expect further reductions in H2 2017 and beyond; pace will be influenced by a range of factors
Impairment charge on customer loans reducedNet impairment charge of 14bps for H1 2017Impaired loan coverage ratio of 52% Lower charge expected for H2 2017
Asset Quality Reporting Methodology The Group has revised its asset quality reporting
methodology to align with the forborne and non-performing exposures classifications as defined by the EBA
Net neutral impact on the Group’s capital ratios and impairment provisions
1Impaired loans are loans with a specific provision attached to them and have been modified to remove non-retail accounts that are >90 days past due (Dec 2016: €0.3bn) 2NPEs at June 2017 include Forborne Collateral Realisation loans of €1.5 billion. Further details provided on slide 40
Jun 16 Dec 16
H1 2016 H2 2016
Jun 17
€8.0bn
€6.2bn€5.4bn
21bps 21bps
52%
H1 2017
14bps
10

Funding Update
11
Strong liquidity ratiosNet Stable Funding Ratio – 121%
Liquidity Coverage Ratio – 120%
Loan to Deposit Ratio – 103%
Customer deposits – €74.7bnCustomer deposits funding >95% of customer loans
Predominantly sourced through retail distribution channels
Strong economic activity in Ireland continuing to drive increases in current account balances
Wholesale funding – €13.5bnMonetary Authority borrowings of €5.3bn1 reflecting
Group’s usage of cost efficient long term funding facilities
BOIG established in July 2017; future senior and junior debt issuance for MREL purposes expected to be issued from BOIG
BOIG issuer rating assigned investment grade ratings of Baa3, BBB-, BBB- from Moody’s, S&P and Fitch respectively
1€3.3bn of ECB TLTRO funding and €2.0bn of BOE funding through TFS (c.€1.1bn) and ILTR (c.€0.9bn)
Jun 17 (€bn)
Dec 16 (€bn)
Wholesale funding
Closing EUR / GBP FX rates
13
0.88
Customer loans 7778
Liquid assets 2221
Other assets 67
Total assets 122123
Customer deposits 7575
Other liabilities 77
Stockholders’ equity 99
Total liabilities 122123
BOI Life assets 1717
BOI Life liabilities 1717
14
0.86
Additional Tier 1 security 11

Underlying profit before tax of €480m; expanded NIM to 2.32%
Ongoing improvements in asset quality; impairment charge down to 14bps
Continue to be largest lender to the Irish economy; core loan books continue to grow
Replacement of Core Banking Platforms will deliver cost efficiencies and provide growth and strategic opportunities
Strong liquidity ratios; customer deposits funding >95% of customer loans
Strong operating performance reflected in positive rating actions from Moody’s, S&P and DBRS in H1 2017
Operating Performance Summary Highlights
12

Capital & MREL

Preferred resolution strategy for the Group consists of a Single Point of Entry (SPE) bail-in strategy through the Group holding company (BOIG) Transparent and well-defined resolution strategy in comparison to other jurisdictions BOIG introduced on top of the existing group structure supporting an SPE preferred resolution strategy No change to any of the Group’s existing operating companiesBail-in at BOIG is the primary resolution tool. MREL requirements are expected to be met through junior and senior issuance from BOIGLosses are passed to BOIG on the write-down of intragroup assets. BOIG investors bear loss in accordance with the resolution2
hierarchy. Resolution authorities required to apply the “No Creditor worse off” principle in application of the bail-in toolFunding requirements may also continue to be met, as required, through the issuance of Irish Covered Bonds (ACS) by Bank of Ireland
Mortgage Bank and senior unsecured issuance by GovCo
Corporate ReorganisationBOIG established in July 2017
New
Ho
ldC
oC
apital / M
RE
LU
ncha
nged
Co
rpo
rate
Str
uctu
reF
unding
Senior unsecured
Bank of Ireland Group plc (BOIG)
Irish Covered Bonds (ACS)
The Governor and Company of the Bank of Ireland (GovCo)
New Ireland Assurance Company plc
Bank of Ireland (UK) plc
100%
100% 100% 100%
1100% shareholding via intermediate holding company 2 Per Regulations 87 and 96 of the European Union (Bank Recovery and Resolution) Regulations 2015
1
14
AT1Tier 2Senior unsecured
Bank of Ireland Mortgage Bank (BOIMB)

15
BOIG Issuer Ratings
Irish Covered Bonds (ACS)
GovCo Issuer Ratings
Progress on BOI Credit Ratings
Key Rating Drivers Upside could develop from:
BBB- (Stable)
BBB (Stable)
Aa1 AA (High)
Jan 2017: 1 notch senior unsecured upgrade for GovCo from BBB- to BBB (outlook revised to Stable)
Jul 2017: Assigned BBB- (Stable) rating to newly established holding company
Further reductions in non-performing loans
Additional loss-absorbing capacity (ALAC) uplift
Baa3 (Positive)
Baa1 (Positive)
Jun 2017: 1 notch senior unsecured upgrade for GovCo from Baa2 to Baa1 (outlook remains Positive)
Jul 2017: Assigned Baa3 (Positive) rating to newly established holding company
Improvements in capital metrics, while maintaining stable profitability, funding and liquidity metrics
Further reductions in non-performing loans
Further reductions in non-performing loans
Strong internal capital generation and strengthening capital ratios
BBB- (Positive)
BBB- (Positive)
Dec 2016: BBB- (Positive outlook) affirmed by Fitch
Jul 2017: Assigned BBB- (Positive) rating to newly established holding company
BOI Credit RatingsInvestment grade ratings for BOIG and GovCo

Strong organic capital generation in H1 2017; robust capital ratios
Core Banking Platforms investment in H1 2017 of €105m (CET1 ratio impact of c.20bps); €55m expensed in income statement
IAS19 accounting standard defined benefit pension scheme deficit of €0.49bn3 (Dec 16: €0.45bn). Volatility in pension scheme deficit has reduced following increased interest rate and inflation hedging
Expect to maintain a CET1 ratio in excess of 12% on a transitional basis and on a fully loaded basis by the end of the phase-in period
Dividend payments expected to recommence at a modest level in H1 2018, in respect of financial year 2017
Potential dividend (c.20% of sustainable earnings) deducted at Jun 17 in line with Regulatory guidance
1Capital ratios have been stated including the benefit of the retained profit during the period2Organic capital generation consists of attributable profit, AFS reserve movements, the reduction in the DTA deduction (DTAs that rely on future profitability), the impact of an increased 10/15%
threshold deduction, movements in the Expected Loss deduction and RWA book size and quality movements. Transitional organic capital generation is 15bps higher due to phasing impacts 3Deficit reducing contributions of €40m during 2017 have limited impact on transitional ratios and do not impact fully loaded capital ratios while the schemes are in deficit
Transitional CET1 ratio movement
CET1 Capital1Strong organic capital generation
Fully loaded CET1 ratio movement
Jun 17 CET1
Jun 17 CET1
Dec 16CET1
Dec 16CET1
Potential Dividend
Potential Dividend
IAS19 Pension Deficit3
IAS19 Pension Deficit3
Organic Capital
Generation2
Organic Capital
Generation2
14.0%
12.3%
14.4%
12.5%
0.2%(10bps) (15bps)
(15bps) (15bps)
85bps
70bps
Impact of CRD IV phasing at 1 Jan 2017
Core Banking
Platforms Investment
Core Banking
Platforms Investment
(20bps)
(20bps)
16

Tier 1 and Total Capital Robust capital ratios
Dec 2016 Jun 2017
Tier 1 ratios:
Transitional
Fully Loaded
15.7%
13.7%
15.9%
14.0%
Total Capital ratios:
Transitional
Fully Loaded
18.5%
16.4%
18.3%
16.4%
Leverage ratios:
Transitional
Fully Loaded
7.3%
6.4%
7.2%
6.4%
Risk Weighted Assets:
Transitional
Fully Loaded
€50.8bn
€50.7bn
€48.8bn
€48.6bn
Tier 1 & Total CapitalGrowth in Tier 1 ratios consistent with growth in CET1 in the
period
Total Capital ratios reflect the increase in CET1 ratios offset by regulatory adjustments to Tier 2 capital1
Impact of Corporate ReorganisationA proportion of the existing subordinated debt issued by
GovCo will not be reflected in the consolidated Group Tier 1 and Total Capital ratios (no impact to CET1 ratios)2
Estimated pro-forma reduction3 of:
up to 0.7% to Tier 1 ratios (transitional) and 0.8% (fully loaded)
up to 1.8% to Total Capital ratios (transitional) and 2.0% (fully loaded)
The impact of these deductions will reduce as existing subordinated debt is refinanced by BOIG
Existing subordinated debt remain available to absorb losses and expected to count as MREL
Based on current total capital levels and indicative MREL “Informative Target”, modest new MREL issuance expected
1 A reduction in the addback for “Provisions in excess of expected losses on defaulted loans” to Tier 2 capital2 Due to the application of CRR Article 85 & 87
3 Estimated pro-forma Impact as at 31 December 2016 17

SREP requirement for 2018 to be advised in H2 2017Requirement to be reviewed annually
14.4%
1.25%
2.25%
4.5%
8%
Jun 2017 SREP1 2017 2018 2019 2020 2021
Minimum Regulatory Capital RequirementPillar 2 requirements (P2R) Required to maintain a minimum CET1 ratio of 8% on a transitional basis from 1 January 2017 Includes a Pillar 1 requirement of 4.5%, a P2R of 2.25% and a capital conservation buffer for 2017 of 1.25% The CBI (ROI) and FPC (UK) have set the countercyclical buffer (CCyB)2 at 0%Pillar 2 guidance (P2G) is not disclosed in accordance with regulatory preferenceExpect to maintain a CET1 ratio in excess of 12% on a transitional basis and on a fully loaded basis by the end of the phase-in periodIncludes meeting applicable regulatory capital requirements plus an appropriate management buffer
Other emerging and technical capital requirementsIFRS9 is expected to have a negative impact on capital ratios - such impact is expected to be subject to a gradual phase in
(c.3-5years) through the ongoing revision of the EU capital requirements regulation
1SREP and O-SII requirement are subject to annual review by the Single Supervisory Mechanism (SSM) and the Central Bank of Ireland (CBI) respectively 2CCyB is subject to quarterly review by Central Bank of Ireland (ROI) and Financial Policy Committee (UK). On 27 June 2017 the FPC announced that the UK CCyB will increase to 0.5% from June
2018 and that they expect to increase it to 1.0% from November 2018.The Group’s capital requirement will increase in proportion to its level of UK RWA when the CCyB rate increases
Transitional CET1 Ratio
CCB - 1.875% 2.5%
O-SII +0.5%
2.5%
+1.0%
2.5%
+1.5%
Min CET1 Requirement
P2R
CCB
Regulatory Capital RequirementsSupervisory Review and Evaluation Process (SREP1) requirement
+P2G
Capital Conservation Buffer (CCB) of 2.5% phased in over 4 years from 20161.5% O-SII1 Buffer phased in over 3 years from July 2019
18

SRB published methodology3 for calculation of informative MREL target
Regulatory guidance expected in late 2017 / early 2018 on MREL requirements and phase-in period
MREL target is expressed as a percentage of total RWASRB note that ‘MREL “Informative Target” does not consider
bank specific analysis’
Regulatory RequirementsMREL “Informative Target”
19
27.25%
2.75%
10.25%
14.25%
Loss absorption amount
Recapitalisation amount
Market Confidence Charge++
MREL “Informative
Target”
P2R1,2
Own Funds Pillar 1
Requirement
O-SII2 -1.25%
CCB1
O-SII2
CCB1
P2R1,2
Own Funds Pillar 1
Requirement8%
2.25%
8%
2.25%
2.5%
1.5%
2.5%
1.5%
1Capital Conservation Buffer (CCB) and Pillar 2 requirement (P2R) 2P2R and O-SII requirement are subject to annual review by the Single Supervisory Mechanism (SSM) and the Central Bank of Ireland (CBI) respectively
3Source: https://srb.europa.eu/en/node/176
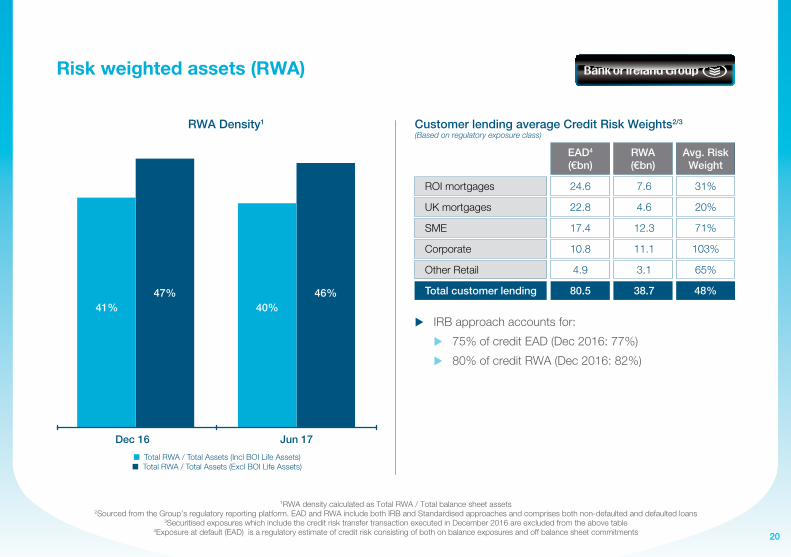
Risk weighted assets (RWA)
47% 46%41% 40%
Dec 16 Jun 17
RWA Density1
IRB approach accounts for:
75% of credit EAD (Dec 2016: 77%)
80% of credit RWA (Dec 2016: 82%)
EAD4
(€bn)RWA(€bn)
Avg. Risk Weight
ROI mortgages
UK mortgages
SME
Corporate
Other Retail
Total customer lending
24.6
22.8
17.4
10.8
4.9
80.5
7.6
4.6
12.3
11.1
3.1
38.7
31%
20%
71%
103%
65%
48%
Customer lending average Credit Risk Weights2/3
(Based on regulatory exposure class)
n Total RWA / Total Assets (Incl BOI Life Assets) n Total RWA / Total Assets (Excl BOI Life Assets)
1RWA density calculated as Total RWA / Total balance sheet assets2Sourced from the Group’s regulatory reporting platform. EAD and RWA include both IRB and Standardised approaches and comprises both non-defaulted and defaulted loans
3Securitised exposures which include the credit risk transfer transaction executed in December 2016 are excluded from the above table4Exposure at default (EAD) is a regulatory estimate of credit risk consisting of both on balance exposures and off balance sheet commitments 20

Corporate Reorganisation implemented; Group holding company (BOIG) introduced on top of the existing Group structure
Continued economic growth in core markets; supporting strong organic capital generation
BOIG assigned investment grade ratings from Moody’s, S&P and Fitch; future senior and junior debt issuance for MREL purposes expected to be issued from BOIG
Robust capital ratios provide significant buffer for credit investors
Based on current total capital levels and MREL “Informative Target”, modest new MREL issuance expected
Capital / MREL Summary Highlights
21

Covered Bond Overview
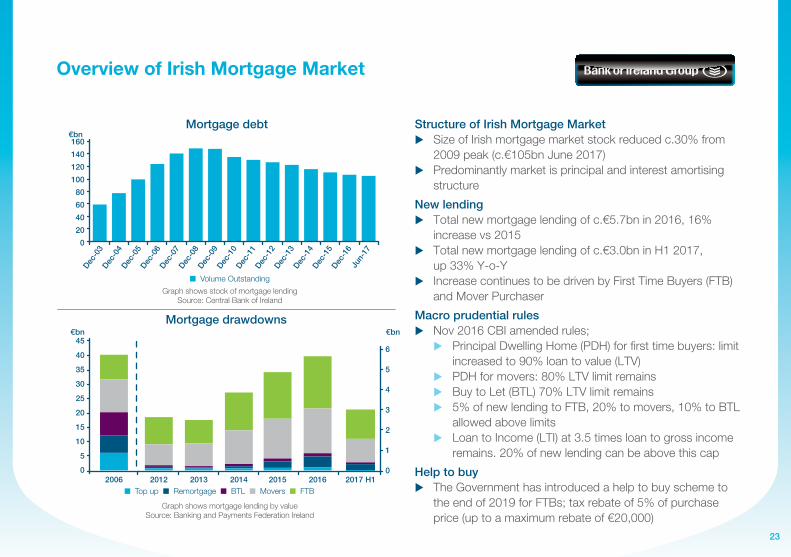
Structure of Irish Mortgage MarketSize of Irish mortgage market stock reduced c.30% from
2009 peak (c.€105bn June 2017)Predominantly market is principal and interest amortising
structure
New lendingTotal new mortgage lending of c.€5.7bn in 2016, 16%
increase vs 2015Total new mortgage lending of c.€3.0bn in H1 2017,
up 33% Y-o-YIncrease continues to be driven by First Time Buyers (FTB)
and Mover Purchaser
Macro prudential rulesNov 2016 CBI amended rules; Principal Dwelling Home (PDH) for first time buyers: limit
increased to 90% loan to value (LTV) PDH for movers: 80% LTV limit remains Buy to Let (BTL) 70% LTV limit remains 5% of new lending to FTB, 20% to movers, 10% to BTL
allowed above limits Loan to Income (LTI) at 3.5 times loan to gross income
remains. 20% of new lending can be above this cap
Help to buyThe Government has introduced a help to buy scheme to
the end of 2019 for FTBs; tax rebate of 5% of purchase price (up to a maximum rebate of €20,000)
Dec-0
3Dec
-04
Dec-0
5Dec
-06
Dec-0
7Dec
-08
Dec-0
9Dec
-10
Dec-1
1Dec
-12
Dec-1
3Dec
-14
Dec-1
5Dec
-16
Jun-
17
Mortgage debt
n Top up n Remortgage n BTL n Movers n FTB
n Volume Outstanding
Overview of Irish Mortgage Market
Mortgage drawdowns
2014 2015 2016 2017 H12006 2012
23
20
5
0
0
40
10
60
15
80
20
100
25
120
30
140
35
160
40
45
5
6
4
3
2
1
0
Graph shows stock of mortgage lending Source: Central Bank of Ireland
Graph shows mortgage lending by valueSource: Banking and Payments Federation Ireland
€bn €bn
€bn
2013

ROI Mortgages: €24.0bn
ROI Mortgages (gross)€25.0bn €24.3bn €24.0bn
1Average customer pay rate of 108bps less Group average cost of funds in 2017 of 41bps 2Note that the LTV on new business includes the impact of the acquired portfolios
3Excludes portfolio acquisitions (H1 2016 - €0.1bn; H2 2016 - €0.1bn; H1 2017 - Nil)4ROI mortgage market share - YTD May 2017
H2 2016H1 2016 H1 2017
New Lending Volumes3
Market share
€0.8bn
24%
€0.6bn
27%
€0.8bn
26%4
Market share
Fixed rate led mortgage pricing strategy which provides value, certainty and stability to our customers and to the Group
Fixed rate products accounted for c.88% of our new lending in H1 2017, up from c.30% in 2014
BOI does not sell through broker channel in ROI
7 in 10 ROI customers who take out a new mortgage take out a life assurance policy through BOI Group
4 in 10 ROI customers who take out a new mortgage take out a general insurance policy through BOI Group with insurance partners
Trackers reduced by €0.6bn since Dec 16; €1.7bn since Dec 15
€10.5bn or 94% of trackers at June 17 are on a capital and interest repayment basis
77% of trackers are owner occupier mortgages; 23% of trackers are Buy to Let mortgages
Loan asset spread on ECB tracker mortgages was c.67bps1 in H1 2017, compared to Group net interest margin (including ECB trackers) of 232bps in H1 2017
Average LTV of 68% on existing mortgage stock at June 2017 (Dec 16: 72%)
Average LTV of 70% on new mortgages in H1 2017 (Dec 16: 67%2)
Jun 17Dec 15 Dec 16
n Tracker n Variable Rates n Fixed Rates
€12.9bn €11.8bn
€8.1bn €7.2bn
€3.9bn €5.3bn€6.3bn
€6.5bn
€11.2bn
24

Mortgage Underwriting ProcessCentralised Underwriting in place, no delegated discretions
Step 1
Customer makes application through Branch or Direct channels (Internet / Phone / Mobile Mortgage Manager)Anti-Money Laundering checks completedInterview completed (face to face if branch or Mobile Mortgage Manager, via telecall if Phone or follow up call if
Internet) Standard application contains assessment of; borrower financial strength (income vs. expenditure, assets
vs. liabilities) plus assessment of transaction including structure (LTV, tenor), security property, overall financial risk etc
Step 2
Auto calls made to Credit Bureau and Risk ModelsUnderwriting receives online application with Bureau and Risk Model output plus supporting
creditworthiness documentsAssessment against Credit Policy and Regulatory requirements
Step 3
Credit decision is madeTypical Max LTV 80% for Owner Occupier and Buy to Let 70% (CBoI Macro-Prudential limits – First Time
Buyer to max. 90% LTV permitted)Appeals process in place for declined applications
Step 4Mortgage Approval Formal letter of offer issued detailing T&Cs
1 2 3 4Customer Application
Customer Credit Analysis
Credit DecisionLoan
Administration
25

Strengths of Irish ACS Legislation Key Legislative Features of Irish ACS
Robust collateral restrictions
Strict ALM requirements
Qualified deposits and EEA mortgages (BOIMB uses only Irish residential mortgages)
LTV limits of 75% for liquidity purposes
Duration, interest and currency matching
Interest rate risk control
Clarity in event of bankruptcy
Preferential claims
Mark to market cover pool
National CSO Residential Property Price Index updated monthly
Requirement to incorporate changes quarterly, monitored externally
NTMA pre-defined manager of cover pool as a last resort
ACS holders are preferred creditors in relation to covered assets
Robust external monitoring
Strong overcollateralisation
(OC)
Minimum contractual OC of 5% and minimum legislative OC of 3%
Both legislative and contractual commitments on a prudent market value basis
Independent Cover-Assets Monitor (CAM) responsible for monitoring the cover pool and the ACS issuer’s compliance with specific provisions of the ACS Acts
Appointment of CAM approved CBI
26

Bank of Ireland Mortgage Bank ACS
Table 1 Cover Pool Summary Dec-14 Dec-15 Dec-16 Jun-17
Total property valuation (bn)
Aggregate balances of the mortgages (bn)
Weighted average indexed LTV
% of accounts in arrears (≥ 3 months)
€21.9
€12.3
82.0%
0.03%
€22.3
€11.2
73.7%
0.01%
€21.3
€10.2
70.7%
0.04%
€21.2
€9.7
67.4%
0.03%
Table 2 Bond Summary Dec-14 Dec-15 Dec-16 Jun-17
Value of bonds (bn)
Nominal overcollateralisation
Prudent market value of mortgages (bn)
Qualified substitution assets (bn)
Prudent market value of cover pool (bn)
Legislative overcollateralisation
€9.0
54%
€10.5
€1.3
€12.0
32%
€7.4
68%
€10.1
€1.1
€11.2
52%
€7.9
44%
€9.3
€1.2
€10.5
32%
€6.9
55%
€9.0
€1.0
€10.0
44%
Key Features of Bank of Ireland Mortgage Bank ACS 100% Irish Residential mortgages
Cover pool marked to market at intervals not exceeding 3 months using Central Statistics Office (CSO) residential Property Price Index
Strong overcollateralisation (OC) – significantly above min contractual OC of 5% and min legislative OC of 3% (both on a prudent market value basis)
BOIMB policy to remove non-performing assets (payment due ≥ 3 months) from the pool on a quarterly basis
Compliance with cover pool obligations monitored by independently regulated Cover Assets Monitor
Pre-defined process in event of insolvency
Covered Bond RatingsStrong covered bond credit ratings;
Moody’s Aa1, DBRS AA (high)
27

Additional Information

Additional Information
29
Slide No. BOI Overview Summary Income Statement 30 Summary Balance Sheet 31 Profile of customer loans at Jun 17 (gross) 32 UK customer loans 33 Income Statement Net interest income analysis 34 Interest Rate Sensitivity 35 Business Transformation – Focus on Retail Ireland 36 Core Banking Platforms Investment Programme 37 Asset Quality Non-performing exposures by portfolio 38 ROI mortgage loan book 39 Non-performing exposures 40 Available for Sale Financial Assets 41 Capital CET1 ratios – June 2017 42 Ordinary stockholders’ equity and TNAV 43 Defined Benefit Pension Schemes 44 Reimbursing and rewarding taxpayer’s support 46 Contact Details 47 Forward-Looking statement 48

1Figures as reported, with the exception of y/e Dec 13 which includes a €5m reduction in Operating expenses relating to IFRIC 21 adjustments
BOI OverviewIncome Statement1
Total income
Net interest incomeOther income (net) before additional gainsAdditional gainsELG fees
Operating expenses1
Core Banking Platforms investment
Levies and regulatory charges
Net impairment charges
Non core items
Statutory (loss) / profit before tax
Share of associates / JVs
Underlying (loss) / profit before tax
Operating profit pre-impairment
NIM
(881)
(55)
(63)
(1,747)
(41)
(109)
(1,545)
-
(31)
y/e Dec 13 (€m)
2,646
2,13354993
(129)
(1,665)
44
(520)
31
(564)
1,070
1.84%
(1,601)
-
(72)
y/e Dec 14(€m)
2,974
2,358448205(37)
(472)
(1)
920
92
921
1,301
2.11%
(1,746)
-
(75)
y/e Dec 15(€m)
3,272
2,454591237(10)
(296)
31
1,232
46
1,201
1,451
2.19%
1,520
1,15135316-
3,105
2,283671171(20)
H1 2017(€m)
y/e Dec 16(€m)
(59)(178)
(39)
1,032
41
1,071
5211,208
18
(25)
455
480
2.32%2.19%
30

1Loans and advances to customers is stated after impairment provisions
BOI OverviewSummary Balance Sheet
Dec 13 (€bn)
Dec 14 (€bn)
Dec 15(€bn)
Jun 17(€bn)
Dec 16(€bn)
Total assets 132 130 131 122123
Wholesale funding
Private SourcesMonetary Authority / TLTRO
27
198
20
164
14
131
13
8
5
14
11
3
Customer deposits 74 75 80 7575
Customer loans1 85 82 85 7778
BOI Life assets
Other assets
14
6
16
7
16
6
1717
67
Liquid assets 27 25 24 2221
Other liabilities 7 8 10 66
Total liabilities & Stockholders’ equity 132 130 131 122123
Subordinated liabilities (incl. AT1)
BOI Life liabilities
2
14
2
16
3
16
22
1717
Loan to deposit ratio 114% 110% 106% 103%104%
Fully loaded CET1 ratio 6.3% 9.3% 11.3% 12.5%12.3%
Stockholders’ equity 8 9 8 99
31

1Based on geographic location of customer 2Includes £0.7bn relating to GB business and corporate loan books, which BOI was required to run down under its EU approved Restructuring Plan (H1 2016: £1.0bn)
BOI OverviewProfile of customer loans1 at Jun 17 (gross)
ROI (€bn)
UK (€bn)
RoW(€bn)
Total(%)
Total(€bn)
Customer loans (gross) 43.7 32.5 3.9 100%80.1
Non-property SME and corporate
SME Corporate
Property and construction
Investment property Land and development
11.5
8.72.8
6.2
5.70.5
4.32
1.92.4
3.0 2.8
0.2
3.8
0.03.8
0.1
0.10.0
24%
13%
11%
12%
11%
1%
19.6
10.6
9.0
9.3
8.6
0.7
Geographic (%) 54% 40% 6% 100%
Mortgages
Consumer
24.0
2.0
23.1
2.1
-
0.0
59%
5%
47.1
4.1
32
Composition (Jun 17)

UK Customer Loans £28.6bn (€33.5bn)
71%
61%
1Data published by the Council Mortgage Lenders (CML) for March 2017 indicates that the proportion of the Retail UK mortgage book in default (defined for CML purposes as greater than 90 days but excluding possessions and receivership cases) is in line with the UK industry average of 1% across all segments (Retail UK equivalent: 1%)
n Performing loans n Non-performing exposures Coverage ratio
Other UK Customer Loans – £8.3bn
UK Mortgages – £20.3bn
Scotland, £0.9bn
Northern Ireland, £1.0bn
Rest of England, £8.8bn
Wales, £0.8bn
Outer Metropolitan,
£2.6bn
Greater London, £4.2bn
South East, £2.0bn
UK Mortgages AnalysisTotal UK mortgages of £20.3bn; (NPEs - 2%; impaired loans - 1%) Average LTV of 61% on total book (2016: 62%) Average LTV of 73% on new mortgages (2016: 71%)UK mortgage book continues to perform in line with industry
averages1
86% of mortgages originated since 2010 are standard owner occupier mortgages
BTL book is well seasoned with 81% of these mortgages originated pre 2009
Average balance of Greater London mortgages is c.£196k. 90% of Greater London mortgages have an average LTV <70%
Other UK Customer Loans AnalysisOther UK loans exposure of £8.3bn; impaired loans of £0.7bn
with strong coverage ratios. Investment Property impaired loans have decreased by 70% in the last 2 years
Performing loans of £7.4bn; SME: broad sectoral diversification with low concentration
risk Corporate: specialist lending teams in Acquisition Finance,
Project Finance, and Corporate lending through a focussed sector strategy
Investment Property: Retail (54%), Office (14%), Residential (15%), Other (17%)
Consumer: largest segment is asset backed motor financing of £1.0bn (55%). Book also includes Post Office / AA branded credit cards and personal loans
£0.01bn
£0.1bn
£0.0bn
£0.2bn
£0.1bn
SME
Investment Property
Corporate
Land & Development
Consumer £1.9bn
£1.9bn
£2.1bn
£1.4bn
£0.6bn
£0.2bn
£1.9bn
£2.5bn
£2.1bn
£1.6bn
41%
100%
56%
33

Income StatementNet interest income analysis
Ireland Loans
UK Loans
C&T Loans
Total Loans & Advances to Customers
Liquid Assets
IFRS Income Classification
Average ECB Base rate in the period
Average 3 month Euribor in the period
Average BOE Base rate in the period
Average 3 month LIBOR in the period
(33) (13) (8)
Total Interest Earning Assets 105.1 99.4 99.31,477 1,371 1,3302.83% 2.74% 2.70%
Net Interest Margin 105.1 99.4 99.31,102 1,135 1,1432.11% 2.27% 2.32%
Total Interest Bearing Liabilities 94.2 89.6 88.7(342) (223) (179)(0.73%) (0.49%) (0.41%)
Ireland Deposits
Credit Balances2
UK Deposits
C&T Deposits
Total Deposits
Wholesale Funding
Subordinated Liabilities
22.1
23.8
24.6
7.7
78.2
13.6
2.4
21.9
25.3
20.7
6.8
74.7
13.4
1.5
20.6
27.1
19.3
6.0
73.0
14.3
1.4
(26)
(1)
(154)
(21)
(202)
(49)
(91)
(17)
(1)
(111)
(14)
(143)
(32)
(48)
(12)
(0)
(78)
(10)
(100)
(44)3
(35)
(0.24%)
(0.01%)
(1.26%)
(0.55%)
(0.52%)
(0.71%)
(7.72%)
(0.15%)
(0.01%)
(1.07%)
(0.41%)
(0.38%)
(0.47%)
(6.13%)
(0.12%)
(0.00%)
(0.81%)
(0.35%)
(0.28%)
(0.62%)
(5.17%)
H1 2016 H2 2016 H1 2017
1Excludes any additional gains from portfolio re-configuration during the period2Credit balances in H1 2017: ROI €20.0bn, UK €3.0bn, C&T €4.1bn
3Includes impact of credit risk transfer transaction executed in December 2016
Average Volumes
(€bn)
Gross Interest
(€m)
Gross Rate(%)
Average Volumes
(€bn)
Gross Interest
(€m)
Gross Rate(%)
Average Volumes
(€bn)
Gross Interest
(€m)
Gross Rate(%)
36.5
33.5
12.6
82.6
22.5
36.0
30.2
12.7
78.9
20.5
35.5
29.5
12.7
77.7
21.6
552
580
253
1,385
921
554
475
264
1,293
781
548
465
251
1,264
661
3.04%
3.48%
4.05%
3.37%
0.82%
3.07%
3.13%
4.13%
3.26%
0.76%
3.12%
3.18%
3.99%
3.28%
0.62%
0.02%
(0.22%)
0.50%
0.59%
0.00%
(0.31%)
0.30%
0.41%
0.00%
(0.33%)
0.25%
0.33%
34

Interest Rate Sensitivity
Estimated sensitivity on Group income (1 year horizon)
100bps higher
100bps lower
c.120m
(c.180m)
c.140m
(c.170m)
35
The table below shows the estimated sensitivity of the Group’s income (before tax) to an instantaneous and sustained 1% parallel movement in interest rates
The estimates are based on management assumptions primarily related to:
the re-pricing of customer transactions;
the relationship, centred around a range, between key official interest rates set by Monetary Authorities and market determined interest rates; and
the assumption of a static balance sheet by size and composition
In addition, changes in market interest rates could impact a range of other items including the valuation of the Group’s IAS19 accounting standard defined benefit pension schemes
Dec 2015 (€m)
Dec 2016 (€m)

Investments will deliver a step change in building a truly customer-centric and efficient organisation
Important milestones have been met during H1 2017 relating to product builds and data consolidation
Ongoing simplification is reducing operational risks and potential customer impacts at data migration stage
Supported by Group-wide technology investments to replace Core Banking Platforms
Digitisation
Delivering digital capability to meet changing customer behaviours and preferences
Business Transformation – Focus on Retail Ireland Transforming today to ensure long term sustainability and competiveness
Current account proposition voted ‘Best Customer Facing Technology’ at 2017 Global Retail Banking awards
75% of customers are digitally active673k active mobile users60% reduction in paper instructions in
H1 201797% of customer transactions via
automated self-service or direct channels
Community
Supporting our customers in their local communities and enterprises
Branches evolving into Business Development Hubs driving local commerce
Market leading youth, diaspora and senior sector propositions
Enterprise events with over 5,000 customers showcasing their businesses in H1 2017
Simplification
Simplifying products and propositions to prepare for new Core Banking Platforms
>65% of new product sales are through direct and digital channels of which 1 out of every 2 new sales are completed digitally
Over 200 customer journeys mapped, simplified and digitised in the last 12 months
100 legacy products retired in H1 2017 with over 400k customers successfully transitioned
36

Core Banking Platforms Investment Programme
Critical enabler to achieving <50% cost income ratio target in medium term
Structural reduction in costs from 2019 onwards
Personalised, interactive propositions supported by customer insights driving increased cross selling opportunities
Risk reduction from robust, flexible and industry leading platforms
Enhanced business agility and efficiencies - easy to change, extend and upgrade
Open architecture and API capability will enable new business and partnership models
Strategic optionality
Programme
Multi-year programme
Investment with a CET1 ratio impact of c.35-45bps p.a. over the next 4 years
>85% of customer accounts in scope
Phased launches to customers commencing in H2 2018
Implementation plan for Core Banking Platforms
Key
Act
iviti
es
Execution
BOI Group in the lead with significant investment in new skills and capabilities
Implementation partners with proven track record
Adopting Temenos UniversalSuite; adapting BOI products and processes
Phased build and phased migration
Strong governance and board oversight
Core Banking Platforms investment will drive sustainable cost efficiencies and growth
2016 2017 2018 2019 2020
Implementing new system and data cleansing
Launch to customers
commences
Phased migration of customer accounts
Decommissioning of legacy systems
and activities
Outcome
37

Non-performing exposures by portfolio
Composition (Jun 17)
Composition (Dec 16)
Residential Mortgages - Republic of Ireland- UK
Non-property SME and Corporate- Republic of Ireland SME- UK SME- Corporate
Property and construction- Investment property- Land and development
Consumer
Residential Mortgages - Republic of Ireland- UK
Non-property SME and Corporate- Republic of Ireland SME- UK SME- Corporate
Property and construction- Investment property- Land and development
Consumer
Total loans and advances to customers
Total loans and advances to customers
Advances(€bn)
Advances(€bn)
47.124.023.1
19.68.81.99.0
9.38.60.7
4.1
48.224.323.9
20.08.81.99.3
10.39.31.0
3.8
80.1
82.4
8.1
9.4
3.2
3.9
2.8
3.4
52%
54%
Non-performing exposures1
(€bn)
Non-performing exposures1
(€bn)
Specific impairment provisions
(€bn)
Specific impairment provisions
(€bn)
Specific impairment provisions as %
of impaired loans
Specific impairment provisions as %
of impaired loans
Impairment provisions
(€bn)
Impairment provisions
(€bn)
5.4
6.2
Impaired loans(€bn)
Impaired loans(€bn)
1.41.30.2
1.81.40.10.3
2.11.70.4
0.1
1.61.50.2
1.81.40.10.3
2.72.00.7
0.1
6.7%
7.6%
Impaired loans as % of advances
Impaired loans as % of advances
3.1%5.3%0.7%
9.1%15.9%6.3%3.0%
22.3%19.7%54.8%
2.4%
3.4%6.0%0.7%
9.1%15.7%6.3%3.5%
25.8%21.1%68.8%
2.7%
3.32.90.5
2.11.70.20.3
2.52.10.4
0.1
3.73.20.5
2.21.70.20.3
3.52.70.7
0.1
0.80.70.1
1.10.80.10.2
1.20.90.3
0.1
1.00.90.1
1.10.80.10.2
1.71.20.5
0.1
0.60.50.0
1.00.80.10.2
1.20.90.3
0.1
0.70.70.0
1.00.80.10.2
1.61.10.5
0.1
39%42%15%
57%56%56%66%
55%53%68%
65%
42%45%15%
55%55%55%54%
61%57%73%
66%
10.1%
11.4%
Non-performing exposures as %
of advances
Non-performing exposures as %
of advances
7.1%12.0%2.0%
10.7%18.8%9.4%3.1%
27.0%24.6%57.7%
2.4%
7.6%13.0%2.1%
11.0%19.1%9.1%3.7%
33.6%29.4%71.6%
2.8%
1The Non-retail portfolio balances at 30 June 2017 include the impact of the reclassification of certain loans between ‘Non-property SME and corporate’ and ‘Property and construction’ during H1 2017. The impact of these changes if applied at 31 December 2016 would be to increase ROI SME non-performing exposures by €146m with a corresponding reduction in Property investment of €70m and Land and development
of €76m. On this basis, ROI SME non-performing exposures would have reduced by €181m, Property investment by €548m and Land and development of €259m in the period to 30 June 2017 38

ROI Mortgages
Portfolio Performance €22.3bn or 93% of mortgages at H1 2017 are on a capital
and interest repayment basis (Dec 16: 93%)
92% of mortgage accounts are in the up to date book; 9 out of 10 accounts in forbearance are meeting the terms of their revised arrangements
Arrears Performance Bank of Ireland >90 day arrears are c.33% of industry
average for both Owner Occupier and Buy to Let
Bank of Ireland >720 day arrears are between 25% - 28% of industry average for both Owner Occupier and Buy to Let
ROI mortgage NPEs reduced by 9% in H1 2017
Impaired loan component of €1.2bn; down 54% since reported June 2013 peak
1As at March 2017, based on number of accounts; industry average excluding BOI
Owner Occupier Buy to letOwner Occupier Buy to let
Industry Average
Industry Average
5.3%
13.5%
1.5%3.4%
>720 days arrears1
>90 days arrears1
Owner Occupier Buy to letOwner Occupier Buy to let
Industry Average
Industry Average
8.5%
18.3%
2.7%6.3%
39

Non-performing exposures at June 2017– €8.1bn
Non-performing exposures (NPE’s) – €8.1bn NPEs are aligned with the EBA definition and include all impaired exposures, exposures >90 days past due but not impaired,
forborne exposures reliant on collateral realisation that are neither impaired nor >90 days past due and other / probationary loans meeting NPE criteria as defined by the EBA
Impaired loans1 are loans with a specific provision attached to them
The Group’s revised asset quality reporting methodology incorporates Forborne Collateral Realisation loans which are loans that are not impaired but where future reliance on the realisation of collateral is expected for the repayment in full of the relevant loans
Net neutral impact on the Group’s capital ratios and impairment provisions
Other/probationary loans are loans that have yet to satisfy exit criteria in line with the EBA guidance to return to performing
1Impaired loans have been modified to remove non-retail accounts that are >90 days past due (Dec 2016: €0.3bn)
Non-performing exposuresGroup aligning with EBA definition of non-performing exposures
Impaired loans, €6.2bn
Forborne Collateral
Realisation, €1.9bn
>90 days past due,
€0.7bn
Other / Probationary,
€0.7bn
Impaired loans, €5.4bn
Forborne Collateral
Realisation, €1.5bn
>90 days past due,
€0.6bn
Other / Probationary,
€0.6bn
Non-performing exposures at Dec 2016 – €9.4bn
40

Asset QualityAvailable for Sale Financial Assets
Portfolio The Group held €12.0bn of AFS financial assets at June 2017; The
Group also held an additional €1.8bn of Irish Government bonds in a held to maturity (HTM) portfolio
AFS Reserve - €0.35bn (HTM: €0.1bn)
In the AFS portfolio the Group holds NAMA subordinated bonds – €0.3bn nominal value, valued at 102% (Dec 16 – 98%). Separately, BOI holds €0.1bn of NAMA senior bonds (Dec 16: €0.5bn)
Weighted average credit rating of the AFS portfolio is AAA to AA; Weighted average credit rating of the HTM portfolio is A
Of the total bond portfolio, 97% is investment grade (>BBB-) and 95% is rated BBB+ or higher
Other exposures - €5.6bnSupra-national (included in senior debt) – €1.7bn
Belgium – €0.7bn
Spain – €0.7bn
Sweden – €0.6bn
Netherlands – €0.4bn
Canada – €0.3bn
Norway – €0.3bn
Italy – €0.2bn
Other – €0.7bn (all less than €0.2bn)
Sovereign bonds
Senior debt
Covered bonds
Subordinated debt
Asset backed securities
Carrying Value
3.0
-
0.1
0.3
-
ROI€bn
0.6
-
0.7
-
0.1
UK€bn
0.8
0.3
0.5
-
-
France€bn
1.6
2.0
2.0
-
-
Other€bn
6.0
2.3
3.3
0.3
0.1
Jun 17€bn
Total 3.4 1.4 1.6 5.6 12.0 10.8
AFS Reserve 0.35 - - - 0.35 0.35
5.2
1.7
3.5
0.3
0.1
Dec 16€bn
41

CRD-IV phasing impactsDeferred tax assets – certain DTAs are deducted at a rate of 30% for 2017, increasing annually at a rate of 10% thereafterPension deficit – addback is phased out at 80% in 2017, and will be fully phased out in 2018Available for sale reserve – unrealised losses and gains are phased in at 80% in 2017, and will be fully phased in by 2018
1Deferred tax assets due to temporary differences are included in other RWA with a 250% risk weighting applied2Other items – the principal items being the cash flow hedge reserve, expected loss deduction, securitisation deduction, 10%/15% threshold deduction and a deduction for a potential dividend
3Other RWA includes RWA relating to non-credit obligations / other assets and RWA arising from the 10%/15% threshold deduction
CapitalCET1 ratios – June 2017
Fully loaded ratioTransitional ratio(€bn)(€bn)
Common Equity Tier 1 Capital 6.17.0
Total equity 9.59.5
Total RWA 48.648.8
Deferred tax1 (1.2)(0.4)
Credit RWA 40.640.6
Pension deficit -0.1
Operational RWA 4.64.6
Available for sale reserve -(0.1)
Market, CVA and other RWA3 3.43.6
National filters -(0.1)Intangible assets and goodwill (0.7)(0.7)Other items2 (0.7)(0.5)
Common Equity Tier 1 ratio 12.5%14.4%
Leverage ratio 6.4%7.2%
Less Additional Tier 1 (0.8)(0.8)
42

Ordinary stockholders’ equity and TNAV
Tangible net asset value Jun 17 (€m)
Dec 16 (€m)
Ordinary stockholders’ equity at end of period 8,6528,597
(691)23
(625)11
Adjustments:
Intangible assets and goodwillOwn stock held for benefit of life assurance policyholders
Tangible net asset value (TNAV) 7,9847,983
Number of ordinary shares in issue at the end of the period (post 30:1 consolidation) 1,0791,079
TNAV per share (€ cent) €7.40 €7.40
Movement in ordinary stockholders’ equity H1 2017(€m)
2016(€m)
Movements:
Profit attributable to stockholders
Distribution on other equity instruments – additional tier 1 coupon
Dividends on preference stock
Available for sale (AFS) reserve movements
Remeasurement of the net defined benefit pension liability
Foreign exchange movements
Cash flow hedge reserve movement
Other movements
371
(24)
(4)
(2)
(70)
(101)
(102)
(13)
793
(73)
(8)
(169)
167
(419)
(4)
2
Ordinary stockholders’ equity at beginning of period 8,5978,308
8,6528,597Ordinary stockholders’ equity at end of period
43

Defined Benefit Pension Schemes
The Group has developed a framework for pension funding and investment decision making as part of its long-term strategic planningManagement of the Group’s sponsored Defined Benefit pensions schemes involves a multi-year programme, categorised into 3
broad areas. Activity in these areas is set out below:
Mix of BSPF Defined Benefit Pension Scheme Assets (%)1
45%62% 62%
11%
22% 21%44%
16% 17%
Dec 16 Jun 17Dec 12
n Listed equities n Diversified assets2 n Credit / LDI / Hedging
n Estimated surplus / (deficit) at Jun 17n Pro-forma position following €210m expected cash or other suitable assets contribution to BSPF
1Graphs shows BSPF asset allocation. BSPF represents approx. 76% of Group assets 2Diversified assets include infrastructure, private equity, hedge funds and property
BSPF Surplus / Deficit under Relevant Bases Jun 17
Actuarial / on-going basis
IAS19
Minimum funding standard
€48m
€5.3bn€4.0bn €5.7bn
€258m
(€280m)
(€70m)
(€258m)
(€48m)
Reduce LiabilitiesDefined Benefit (‘DB’) Pension schemes closed to new members in 2007
and hybrid scheme introducedPensions Review 2010 and 2013 reducing liabilities by c.€1.2bn - shared
solutions with DB members - successfully executed and extended to smaller schemes in 2014 and 2015
A Defined Contribution (‘DC’) Pension scheme was introduced in 2014 for new hires and the existing hybrid scheme closed to new members
Enhanced transfer value exercises completed for BAPF and BSPF schemes in 2015 and 2016
Increase Assets>€890m of asset contributions made since 2010; further c.€260m
expected to be made across Group schemes between 2017 and 2020 BSPF asset returns of +4.9% p.a. were achieved over 3 years to end
Jun 17 despite market volatility
Improve correlation between assets and liabilitiesReduced deficit sensitivity to both euro and sterling interest rate and
inflation rate movements through increased hedgingGroup supported the Trustees of BSPF and Group UK schemes in their
decisions to extend the level of euro and sterling interest rate and inflation hedging to 75% of assets
The Group has also supported the Trustees of the BAPF scheme in increasing the allocation to liability matching assets and reducing the exposure to equities without reducing target return
Group has continued to support Trustees in diversifying asset portfolios away from listed equity into other return-seeking but potentially less volatile asset classes
44

IAS19 Pension deficit of €0.49bn at Jun 2017Discount rate increased by 10bps to 2.3% - reflecting higher interest
rates and tighter credit spreadsThe primary drivers of the movement in the deficit were: The net positive impact of higher interest rates (which reduced
liabilities albeit significantly offset by the hedging LDI assets); Modest growth in the value of other assets (i.e. listed equities and
diversified assets); Deficit reducing contributions of €40m; offset by; c.20bps decrease in the credit spreads used by the Group to value
its liabilities
Potential for interest rate volatility reducedGroup supported the Trustees of BSPF and Group UK schemes in their
decisions in early 2017 to extend the level of euro and sterling interest rate and inflation hedging to 75% of assets
Continuing programme to further match asset allocation with the evolving nature and duration of liabilities
Pension Review ProgrammesThe Pension Review programmes of 2010 and 2013 resulted in
significant restructurings of scheme liabilities Liability reduction of c.€1.2bn achieved through these programmes Accepted by staff and unions through individual member consent
with comprehensive communications campaign completed In return for liability reduction achieved, the Group agreed to
increase its support for the schemes by making matching contributions of €1.2bn. Asset contributions of c.€260m remain to be made between 2017 and 2020 with no impact on fully loaded CET1 ratio where schemes are in deficit
IAS19 requires that the rate used to discount Defined Benefit pension liabilities be selected by reference to market yields on high quality corporate bonds with a corresponding duration. However, only a small number of long duration AA Euro corporate bonds are in issuance and those bonds tend to be relatively illiquid
Defined Benefit Pension Schemes
n IAS19 DB Pension Deficit EUR Discount Rate
Group IAS19 Defined Benefit Pension Deficit
IAS19 Pension Deficit Sensitivities
(June 2016 / Dec 2016 / June 2017)
€0.99bn
€0.74bn
€1.19bn
Jun 16 Dec 16 Jun 17Dec 14
Interest Rates1 Credit Spreads2 Inflation3 Global Equity4
€0.45bn €0.49bn
Dec 15
2.30%2.20%1.60%
2.20% 2.30%
1Sensitivity of Group deficit to a 0.25% decrease in interest rates2Sensitivity of IAS19 liabilities to a 0.10% decrease in credit spreads3Sensitivity of Group deficit to a 0.10% increase in long term inflation
4Sensitivity of Group deficit to a 5% decrease in global equity markets with allowance for other correlated diversified asset classes
€313m
€122m€176m
€55m€124m€111m
€27m
€121m€173m €162m €153m
€71m
45

Reimbursing and rewarding taxpayer’s support
c.€4.8bn
c.14% Shareholding
c.€6.0bn
+
Cash invested by the State
Cash returned to date
Jan 09 – Jun 17 From 2009 - 2011, c.€4.8bn cash invested by the State
Cumulative c.€6bn cash returned to the State
State continues to hold valuable c.14% equity shareholding
State Aid completely repaid in 2013
Irish State’s risk exposure to Group liabilities covered under the Eligible Liabilities Guarantee eliminated
In H1 2017, the Group paid taxes of €96m to the Irish State and collected taxes of €455m on behalf of the Irish State
46

Contact details
47
For further information please contact:
Group Chief Financial Officer Andrew Keating tel: +353 76 623 5141 [email protected]
Investor Relations Alan Hartley tel: +353 76 623 4850 [email protected]
Niall Murphy tel: +353 76 624 1385 [email protected]
Group Treasurer Sean Crowe tel: +353 76 623 4720 [email protected]
Capital Management Brian Kealy tel: +353 76 623 4719 [email protected]
Alan McNamara tel: +353 76 624 8725 [email protected]
Wholesale Funding Darach O’Leary tel: +353 76 624 4224 [email protected]
Redmond O’Leary tel: +353 76 62 44198 [email protected]
Joanne Guerin tel: +353 76 62 44219 [email protected]
Investor Relations website www.bankofireland.com/investor

Forward-Looking statement
48
This document contains certain forward-looking statements with respect to certain of the Bank of Ireland Group’s (the ‘Group’) plans and its current goals and expectations relating to its future financial condition and performance, the markets in which it operates, and its future capital requirements. These forward-looking statements often can be identified by the fact that they do not relate only to historical or current facts. Generally, but not always, words such as ‘may,’ ‘could,’ ‘should,’ ‘will,’ ‘expect,’ ‘intend,’ ‘estimate,’ ‘anticipate,’ ‘assume,’ ‘believe,’ ‘plan,’ ‘seek,’ ‘continue,’ ‘target,’ ‘goal,’ ‘would,’ or their negative variations or similar expressions identify forward-looking statements, but their absence does not mean that a statement is not forward-looking.
Examples of forward-looking statements include among others, statements regarding the Group’s near term and longer term future capital requirements and ratios, level of ownership by the Irish Government, loan to deposit ratios, expected impairment charges, the level of the Group’s assets, the Group’s financial position, future income, business strategy, projected costs, margins, future payment of dividends, the implementation of changes in respect of certain of the Group’s pension schemes, estimates of capital expenditures, discussions with Irish, United Kingdom, European and other regulators and plans and objectives for future operations. Such forward-looking statements are inherently subject to risks and uncertainties, and hence actual results may differ materially from those expressed or implied by such forward-looking statements.
Investors should read ‘Principal risks and uncertainties’ in the Group’s Interim Report for the six months ended 30 June 2017 beginning on page 40 and also the discussion of risk in the Group’s Annual Report for the year ended 31 December 2016.
Nothing in this document should be considered to be a forecast of future profitability or financial position and none of the information in this document is or is intended to be a profit forecast or profit estimate. Any forward-looking statement speaks only as at the date it is made. The Group does not undertake to release publicly any revision to these forward-looking statements to reflect events, circumstances or unanticipated events occurring after the date hereof.

