companhia vale do rio doce and financial review and prospects.....77 results of operations – 2007...
TRANSCRIPT

As filed with the Securities and Exchange Commission on May 13, 2008
UNITED STATES SECURITIES AND EXCHANGE COMMISSION Washington, D.C. 20549
Form 20-F ANNUAL REPORT PURSUANT TO SECTION 13 OR 15(d)
OF THE SECURITIES EXCHANGE ACT OF 1934 For the fiscal year ended: December 31, 2007
Commission file number: 001-15030
COMPANHIA VALE DO RIO DOCE (Exact name of Registrant as specified in its charter)
Federative Republic of Brazil (Jurisdiction of incorporation or organization)
Fabio de Oliveira Barbosa, Chief Financial Officer fax: +55 21 3814 8820
Avenida Graça Aranha, No. 26 20030-900 Rio de Janeiro, RJ, Brazil (Address of principal executive offices)
Securities registered or to be registered pursuant to Section 12(b) of the Act:
Title of Each Class Name of Each Exchange on
Which Registered
Preferred class A shares of Vale, no par value per share New York Stock Exchange* American Depositary Shares (evidenced by American depositary receipts), each representing one preferred class A
share of Vale New York Stock Exchange Common shares of Vale, no par value per share New York Stock Exchange* American Depositary Shares (evidenced by American depositary receipts), each representing one common share of Vale New York Stock Exchange 6.875% Guaranteed Notes due 2036, issued by Vale Overseas New York Stock Exchange 8.250% Guaranteed Notes due 2034, issued by Vale Overseas New York Stock Exchange 6.250% Guaranteed Notes due 2017, issued by Vale Overseas New York Stock Exchange 6.250% Guaranteed Notes due 2016, issued by Vale Overseas New York Stock Exchange 5.500% Mandatorily Convertible Guaranteed Notes due 2010, series RIOP, issued by Vale Capital New York Stock Exchange 5.500% Mandatorily Convertible Guaranteed Notes due 2010, series RIO, issued by Vale Capital New York Stock Exchange
* Shares are not listed for trading, but only in connection with the registration of American Depositary Shares pursuant to the requirements of the New York Stock Exchange.
Securities registered or to be registered pursuant to Section 12(g) of the Act: None Securities for which there is a reporting obligation pursuant to Section 15(d) of the Act: None The number of outstanding shares of each class of stock of Vale as of December 31, 2007 was:
2,999,797,716 common shares, no par value per share 1,919,516,400 preferred class A shares, no par value per share
12 golden shares, no par value per share Indicate by check mark if the registrant is a well-known seasoned issuer, as defined in Rule 405 of the Securities Act.
Yes No If this report is an annual or transition report, indicate by check mark if the registrant is not required to file reports pursuant to Section 13 or
15(d) of the Securities Exchange Act of 1934. Yes No
Indicate by check mark whether the registrant (1) has filed all reports required to be filed by Section 13 or 15(d) of the Securities Exchange Act of 1934 during the preceding 12 months (or for such shorter period that the registrant was required to file such reports) and (2) has been subject to such filing requirements for the past 90 days.
Yes No Indicate by check mark whether the registrant is a large accelerated filer, an accelerated filer, or a non-accelerated filer. See definition of
“accelerated filer and large accelerated filer” in Rule 12b-2 of the Exchange Act. (Check one): Large accelerated filer Accelerated filer Non-accelerated filer
Indicate by check mark which basis of accounting the registrant has used to prepare the financial statements included in this filing: U.S. GAAP International Financial Reporting Standards as issued by the International Accounting Standards Board Other If “Other” has been checked in response to the previous question, indicate by check mark which financial statement item the registrant has
elected to follow. Item 17 Item 18
If this is an annual report, indicate by check mark whether the registrant is a shell company (as defined in Rule 12b-2 of the Exchange Act). Yes No
i
TABLE OF CONTENTS
Presentation of financial information ............................................................................................................................1 Forward-looking statements ..........................................................................................................................................2 PART I..........................................................................................................................................................................3 Item 1. Identity of directors, senior management and advisors ...................................................................................3 Item 2. Offer statistics and expected timetable............................................................................................................3 Item 3. Key information ..............................................................................................................................................3
Selected financial data.....................................................................................................................................3 Risk factors......................................................................................................................................................5
Item 4. Information on the company .........................................................................................................................14 Business overview.........................................................................................................................................14
General .....................................................................................................................................................14 Business strategy ......................................................................................................................................15 Significant changes in our business..........................................................................................................17
Lines of business ...........................................................................................................................................20 Ferrous minerals .......................................................................................................................................22
Iron ore .................................................................................................................................................22 Iron ore pellets......................................................................................................................................25 Manganese ore......................................................................................................................................28 Ferroalloys............................................................................................................................................29
Non-ferrous minerals................................................................................................................................30 Nickel ...................................................................................................................................................30 Aluminum.............................................................................................................................................35 Copper ..................................................................................................................................................38 PGMs and other precious metals ..........................................................................................................40 Other non-ferrous minerals...................................................................................................................40
Coal ..........................................................................................................................................................42 Logistics ...................................................................................................................................................44 Other investments.....................................................................................................................................47
Reserves ........................................................................................................................................................50 Regulatory Matters ........................................................................................................................................61 Capital expenditures ......................................................................................................................................76
Item 4A. Unresolved staff comments ..........................................................................................................................77 Item 5. Operating and financial review and prospects.................................................................................................77
Overview .......................................................................................................................................................77 Results of operations – 2007 compared to 2006............................................................................................83 Results of operations – 2006 compared to 2005............................................................................................89 Liquidity and capital resources......................................................................................................................96 Shareholder debentures .................................................................................................................................98 Contractual obligations..................................................................................................................................99 Off-balance sheet arrangements ....................................................................................................................99 Critical accounting policies and estimates...................................................................................................100
Item 6. Directors, senior management and employees .............................................................................................103 Board of Directors.......................................................................................................................................103 Executive officers........................................................................................................................................106 Fiscal council...............................................................................................................................................108 Advisory committees...................................................................................................................................110 Compensation of directors, executive officers, fiscal council members and advisory committees.............111 Employees ...................................................................................................................................................112
Item 7. Major shareholders and related party transactions .......................................................................................113 Major shareholders......................................................................................................................................113 Related Party Transactions..........................................................................................................................116

ii
Item 8. Financial information ...................................................................................................................................117 Legal Proceedings .......................................................................................................................................117 Distributions ................................................................................................................................................119
Item 9. The offer and listing .....................................................................................................................................120 Share price history.......................................................................................................................................120 Stock trading markets..................................................................................................................................121
Item 10. Additional information ................................................................................................................................121 Memorandum and articles of association ....................................................................................................121 Common shares and preferred shares..........................................................................................................122 Material contracts ........................................................................................................................................128 Exchange Controls and Other Limitations Affecting Security Holders ......................................................129 Taxation.......................................................................................................................................................130 Documents on display .................................................................................................................................136
Item 11. Quantitative and qualitative disclosure about market risk..........................................................................136 Item 12. Descriptino of securities other than quality securities ................................................................................144 PART II ....................................................................................................................................................................144 Item 13. Defaults, dividend arrearages and delinquencies........................................................................................144 Item 14. Material modifications to the rights of security holders and use of proceeds.............................................144 Item 15. Controls and procedures .............................................................................................................................144
Evaluation of disclosure controls and procedures .......................................................................................144 Management Report on Internal Control Over Financial Reporting ...........................................................144 Changes in internal controls ........................................................................................................................145
Item 16A. Audit committee financial expert ............................................................................................................145 Item 16B. Code of ethics ..........................................................................................................................................145 Item 16C. Principal accountant fees and services.....................................................................................................146
Principal accountant fees.............................................................................................................................146 Audit Committee Pre-Approval Policies And Procedures ..........................................................................146
Item 16D. Exemptions from the listing standards for audit committees...................................................................146 Item 16E. Purchases of equity securities by the issuer and affiliate purchasers .......................................................146 PART III...................................................................................................................................................................147 Item 17. Financial statements ...................................................................................................................................147 Item 18. Financial statements ...................................................................................................................................147 Item 19. Exhibits.......................................................................................................................................................147 Glossary 148 Signatures ..................................................................................................................................................................154 Index to consolidated financial statements ................................................................................................................ F-1
1
PRESENTATION OF FINANCIAL INFORMATION
We have prepared our financial statements appearing in this annual report in accordance with generally accepted accounting principles in the United States (U.S. GAAP), which differ in certain respects from accounting practices adopted in Brazil (Brazilian GAAP). Brazilian GAAP is determined by the requirements of Law No. 6,404, dated December 15, 1976, as amended, which we refer to as the Brazilian Corporation Law, and the rules and regulations of the Brazilian Securities Commission ( Comissão de Valores Mobiliários ), or CVM.
We also publish Brazilian GAAP financial statements and use them for reports to Brazilian shareholders, CVM filings, determining dividend payments and determining our tax liability. In December 2007, significant changes were made to the Brazilian Corporate Law to permit Brazilian GAAP to converge with International Financial Reporting Standards (“IFRS”). The changes will take effect for the fiscal year ended December 31, 2008. The impact on the BR GAAP income statement could include: a change in the means of calculating and amortizing goodwill, the recognition of exchange variations by foreign subsidiaries, the accounting for joint ventures and affiliates, and related tax effects. Detailed regulation outlining the impact on BR GAAP and transition requirements is not yet available.
Our financial statements and the other financial information appearing in this annual report have been translated from Brazilian reais into U.S. dollars on the basis explained in Note 3 to our financial statements, unless we indicate otherwise.
__________________
References to “real,” “reais” or “R$” are to Brazilian reais (plural) and to the Brazilian real (singular), the official currency of Brazil. References to “U.S. dollars” or “US$” are to United States dollars.
Unless otherwise specified, we use metric units.
References to “Vale” are to Companhia Vale do Rio Doce. References to “us” or “we” are to Vale and, except where the context otherwise requires, its consolidated subsidiaries. References to “Inco” are to Inco Limited, which we acquired in October 2006. We changed Inco’s name to Vale Inco Limited (“Vale Inco”) in November 2007.
References to our “ADSs” or “American Depositary Shares” include both our common American Depositary Shares (our common ADSs), each of which represents one common share of Vale, and our preferred American Depositary Shares (our preferred ADSs), each of which represents one preferred class A share of Vale. American Depositary Shares are represented by American depositary receipts (ADRs) issued by the depositary.

2
FORWARD-LOOKING STATEMENTS
This annual report contains statements that may constitute forward-looking statements within the meaning of the safe harbor provisions of the U.S. Private Securities Litigation Reform Act of 1995. Many of those forward-looking statements can be identified by the use of forward-looking words such as “anticipate,” “believe,” “could,” “expect,” “should,” “plan,” “intend,” “estimate” and “potential,” among others. Those statements appear in a number of places and include statements regarding our intent, belief or current expectations with respect to:
• our direction and future operation;
• the implementation of our principal operating strategies, including our potential participation in privatization, acquisition or joint venture transactions or other investment opportunities;
• our acquisition or divestiture plans;
• the implementation of our financing strategy and capital expenditure plans;
• the exploration of mineral reserves and development of mining facilities;
• the depletion and exhaustion of mines and mineral reserves;
• trends in commodity prices and demand for commodities;
• the future impact of competition and regulation;
• the declaration or payment of dividends;
• industry trends, including the direction of prices and expected levels of supply and demand;
• other factors or trends affecting our financial condition or results of operations; and
• the factors discussed under Item 3. Key information—Risk factors.
We caution you that forward-looking statements are not guarantees of future performance and involve risks and uncertainties. Actual results may differ materially from those in the forward-looking statements as a result of various factors. These risks and uncertainties include factors relating to (a) the countries in which we operate, especially Brazil and Canada, (b) the global economy, (c) the financial markets, (d) the iron ore and nickel businesses and their dependence on the global steel industry, which is cyclical in nature, and (e) the highly competitive industries in which we operate. For additional information on factors that could cause our actual results to differ from expectations reflected in forward-looking statements, see Item 3. Key information—Risk factors. Forward-looking statements speak only as of the date they are made, and we do not undertake any obligation to update them in light of new information or future developments. All forward-looking statements attributed to us or a person acting on our behalf are expressly qualified in their entirety by this cautionary statement, and you should not place undue reliance on any forward-looking statement.
3
PART I
Item 1. Identity of directors, senior management and advisors
Not applicable.
Item 2. Offer statistics and expected timetable
Not applicable.
Item 3. Key information
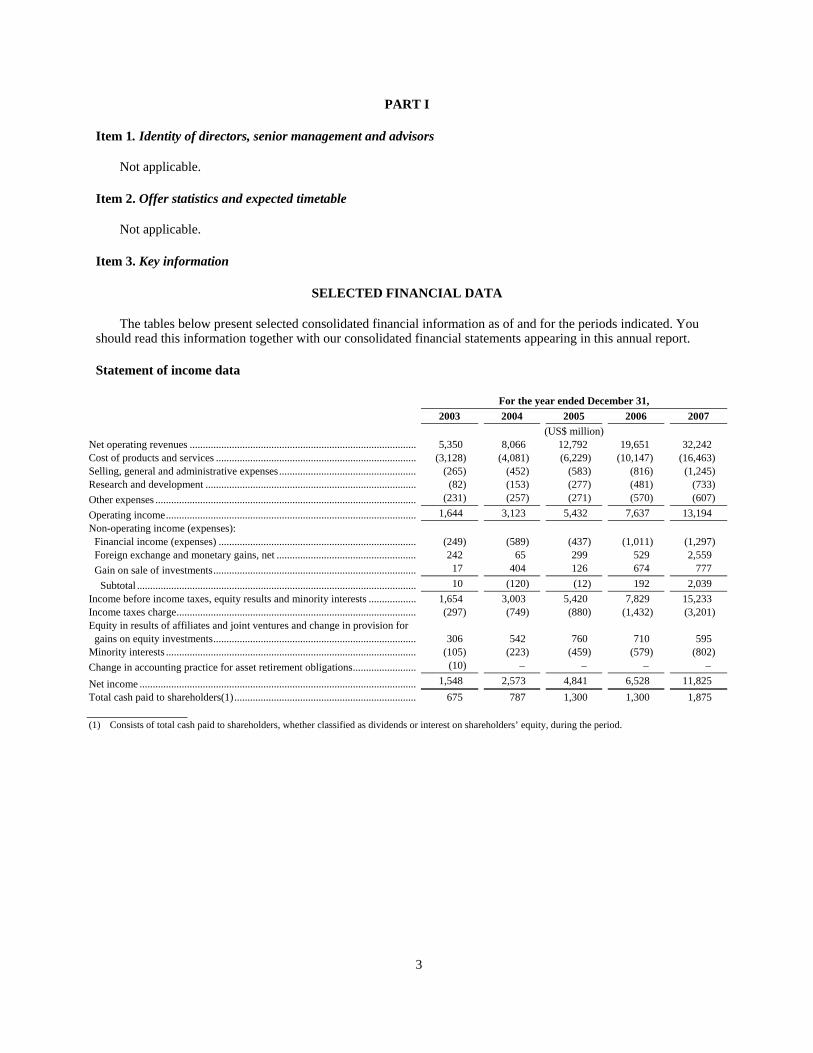
SELECTED FINANCIAL DATA
The tables below present selected consolidated financial information as of and for the periods indicated. You should read this information together with our consolidated financial statements appearing in this annual report.
Statement of income data
For the year ended December 31, 2003 2004 2005 2006 2007 (US$ million) Net operating revenues ...................................................................................... 5,350 8,066 12,792 19,651 32,242 Cost of products and services ............................................................................ (3,128) (4,081) (6,229) (10,147) (16,463) Selling, general and administrative expenses.................................................... (265) (452) (583) (816) (1,245) Research and development ................................................................................ (82) (153) (277) (481) (733) Other expenses ................................................................................................... (231) (257) (271) (570) (607) Operating income............................................................................................... 1,644 3,123 5,432 7,637 13,194 Non-operating income (expenses):
Financial income (expenses) ........................................................................... (249) (589) (437) (1,011) (1,297) Foreign exchange and monetary gains, net ..................................................... 242 65 299 529 2,559 Gain on sale of investments............................................................................. 17 404 126 674 777
Subtotal .......................................................................................................... 10 (120) (12) 192 2,039 Income before income taxes, equity results and minority interests .................. 1,654 3,003 5,420 7,829 15,233 Income taxes charge........................................................................................... (297) (749) (880) (1,432) (3,201) Equity in results of affiliates and joint ventures and change in provision for
gains on equity investments............................................................................. 306 542 760 710 595 Minority interests ............................................................................................... (105) (223) (459) (579) (802) Change in accounting practice for asset retirement obligations........................ (10) – – – –
Net income ......................................................................................................... 1,548 2,573 4,841 6,528 11,825 Total cash paid to shareholders(1)..................................................................... 675 787 1,300 1,300 1,875 (1) Consists of total cash paid to shareholders, whether classified as dividends or interest on shareholders’ equity, during the period.
4
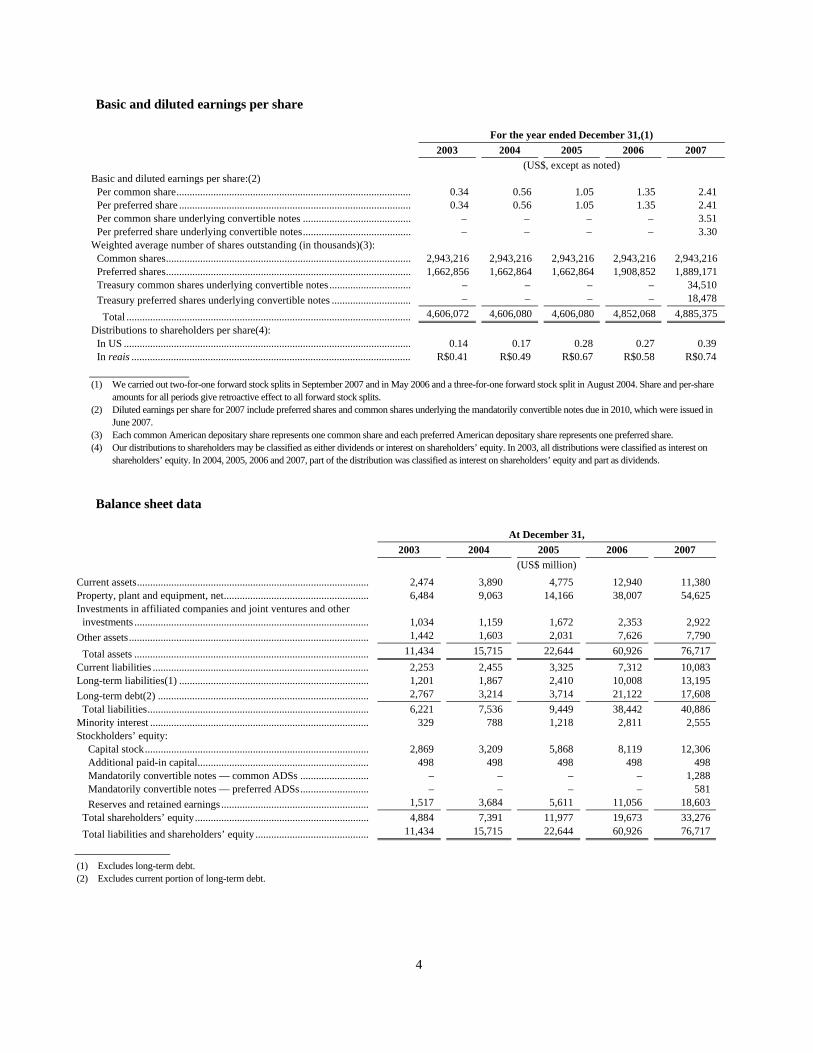
Basic and diluted earnings per share
For the year ended December 31,(1) 2003 2004 2005 2006 2007
(US$, except as noted) Basic and diluted earnings per share:(2)
Per common share......................................................................................... 0.34 0.56 1.05 1.35 2.41 Per preferred share ........................................................................................ 0.34 0.56 1.05 1.35 2.41 Per common share underlying convertible notes ......................................... – – – – 3.51 Per preferred share underlying convertible notes......................................... – – – – 3.30
Weighted average number of shares outstanding (in thousands)(3): Common shares............................................................................................. 2,943,216 2,943,216 2,943,216 2,943,216 2,943,216 Preferred shares............................................................................................. 1,662,856 1,662,864 1,662,864 1,908,852 1,889,171 Treasury common shares underlying convertible notes............................... – – – – 34,510 Treasury preferred shares underlying convertible notes .............................. – – – – 18,478
Total ............................................................................................................ 4,606,072 4,606,080 4,606,080 4,852,068 4,885,375 Distributions to shareholders per share(4):
In US ............................................................................................................. 0.14 0.17 0.28 0.27 0.39 In reais .......................................................................................................... R$0.41 R$0.49 R$0.67 R$0.58 R$0.74
(1) We carried out two-for-one forward stock splits in September 2007 and in May 2006 and a three-for-one forward stock split in August 2004. Share and per-share
amounts for all periods give retroactive effect to all forward stock splits. (2) Diluted earnings per share for 2007 include preferred shares and common shares underlying the mandatorily convertible notes due in 2010, which were issued in
June 2007. (3) Each common American depositary share represents one common share and each preferred American depositary share represents one preferred share. (4) Our distributions to shareholders may be classified as either dividends or interest on shareholders’ equity. In 2003, all distributions were classified as interest on
shareholders’ equity. In 2004, 2005, 2006 and 2007, part of the distribution was classified as interest on shareholders’ equity and part as dividends.
Balance sheet data
At December 31, 2003 2004 2005 2006 2007 (US$ million) Current assets........................................................................................ 2,474 3,890 4,775 12,940 11,380 Property, plant and equipment, net....................................................... 6,484 9,063 14,166 38,007 54,625 Investments in affiliated companies and joint ventures and other
investments ......................................................................................... 1,034 1,159 1,672 2,353 2,922 Other assets........................................................................................... 1,442 1,603 2,031 7,626 7,790
Total assets ......................................................................................... 11,434 15,715 22,644 60,926 76,717 Current liabilities .................................................................................. 2,253 2,455 3,325 7,312 10,083 Long-term liabilities(1) ........................................................................ 1,201 1,867 2,410 10,008 13,195 Long-term debt(2) ................................................................................ 2,767 3,214 3,714 21,122 17,608
Total liabilities.................................................................................... 6,221 7,536 9,449 38,442 40,886 Minority interest ................................................................................... 329 788 1,218 2,811 2,555 Stockholders’ equity:
Capital stock..................................................................................... 2,869 3,209 5,868 8,119 12,306 Additional paid-in capital................................................................. 498 498 498 498 498 Mandatorily convertible notes — common ADSs .......................... – – – – 1,288 Mandatorily convertible notes — preferred ADSs.......................... – – – – 581 Reserves and retained earnings........................................................ 1,517 3,684 5,611 11,056 18,603
Total shareholders’ equity.................................................................. 4,884 7,391 11,977 19,673 33,276 Total liabilities and shareholders’ equity ........................................... 11,434 15,715 22,644 60,926 76,717
(1) Excludes long-term debt. (2) Excludes current portion of long-term debt.

5
RISK FACTORS
Risks relating to our business
A decline in demand for steel would adversely affect our business.
Demand for our most important products depends on global demand for steel. Iron ore and iron ore pellets, which together accounted for 44.2% of our 2007 gross revenues, are used to produce carbon steel. Nickel, which accounted for 30.3% of our 2007 gross revenues, is used mainly to produce stainless steel. Demand for steel depends heavily on global economic conditions, but it also depends on a variety of regional and sectoral factors, and demand for stainless steel is partly independent of demand for carbon steel. The prices of different steels and the performance of the global steel industry are highly cyclical, and these business cycles in the steel industry affect demand and prices for our products.
In recent years, growing worldwide demand for carbon steel has led to strong demand and rising prices for iron ore and iron ore pellets. However, in the event of a sustained decline in prices or sales volumes for iron ore and iron ore pellets would have a material adverse effect on our revenues and earnings. Consolidation in the steelmaking industry may lead to backward integration, which could reduce the global seaborne trade of iron ore.
Growing demand for stainless steel has contributed to strong demand and rising prices for nickel, leading to record-high nickel prices in the second quarter of 2007. In response to high prices, producers and consumers of stainless steel have been shifting to stainless steels with lower nickel content. A sustained decline in austenitic stainless steel production, which could potentially result from a technological development that reduces the amount of nickel required in stainless steel, would have a material adverse effect on our revenues from nickel.
Adverse economic developments in our principal markets, especially China, could reduce demand for our products, leading to lower revenues and profitability.
The global economy is the primary driver of demand in the global market for minerals and metals. In recent years, China has been the main driver of minerals and metals demand and of our sales increases. In 2007, China represented approximately 49% of the global demand for seaborne iron ore, 24.2% of global demand for nickel, 33% for aluminum and 26.3% for copper.
The percentage of our gross revenues attributable to sales to customers in China was 17.7% in 2007. The percentage of our gross revenues attributable to sales to customers from Asian countries other than China was 23.3% in 2007. The percentage of our gross revenues attributable to sales to European customers was 22.1% in 2007. A weakened global economy or a weakened economy in specific markets where we sell our products, such as China, could reduce demand for our products, leading to lower revenues and profitability.
The prices of nickel, aluminum and copper, which are actively traded on world commodity exchanges, are subject to significant volatility.
Nickel, aluminum and copper are sold in an active global market and traded on commodity exchanges, such as the London Metal Exchange and the New York Mercantile Exchange. Prices for these metals are subject to significant fluctuations and are affected by many factors, including actual and expected global macroeconomic and political conditions, levels of supply and demand, the availability and cost of substitutes, inventory, investments by commodity funds and others and actions of participants in the commodity markets. Prices for these metals are more volatile than contractual prices for products such as iron ore, iron ore pellets and metallurgical coal, because they respond more quickly to actual and expected changes in market conditions.
Increased substitution of primary nickel could adversely affect our nickel business.
Demand for primary nickel may be negatively impacted by the substitution of primary nickel with other materials in current applications. Scrap nickel competes directly with primary nickel as a source of nickel for use in the production of stainless steel, and the choice between them is largely driven by their relative prices and availability. In 2007, the stainless steel scrap ratio is estimated to have remained unchanged compared to 2006, at 48%. Nickel pig iron, a product developed by Chinese steel and alloy makers that utilizes low-grade lateritic nickel
6
ores, competes with other nickel sources in the production of stainless steel. In 2007, nickel pig iron represented an estimated 6% of world primary nickel supply, compared to 2% in 2006.
A reduction of global demand for Brazilian steel or agriculture products could reduce the demand for our logistics services.
The Brazilian agriculture and steel industries are currently the primary drivers of demand for our logistics services to customers. The percentage of our logistics revenues attributable to these industries was 83.9% in 2007. A reduction in world demand for Brazilian steel or agricultural products could reduce demand for our logistics services and harm the profitability of our logistics business.
We may not be able to successfully integrate our acquired businesses.
We have grown our business in part through acquisitions, and some of our future growth may also stem from acquisitions. We may not be able to successfully integrate acquired businesses or generate the cost savings and synergies anticipated, which could negatively affect our financial condition and results of operations.
The mining industry is intensely competitive, and we may have difficulty effectively competing with other mining companies in the future.
Intense competition characterizes the global mining industry. We compete with a large number of mining companies. Some of them possess substantial mineral deposits at locations closer to our principal customers. Competition from other producers may result in our loss of market share and revenues.
Demand for our products in peak periods may outstrip our production capacity, rendering us unable to satisfy customer demand.
Our ability to rapidly increase production capacity to satisfy increases in demand for our products is limited. In periods when customer demand exceeds our production capacity, we may meet excess customer demand by reselling iron ore, iron ore pellets or nickel purchased from joint ventures or unrelated parties. If we are unable to satisfy excess customer demand in this way, we may lose customers. We may be unable to complete expansion and greenfield projects in time to take advantage of the current high levels of worldwide demand for iron ore and nickel.
We have been operating at or above full capacity in our iron ore systems since 2003. As a result, disruptions in operations in any part of our integrated systems, or maintenance programs that require more time than expected, could result in lower volumes and lower revenues. In addition, operating at or above full capacity may expose us to higher costs, including demurrage fees due to capacity restraints in our logistics systems.
Political, economic, regulatory and social conditions in the countries in which we operate or have projects could adversely impact our business and the market price of our securities.
Our financial performance may be negatively affected by general economic, political, regulatory and social conditions in countries in which we have significant operations or projects, particularly Brazil, Canada, Indonesia, Australia, New Caledonia and Mozambique. Actual or potential political changes and changes in economic policy may undermine investor confidence, result in economic slowdowns and otherwise adversely affect the economic and other conditions under which we operate in ways that could have a material adverse effect on our business. Governments in emerging economies such as Brazil, Indonesia and New Caledonia frequently intervene in the economy and occasionally make substantial changes in policy that could adversely affect exchange rates, inflation, interest rates, rates of taxes or royalties and the economic and regulatory environment in which we operate. In New Caledonia, a planned referendum in 2014 may result in New Caledonia becoming fully independent from France, which could result in significant political and economic changes in New Caledonia and may adversely affect our Goro project. See Item 4. Information on the company—Regulatory matters—Mining regulation.
7
Acts by protestors may hamper our mining and logistics operations and projects.
Protestors have taken actions to disrupt our operations and projects, and they may continue to do so in the future. For example, in New Caledonia, in the past protestors caused physical damage to our Goro project and have impeded the construction of the marine pipeline. Although we vigorously defend ourselves against illegal acts, while supporting the communities living near our operations, future attempts by protestors to harm our operations could adversely affect our business.
Our projects are subject to risks that may result in increased costs or delay or prevent their successful implementation.
We are investing heavily to further increase our production capacity, logistics capabilities and to expand the scope of minerals we produce. Our expansion and mining projects are subject to a number of risks that may adversely affect our growth prospects and profitability, including the following:
• We may encounter delays or higher than expected costs in obtaining the necessary equipment or services to build and operate a project.
• Our efforts to develop projects according to schedule may be hampered by a lack of infrastructure, including a reliable power supply.
• We may fail to obtain, or experience delays or higher than expected costs in obtaining, the required permits to build a project.
• Changes in market conditions or regulations may make a project less profitable than expected at the time we initiated work on it.
• Adverse mining conditions may delay and hamper our ability to produce the expected quantities of minerals.
• Some of our development projects are located in regions where tropical diseases, AIDS, malaria, yellow fever and other contagious diseases are a major public health issue and pose health and safety risks to our employees. If we are unable to ensure the health and safety of our employees, our business may be adversely affected.
Our principal shareholder has significant influence over our company.
At December 31, 2007, Valepar S.A. owned 53.3% of our outstanding common stock and 32.5% of our total outstanding capital. For a description of our ownership structure, see Item 7. Major shareholders and related party transactions—Major shareholders—Principal shareholder. As a result of its share ownership, Valepar can control the outcome of any action requiring shareholder approval, except for the appointment of certain directors and certain members of our fiscal council. Moreover, the Brazilian government owns 12 golden shares granting it limited veto power over certain actions that we could otherwise take. For a detailed description of the Brazilian government’s veto power by virtue of its ownership of these golden shares, see Item 10. Additional information—Common shares and preferred shares—General.
Our governance and compliance processes may fail to prevent regulatory penalties and reputational harm.
We operate in a global environment, and our activities straddle multiple jurisdictions and complex regulatory frameworks with increased enforcement activities worldwide. Our governance and compliance processes, which include the review of internal control over financial reporting, may not prevent future breaches of law, accounting or governance standards. We may be subject to breaches of our Code of Ethical Conduct, business conduct protocols and instances of fraudulent behavior and dishonesty by our employees, contractors or other agents. Our failure to comply with applicable laws and other standards could subject us to fines, loss of operating licenses and reputational harm.
8
Many of our operations depend on joint ventures or consortia, and our business could be adversely affected if our partners fail to observe their commitments.
We currently operate important parts of our pelletizing, nickel, bauxite, coal and steel businesses through joint ventures with other companies. Important parts of our electricity business are operated through consortia. Our forecasts and plans for these joint ventures and consortia assume that our partners will observe their obligations to make capital contributions, purchase products and, in some cases, provide managerial personnel. If any of our partners fails to observe its commitments, the affected joint venture or consortium may not be able to operate in accordance with its business plans, or we may have to increase the level of our investment to implement these plans. For more information about our joint ventures, see Item 4. Information on the company—Lines of business.
Our operations depend on authorizations from regulatory agencies in many jurisdictions, and changes in regulations could adversely affect our business.
Our operations depend on authorizations from and concessions by governmental regulatory agencies of the countries in which we operate, and we are subject to laws and regulations in many jurisdictions that can change at any time. Changes in laws and regulations may require modifications to our technologies and operations and result in unanticipated capital expenditures. For example, in Indonesia, the pending new mining legislation could have a material adverse effect on our PT Inco operations. For details about the authorizations and concessions upon which our operations activities depend, see Item 4. Information on the company—Regulatory matters.
Environmental, health and safety regulation may adversely affect our business.
Our operations often involve the use, handling, disposal and discharge of hazardous materials into the environment or the use of natural resources, and nearly all aspects of our operations and development projects around the world are subject to environmental, health and safety regulation. Such regulation requires us to obtain operating licenses, permits and other approvals and to conduct environmental assessments prior to initiating projects or undertaking significant changes to existing operations. Difficulties in obtaining licenses may lead to construction delays or cost increases, and in some cases may lead us to abandon a project. Environmental regulation also imposes standards and controls on activities relating to mining, exploration, development, production, reclamation, closure, and the refining, distribution and marketing of our products. Such regulation may give rise to significant costs and liabilities. In addition, community activist groups and other stakeholders may increase demands for environmentally-sustainable development, which could entail significant costs and reduce our profitability.
Environmental regulation in many countries in which we operate has become stricter in recent years, and it is possible that more regulation or more aggressive enforcement of existing regulations will adversely affect us by imposing restrictions on our activities, creating new requirements for the issuance or renewal of environmental licenses, raising our costs or requiring us to engage in expensive reclamation efforts. For example, in Brazil, environmental protection laws restrict our ability to expand operations without undertaking extensive conservation efforts. They also impose fees on development in protected areas, and many Brazilian states are considering implementing water usage fees, while one state, São Paulo, in which we do not have any operations is already charging water usage fees. In Canada, we may be required to conduct investigations or undertake remediation efforts in connection with elevated levels of metals in the soils near our Canadian facilities, which may involve significant expenditures. In addition, compliance with sulphur dioxide emissions limits could have an adverse impact on nickel production levels to the extent we are required to operate our facilities at reduced levels to comply with such limits or are unable to bank or trade sufficient emission allowances in emissions trading markets. For more information on environmental, health and safety regulation applicable to our operations, see Item 4. Information on the company—Regulatory matters—Environmental regulation and Item 8. Financial information—Legal proceedings.
Our reserve estimates may materially differ from mineral quantities that we may be able to actually recover; our estimates of mine life may prove inaccurate; and market price fluctuations and changes in operating and capital costs may render certain ore reserves uneconomical to mine.
Our reported ore reserves are estimated quantities of ore and minerals that we have determined can be economically mined and processed under present and anticipated conditions to extract their mineral content. There are numerous uncertainties inherent in estimating quantities of reserves and in projecting potential future rates of

9
mineral production, including many factors beyond our control. Reserve engineering involves estimating deposits of minerals that cannot be measured in an exact manner, and the accuracy of any reserve estimate is a function of the quality of available data and engineering and geological interpretation and judgment. As a result, no assurance can be given that the indicated amount of ore will be recovered or that it will be recovered at the rates we anticipate. Estimates of different engineers may vary, and results of our mining and production subsequent to the date of an estimate may lead to revision of estimates. Reserve estimates and estimates of mine life may require revision based on actual production experience and other factors. For example, fluctuations in the market prices of minerals and metals, reduced recovery rates or increased operating and capital costs due to inflation, exchange rates or other factors may render proven and probable reserves uneconomic to exploit and may ultimately result in a restatement of reserves.
We may not be able to replenish our reserves, which could adversely affect our mining prospects.
We engage in mineral exploration, which is highly speculative in nature, involves many risks and frequently is nonproductive. Our exploration programs, which involve significant capital expenditures, may fail to result in the expansion or replacement of reserves depleted by current production. If we do not develop new reserves, we will not be able to sustain our current level of production beyond the remaining lives of our existing mines.
Even if we discover mineral deposits, we remain subject to drilling and production risks, which could adversely affect the mining process.
Once mineral deposits are discovered, it can take a number of years from the initial phases of drilling until production is possible, during which the economic feasibility of production may change. Substantial time and expenditures are required to:
• establish mineral reserves through drilling;
• determine appropriate mining and metallurgical processes for optimizing the recovery of metal contained in ore;
• obtain environmental and other licenses;
• construct mining, processing facilities and infrastructure required for greenfield properties; and
• obtain the ore or extract the metals from the ore.
If a project proves not to be economically feasible by the time we are able to exploit it, we may incur substantial write-offs. In addition, potential changes or complications involving metallurgical and other technological processes arising during the life of a project may result in cost overruns that may render the project not economically feasible.
We face rising extraction costs over time as reserves deplete.
Reserves are gradually depleted in the ordinary course of a given mining operation. As mining progresses, distances to the primary crusher and to waste deposits become longer, pits become steeper and underground operations become deeper. As a result, over time, we usually experience rising unit extraction costs with respect to each mine. Several of our mines have been operating for long periods, and we will likely experience rising extraction costs per unit in the future at these operations.
We face shortages of equipment, services and skilled personnel.
The mining industry faces worldwide shortages of mining and construction equipment, spare parts, contractors and other skilled personnel as a result of high demand for minerals and metals and the large number of projects under development. We are experiencing longer lead-times for mining equipment and problems with the quality of contracted engineering, construction and maintenance services. We are competing with other mining companies for highly skilled executives and staff with relevant industry and technical experience, and we may not be able to attract

10
and retain such people. These shortages could negatively impact our operations, resulting in higher production costs, production interruptions, higher inventory costs, project delays and potentially lower production and revenues.
Labor disputes have disrupted our operations, and such disputes could recur.
A substantial number of our employees, and some of the employees of our subcontractors, are represented by labor unions and are covered by collective bargaining or other labor agreements, which are subject to periodic renegotiation. Renegotiation may become more difficult, as labor unions seek wage increases based on the higher prices and increased profits in the mining and metals industries. Strikes or work stoppages have occurred recently in Canada and Indonesia and could reoccur in connection with negotiations of new labor agreements or during other periods for other reasons. Moreover, we could be adversely affected by labor disruptions involving unrelated parties who may provide us with goods or services. Strikes and other labor disruptions at any of our operations could adversely affect the operation of facilities and the timing of completion and the cost of our capital projects.
Higher energy costs or energy shortages would adversely affect our business.
To fulfill our energy needs, we depend on oil by-products, which represented 49.4% of total energy needs in 2007 in TOE (tons of oil equivalent), natural gas (11.5% on the same basis), coal (3.8% on the same basis) and electricity (35.3% on the same basis). Fuel costs, which represented 8.5% of our cost of goods sold in 2007, are a major component of our total costs in our logistics, iron ore pellets and nickel businesses and indirectly affect numerous other areas of our business, including our mining and alumina businesses. Fuel prices increased by 17.9% in 2007. Increases in oil and gas prices adversely affect margins in our logistics, mining, iron ore pellets, finished nickel and alumina businesses.
Electricity costs are a significant component of the cost of our production, representing 5.3% of our total cost of goods sold in 2007. If we are unable to secure reliable access to electric energy at acceptable prices, we may be forced to curtail production or may experience higher production costs, either of which would adversely affect our results of operations. We currently generate 24.5% of our worldwide electricity needs from our own hydroelectric power plants and we are developing hydroelectric and thermal power plants and engaging in natural gas exploration programs in order to increase the amount of energy we produce and reduce our future exposure to price and supply volatility of energy.
Electricity shortages have occurred in Brazil in the past and could reoccur in the future, and there can be no assurance that the Brazilian government’s policies will succeed in encouraging growth in generation capacity. Future shortages, and government efforts to respond to or prevent shortages, may adversely impact the cost or supply of electricity for our Brazilian aluminum and ferroalloy operations. Changes in the laws, regulations or governmental policies regarding the power sector or concession requirements could reduce our expected returns from our investments in power generation. See Item 4. Information on the company—Regulatory matters—Electric energy regulation.
Through our subsidiary PT Inco in Indonesia, we process lateritic nickel ores, which is energy-intensive. Although PT Inco currently generates a majority of the electricity for its operations from its own hydroelectric power plants, hydrological factors, such as low rainfalls, could adversely affect electricity production at PT Inco’s plants in the future, which could significantly increase the risk of higher costs. For more information on the regulations governing energy production, see Item 4. Information on the company—Regulatory matters—Electric energy regulation.
Price volatility of the currencies in which we conduct operations relative to the U.S. dollar could adversely affect our financial condition and results of operations.
We are affected by fluctuations in the prices of the currencies in which we conduct operations relative to the U.S. dollar. A substantial portion of our revenues and debt is denominated in U.S. dollars, and changes in exchange rates may result in losses or gains on our net U.S. dollar-denominated indebtedness and accounts payable. In 2007, 2006 and 2005, changes in exchange rates produced net foreign exchange gains of US$1.639 billion, US$452 million and US$227 million, respectively. In addition, the price volatility of the Brazilian real, the Canadian dollar, the Indonesian rupiah and other currencies against the U.S. dollar affect our results since most of our costs of goods sold are denominated in currencies other than the U.S. dollar, principally the real (56.6% in 2007) and the Canadian

11
dollar (23.3% in 2007), while our revenues are mostly U.S. dollar-denominated. Currency fluctuations are expected to continue to affect our financial income, expense and cash flow generation.
Significant volatility in currency prices may also result in disruption of countries’ foreign exchange markets and may limit our ability to transfer or to convert such currencies into U.S. dollars and other currencies for the purpose of making timely payments of interest and principal on our indebtedness. The governments of countries in which we operate may institute restrictive exchange rate policies in the future.
Investor perceptions of risk in Brazil and other emerging market economies may undermine our ability to finance our operations at an acceptable cost or reduce the trading price of our securities.
Although our acquisition of Inco in October 2006 significantly expanded the proportion of our non-Brazilian operations, our largest operations, corporate headquarters and senior management continue to be located in Brazil, which investors generally consider an emerging market. Economic crises in one or more emerging market countries may produce a contagion that reduces overall investor appetite for securities of emerging market issuers. Past economic crises in emerging markets, such as in Southeast Asia, Russia and Argentina, have resulted in significant outflows of U.S. dollars from Brazil and caused Brazilian companies to face higher costs for raising funds, both domestically and abroad, and have effectively impeded access to international capital markets for extended periods.
We cannot assure you that global capital markets will remain open to Brazilian companies or that prevailing interest rates in these markets will be advantageous to us. In addition, future financial crises in emerging market countries may have a negative impact on the Brazilian markets, which could adversely affect the trading price of our securities.
Our market risk management strategy may not be effective.
We are exposed to traditional market risks such as volatility in interest rates, exchange rates and commodity prices. We earn most of our revenues in U.S. dollars, but incur a substantial portion of our costs and expenses in currencies other than the U.S. dollar. The exchange rates for such currencies are very volatile. In order to manage market prices and rates exposure, our board of directors has established an enterprise risk management policy and a risk management committee. See Item 11. Quantitative and qualitative disclosures about market risk. Our strategy may not be successful in managing risk exposure, and we may fail to identify correlations between the various market risks to which we are subject. In addition, to the extent we choose to hedge our commodity price exposure, we may limit the upside benefits that we would otherwise experience if commodities prices were to increase.
We may not have adequate insurance coverage for some business risks.
Our businesses are generally subject to a number of risks and hazards, including:
• industrial accidents;
• railroad accidents;
• port accidents;
• labor disputes;
• slope or pit-wall failures, cave-ins or rock falls;
• environmental hazards;
• electricity stoppages;
• equipment or vessel failures;
• severe weather and other natural phenomena such as seismic events;

12
• unavailability or late delivery of materials, supplies or equipment;
• unexpected ground, grade or water conditions; and
• unusual or unexpected geological formations or pressures.
These occurrences could result in damage to, or destruction of, mineral properties, production facilities, logistics facilities, equipment or vessels. They could also result in personal injury or death, environmental damage, waste of resources or intermediate products, delays or interruption in mining, production or transportation activities, monetary losses and possible legal liability. The insurance we maintain against risks that are typical in our business may not provide adequate coverage. Insurance against some risks (including liabilities for environmental pollution or certain hazards or interruption of certain business activities) may not be available at a reasonable cost, or at all. As a result, accidents or other negative developments involving our mining, production or transportation facilities could have a material adverse effect on our operations.
Risks relating to the American Depositary Shares
If ADR holders exchange ADSs for the underlying shares, they risk losing the ability to remit foreign currency abroad and Brazilian tax advantages.
The Brazilian custodian for the shares underlying our ADSs will obtain an electronic registration from the Central Bank to entitle it to remit U.S. dollars abroad for payments of dividends and other distributions relating to the shares underlying our ADSs or upon the disposition of the underlying shares. If an ADR holder decides to exchange its ADRs for the underlying shares, it will be entitled to continue to rely, for five business days from the date of exchange, on the custodian’s electronic registration.
Thereafter, an ADR holder may not be able to obtain and remit U.S. dollars abroad upon the disposition of, or distributions relating to, the underlying shares unless it obtains its own electronic registration by registering the investment in the underlying shares under Resolution No. 2,689 of the National Monetary Council, which permits qualifying institutional foreign investors to buy and sell securities on the São Paulo stock exchange, or BOVESPA. For more information regarding these exchange controls, see Item 10. Additional information—Exchange controls and other limitations affecting security holders. If an ADR holder attempts to obtain its own electronic registration, it may incur expenses or suffer delays in the application process, which could delay the receipt of dividends or distributions relating to the underlying shares or the return of capital in a timely manner. We cannot assure ADR holders that the custodian’s electronic registration or any certificate of foreign capital registration obtained by them will not be affected by future legislative changes, or that additional restrictions applicable to ADR holders, the disposition of the underlying shares or the repatriation of the proceeds from disposition will not be imposed in the future.
ADR holders may be unable to exercise preemptive rights relating to the shares underlying their ADSs.
ADR holders that are residents of the United States may not be able to exercise preemptive rights, or exercise other types of rights, with respect to the underlying shares. The ability of ADR holders to exercise preemptive rights is not assured unless a registration statement is effective with respect to those rights or an exemption from the registration requirements of the Securities Act is available. We are not obligated to file a registration statement relating to preemptive rights with respect to the underlying shares or to undertake steps that may be needed to make exemptions from registration available, and we cannot assure ADR holders that we will file any registration statement or take such steps. If a registration statement is not filed and an exemption from registration does not exist, the depositary for our ADRs will attempt to sell the preemptive rights, and you will be entitled to receive the proceeds of the sale. However, the preemptive rights will expire if the depositary cannot sell them. For a more complete description of preemptive rights with respect to the underlying shares, see Item 10. Additional information—Common shares and preferred shares—Preemptive rights.

13
ADR holders may encounter difficulties in the exercise of voting rights.
ADR holders do not have the rights of shareholders. They have only the contractual rights set forth for their benefit under the deposit agreements. ADR holders are not permitted to attend shareholders’ meetings, and they may only vote by providing instructions to the depositary. In the event that we fail to provide the depositary with voting materials on a timely basis, or the depositary does not provide sufficient time for ADR holders to submit voting instructions, ADR holders will not be able to vote. With respect to ADSs for which instructions are not received, the depositary may, subject to certain limitations, grant a proxy to a person designated by us.
ADR holders may be disadvantaged by the fact that the Brazilian securities markets are not as highly regulated and supervised as the securities markets in the United States or in certain other jurisdictions. In addition, rules and policies against self-dealing and regarding the preservation of minority shareholder interests may be less well-developed and enforced in Brazil than in the United States. For example, when compared to Delaware corporate law, Brazilian corporate law and practice has less detailed and well-established rules and judicial precedents relating to the review of management decisions against duty of care and duty of loyalty standards in the context of corporate restructurings, transactions with related parties, and sale-of-business transactions. Moreover, shareholders in Brazilian companies ordinarily do not have standing to bring a class-action lawsuit.
As a foreign private issuer, we are not required to follow many of the corporate governance rules that apply to U.S. domestic issuers with securities listed on the New York Stock Exchange, and we are not subject to the U.S. proxy rules. For more information concerning our corporate governance policies, see Item 6. Directors, senior management and employees and Item 10. Additional Information—Memorandum and Articles of Association.

14
Item 4. Information on the company
BUSINESS OVERVIEW
General
We are the second-largest metals and mining company in the world and the largest in the Americas, based on market capitalization. We are the world’s largest producer of iron ore and iron ore pellets and the world’s second-largest producer of nickel and kaolin. We are also one of the world’s largest producers of manganese ore and ferroalloys. We also produce bauxite, alumina, aluminum, copper, coal, cobalt, precious metals, potash and other products. To support our growth strategy, we are actively engaged in mineral exploration efforts in 21 countries around the globe. We operate large logistics systems in Brazil, including railroads, maritime terminals and a port, which are integrated with our mining operations. Directly and through affiliates and joint ventures, we have investments in the energy and steel businesses.
The following table presents the breakdown of our total gross revenues attributable to each of our main lines of business, each of which is described following the table.
Year ended December 31, 2005 2006 2006(1) 2007 Ferrous minerals:
Iron ore........................................................................................ 55.2 49.2 39 36 Iron ore pellets ............................................................................ 15.5 9.7 7.7 8.3 Manganese .................................................................................. 0.6 0.3 0.2 0.2 Ferroalloys .................................................................................. 3.7 2.5 2 2.1
Subtotal ..................................................................................... 75.00% 61.70% 48.90% 46.60% Non-ferrous minerals:
Nickel(2) ..................................................................................... – 11.6 25.6 30.3 Aluminum ................................................................................... 10.5 11.7 9.3 8.2 Copper......................................................................................... 2.9 5.3 7.1 6 PGMs(2)...................................................................................... – 0.4 1 1
Other precious metals(2)............................................................... – 0.1 0.7 0.3 Other non-ferrous minerals ........................................................... 2.4 1.9 1.6 1.7
Subtotal ..................................................................................... 15.80% 31.00% 45.30% 47.50% Coal ............................................................................................... – – – 0.50% Logistics ........................................................................................ 9.10% 6.80% 5.40% 4.60% Other investments ......................................................................... 0.10% 0.50% 0.40% 0.80%
Total .......................................................................................... 100.00% 100.00% 100.00% 100.00%
(1) Including Vale Inco’s 2006 gross revenues prior to the acquisition. (2) Revenues included in the nickel product segment in our consolidated financial statements.
• Iron ore, iron ore pellets, manganese and ferroalloys. We operate three systems in Brazil for producing
and distributing iron ore. The Northern and the Southeastern Systems are fully integrated, consisting of mines, railroads, a maritime terminal and a port. The Southern System consists of the mines of our subsidiary MBR, the Oeste mines and the Guaíba Island and Itaguaí maritime terminals. We operate nine pellet-producing facilities in Brazil, five of which are joint ventures. We also have a 50% stake in a joint venture that owns two pelletizing plants in Brazil and a 25% stake in a pellet company in China. We conduct our manganese mining operations in Brazil, at the parent company level and through our subsidiary Urucum. We produce several types of manganese ferroalloys through subsidiaries in Brazil. France and Norway.
• Nickel. Our principal nickel mines and processing operations are carried out by our subsidiary Vale Inco, with mining operations in Canada and Indonesia. We operate or have interests in nickel refining facilities in the United Kingdom, Japan, Taiwan, South Korea and China.
15
• Aluminum. We are engaged in bauxite mining, alumina refining, and aluminum metal smelting. In Brazil, we own a bauxite mine and an alumina refinery, both of which we are currently expanding. We also own two aluminum smelters in Brazil. We have a 40% interest in Mineração Rio do Norte S.A. (“MRN”), a bauxite producer, operations of which are also located in Brazil.
• Copper. We have copper mining operations in Brazil and Canada. In Brazil, we produce copper concentrates at Sossego in Carajás, in the state of Pará. In Canada, we produce copper concentrate, copper anode and copper cathode in conjunction with our nickel mining operations at Sudbury and Voisey’s Bay.
• PGMs. We produce platinum-group metals as by-products of our nickel mining and processing operations in Canada. The PGMs are concentrated at our Port Colborne facilities, in the Province of Ontario, Canada, and refined at our precious metals refinery in Acton, England.
• Other precious metals. We produce gold and silver as by-products of our nickel mining and processing operations in Canada. Some of these precious metals are upgraded at our facilities in Port Colborne, Ontario, and all are refined by unrelated parties in Canada.
• Other non-ferrous minerals. We are the world’s second-largest producer of kaolin for the paper industry and Brazil’s sole producer of potash. We produce cobalt as a by-product of our nickel mining and processing operations in Canada and refine it at our Port Colborne facilities.
• Coal. In April 2007, we acquired 100% of AMCI Holdings Australia Pty and formally renamed it Vale Australia Holdings (“Vale Australia”). Vale Australia operates coal assets in Australia through wholly-owned subsidiaries and unincorporated joint ventures. We also have minority interests in Chinese coal and coke producers.
• Logistics. We are a leading provider of logistics services in Brazil, with railroads, maritime terminals and a port. Two of our three iron ore systems incorporate an integrated railroad network linked to automated port and terminal facilities, which provide rail transportation for our mining products, general cargo and passengers, bulk terminal storage, and ship loading services for our mining operations and for customers. We also have a 31.3% interest in Log-In Logística Intermodal S.A., or Log-In, which provides container-based logistics services.
• Other investments. We have investments in two steel companies and three joint ventures to produce steel slabs in Brazil. We also have investments in power generation plants.
Vale’s legal and commercial name is Companhia Vale do Rio Doce. In November 2007, we launched a global brand unification project under the name “Vale,” which is aimed at communicating our transformation into a global mining company with a diversified portfolio of products.
Vale is a stock corporation, or sociedade por ações, duly organized on January 11, 1943, and existing under the laws of the Federative Republic of Brazil. Vale was privatized in three stages between 1997 and 2002, beginning with the sale by the Brazilian government of a controlling stake in Vale to Valepar in 1997. The last stage of the privatization process took place in 2002, when the Brazilian government sold its remaining minority stake of common shares through a global equity offering. Vale is organized for an unlimited period of time. Its head offices are located at Avenida Graça Aranha, No. 26, 20030-900 Rio de Janeiro, RJ, Brazil, and its telephone number is 55-21-3814-4477.
Business strategy
Our mission is to transform mineral resources into prosperity and sustainable development. Our vision is to become the largest mining company in the world and to surpass current standards of excellence in research, development, project implementation and business operations. To this end, we are building on our strengths in iron ore and nickel and increasing our geographical and product diversification and logistics capabilities. We are focusing on organic growth in our core businesses, with a robust long-term strategic planning process. We also
16
regularly review opportunities to make strategic acquisitions. We apply disciplined capital management in order to maximize return on invested capital and total return to shareholders. Below we highlight our major business strategies.
Maintaining our leadership position in the global iron ore market
We continue to consolidate our leadership in the global iron ore market. In 2007 and 2006, we had an estimated market share of 32.5% of the total volume traded in the seaborne market. We are committed to maintaining our position in the global iron ore market by strengthening relationships with customers, focusing our product line to capture industry trends, increasing our production capacity in line with demand growth and controlling costs. We believe that our strong relationships with major customers, reinforced through long-term contracts, high quality products and a strong technical marketing strategy, will help us achieve this goal. We have also encouraged steelmakers to develop steel slab plants in Brazil, through minority stakes in joint ventures, in order to create additional demand for our iron ore.
Achieving leadership in the nickel business
We are the world’s second-largest nickel producer, with large-scale, long-life and low-cost operations, a substantial resource base, advanced technology and a robust growth profile. We believe our greenfield projects at Onça Puma and Vermelho in Brazil and Goro in New Caledonia will further support our leadership position in the nickel market.
Expanding our aluminum activities
We are developing and increasing production capacity in our aluminum operations, focusing on the upstream portion of the production chain and developing low-cost bauxite and alumina projects. We have large, undeveloped high-quality bauxite reserves and opportunities for low-cost expansions in our alumina refinery. We are working on the development of these opportunities. We are also investing in mineral exploration to increase our bauxite resources. Our strategic focus for primary aluminum activities is locating opportunities to participate in smelter operations in countries with low energy costs.
Developing our copper resources
We believe that our Brazilian copper projects, which are all situated in the Carajás mineral province, in the Brazilian state of Pará, could be among the most competitive in the world in terms of investment cost per metric ton of ore. We are developing the Salobo project, and we are testing new technology that, if successful, could permit the development of other copper projects in this region. We expect these copper mines to benefit from our infrastructure facilities serving the Northern System. We are also engaged in mineral exploration in several countries to increase our reserve base.
Investing in coal
We are pursuing various opportunities to become a large global player in coal businesses. In April 2007, we acquired AMCI Holdings Australia Pty (renamed Vale Australia), which has coal operating assets and a portfolio of exploration projects in Australia. In the past several years, we have invested in two joint ventures in China, and we intend to continue pursuing organic growth in the coal business through the development of the Moatize project in Mozambique, development of more advanced coal exploration projects in Australia and mineral exploration initiatives in several countries.
Diversification and expansion of our resource base
We are engaged in an active mineral exploration program, with efforts in 21 countries around the globe. We are mainly seeking new deposits of copper, manganese ore, iron ore, nickel, bauxite, phosphate, potash, coal, uranium, diamond and platinum group metals. Mineral exploration is an important part of our organic growth strategy.
17
Enhancing our logistics capacity
We believe that the quality of our railway assets and our many years of experience as a railroad and port operator, together with the lack of efficient transportation for general cargo in Brazil, position us as a leader in the logistics business in Brazil. We are expanding the capacity of our railroads through the expansion of the Northern and Southern Corridors, the construction of two new railroads, and the purchase of additional locomotives and wagons to serve the increasing needs of our iron ore and other businesses, as well as those of our customers.
Developing power generation projects
Energy management and efficient supply have become a priority for us. As a large consumer of electricity, we believe that investing in power generation projects to support our operations will help protect us against volatility in the price of energy, regulatory uncertainties and the risk of energy shortages. Accordingly, we have developed hydroelectric power generation plants in Brazil, Canada and Indonesia, and we are using the electricity from these projects to supply our internal needs. In 2007, we began investing in natural gas exploration in Brazil through consortia. We are seeking to diversify and optimize our energy grid through increased use of thermal coal, renewable fuels and natural gas.
Significant changes in our business
The scope of our operations has been affected by acquisitions, by dispositions and by the completion of major investment projects. We summarize below the major acquisitions, divestitures, investment projects and other developments having a significant effect on our financial performance in 2007 and 2008.
Global brand unification
In November 2007, we began using a single global brand, Vale, in all countries where we operate and adopted a new logo. The use of the name Vale and the new logo communicate the evolution, diversification and growth of the company in the past years, which transformed us into a global mining company with a diversified portfolio of products that are present and essential in people’s lives. There was no change in Vale’s legal name.
Acquisitions
Conclusion of Inco acquisition
In January 2007, we completed our acquisition of Inco (renamed Vale Inco), increasing our ownership from 87.73% to 100% and disbursing the final US$2.053 billion of the acquisition cost.
Acquisition of AMCI Holdings
In April 2007, we paid US$656 million to acquire 100% of AMCI Holdings Australia Pty (renamed Vale Australia). Vale Australia operates coal assets and has exploration projects in Australia.
Acquisition of remaining interest in MBR
In May 2007, we increased our ownership of our subsidiary Minerações Brasileiras Reunidas S.A. — MBR (“MBR”), which we consider to have some of the best iron ore assets in the world. We own 49% of MBR directly. The remaining 51% is owned by Empreendimentos Brasileiros de Mineração S.A. — EBM (“EBM”). Before May 2007, we owned 80% of the capital stock of EBM. In these transactions, we purchased an additional 6.25% of EBM’s capital stock and entered into a usufruct agreement giving us the benefit of the remaining 13.75% of EBM’s capital for the next thirty years. We paid US$231 million for the shares. For the usufruct agreement, we paid an initial installment of US$61 million and will pay 29 annual installments of US$48 million each. This transaction will allow us to benefit from synergies between Vale and MBR and to increase our exposure to the iron ore business.

18
Norte-Sul railroad concession
In October 2007, we won the auction for the subconcession for commercial operation of a 720-kilometer segment of the Norte-Sul railroad in Brazil. Part of the line (225 km) is already operating, and the remaining segments are scheduled to be completed in late 2008 and early 2009. We will pay R$1.478 billion for the right to operate this stretch for 30 years. In December 2007, we paid the first installment of US$412 million, equivalent to 50% of the total price of the subconcession. This project will create a new corridor for the transportation of general cargo, mainly for the export of soybeans, rice and corn produced in central-northern Brazil.
Organic growth
We have an ambitious program of investments in the organic growth of our businesses. 2008 is the first year in a new five-year plan to invest US$59 billion in organic growth, which follows a US$20 billion program for the period 2003-2007. Our main investment projects are summarized under “—Capital Expenditures,” and detailed in the discussion of each of our lines of business. The projects that have had the largest impact on our financial performance in 2007 and 2008 are summarized below.
• In our iron ore business, several projects have contributed to increased capacity. Since January 2007 we have been operating the Northern System (Carajás) at the level of 100 million metric tons per year, and our board of directors has approved a project for further expansion to 130 million metric tons by 2009. We started operations at the Brucutu mine in September 2006, and it will reach its full capacity of 30 million metric tons during 2008. Fazendão started up in the first quarter of 2008 and will have annual production capacity of 15.8 million metric tons of run-of-mine.
• In iron ore pellets, we are building a pellet plant, an iron ore concentration plant and a short iron ore slurry pipeline at Itabiritos. Operations are scheduled to begin in the second half of 2008, with a nominal production capacity of 7 million metric tons per year. We are also increasing production capacity at Samarco, our 50% joint venture with BHP Billiton, by 7.6 million metric tons per year, and operations began in April 2008.
• In our nickel business, operations at Goro, in New Caledonia, are scheduled to begin at the end of 2008 and to ramp up over a three-year period to a nominal annual production capacity of 60,000 metric tons of refined nickel and 4,600 metric tons of cobalt.
• In copper, we are developing a hydro-metallurgic plant to produce copper cathode at Sossego, in the Carajás region of the Brazilian state of Pará, with a nominal annual production capacity of 10,000 metric tons of copper. Operations are scheduled to begin in the first half of 2008.
• In our aluminum business, we started operations at the Paragominas bauxite mine in Brazil in the first quarter of 2007. The first expansion of Paragominas is scheduled to be completed in the first half of 2008. We are also completing the construction of stages 6 and 7 at our Alunorte alumina facility in Brazil, which will add 1.9 million metric tons to its nominal production capacity and is scheduled to start operating in the second half of 2008.
Divestitures and asset sales
In line with our strategy, we have continued to reduce our holdings of non-strategic assets. We summarize below our key dispositions and asset sales since the beginning of 2007.
• Lion Ore. In July 2007, we sold our minority stake in Lion Ore Mining International, a Canadian nickel business, for US$105 million.
• Log-In. In June 2007, we conducted an initial public offering of the common shares of Log-In Logística Intermodal S.A. (“Log-In”), our formerly wholly-owned logistics business. We now own 31.3% of Log-In’s

19
voting and total capital stock and are party to an agreement with Mitsui & Co. related to the appointment of board members. Log-In provides container-based logistics services.
• Usiminas. In the first half of 2007, we sold shares of Usiminas, a publicly traded Brazilian steelmaker, in a public offering for an aggregate of US$728 million. We continue to own 2.9% of Usiminas’ capital stock and to be party to a shareholders’ agreement.
• Jubilee Mines. In the first quarter of 2008, we sold our minority stake in Jubilee Mines, a nickel-producing company in Australia, for US$130 million.

20
LINES OF BUSINESS
Our principal lines of business consist of mining and logistics. We also invest in energy to supply part of our consumption. Below is an outline of the information provided in this section:
1. Ferrous minerals
1.1 Iron ore
1.1.1 Operations 1.1.2 Production 1.1.3 Projects and exploration
1.2 Iron ore pellets
1.2.1 Operations 1.2.2 Production 1.2.3 Projects
1.3 Iron ore and iron ore pellets
1.3.1 Customers, sales and marketing 1.3.2 Competition
1.4 Manganese ore
1.5 Ferroalloys
1.6 Manganese ore and ferroalloys — competition
2. Non-ferrous minerals
2.1 Nickel
2.1.1 Operations 2.1.2 Production 2.1.3 Projects and exploration 2.1.4 Customers, sales and marketing 2.1.5 Competition
2.2 Aluminum
2.2.1 Bauxite 2.2.2 Alumina
2.2.3 Aluminum 2.2.4 Customers and sales 2.2.5 Competition
2.3 Copper
2.3.1 Operations 2.3.2 Production 2.3.3 Projects and exploration 2.3.4 Customers and sales
2.4 PGMs and other precious metals
2.5 Other non-ferrous minerals
2.5.1 Cobalt 2.5.2 Kaolin 2.5.3 Potash 2.5.4 Projects
3. Coal
3.1 Operations 3.2 Production 3.3 Projects and exploration 3.4 Customers and sales 3.5 Competition
4. Logistics
4.1 Railroads 4.2 Ports and maritime terminals 4.3 Shipping 4.4 Projects
5. Other investments
5.1 Steel investments 5.2 Energy investments
The following map shows the locations of our operations worldwide.
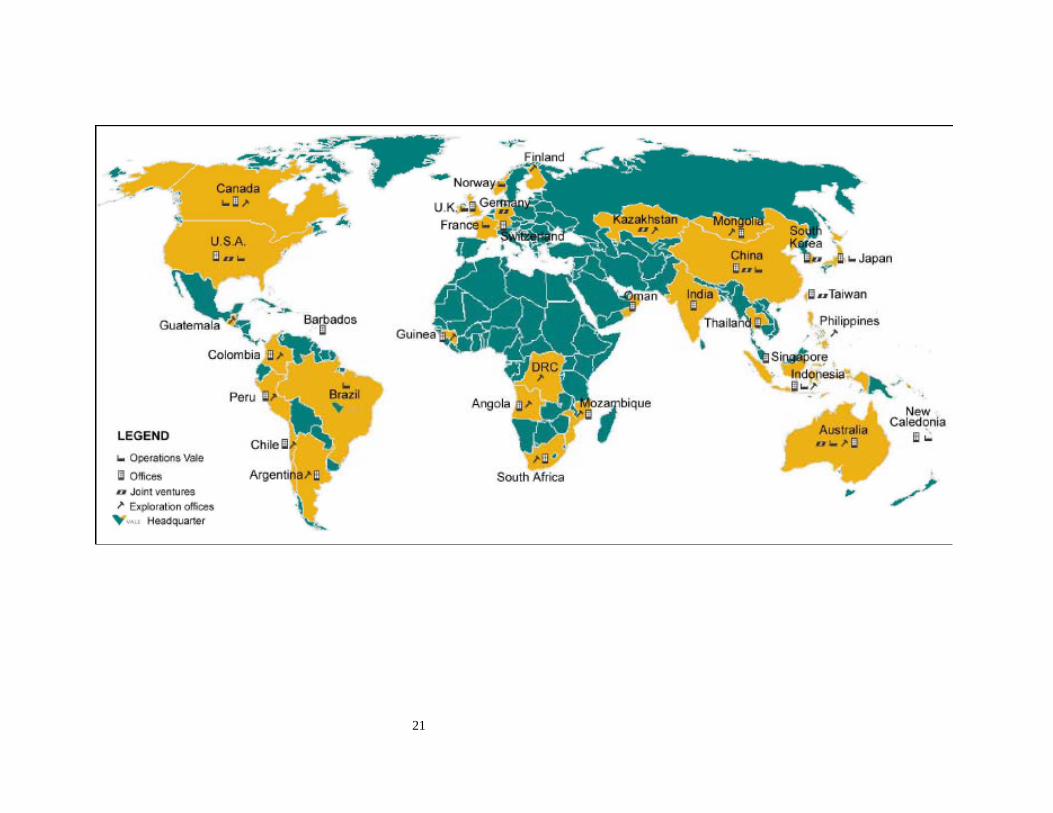
21

22
1. Ferrous minerals
Our ferrous minerals business segment includes:
• iron ore mining;
• iron ore pellet production;
• manganese ore mining; and
• ferroalloy production.
1.1 Iron ore
1.1.1 Operations — iron ore
We conduct our iron ore business in Brazil, primarily at the parent company level and through our subsidiaries Minerações Brasileiras Reunidas S.A. — MBR (“MBR”) and Urucum Mineração S.A. (“Urucum”). Our iron ore mining and related operations are concentrated in three systems, the Southeastern System, the Southern System and the Northern System, each with its own transportation capability.
Southeastern System
The Southeastern System mines are located in the southeastern state of Minas Gerais, in a region known as the Iron Quadrangle. The iron ore mines are divided into three mining areas: Itabira, Centrais, and Mariana. The ore reserves in the Southeastern System have high ratios of itabirite ore relative to hematite ore. Itabirite ore has iron content of 35% to 60% and requires concentration to achieve shipping grade, which is at least 63.5% average iron content. Hematite has average iron content of approximately 66%. We conduct open-pit mining operations in the Southeastern System. We generally process the run-of-mine by means of standard crushing, classification and concentration steps, producing sinter feed, lump ore and pellet feed in the beneficiation plants located at the mining sites.
We own and operate integrated railroad and terminal networks in the Southeastern System. Our EFVM railroad connects the mines to the Tubarão port in Vitória, in the state of Espírito Santo. The Southeastern System is accessible by road or by spur tracks of the EFVM railroad. For a more detailed description of the networks, see Logistics, below. In 2007, we produced 100% of the electric energy consumed in the Southeastern System at our hydroelectric power plants (Igarapava, Porto Estrela, Funil, Candonga, Aimorés, Capim Branco I and Capim Branco II).
Southern System
The Southern System mines are located in the state of Minas Gerais and consist of the Oeste mines and the mines of our subsidiary MBR. MBR presently operates three major mining complexes: the Pico complex (comprised of the three mines, with one major plant and three secondary plants); the Vargem Grande complex (comprised of three mines, and one major beneficiation plant); and the Paraopeba complex (comprised of three mines, and each of their beneficiation plants). We use wet beneficiation processes to convert run-of-mine obtained from open-pit mining operations into sinter feed, lump ore and pellet feed, in addition to hematitinha, a product used primarily by Brazilian pig-iron producers.
We enter into freight contracts with our affiliate, the MRS Logística S.A. railway company (“MRS”), to transport our iron ore products at market prices from the mines to our Guaíba Island and Itaguaí maritime terminals in the state of Rio de Janeiro. In 2007, we produced 41% of the electric energy consumed in the Southern System at our hydroelectric power plants Igarapava, Porto Estrela, Funil, Candonga, Aimorés, Capim Branco I, and Capim Branco II.

23
Northern System
The Northern System mines, located in the Carajás mineral province of the state of Pará, contain some of the largest iron ore deposits in the world. The reserves are divided into northern and southern ranges situated approximately 35 kilometers apart. Since 1983, we have been conducting mining activities in the northern range, which is divided into five main mining bodies. The Northern System has open-pit mines and an ore-processing plant. The mines are located on public lands for which we hold mining concessions.
Because of the high iron content (66.8% on average) of the Northern System deposits, we do not have to operate a concentration plant at Carajás. The beneficiation process consists simply of sizing operations, including screening, hydrocycloning, crushing and filtration. Output from the beneficiation process consists of sinter feed, pellet feed, special fines for direct reduction processes and lump ore.
We operate an integrated railroad and terminal network in the Northern System. After completion of the beneficiation process, our EFC railroad transports the iron ore to the Ponta da Madeira maritime terminal in the state of Maranhão. Our operations in Carajás are accessible by road, air and rail. It obtains all of its electrical power at market prices from regional utilities. To support our Carajás operations, we have housing and other facilities in a nearby township.
1.1.2 Production — iron ore
Production for the year ended December 31,
Mine Type 2005 2006 2007 Nominal
Capacity(1) Recovery
Rate (million metric tons) (%)
Southeastern System Itabira mines
Cauê(2) ............................................. Open pit 23.5 23.7 24.8 24.6 72.1 Conceição(2)..................................... Open pit 22.2 23.3 21.9 22.0 76.4
Centrais mines Água Limpa/Cururu(3)..................... Open pit 3.9 4.2 4.2 4.0 49.6 Gongo Soco ...................................... Open pit 5.7 6.7 6.5 6.1 81.5 Brucutu ............................................. Open pit 7.2 7.7 21.9 18.0 76.7 Córrego do Meio............................... Open pit 0.9 – – – – Andrade(4)........................................ Open pit 1.5 1.4 1.3 1.4 100.0
Mariana mines Alegria .............................................. Open pit 12.3 12.9 13.5 12.4 72.7 Fábrica Nova(5)................................ Open pit 7.8 13.2 14.6 15.6 N/A Fazendão(6) ...................................... Open pit 0.8 0.7 3.7 – N/A Timbopeba ........................................ Open pit 4.6 2.8 1.3 – 82.2
Total Southeastern System..................... 90.4 96.6 113.8 104.1 Southern System
Oeste mines Córrego do Feijão ............................. Open pit 8.1 8.2 9.3 9.3 81.8 Segredo/João Pereira ........................ Open pit 11.5 11.5 11.8 11.8 66.1
MBR System Pico Complex
Pico/Sapecado/Galinheiro ........... Open pit 14.1 17.1 17.4 17.4 75.4 Vargem Grande Complex
Tamanduá(7)................................ Open pit 9.1 10.0 10.2 10.0 81.3 Capitão do Mato(7)...................... Open pit 9.6 11.4 11.5 11.5 81.3 Abóboras...................................... Open pit 2.5 4.3 6.0 6.1 100.0
Paraopeba Complex Jangada ........................................ Open pit 4.0 4.8 3.9 4.0 81.0 Capão Xavier ............................... Open pit 11.1 13.5 13.3 13.3 79.5 Mar Azul(8) ................................. Open pit N/A 3.5 5.9 4.0 96.0
Total Southern System ........................... 70.0 84.3 89.3 87.4 Northern System
Serra Norte(9) N4W.................................................. Open pit 21.9 34.3 40.3 – 89.3 N4E ................................................... Open pit 27.2 19.2 15.4 – 89.3 N5-W ................................................ Open pit 8.4 15.2 30.4 – 89.3 N5E ................................................... Open pit 12.7 10.2 5.0 – 89.3 N5E-N............................................... Open pit 2.4 2.9 0.6 – 89.3
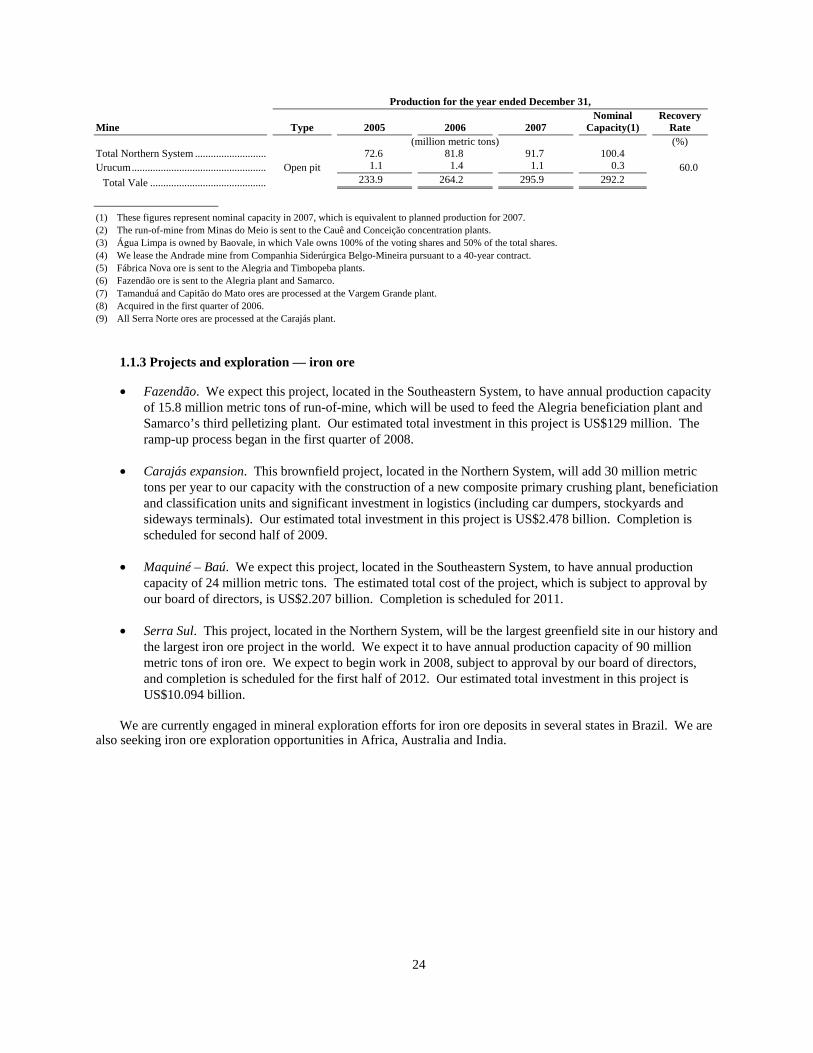
24
Production for the year ended December 31,
Mine Type 2005 2006 2007 Nominal
Capacity(1) Recovery
Rate (million metric tons) (%)
Total Northern System ........................... 72.6 81.8 91.7 100.4 Urucum................................................... Open pit 1.1 1.4 1.1 0.3 60.0
Total Vale ............................................ 233.9 264.2 295.9 292.2 (1) These figures represent nominal capacity in 2007, which is equivalent to planned production for 2007. (2) The run-of-mine from Minas do Meio is sent to the Cauê and Conceição concentration plants. (3) Água Limpa is owned by Baovale, in which Vale owns 100% of the voting shares and 50% of the total shares. (4) We lease the Andrade mine from Companhia Siderúrgica Belgo-Mineira pursuant to a 40-year contract. (5) Fábrica Nova ore is sent to the Alegria and Timbopeba plants. (6) Fazendão ore is sent to the Alegria plant and Samarco. (7) Tamanduá and Capitão do Mato ores are processed at the Vargem Grande plant. (8) Acquired in the first quarter of 2006. (9) All Serra Norte ores are processed at the Carajás plant.
1.1.3 Projects and exploration — iron ore
• Fazendão. We expect this project, located in the Southeastern System, to have annual production capacity of 15.8 million metric tons of run-of-mine, which will be used to feed the Alegria beneficiation plant and Samarco’s third pelletizing plant. Our estimated total investment in this project is US$129 million. The ramp-up process began in the first quarter of 2008.
• Carajás expansion. This brownfield project, located in the Northern System, will add 30 million metric tons per year to our capacity with the construction of a new composite primary crushing plant, beneficiation and classification units and significant investment in logistics (including car dumpers, stockyards and sideways terminals). Our estimated total investment in this project is US$2.478 billion. Completion is scheduled for second half of 2009.
• Maquiné – Baú. We expect this project, located in the Southeastern System, to have annual production capacity of 24 million metric tons. The estimated total cost of the project, which is subject to approval by our board of directors, is US$2.207 billion. Completion is scheduled for 2011.
• Serra Sul. This project, located in the Northern System, will be the largest greenfield site in our history and the largest iron ore project in the world. We expect it to have annual production capacity of 90 million metric tons of iron ore. We expect to begin work in 2008, subject to approval by our board of directors, and completion is scheduled for the first half of 2012. Our estimated total investment in this project is US$10.094 billion.
We are currently engaged in mineral exploration efforts for iron ore deposits in several states in Brazil. We are also seeking iron ore exploration opportunities in Africa, Australia and India.

25
1.2 Iron ore pellets
1.2.1 Operations — iron ore pellets
Directly and through joint ventures, we produce iron ore pellets in Brazil and in China, as set forth in the following table.
Our share of capital Company Location Voting (%) Total Partners Brazil: Vale............................. Tubarão, Fábrica and São Luís N/A N/A N/A Hispanobras ................ Tubarão 51.0 50.9 Arcelor Mittal Itabrasco ..................... Tubarão 51.0 50.9 Ilva Kobrasco..................... Tubarão 50.0 50.0 Posco Nibrasco...................... Tubarão 51.1 51.0 Nippon Steel, Sumitomo, JFE Steel, Kobe
Steel, Nisshin Steel, SOJITZ Corp. Samarco ...................... Germano and Ponta do Ubú 50.0 50.0 BHP Billiton China: Zhuhai YPM(1) .......... Zhuhai, Guangdong 25.0 25.0 Zhuyhai Yueyufeng Iron and Steel Co. Ltd
Pioneer & Steel Group Co. Ltd.
(1) Zhuhai YPM started operations in January 2008.
In the Tubarão port area, in the Brazilian state of Espírito Santo, we operate our own pelletizing plants, Tubarão I and II, and the plants of our joint ventures Hispanobras, Itabrasco, Kobrasco, and Nibrasco. We send iron ore from our Southeastern mines to these plants and use our logistics infrastructure to distribute their final products.
Our São Luís pelletizing plant, located in the Brazilian state of Maranhão, is part of the Northern System. We send Carajás iron ore to this plant and ship its production to customers through our Ponta da Madeira maritime terminal.
The Fábrica pelletizing plant, located in the Brazilian state of Minas Gerais, is part of the Southern System. We send iron ore from the Fábrica mine to this plant and use MRS to transport its production to customers.
Samarco has two operating sites. The Germano unit is in Minas Gerais, close to our Southeastern System, and the Ponta Ubu unit is in Espírito Santo and includes port facilities. Iron ore from Germano is sent to Ponta Ubu using a 396-km pipeline, the longest pipeline in the world for the conveyance of iron ore.
The Zhuhai YPM pelletizing plant, in China, is part of the Yueyufeng Steelmaking Complex, which has port facilities that receive iron ore pellet feed from our mines in Brazil. Zhuhai YPM’s main customer is Yueyufeng Iron & Steel — YYS, which is also located in the Yueyufeng Steelmaking Complex.
We sell pellet feed to our pelletizing joint ventures at market-based prices. Historically, we have supplied all of the iron ore requirements of our wholly-owned pelletizing plants and our joint ventures, except for Samarco and Zhuhai YPM, to which we supply only a portion of its needs. Of our total 2007 pellet production, 63.6% was blast furnace pellets, and the remaining 36.4% was direct reduction pellets, which are used in steel mills that use the direct reduction process rather than blast furnace technology.
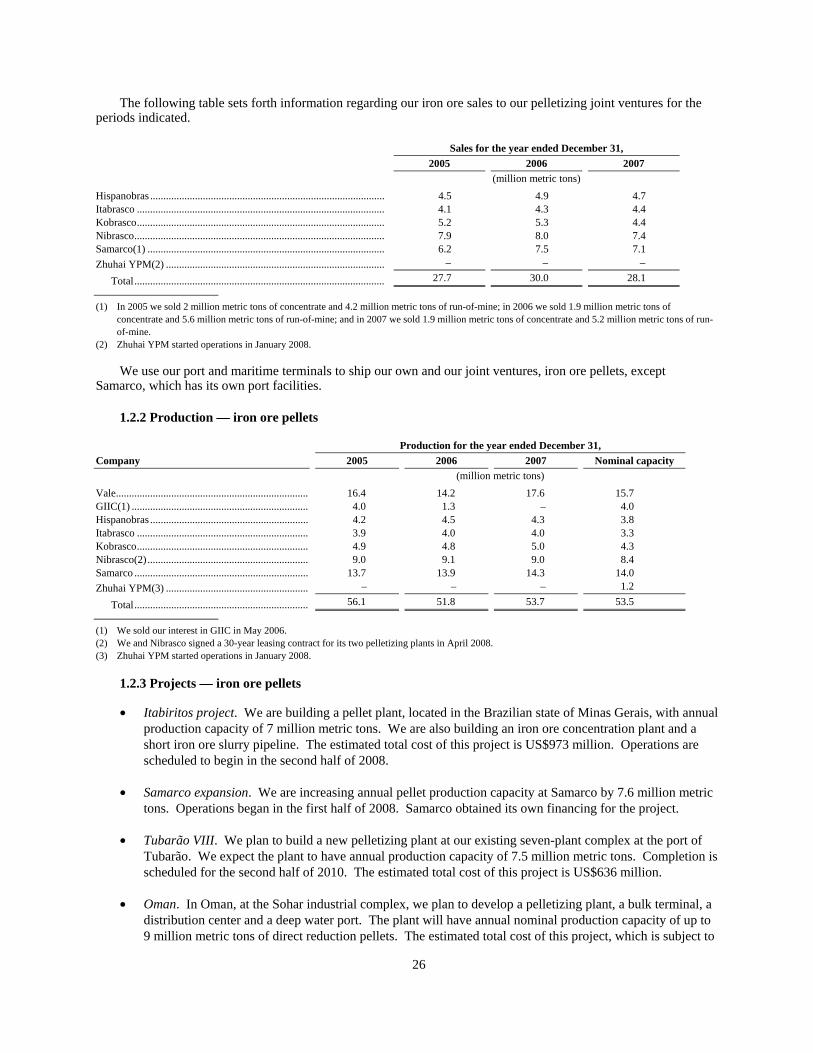
26
The following table sets forth information regarding our iron ore sales to our pelletizing joint ventures for the periods indicated.
Sales for the year ended December 31, 2005 2006 2007 (million metric tons) Hispanobras ......................................................................................... 4.5 4.9 4.7 Itabrasco .............................................................................................. 4.1 4.3 4.4 Kobrasco.............................................................................................. 5.2 5.3 4.4 Nibrasco............................................................................................... 7.9 8.0 7.4 Samarco(1) .......................................................................................... 6.2 7.5 7.1 Zhuhai YPM(2) ................................................................................... – – –
Total............................................................................................... 27.7 30.0 28.1
(1) In 2005 we sold 2 million metric tons of concentrate and 4.2 million metric tons of run-of-mine; in 2006 we sold 1.9 million metric tons of concentrate and 5.6 million metric tons of run-of-mine; and in 2007 we sold 1.9 million metric tons of concentrate and 5.2 million metric tons of run-of-mine.
(2) Zhuhai YPM started operations in January 2008.
We use our port and maritime terminals to ship our own and our joint ventures, iron ore pellets, except Samarco, which has its own port facilities.
1.2.2 Production — iron ore pellets
Production for the year ended December 31, Company 2005 2006 2007 Nominal capacity (million metric tons) Vale......................................................................... 16.4 14.2 17.6 15.7 GIIC(1) ................................................................... 4.0 1.3 – 4.0 Hispanobras ............................................................ 4.2 4.5 4.3 3.8 Itabrasco ................................................................. 3.9 4.0 4.0 3.3 Kobrasco................................................................. 4.9 4.8 5.0 4.3 Nibrasco(2)............................................................. 9.0 9.1 9.0 8.4 Samarco .................................................................. 13.7 13.9 14.3 14.0 Zhuhai YPM(3) ...................................................... – – – 1.2
Total.................................................................. 56.1 51.8 53.7 53.5
(1) We sold our interest in GIIC in May 2006. (2) We and Nibrasco signed a 30-year leasing contract for its two pelletizing plants in April 2008. (3) Zhuhai YPM started operations in January 2008.
1.2.3 Projects — iron ore pellets
• Itabiritos project. We are building a pellet plant, located in the Brazilian state of Minas Gerais, with annual production capacity of 7 million metric tons. We are also building an iron ore concentration plant and a short iron ore slurry pipeline. The estimated total cost of this project is US$973 million. Operations are scheduled to begin in the second half of 2008.
• Samarco expansion. We are increasing annual pellet production capacity at Samarco by 7.6 million metric tons. Operations began in the first half of 2008. Samarco obtained its own financing for the project.
• Tubarão VIII. We plan to build a new pelletizing plant at our existing seven-plant complex at the port of Tubarão. We expect the plant to have annual production capacity of 7.5 million metric tons. Completion is scheduled for the second half of 2010. The estimated total cost of this project is US$636 million.
• Oman. In Oman, at the Sohar industrial complex, we plan to develop a pelletizing plant, a bulk terminal, a distribution center and a deep water port. The plant will have annual nominal production capacity of up to 9 million metric tons of direct reduction pellets. The estimated total cost of this project, which is subject to
27
approval by our board of directors, is US$546 million. Operations are scheduled to begin in the second half of 2010.
1.3 Iron ore and iron ore pellets
1.3.1 Customers, sales and marketing — iron ore and iron ore pellets
We use all of our iron ore and iron ore pellets (including our share of joint-venture pellet production) to supply the steel-making industry. Prevailing and expected levels of demand for steel products affect demand for our iron ore and iron ore pellets. Demand for steel products is influenced by many factors, such as expected rates of economic growth.
In 2007, China accounted for 31.9% of our iron ore and iron ore pellets shipments, and Asia as a whole accounted for 47.8%. Europe accounted for 24.6%, followed by Brazil with 19.8%. Sales to the Tubarão pelletizing joint ventures, at which most iron ore is transformed into iron ore pellets and then shipped to other countries, accounted for 6.9% of total shipments in 2007. Our 10 largest customers collectively purchased 134,357 million metric tons of iron ore and pellets from us, representing 45.3% of our 2007 iron ore and pellet shipments and 46.8% of our total iron ore and pellets revenues. With the exception of Arcelor Mittal, which accounted for 12% of our shipments of iron ore and pellets in 2007, no individual customer accounted for more than 10% of our shipments of iron ore and iron ore pellets for any of the three years ended December 31, 2007.
In 2007, the Asian market (primarily China and Japan) and the European market were the primary markets for our blast furnace pellets, while North America, the Middle East and North Africa were the primary markets for our direct reduction pellets.
We strongly emphasize customer service in order to improve our competitiveness. We work with our customers to understand their main objectives and to provide them with iron ore solutions to meet specific customer needs. Using our expertise in mining, agglomeration and iron-making processes, we search for technical solutions that will balance the best use of our world-class mining assets and the satisfaction of our clients. We believe that our ability to provide customers with a total iron ore solution and the quality of our products are very important advantages helping us to improve our competitiveness in relation to competitors who may be more conveniently located geographically. In addition to offering technical assistance to our customers, Vale operates sales support offices in Tokyo, Japan; Seoul, South Korea; Singapore and Shanghai, China, which support the sales made by our international sales subsidiary located in Saint Prex, Switzerland. These offices also allow us to stay in close contact with our customers, monitor their requirements and our contract performance, and ensure that our customers receive timely deliveries.
1.3.2 Competition — iron ore and iron ore pellets
The global iron ore market is highly competitive, and several large producers operate in this market. The main factors affecting competition are price, quality, range of products offered, reliability, operating costs and shipping costs.
Our biggest competitors in the Asian market are located in Australia and include subsidiaries and affiliates of BHP Billiton PLC and Rio Tinto Ltd. Although the transportation costs of delivering iron ore from Australia to Asian customers are generally lower than ours as a result of Australia’s geographical proximity, we believe we remain competitive in the Asian market for two main reasons. First, steel companies generally seek to obtain the types (or blends) of iron ore and iron ore pellets that can produce the intended final product in the most economic and efficient manner. Our iron ore has low impurity levels and other properties that generally lead to lower processing costs. For example, in addition to the high iron content, the alumina content of our iron ore is very low compared to Australian ores, improving productivity in blast furnaces, which is particularly important during periods of high demand. Second, steel companies often develop sales relationships based on a reliable supply of a specific mix of iron ore and iron ore pellets. We have a customer-oriented marketing policy and place specialized personnel in direct contact with our clients to help determine the blend that best suits each particular customer. In terms of reliability, our ownership and operation of logistics facilities in the Northern and Southeastern Systems helps us ensure that our products are delivered on time and at a relatively low cost. We have entered into long-term
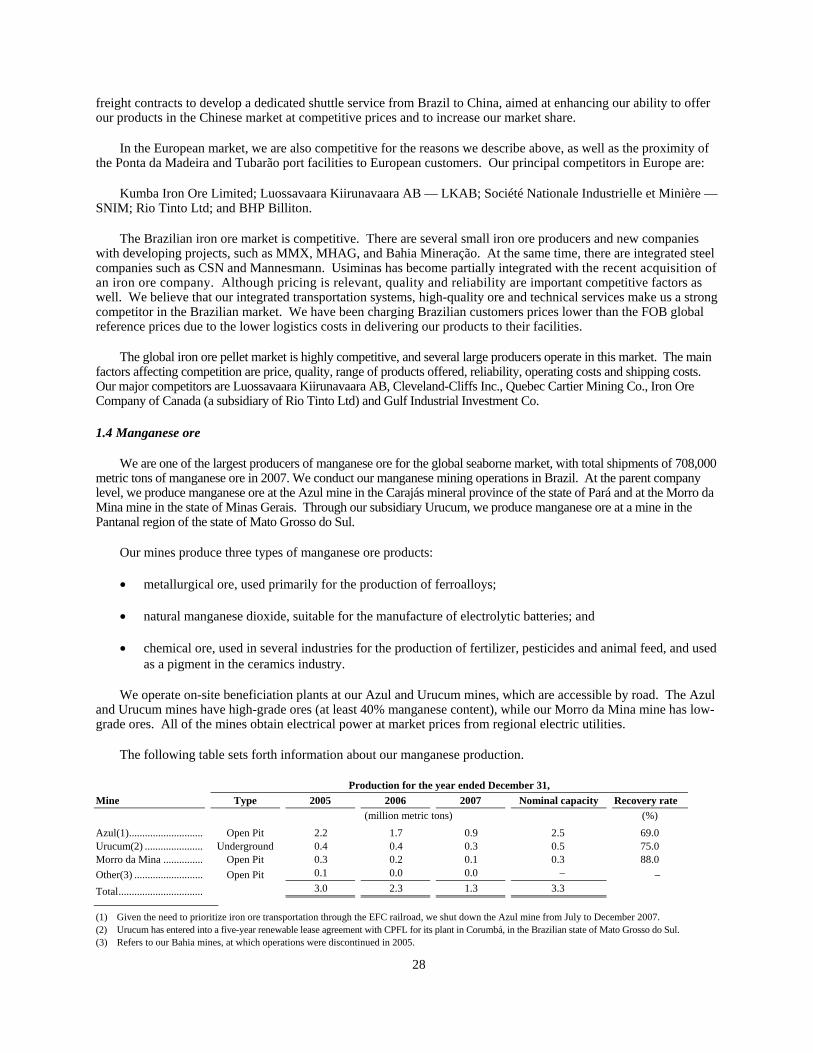
28
freight contracts to develop a dedicated shuttle service from Brazil to China, aimed at enhancing our ability to offer our products in the Chinese market at competitive prices and to increase our market share.
In the European market, we are also competitive for the reasons we describe above, as well as the proximity of the Ponta da Madeira and Tubarão port facilities to European customers. Our principal competitors in Europe are:
Kumba Iron Ore Limited; Luossavaara Kiirunavaara AB — LKAB; Société Nationale Industrielle et Minière — SNIM; Rio Tinto Ltd; and BHP Billiton.
The Brazilian iron ore market is competitive. There are several small iron ore producers and new companies with developing projects, such as MMX, MHAG, and Bahia Mineração. At the same time, there are integrated steel companies such as CSN and Mannesmann. Usiminas has become partially integrated with the recent acquisition of an iron ore company. Although pricing is relevant, quality and reliability are important competitive factors as well. We believe that our integrated transportation systems, high-quality ore and technical services make us a strong competitor in the Brazilian market. We have been charging Brazilian customers prices lower than the FOB global reference prices due to the lower logistics costs in delivering our products to their facilities.
The global iron ore pellet market is highly competitive, and several large producers operate in this market. The main factors affecting competition are price, quality, range of products offered, reliability, operating costs and shipping costs. Our major competitors are Luossavaara Kiirunavaara AB, Cleveland-Cliffs Inc., Quebec Cartier Mining Co., Iron Ore Company of Canada (a subsidiary of Rio Tinto Ltd) and Gulf Industrial Investment Co.
1.4 Manganese ore
We are one of the largest producers of manganese ore for the global seaborne market, with total shipments of 708,000 metric tons of manganese ore in 2007. We conduct our manganese mining operations in Brazil. At the parent company level, we produce manganese ore at the Azul mine in the Carajás mineral province of the state of Pará and at the Morro da Mina mine in the state of Minas Gerais. Through our subsidiary Urucum, we produce manganese ore at a mine in the Pantanal region of the state of Mato Grosso do Sul.
Our mines produce three types of manganese ore products:
• metallurgical ore, used primarily for the production of ferroalloys;
• natural manganese dioxide, suitable for the manufacture of electrolytic batteries; and
• chemical ore, used in several industries for the production of fertilizer, pesticides and animal feed, and used as a pigment in the ceramics industry.
We operate on-site beneficiation plants at our Azul and Urucum mines, which are accessible by road. The Azul and Urucum mines have high-grade ores (at least 40% manganese content), while our Morro da Mina mine has low-grade ores. All of the mines obtain electrical power at market prices from regional electric utilities.
The following table sets forth information about our manganese production.
Production for the year ended December 31, Mine Type 2005 2006 2007 Nominal capacity Recovery rate
(million metric tons) (%) Azul(1)............................ Open Pit 2.2 1.7 0.9 2.5 69.0 Urucum(2) ...................... Underground 0.4 0.4 0.3 0.5 75.0 Morro da Mina ............... Open Pit 0.3 0.2 0.1 0.3 88.0 Other(3) .......................... Open Pit 0.1 0.0 0.0 – – Total................................ 3.0 2.3 1.3 3.3
(1) Given the need to prioritize iron ore transportation through the EFC railroad, we shut down the Azul mine from July to December 2007. (2) Urucum has entered into a five-year renewable lease agreement with CPFL for its plant in Corumbá, in the Brazilian state of Mato Grosso do Sul. (3) Refers to our Bahia mines, at which operations were discontinued in 2005.
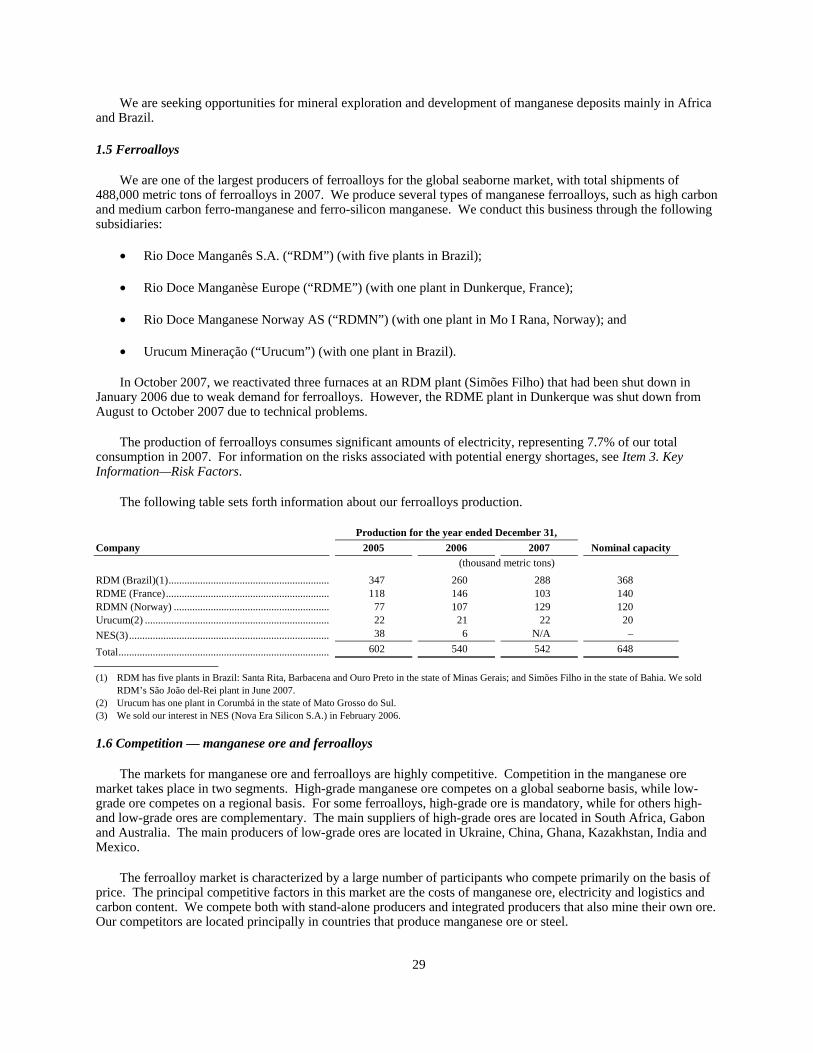
29
We are seeking opportunities for mineral exploration and development of manganese deposits mainly in Africa and Brazil.
1.5 Ferroalloys
We are one of the largest producers of ferroalloys for the global seaborne market, with total shipments of 488,000 metric tons of ferroalloys in 2007. We produce several types of manganese ferroalloys, such as high carbon and medium carbon ferro-manganese and ferro-silicon manganese. We conduct this business through the following subsidiaries:
• Rio Doce Manganês S.A. (“RDM”) (with five plants in Brazil);
• Rio Doce Manganèse Europe (“RDME”) (with one plant in Dunkerque, France);
• Rio Doce Manganese Norway AS (“RDMN”) (with one plant in Mo I Rana, Norway); and
• Urucum Mineração (“Urucum”) (with one plant in Brazil).
In October 2007, we reactivated three furnaces at an RDM plant (Simões Filho) that had been shut down in January 2006 due to weak demand for ferroalloys. However, the RDME plant in Dunkerque was shut down from August to October 2007 due to technical problems.
The production of ferroalloys consumes significant amounts of electricity, representing 7.7% of our total consumption in 2007. For information on the risks associated with potential energy shortages, see Item 3. Key Information—Risk Factors.
The following table sets forth information about our ferroalloys production.
Production for the year ended December 31, Company 2005 2006 2007 Nominal capacity (thousand metric tons) RDM (Brazil)(1)............................................................. 347 260 288 368 RDME (France).............................................................. 118 146 103 140 RDMN (Norway) ........................................................... 77 107 129 120 Urucum(2) ...................................................................... 22 21 22 20 NES(3)............................................................................ 38 6 N/A –
Total................................................................................ 602 540 542 648
(1) RDM has five plants in Brazil: Santa Rita, Barbacena and Ouro Preto in the state of Minas Gerais; and Simões Filho in the state of Bahia. We sold RDM’s São João del-Rei plant in June 2007.
(2) Urucum has one plant in Corumbá in the state of Mato Grosso do Sul. (3) We sold our interest in NES (Nova Era Silicon S.A.) in February 2006.
1.6 Competition — manganese ore and ferroalloys
The markets for manganese ore and ferroalloys are highly competitive. Competition in the manganese ore market takes place in two segments. High-grade manganese ore competes on a global seaborne basis, while low-grade ore competes on a regional basis. For some ferroalloys, high-grade ore is mandatory, while for others high- and low-grade ores are complementary. The main suppliers of high-grade ores are located in South Africa, Gabon and Australia. The main producers of low-grade ores are located in Ukraine, China, Ghana, Kazakhstan, India and Mexico.
The ferroalloy market is characterized by a large number of participants who compete primarily on the basis of price. The principal competitive factors in this market are the costs of manganese ore, electricity and logistics and carbon content. We compete both with stand-alone producers and integrated producers that also mine their own ore. Our competitors are located principally in countries that produce manganese ore or steel.

30
2. Non-ferrous minerals
2.1 Nickel
2.1.1 Operations — nickel
We conduct our nickel operations primarily through our wholly-owned subsidiary Vale Inco and its 61%-owned subsidiary PT Inco. Vale Inco operates two nickel production systems, one in North America and Europe and the other in Asia, as set forth in the following table.
System Location Operations
North America & Europe
Canada — Sudbury, Ontario Fully integrated mines, mill, smelter and refinery (producing finished nickel and by-products)
Canada — Thompson, Manitoba Fully integrated mines, mill, smelter and refinery (producing finished nickel and by-products)
Canada — Voisey’s Bay, Newfoundland and Labrador
Mine and mill (producing nickel concentrate and by-products)
U.K. — Clydach, Wales Stand-alone nickel refinery (producing finished nickel) Asia Indonesia — Sorowako, Sulawesi(1) Mining and processing operations (producing nickel matte, an
intermediate product) Japan — Matsuzaka(2) Stand-alone nickel refinery (producing finished nickel) Taiwan — Kaoshiung(3) Stand-alone nickel refinery (producing finished nickel) China — Dalian, Liaoning(4) Stand-alone nickel refinery (producing finished nickel) China — Kunshan, Jiangsu(5) Processing operation (producing nickel salts) South Korea — Onsan(6) Stand-alone nickel refinery (producing finished nickel)
(1) Operations conducted through our 61%-owned subsidiary PT Inco. (2) Operations conducted through our 67%-owned subsidiary Vale Inco Japan Limited. (3) Operations conducted through our 49.9%-owned subsidiary Taiwan Nickel Refining Corporation. (4) Operations conducted through our 98%-owned subsidiary Inco New Nickel Materials (Dalian) Co. Ltd. (5) Operations conducted through our 65%-owned subsidiary Jinco Nonferrous Metals Co., Ltd. (6) Operations conducted through our 25% interest in Korea Nickel Corporation.
North America & Europe
Sudbury operations
Our long-established mines in Sudbury, Ontario, are primarily underground operations with nickel sulphide ore bodies. These ore bodies also contain co-deposits of copper, cobalt, platinum-group metals, gold and silver. We have integrated mining, milling, smelting and refining operations to process ore into finished nickel at Sudbury. We also smelt and refine an intermediate product, nickel concentrate, from our Voisey’s Bay operations. We ship a nickel intermediate product, nickel oxide, from our Sudbury smelter to our nickel refineries in Wales, Taiwan, China, Japan and South Korea for processing into finished nickel.
Thompson operations
Our long-established mines in Thompson, Manitoba, are primarily underground operations with nickel sulphide ore bodies. The ore bodies also contain co-deposits of copper and cobalt. We have integrated mining, milling, smelting and refining operations to process ore into finished nickel at Thompson. We also smelt and refine an intermediate product, nickel concentrate, from our Voisey’s Bay operations.
Voisey ’ s Bay operations
Our Voisey’s Bay mine, in Newfoundland and Labrador, is an open-pit operation with the potential for underground operations at a later stage. We mine nickel sulphide ore bodies here, which also contain co-deposits of copper and cobalt. We mill Voisey’s Bay ore on site and ship it as an intermediate product (nickel concentrates) primarily to our Sudbury and Thompson operations for final processing (smelting and refining). A portion of our Voisey’s Bay nickel concentrate is also toll-smelted and toll-refined by unrelated parties in Europe.

31
Clydach operations
Clydach is a stand-alone nickel refinery in the U.K. that processes a nickel intermediate product, nickel oxide, supplied from our Sudbury operations to produce finished nickel.
Asia
Our subsidiary PT Inco operates two open cast mines, Sorowako and Pomalaa, and a related processing facility in Sorowako on the Island of Sulawesi, Indonesia. PT Inco mines nickel laterite saprolite ore and produces an intermediate product (nickel matte), which is shipped primarily to our nickel refinery in Japan. Pursuant to life-of-mine off-take agreements, PT Inco sells 80% of its production to Vale Inco and 20% of its production to Sumitomo Metal Mining Co., Ltd. (“Sumitomo”). PT Inco is a public company whose shares are traded on the Indonesia Stock Exchange. Vale Inco holds 61% of its shares, Sumitomo holds 20% and the remaining 19% is publicly held.
Our 67%-owned subsidiary, Vale Inco Japan Limited (formerly Inco TNC Limited) operates a refinery in Matsuzaka, which produces intermediate and finished nickel products, primarily using nickel matte sourced from PT Inco. Vale Inco Japan is a private company. The minority interest is held by Sumitomo (13%), Daido Steel Co., Ltd. (9%), Mitsui & Co., Ltd. (7%) and other Japanese companies (5%).
We also operate or have investments in nickel refining operations in Taiwan, China and South Korea, through our 49.9% stake in Taiwan Nickel Refining Corporation (“TNRC”), our 98% interest in Inco New Nickel Materials (Dalian) Co. Ltd. (“INNM”) and our 25% stake in Korea Nickel Corporation (“KNC”). TNRC, INNM and KNC produce finished nickel for the local stainless steel industry in Taiwan, China and South Korea, primarily using intermediate products containing about 75% nickel (in the form of nickel oxide) from Vale Inco Japan and our Sudbury operations.
Our 65%-owned joint venture, Jinco Nonferrous Metals Co., Ltd (“Jinco”) operates a nickel salts operation in China (Kunshan, province of Jiangsu). Jinco produces nickel sulphate and chloride, which are used in the nickel plating industry.
Special Products
Through our Special Products business unit, we develop, manufacture and sell value-added specialty nickel products, including powders, foams, flakes, oxides and nickel-coated graphite. These products, which are generally sold at a premium over the London Metal Exchange (LME) price, are used for such applications as consumer electronics, rechargeable batteries for consumer and hybrid vehicle use, fuel cells, powder metallurgy, automotive parts, electromagnetic interference shielding for computers and cellular telephones, catalysts and salts, metal injection molding, and hard metal binders. Our Special Products are sold through our global marketing network and produced at our refineries in Sudbury and Clydach. In addition, we have Special Product operations at the following locations:
• Mississauga, Ontario, Canada (including research and development facilities);
• Wyckoff, New Jersey, USA, through our wholly-owned subsidiary Novamet Specialty Products Corporation;
• Sauerlach, Germany, through our wholly-owned subsidiaries Inco GmbH and Alantum GmbH & Co. KG;
• Shenyang, Province of Liaoning, China, through our 77%-owned subsidiary Inco Advanced Technology Materials (Shenyang) Co. Ltd.; and
• Dalian, Province of Liaoning, China, through our 76.7%-owned subsidiary Inco Advanced Technology Materials (Dalian) Co., Ltd.
Recycling operations
Through our wholly-owned subsidiary The International Metals Reclamation Company, Inc., or INMETCO, in the United States (Ellwood City, Pennsylvania), we process stainless steel waste, end-of-life batteries and other
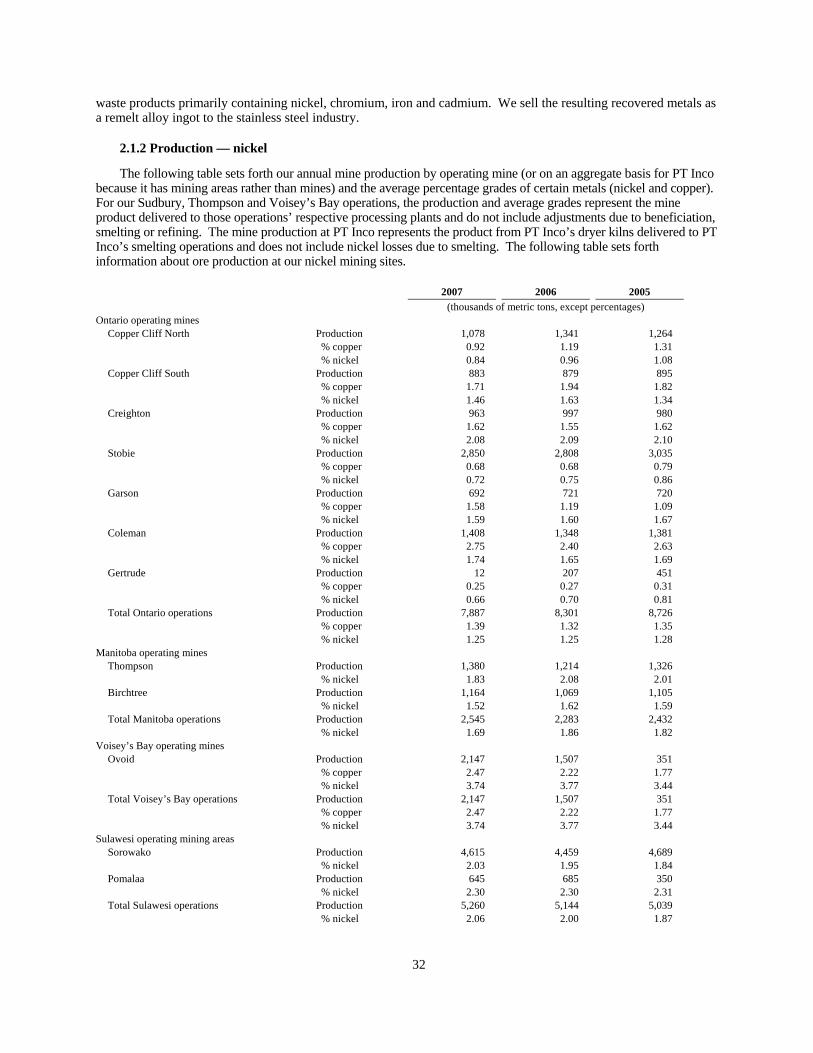
32
waste products primarily containing nickel, chromium, iron and cadmium. We sell the resulting recovered metals as a remelt alloy ingot to the stainless steel industry.
2.1.2 Production — nickel
The following table sets forth our annual mine production by operating mine (or on an aggregate basis for PT Inco because it has mining areas rather than mines) and the average percentage grades of certain metals (nickel and copper). For our Sudbury, Thompson and Voisey’s Bay operations, the production and average grades represent the mine product delivered to those operations’ respective processing plants and do not include adjustments due to beneficiation, smelting or refining. The mine production at PT Inco represents the product from PT Inco’s dryer kilns delivered to PT Inco’s smelting operations and does not include nickel losses due to smelting. The following table sets forth information about ore production at our nickel mining sites.
2007 2006 2005 (thousands of metric tons, except percentages) Ontario operating mines
Copper Cliff North Production 1,078 1,341 1,264 % copper 0.92 1.19 1.31 % nickel 0.84 0.96 1.08 Copper Cliff South Production 883 879 895 % copper 1.71 1.94 1.82 % nickel 1.46 1.63 1.34 Creighton Production 963 997 980 % copper 1.62 1.55 1.62 % nickel 2.08 2.09 2.10 Stobie Production 2,850 2,808 3,035 % copper 0.68 0.68 0.79 % nickel 0.72 0.75 0.86 Garson Production 692 721 720 % copper 1.58 1.19 1.09 % nickel 1.59 1.60 1.67 Coleman Production 1,408 1,348 1,381 % copper 2.75 2.40 2.63 % nickel 1.74 1.65 1.69 Gertrude Production 12 207 451 % copper 0.25 0.27 0.31 % nickel 0.66 0.70 0.81 Total Ontario operations Production 7,887 8,301 8,726 % copper 1.39 1.32 1.35 % nickel 1.25 1.25 1.28
Manitoba operating mines Thompson Production 1,380 1,214 1,326 % nickel 1.83 2.08 2.01 Birchtree Production 1,164 1,069 1,105 % nickel 1.52 1.62 1.59 Total Manitoba operations Production 2,545 2,283 2,432
% nickel 1.69 1.86 1.82 Voisey’s Bay operating mines
Ovoid Production 2,147 1,507 351 % copper 2.47 2.22 1.77 % nickel 3.74 3.77 3.44 Total Voisey’s Bay operations Production 2,147 1,507 351 % copper 2.47 2.22 1.77 % nickel 3.74 3.77 3.44
Sulawesi operating mining areas Sorowako Production 4,615 4,459 4,689 % nickel 2.03 1.95 1.84 Pomalaa Production 645 685 350 % nickel 2.30 2.30 2.31 Total Sulawesi operations Production 5,260 5,144 5,039 % nickel 2.06 2.00 1.87
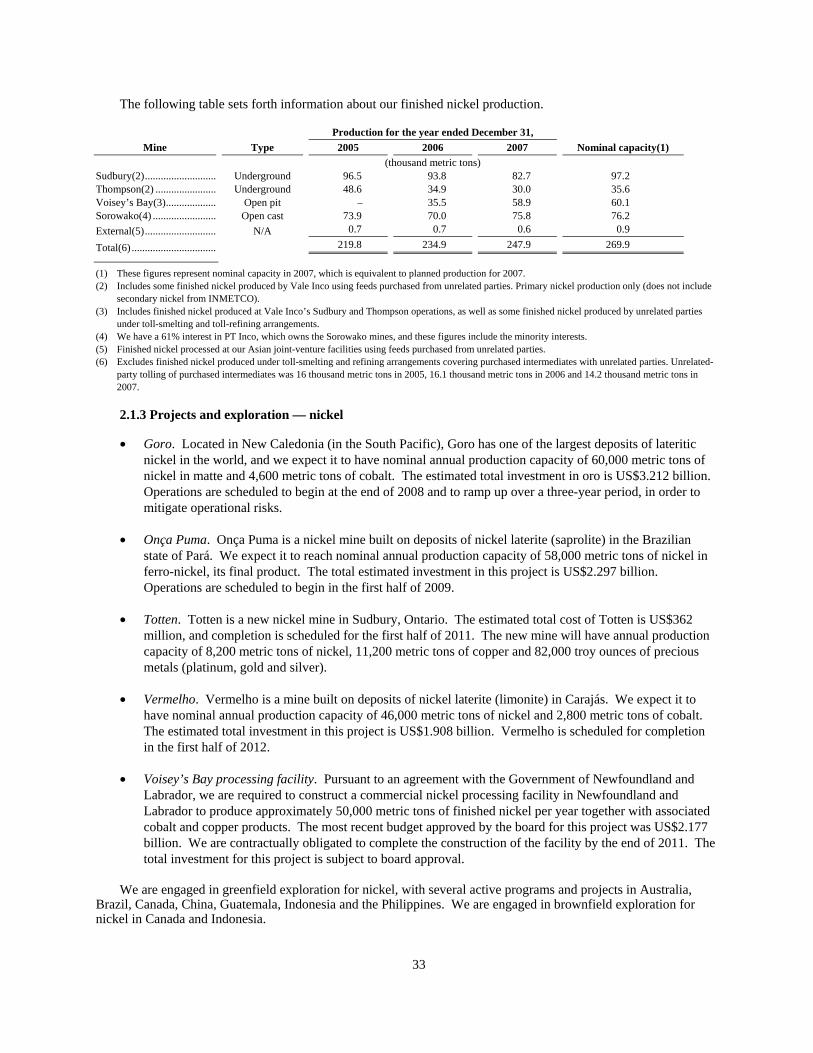
33
The following table sets forth information about our finished nickel production.
Production for the year ended December 31, Mine Type 2005 2006 2007 Nominal capacity(1)
(thousand metric tons) Sudbury(2)........................... Underground 96.5 93.8 82.7 97.2 Thompson(2) ....................... Underground 48.6 34.9 30.0 35.6 Voisey’s Bay(3)................... Open pit – 35.5 58.9 60.1 Sorowako(4) ........................ Open cast 73.9 70.0 75.8 76.2 External(5)........................... N/A 0.7 0.7 0.6 0.9
Total(6) ................................ 219.8 234.9 247.9 269.9
(1) These figures represent nominal capacity in 2007, which is equivalent to planned production for 2007. (2) Includes some finished nickel produced by Vale Inco using feeds purchased from unrelated parties. Primary nickel production only (does not include
secondary nickel from INMETCO). (3) Includes finished nickel produced at Vale Inco’s Sudbury and Thompson operations, as well as some finished nickel produced by unrelated parties
under toll-smelting and toll-refining arrangements. (4) We have a 61% interest in PT Inco, which owns the Sorowako mines, and these figures include the minority interests. (5) Finished nickel processed at our Asian joint-venture facilities using feeds purchased from unrelated parties. (6) Excludes finished nickel produced under toll-smelting and refining arrangements covering purchased intermediates with unrelated parties. Unrelated-
party tolling of purchased intermediates was 16 thousand metric tons in 2005, 16.1 thousand metric tons in 2006 and 14.2 thousand metric tons in 2007.
2.1.3 Projects and exploration — nickel
• Goro. Located in New Caledonia (in the South Pacific), Goro has one of the largest deposits of lateritic nickel in the world, and we expect it to have nominal annual production capacity of 60,000 metric tons of nickel in matte and 4,600 metric tons of cobalt. The estimated total investment in oro is US$3.212 billion. Operations are scheduled to begin at the end of 2008 and to ramp up over a three-year period, in order to mitigate operational risks.
• Onça Puma. Onça Puma is a nickel mine built on deposits of nickel laterite (saprolite) in the Brazilian state of Pará. We expect it to reach nominal annual production capacity of 58,000 metric tons of nickel in ferro-nickel, its final product. The total estimated investment in this project is US$2.297 billion. Operations are scheduled to begin in the first half of 2009.
• Totten. Totten is a new nickel mine in Sudbury, Ontario. The estimated total cost of Totten is US$362 million, and completion is scheduled for the first half of 2011. The new mine will have annual production capacity of 8,200 metric tons of nickel, 11,200 metric tons of copper and 82,000 troy ounces of precious metals (platinum, gold and silver).
• Vermelho. Vermelho is a mine built on deposits of nickel laterite (limonite) in Carajás. We expect it to have nominal annual production capacity of 46,000 metric tons of nickel and 2,800 metric tons of cobalt. The estimated total investment in this project is US$1.908 billion. Vermelho is scheduled for completion in the first half of 2012.
• Voisey’s Bay processing facility. Pursuant to an agreement with the Government of Newfoundland and Labrador, we are required to construct a commercial nickel processing facility in Newfoundland and Labrador to produce approximately 50,000 metric tons of finished nickel per year together with associated cobalt and copper products. The most recent budget approved by the board for this project was US$2.177 billion. We are contractually obligated to complete the construction of the facility by the end of 2011. The total investment for this project is subject to board approval.
We are engaged in greenfield exploration for nickel, with several active programs and projects in Australia, Brazil, Canada, China, Guatemala, Indonesia and the Philippines. We are engaged in brownfield exploration for nickel in Canada and Indonesia.

34
2.1.4 Customers, sales and marketing — nickel
Our customers are broadly distributed on a global basis. In 2007, 60.3% of our total nickel sales were delivered to customers in Asia, 26.5% to North America, 11.6% to Europe, and 1.6% to other locations. We have short-term fixed-volume contracts with customers for the majority of our expected annual nickel sales. These contracts, together with our sales of proprietary and multi-use nickel products, provide stable demand for a significant portion of our annual production.
Nickel is an exchange-traded metal, listed on the London Metal Exchange (“LME”), and most nickel products are priced according to a discount or premium to the LME price, depending on the nickel product’s physical and technical characteristics. Our finished nickel products represent what is known in the industry as “primary” nickel, meaning nickel produced principally from nickel ores (as opposed to “secondary” nickel, which is recovered from recycled nickel-containing material). Finished primary nickel products are distinguishable in terms of the following characteristics, which determine the product price level and the suitability for various end-use applications:
• nickel content and purity level: (i) nickel pig iron has 1.5 to 6% nickel, (ii) ferro-nickel has 20-40% nickel, (iii) standard LME grade nickel has a minimum of 99.8% nickel and (iv) high purity nickel has a minimum of 99.9% nickel, and the absence of specific elemental impurities;
• shape (such as pellets, discs, squares, strips, and foams); and
• size.
• The principal end-use applications for nickel are:
• austenitic stainless steel (60-65% of global nickel consumption);
• non-ferrous alloys, alloy steels, and foundry applications (15-20% of global nickel consumption);
• nickel plating (10% of global nickel consumption); and
• specialty applications, such as batteries, fuel cells, powder metallurgy and automotive parts (5-10% of global nickel consumption).
In 2007, 65% of our sales were made into non-stainless steel applications, compared to the industry average for primary nickel producers of approximately 40%. As a result of our focus on such higher-value segments, our average realized nickel prices have consistently exceeded LME cash nickel prices.
We offer sales and technical support to our customers on a global basis. We have a well-established global marketing network for finished nickel, based at our head office in Toronto, Canada. We also have sales offices in Saddle Brook, New Jersey, and San Antonio, Texas in the United States, in London, England, in Tokyo, Japan, in Hong Kong and Shanghai, China, in Kaohsiung, Taiwan, in Bangkok, Thailand and in Bridgetown, Barbados.
2.1.5 Competition — nickel
The global nickel market is highly competitive. We believe that our key competitive strengths include our long-life mines, our low cash costs of production relative to other nickel producers, and sophisticated exploration and processing technologies, specialty products research and development. Our global marketing reach and technical support direct our products to the applications and geographic regions which offer the highest margins for our products.
In 2007, our nickel deliveries represented approximately 20% of global consumption for primary nickel. In addition to us, the largest suppliers in the nickel industry (each with its own integrated facilities, including nickel mining, processing, refining and marketing operations) are MMC Norilsk Nickel, BHP Billiton plc, Xstrata plc and Jinchuan Nonferrous Metals Corporation. Together with us, these companies accounted for about 61% of global finished primary nickel production in 2007. In addition to these five companies, other producers in various countries participate in the nickel industry.

35
While stainless steel production is a major driver of global nickel demand, stainless steel producers can use nickel products with a wide range of nickel content, including secondary nickel. The choice between primary and secondary nickel is largely based on their relative prices and availability. In recent years, secondary nickel has accounted for about 44-49% of total nickel used for stainless steels, and primary nickel has accounted for about 51-56%. In 2006, a new primary nickel product entered the market, known as nickel pig iron. This is a low-grade nickel product made in China from imported lateritic ores (primarily from the Philippines, Indonesia and New Caledonia) that is suitable primarily for use in stainless steel production. In 2007, nickel pig iron production totaled an estimated 90,000 metric tons, representing 6% of world primary nickel supply.
2.2 Aluminum
We operate our aluminum businesses at the parent company level and through subsidiaries and joint ventures, as set forth in the following table.
Our share of capital Company Business Voting Total Partners
(%) Vale.......................................................................... Bauxite N/A N/A N/A Mineração Rio do Norte S.A.(“MRN”) .................. Bauxite 40.00 40.00 Abalco, Alcoa, Rio Tinto Alcan, Alcoa World Alumina LLC — AWA, BHP Billiton Metais, Companhia Brasileira de Alumínio — CBA, Norsk Hydro Alumina do Norte do Brasil S.A.— (“Alunorte”) .. Alumina 59.02 57.03 Companhia Brasileira de Alumínio — CBA JAIC, Mitsui, Mitsubishi, Nippon Amazon — NAAC, Norsk Hydro Alumínio Brasileiro S.A. — (“Albras”).................. Aluminum 51.00 51.00 Nippon Amazon - NAAC Valesul Aluminio S.A. (“Valesul”)......................... Aluminum 100.00 100.00 N/A
2.2.1 Bauxite
We conduct our bauxite operations through our joint venture Mineração Rio do Norte S.A. (“MRN”) and at the parent company level.
• MRN. MRN, which is located in the northern region of the Brazilian state of Pará, is one of the largest bauxite operations in the world, operating four open-pit bauxite mines that produce high quality bauxite. In addition, MRN controls substantial additional high quality bauxite resources. MRN also operates ore beneficiation facilities at its mines, which are connected by rail to a loading terminal and port facilities on the Trombetas River, a tributary of the Amazon River, that can handle vessels of up to 60,000 DWT. MRN owns and operates the rail and the port facilities serving its mines. The MRN mines are accessible by road from the port area and obtain electricity from their own thermal power plant.
• Paragominas mine. Operations at our Paragominas mine, in the Brazilian state of Pará, began in the first quarter of 2007 to supply Alunorte’s expansion. The mine has a nominal annual production capacity of 5.4 million metric tons of wet 12% moisture bauxite, and the bauxite quality is similar to that of MRN. The Paragominas site has a beneficiation plant with milling and a 244-kilometer slurry pipeline.

36
The following table sets forth information on our bauxite production.
Production for the year ended December 31,
Mine Type 2005 2006 2007 Nominal capacity Recovery rate (million metric tons) (%)
MRN: Almeidas................................... Open pit 9.4 8.4 4.8 N/A 73 Aviso ........................................ Open pit 12.5 12.0 14.4 N/A 73 SaracáV .................................... Open pit 2.6 1.6 2.1 N/A 73 Saracá W .................................. Open pit – 3.2 3.5 N/A 73
Total MRN(1)................................ 24.5 25.2 24.8 18.3 Paragominas:
Miltonia 3 ................................. Open pit – 0.0 1.9 N/A 70 Total Paragominas......................... – 0.0 1.9 5.4
(1) These figures represent run-of-mine production. MRN’s final product production totaled 17.2 million metric tons in 2005, 17.8 million metric tons in 2006 and 18.1 million metric tons in 2007.
We are developing the following bauxite projects:
• Paragominas II. The start-up of Paragominas II, which is scheduled for the first half of 2008, will expand bauxite nominal production capacity to 9.9 million metric tons per year. The estimated total project cost is US$196 million. Paragominas II will supply the bauxite necessary for the operations of stages 6 and 7 of Alunorte.
• Paragominas III. Paragominas III, which will increase production capacity by 4.95 million metric tons per year, has an estimated cost of US$416 million. We intend to supply the first stage of the New Alumina Refinery with production from Paragominas III. The project, which is scheduled for completion in the first half of 2011, remains subject to approval by our board of directors.
2.2.2 Alumina
We conduct our alumina operations in Brazil, through our subsidiary Alunorte, which produces alumina by refining bauxite supplied by MRN and the Paragominas mine. The Alunorte plant is the largest alumina refinery in the world, with a nominal production capacity of 4.4 million metric tons per year. It has one of the lowest conversion costs in the world (US$117.6 per metric ton in 2007).
Alunorte sells alumina to our subsidiary Albras, its principal customer, as well as to our subsidiary Valesul and unaffiliated customers. Albras’ aluminum production facilities are located nearby, in the city of Barcarena in the state of Pará, and Alunorte and Albras share infrastructure and other resources.
The following table sets forth information on our alumina production.
Production for the year ended December 31, Company 2005 2006 2007 Nominal capacity
(million metric tons) Alunorte...................................................................... 2.6 3.9 4.3 4.4
We are developing the following alumina projects:
• Alunorte -stages 6 & 7. The construction of stages 6 and 7 will add another 1.9 million metric tons to Alunorte’s nominal production capacity. The start-up is scheduled for the second half of 2008 and the estimated total cost is US$846 million.
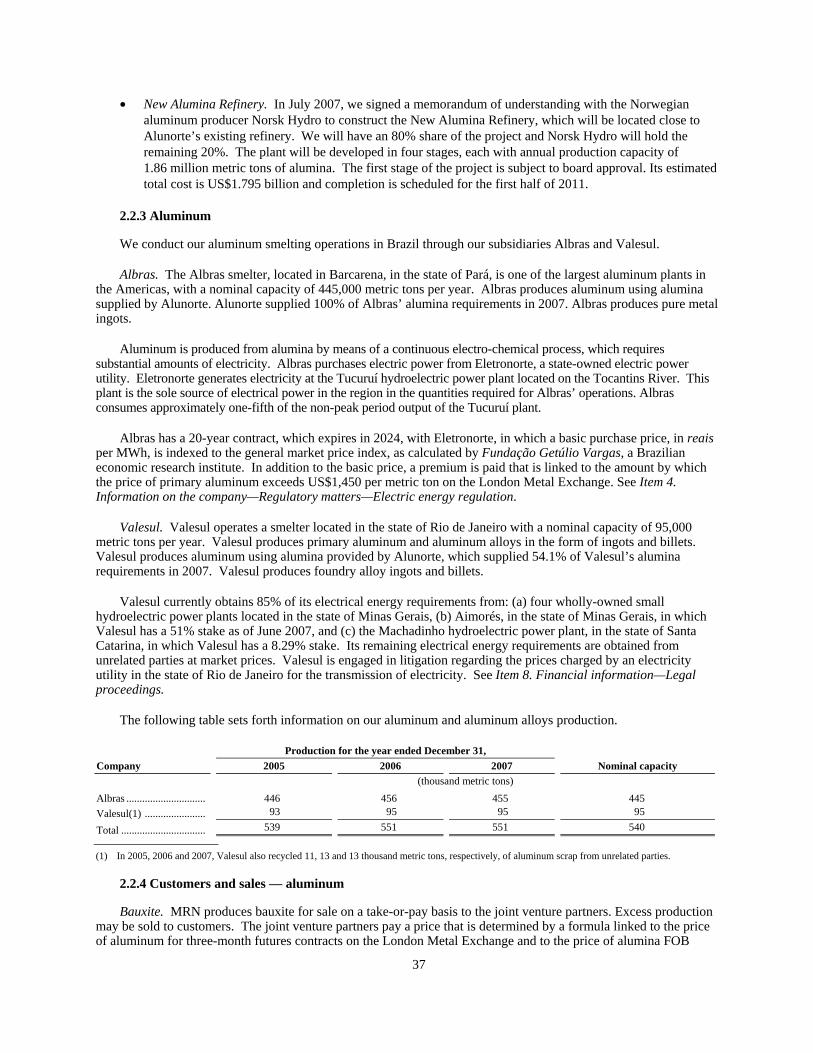
37
• New Alumina Refinery. In July 2007, we signed a memorandum of understanding with the Norwegian aluminum producer Norsk Hydro to construct the New Alumina Refinery, which will be located close to Alunorte’s existing refinery. We will have an 80% share of the project and Norsk Hydro will hold the remaining 20%. The plant will be developed in four stages, each with annual production capacity of 1.86 million metric tons of alumina. The first stage of the project is subject to board approval. Its estimated total cost is US$1.795 billion and completion is scheduled for the first half of 2011.
2.2.3 Aluminum
We conduct our aluminum smelting operations in Brazil through our subsidiaries Albras and Valesul.
Albras. The Albras smelter, located in Barcarena, in the state of Pará, is one of the largest aluminum plants in the Americas, with a nominal capacity of 445,000 metric tons per year. Albras produces aluminum using alumina supplied by Alunorte. Alunorte supplied 100% of Albras’ alumina requirements in 2007. Albras produces pure metal ingots.
Aluminum is produced from alumina by means of a continuous electro-chemical process, which requires substantial amounts of electricity. Albras purchases electric power from Eletronorte, a state-owned electric power utility. Eletronorte generates electricity at the Tucuruí hydroelectric power plant located on the Tocantins River. This plant is the sole source of electrical power in the region in the quantities required for Albras’ operations. Albras consumes approximately one-fifth of the non-peak period output of the Tucuruí plant.
Albras has a 20-year contract, which expires in 2024, with Eletronorte, in which a basic purchase price, in reais per MWh, is indexed to the general market price index, as calculated by Fundação Getúlio Vargas, a Brazilian economic research institute. In addition to the basic price, a premium is paid that is linked to the amount by which the price of primary aluminum exceeds US$1,450 per metric ton on the London Metal Exchange. See Item 4. Information on the company—Regulatory matters—Electric energy regulation.
Valesul. Valesul operates a smelter located in the state of Rio de Janeiro with a nominal capacity of 95,000 metric tons per year. Valesul produces primary aluminum and aluminum alloys in the form of ingots and billets. Valesul produces aluminum using alumina provided by Alunorte, which supplied 54.1% of Valesul’s alumina requirements in 2007. Valesul produces foundry alloy ingots and billets.
Valesul currently obtains 85% of its electrical energy requirements from: (a) four wholly-owned small hydroelectric power plants located in the state of Minas Gerais, (b) Aimorés, in the state of Minas Gerais, in which Valesul has a 51% stake as of June 2007, and (c) the Machadinho hydroelectric power plant, in the state of Santa Catarina, in which Valesul has a 8.29% stake. Its remaining electrical energy requirements are obtained from unrelated parties at market prices. Valesul is engaged in litigation regarding the prices charged by an electricity utility in the state of Rio de Janeiro for the transmission of electricity. See Item 8. Financial information—Legal proceedings.
The following table sets forth information on our aluminum and aluminum alloys production.
Production for the year ended December 31, Company 2005 2006 2007 Nominal capacity (thousand metric tons) Albras .............................. 446 456 455 445 Valesul(1) ....................... 93 95 95 95
Total ................................ 539 551 551 540
(1) In 2005, 2006 and 2007, Valesul also recycled 11, 13 and 13 thousand metric tons, respectively, of aluminum scrap from unrelated parties.
2.2.4 Customers and sales — aluminum
Bauxite. MRN produces bauxite for sale on a take-or-pay basis to the joint venture partners. Excess production may be sold to customers. The joint venture partners pay a price that is determined by a formula linked to the price of aluminum for three-month futures contracts on the London Metal Exchange and to the price of alumina FOB

38
Australia. In 2007, our subsidiary Alunorte purchased 78.7% of its bauxite requirements from MRN. Paragominas sells all of its production to our subsidiary Alunorte, which corresponds to 17.7% of its bauxite requirements in 2007.
Alumina. Each Alunorte partner must purchase on a take-or-pay basis all alumina produced by Alunorte in proportion to its respective interest. The partners each pay the same price, which is determined by a formula based on the price of aluminum for three-month futures contracts on the London Metal Exchange. We use a portion of our share of Alunorte’s alumina production to supply the Brazilian market (Albras and Valesul), and sell the remainder to customers in other countries, such as Argentina, Canada, Egypt, Norway and the United States.
Aluminum. The Albras partners must purchase on a take-or-pay basis all aluminum produced by Albras in proportion to their ownership interests. We generally market our aluminum in the global markets, mainly Asia and Europe, to clients in the aluminum industry. Valesul’s aluminum products are sold primarily in the Brazilian market on a spot basis.
2.2.5 Competition — alumina and aluminum
Alumina. The alumina market is competitive, but small compared to the primary aluminum market, because many of the major aluminum-producing companies have integrated bauxite, alumina and aluminum operations. Competition in the alumina market is based primarily on quality, reliability of supply and price, which is directly related to lower costs. We believe that Alunorte is competitive in the alumina market because of the high quality of its alumina, its advantages in scale and technology, low conversion costs, its efficient port facilities, and the ongoing commitment of its shareholders to purchase a substantial portion of its annual production.
Aluminum. The global aluminum market is highly competitive. The world’s largest producers are Alcoa, Rusal, Rio Tinto, Norsk Hydro, BHP Billiton and Chalco. As primary aluminum is a commodity, competition in the aluminum market is based primarily on the economics of transportation and the costs of production. We believe that Albras and Valesul are competitive in the aluminum market because of their relatively efficient and accessible port facilities, and their generally prevailing lower costs of production.
2.3 Copper
2.3.1 Operations — copper
We conduct our copper operations at the parent-company level in Brazil and through our subsidiary Vale Inco in Canada.
Brazilian copper operations
Our Sossego copper mine in Carajás, in the state of Pará, has two main copper ore bodies, Sossego and Sequeirinho. Its annual operating capacity is 14 million metric tons of run-of-mine, averaging 120,000 metric tons of copper contained in concentrate (30% grade) and 104,000 ounces of gold in concentrate. The copper ore is mined by open-pit method, and the run-of-mine is processed by means of standard primary crushing and conveying, SAG milling (a semi-autogenous mill that uses a large rotating drum filled with ore, water and steel grinding balls to transform the ore into a fine slurry), ball milling, copper concentrate flotation, tailings disposal, concentrate thickening, filtration and load out. We truck the concentrate to a storage terminal in Parauapebas and then transport it via the EFC railroad to the Ponta da Madeira maritime terminal in São Luís, in the state of Maranhão.
We constructed an 85-kilometer road to link Sossego to the Carajás air and rail facilities and a power line that allows us to purchase electrical power at market prices. We have a long-term energy supply contract with Eletronorte, a state-owned power generation company.
Canadian copper operations
In Canada, we recover copper in conjunction with our nickel operations, principally at Sudbury and Voisey’s Bay. At Sudbury, we produce two intermediate copper products: copper concentrate and copper anodes. As we streamline our Sudbury operations to separate nickel and copper production streams, we expect to increase our production of copper

39
concentrate (and proportionately decrease our production of copper anodes). At Sudbury, we also produce electrowon copper cathode as a by-product of our nickel refining operations. At Voisey’s Bay, we produce copper concentrates.
2.3.2 Production — copper
Production for the year ended December 31, Mine Type 2005 2006 2007 Nominal capacity(1) (thousand metric tons) Brazil: Sossego................ Open pit 107 117 118 120 Canada: Sudbury ............... Underground 126 109 113 117 Voisey’s Bay ....... Open pit 4 28 42 42 Thompson............ Underground 0 1 1 2 External(2)........... N/A 0 11 9 10
Total..................... 237 267 284 291
(1) These figures represent nominal capacity in 2007, which is equivalent to planned production for 2007. (2) We process copper at our facilities using feed purchased from unrelated parties. For 2005, Sudbury-source production includes such “external-source”
production.
2.3.3 Projects and exploration — copper
• Hydro-metallurgical plant. At Sossego, we are building a plant, Usina Hidrometalúrgica de Carajás, to test the application of hydro-metallurgical technology for the industrial-scale processing of more complex copper minerals to produce copper cathode. We will use copper concentrate from our Sossego mine to feed this plant. We expect the plant to have annual production capacity of 10,000 metric tons of copper cathode. Operations are scheduled to begin in the first half of 2008. If proven to be efficient, after the estimated 21-month testing period, we believe this technology could be used to process the sulphide ore produced at the mines in the Carajás mineral province at a relatively low cost.
• Papomono. We are investing in the Papomono project in the Coquimbo region of Chile, which has an estimated nominal production capacity of 18,000 metric tons per year of copper cathode. The estimated total cost of the project is US$102 million. The completion of this project is scheduled for the second half of 2009.
• Salobo I. Salobo I is the first phase of development of the Salobo copper deposit in Carajás. Nominal capacity for Salobo I is estimated at 100,000 metric tons per year of copper in concentrate, with 130,000 troy ounces of gold in concentrate per year. The concentrate will be processed using conventional smelting technology. The total estimated cost for this project is US$1.152 billion. It is scheduled to be completed by the second half of 2010.
• Totten. The Totten nickel mine in Sudbury, Ontario is expected to produce 11,200 metric tons of copper per year as a co-product. Completion is scheduled for the first half of 2011. The estimated total cost of the project is US$362 million.
• 118. This project is estimated to have nominal production capacity of 36,000 metric tons per year of copper cathode. We are awaiting the issuance of the final environmental permit in order to start construction.
We are engaged in copper mineral exploration primarily in Argentina, Chile, Democratic Republic of Congo, Mongolia, Peru, and the Philippines.
2.3.4 Customers and sales — copper
Copper concentrate from Sossego is sold under medium-term contracts to copper smelters in South America, Europe and Asia. We have a long-term off-take agreement to sell the majority of copper concentrate from Salobo I. Vale Inco has long-term copper supply agreements with Xstrata Copper Canada for the sale of copper anode and copper concentrate.
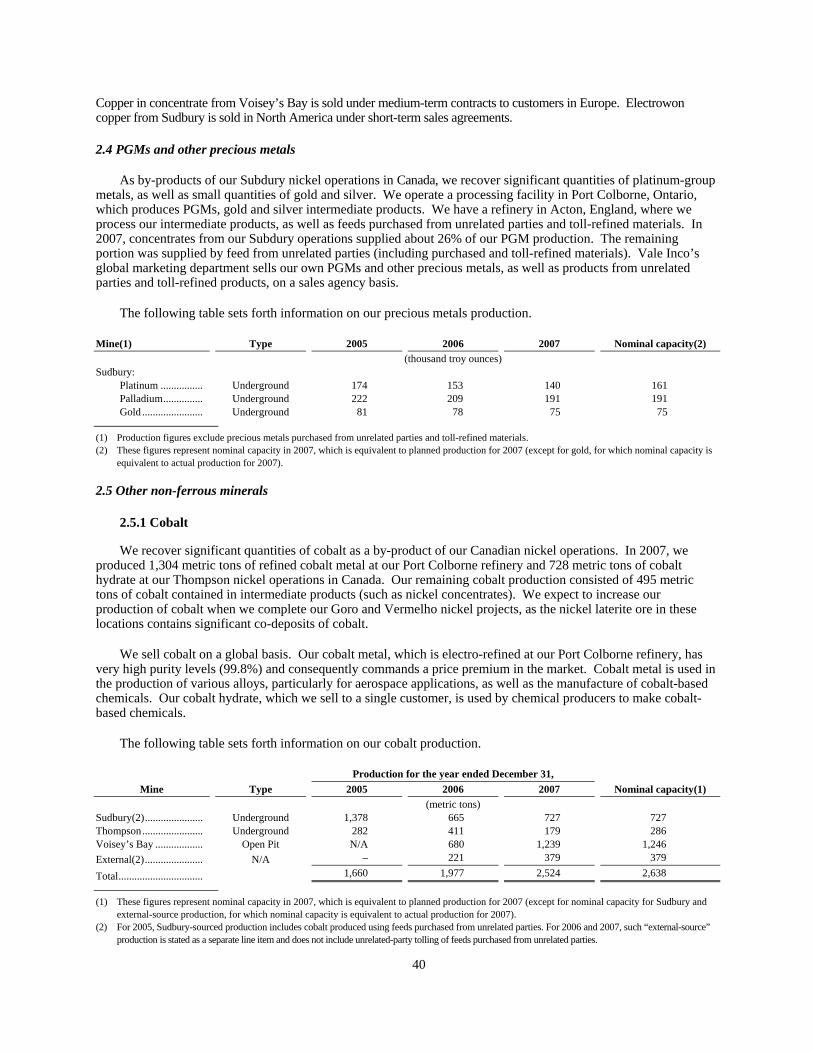
40
Copper in concentrate from Voisey’s Bay is sold under medium-term contracts to customers in Europe. Electrowon copper from Sudbury is sold in North America under short-term sales agreements.
2.4 PGMs and other precious metals
As by-products of our Subdury nickel operations in Canada, we recover significant quantities of platinum-group metals, as well as small quantities of gold and silver. We operate a processing facility in Port Colborne, Ontario, which produces PGMs, gold and silver intermediate products. We have a refinery in Acton, England, where we process our intermediate products, as well as feeds purchased from unrelated parties and toll-refined materials. In 2007, concentrates from our Subdury operations supplied about 26% of our PGM production. The remaining portion was supplied by feed from unrelated parties (including purchased and toll-refined materials). Vale Inco’s global marketing department sells our own PGMs and other precious metals, as well as products from unrelated parties and toll-refined products, on a sales agency basis.
The following table sets forth information on our precious metals production.
Mine(1) Type 2005 2006 2007 Nominal capacity(2) (thousand troy ounces) Sudbury: Platinum ................ Underground 174 153 140 161 Palladium............... Underground 222 209 191 191 Gold ....................... Underground 81 78 75 75
(1) Production figures exclude precious metals purchased from unrelated parties and toll-refined materials. (2) These figures represent nominal capacity in 2007, which is equivalent to planned production for 2007 (except for gold, for which nominal capacity is
equivalent to actual production for 2007).
2.5 Other non-ferrous minerals
2.5.1 Cobalt
We recover significant quantities of cobalt as a by-product of our Canadian nickel operations. In 2007, we produced 1,304 metric tons of refined cobalt metal at our Port Colborne refinery and 728 metric tons of cobalt hydrate at our Thompson nickel operations in Canada. Our remaining cobalt production consisted of 495 metric tons of cobalt contained in intermediate products (such as nickel concentrates). We expect to increase our production of cobalt when we complete our Goro and Vermelho nickel projects, as the nickel laterite ore in these locations contains significant co-deposits of cobalt.
We sell cobalt on a global basis. Our cobalt metal, which is electro-refined at our Port Colborne refinery, has very high purity levels (99.8%) and consequently commands a price premium in the market. Cobalt metal is used in the production of various alloys, particularly for aerospace applications, as well as the manufacture of cobalt-based chemicals. Our cobalt hydrate, which we sell to a single customer, is used by chemical producers to make cobalt-based chemicals.
The following table sets forth information on our cobalt production.
Production for the year ended December 31, Mine Type 2005 2006 2007 Nominal capacity(1)
(metric tons) Sudbury(2)...................... Underground 1,378 665 727 727 Thompson....................... Underground 282 411 179 286 Voisey’s Bay .................. Open Pit N/A 680 1,239 1,246 External(2)...................... N/A – 221 379 379
Total................................ 1,660 1,977 2,524 2,638
(1) These figures represent nominal capacity in 2007, which is equivalent to planned production for 2007 (except for nominal capacity for Sudbury and external-source production, for which nominal capacity is equivalent to actual production for 2007).
(2) For 2005, Sudbury-sourced production includes cobalt produced using feeds purchased from unrelated parties. For 2006 and 2007, such “external-source” production is stated as a separate line item and does not include unrelated-party tolling of feeds purchased from unrelated parties.

41
2.5.2 Kaolin
We conduct our kaolin business in Brazil, through the subsidiaries set forth in the following table:
Our share of capital Company Location Voting Total Partners (%) CADAM S.A (CADAM) ........................ Barcarena, Pará 100 61.48 Bancodo Brasil and BNDES Pará Pigmentos S.A.(PPSA) ................... Barcarena, Pará 85.57 86.17 Mitsubishi Corporation
CADAM and PPSA produce kaolin for paper coating. They also conduct research into other uses for kaolin
products in order to develop a more diversified portfolio.
CADAM is located on the border of the states of Pará and Amapá, in the Amazon area in northern Brazil. CADAM’s reserves are principally concentrated in the open-pit Morro do Felipe mine, in Vitoria do Jari, in the state of Amapá. The beneficiation plant and private port are situated on the west bank of the Jari River, in Munguba, in the state of Pará.
PPSA operates an open-pit mine, Rio Capim, and a beneficiation plant. These operations are linked to the land and port facilities in Barcarena, via a 180-kilometer pipeline. The beneficiated kaolin is pumped through a slurry pipeline. PPSA produces the following products: Century, Century S, Paraprint, Paraplate and Paralux. They are sold mainly in the European, Asian and North American markets.
The following table sets forth information on our kaolin production.
Production for the year ended
December 31,
Mine Type 2006 2007 Nominal capacity
Recovery rate(1)
(thousand metric tons) (%) CADAM: Morrodo Felipe.................... Open Pit 755 714 844 51.2 PPSA: Rio Capim ........................... Open Pit 597 639 672 28.8 Total 1,352 1,354 1,516
(1) Total recovery rate.
2.5.3 Potash
We conduct potash operations in Brazil at the parent company level. We lease the only potash mine in Brazil (in Rosario do Catete, in the state of Sergipe) from Petrobras – Petróleo Brasileiro S.A., the Brazilian state-owned oil company. The lease, signed in 1991, became effective in 1992 for a period of 25 years. All sales from the Taquari-Vassouras mine are to the Brazilian market.
The following table sets forth information on our potash production.
Production for the year ended December 31,
Mine Type 2005 2006 2007 Nominal capacity
Recoveryrate (%)
(thousandmetrictons) Taquari-Vassouras........................ Underground 641 731 671 850 87.5
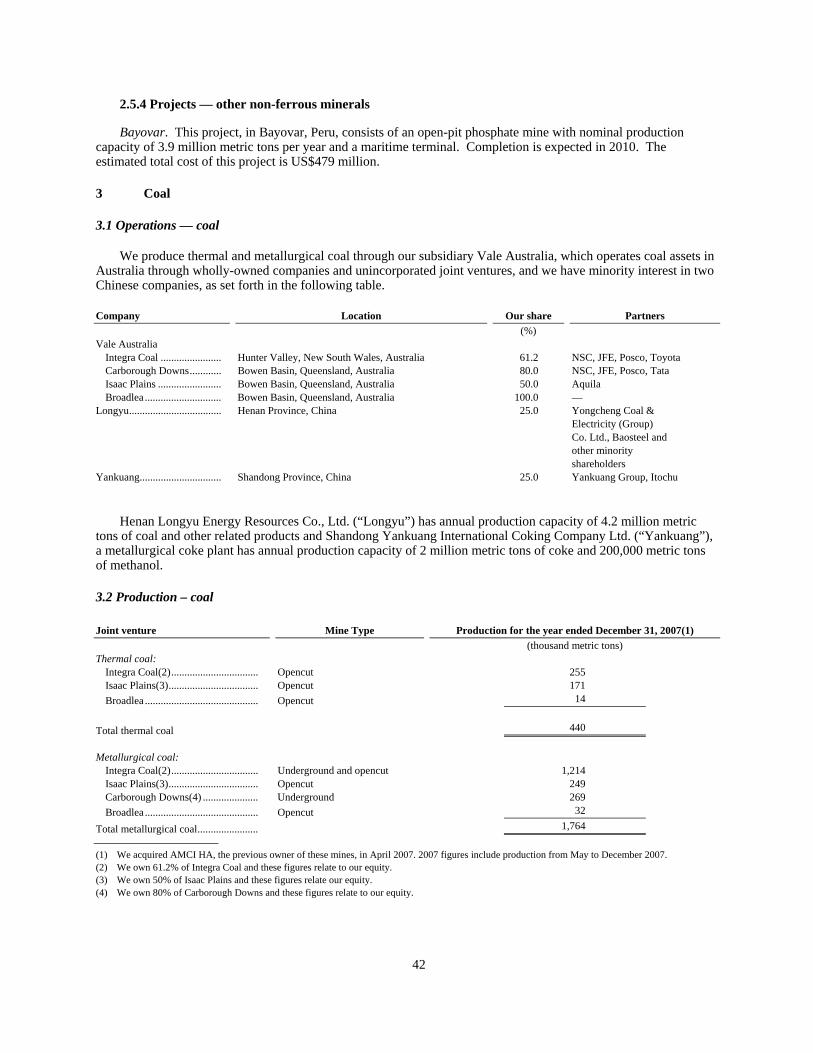
42
2.5.4 Projects — other non-ferrous minerals
Bayovar. This project, in Bayovar, Peru, consists of an open-pit phosphate mine with nominal production capacity of 3.9 million metric tons per year and a maritime terminal. Completion is expected in 2010. The estimated total cost of this project is US$479 million.
3 Coal
3.1 Operations — coal
We produce thermal and metallurgical coal through our subsidiary Vale Australia, which operates coal assets in Australia through wholly-owned companies and unincorporated joint ventures, and we have minority interest in two Chinese companies, as set forth in the following table.
Company Location Our share Partners (%) Vale Australia
Integra Coal ....................... Hunter Valley, New South Wales, Australia 61.2 NSC, JFE, Posco, Toyota Carborough Downs............ Bowen Basin, Queensland, Australia 80.0 NSC, JFE, Posco, Tata Isaac Plains ........................ Bowen Basin, Queensland, Australia 50.0 Aquila Broadlea ............................. Bowen Basin, Queensland, Australia 100.0 —
Longyu................................... Henan Province, China 25.0 Yongcheng Coal & Electricity (Group) Co. Ltd., Baosteel and other minority shareholders Yankuang............................... Shandong Province, China 25.0 Yankuang Group, Itochu
Henan Longyu Energy Resources Co., Ltd. (“Longyu”) has annual production capacity of 4.2 million metric tons of coal and other related products and Shandong Yankuang International Coking Company Ltd. (“Yankuang”), a metallurgical coke plant has annual production capacity of 2 million metric tons of coke and 200,000 metric tons of methanol.
3.2 Production – coal
Joint venture Mine Type Production for the year ended December 31, 2007(1) (thousand metric tons) Thermal coal:
Integra Coal(2)................................. Opencut 255 Isaac Plains(3).................................. Opencut 171 Broadlea ........................................... Opencut 14
Total thermal coal 440 Metallurgical coal:
Integra Coal(2)................................. Underground and opencut 1,214 Isaac Plains(3).................................. Opencut 249 Carborough Downs(4) ..................... Underground 269 Broadlea ........................................... Opencut 32
Total metallurgical coal....................... 1,764
(1) We acquired AMCI HA, the previous owner of these mines, in April 2007. 2007 figures include production from May to December 2007. (2) We own 61.2% of Integra Coal and these figures relate to our equity. (3) We own 50% of Isaac Plains and these figures relate our equity. (4) We own 80% of Carborough Downs and these figures relate to our equity.

43
Company Mine Type Nominal capacity (million metric tons) Integra Coal(1) ...................................................................................................... Underground and opencut 2.75 Isaac Plains(2) ....................................................................................................... Opencut 1.4 Carborough Downs(3)........................................................................................... Underground 3.36 Broadlea................................................................................................................. Opencut 0.8
Total....................................................................................................................... 8.31
(1) We own 61.2% of Integra Coal and these figures relate to our equity. (2) We own 50% of Isaac Plains and these figures relate our equity. (3) We own 80% of Carborough Downs and these figures relate to our equity.
3.3 Projects and exploration – coal
• Moatize. We have obtained all of the required licenses from the Mozambique government for the construction of the Moatize mine, which will have nominal production capacity of 11 million metric tons per year, of which 8.5 million metric tons per year will be metallurgical coal and 2.5 million metric tons per year will be thermal coal. The estimated total cost of this project is US$1.398 billion. We are awaiting the conclusion of negotiations involving the railroad transportation and port handling services to start the construction. We estimate that the construction will take 36 months.
• Carborough Downs. This project will increase the nominal capacity of the Carborough Downs mine to 4.8 million metric tons per year. The longwall tones operations are scheduled to start in the second half of 2009. Meanwhile, the mine is producing up to 1.0 million metric tons per year via continuous miners in the development of gate roads and inventory of longwall panels. The project requires an estimated total investment of US$330 million.
We are currently seeking opportunities for greenfield mineral exploration for coal in Australia, Colombia, Mongolia and Mozambique.
3.4 Customers and sales – coal
Our coal sales are primarily focused in East Asia. In 2007, 60% of our coal sales were made to Japanese steel mills and power utilities. We also sell coal to customers in South Korea, India, Taiwan, China, Pakistan and Brazil. In 2007, our Chinese coal joint ventures directed their sales mainly to the Chinese domestic market.
Our Queensland operations commenced production in late 2006. In 2007, we were engaged in trial shipments to a number of different countries. Aided by a strong market for metallurgical coal, we were able to market various types of coal from our Isaac Plains, Carborough Downs and Broadlea mines in a number of target markets.
3.5 Competition – coal
The global coal industry, which is primarily comprised of the markets for metallurgical coal and thermal coal, is highly competitive. Continued growth in steel demand, especially in Asia, will continue to underpin strong demand for metallurgical coal. With major port (and often rail) constraints in the short term in some of the countries in which major suppliers are located, we expect new metallurgical coal availability to be limited. Given these factors and a number of new coke batteries under development, we expect continued favorable market conditions.
The thermal coal market is the most rapidly growing segment of the global coal industry. The global seaborne thermal coal market has significantly expanded in recent years. Growth in thermal coal demand is closely related to growth in electricity consumption, which will continue to be driven by global economic growth, particularly from emerging markets economies. The cost of fuel is typically the largest variable cost involved in electricity generation and, on an energy basis, coal is currently the cheapest fossil fuel for this purpose.
Competition in the coal industry is based primarily on the economics of production costs, coal quality, and transportation costs. We believe that our operations and project pipeline are competitive, and our key competitive
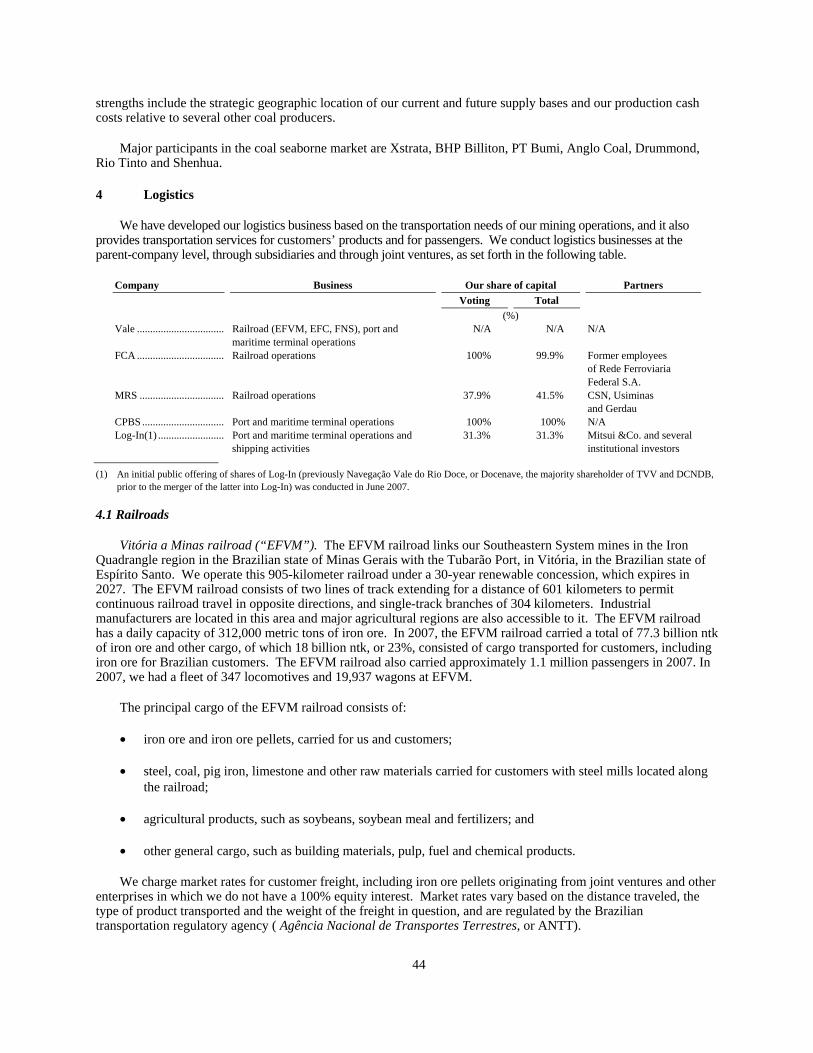
44
strengths include the strategic geographic location of our current and future supply bases and our production cash costs relative to several other coal producers.
Major participants in the coal seaborne market are Xstrata, BHP Billiton, PT Bumi, Anglo Coal, Drummond, Rio Tinto and Shenhua.
4 Logistics
We have developed our logistics business based on the transportation needs of our mining operations, and it also provides transportation services for customers’ products and for passengers. We conduct logistics businesses at the parent-company level, through subsidiaries and through joint ventures, as set forth in the following table.
Company Business Our share of capital Partners Voting Total (%) Vale ................................. Railroad (EFVM, EFC, FNS), port and
maritime terminal operations N/A N/A N/A
FCA ................................. Railroad operations 100% 99.9% Former employees of Rede Ferroviaria Federal S.A.
MRS ................................ Railroad operations 37.9% 41.5% CSN, Usiminas and Gerdau
CPBS ............................... Port and maritime terminal operations 100% 100% N/A Log-In(1) ......................... Port and maritime terminal operations and
shipping activities 31.3% 31.3% Mitsui &Co. and several
institutional investors
(1) An initial public offering of shares of Log-In (previously Navegação Vale do Rio Doce, or Docenave, the majority shareholder of TVV and DCNDB, prior to the merger of the latter into Log-In) was conducted in June 2007.
4.1 Railroads
Vitória a Minas railroad (“EFVM”). The EFVM railroad links our Southeastern System mines in the Iron Quadrangle region in the Brazilian state of Minas Gerais with the Tubarão Port, in Vitória, in the Brazilian state of Espírito Santo. We operate this 905-kilometer railroad under a 30-year renewable concession, which expires in 2027. The EFVM railroad consists of two lines of track extending for a distance of 601 kilometers to permit continuous railroad travel in opposite directions, and single-track branches of 304 kilometers. Industrial manufacturers are located in this area and major agricultural regions are also accessible to it. The EFVM railroad has a daily capacity of 312,000 metric tons of iron ore. In 2007, the EFVM railroad carried a total of 77.3 billion ntk of iron ore and other cargo, of which 18 billion ntk, or 23%, consisted of cargo transported for customers, including iron ore for Brazilian customers. The EFVM railroad also carried approximately 1.1 million passengers in 2007. In 2007, we had a fleet of 347 locomotives and 19,937 wagons at EFVM.
The principal cargo of the EFVM railroad consists of:
• iron ore and iron ore pellets, carried for us and customers;
• steel, coal, pig iron, limestone and other raw materials carried for customers with steel mills located along the railroad;
• agricultural products, such as soybeans, soybean meal and fertilizers; and
• other general cargo, such as building materials, pulp, fuel and chemical products.
We charge market rates for customer freight, including iron ore pellets originating from joint ventures and other enterprises in which we do not have a 100% equity interest. Market rates vary based on the distance traveled, the type of product transported and the weight of the freight in question, and are regulated by the Brazilian transportation regulatory agency ( Agência Nacional de Transportes Terrestres, or ANTT).

45
Carajás railroad (“EFC”). We operate the EFC railroad under a 30-year renewable concession, which expires in 2027. This railroad, located in the Northern System, starts at our Carajás iron ore mines in the Brazilian state of Pará, and extends 892 kilometers to our Ponta da Madeira maritime terminal complex facilities located near the São Luís Port in the Brazilian state of Maranhão. The EFC railroad consists of one line of track, with spur tracks and turnouts to permit the passage of trains in opposite directions. The EFC railroad has a daily capacity of 255,000 metric tons of iron ore. In 2007, the EFC railroad carried a total of 84.3 billion ntk of iron ore and other cargo, of which 7.2 billion ntk, or 8% consisted of cargo transported for customers, including iron ore for Brazilian customers. The EFC railroad also carried approximately 353,000 passengers in 2007. The main cargo of the EFC railroad consists of iron ore, principally carried for us. In 2007, we had a fleet of 183 locomotives and 9,901 wagons at EFC. In 2008, we also intend to begin operations of the largest capacity train in Latin America. This train will have 330 cars, measure 3.2 kilometers and weigh 41,900 gross metric tons when loaded.
Ferrovia Norte-Sul railroad (“FNS”). In October 2007, we won the auction for the subconcession for commercial operation for 30 years of a 720-kilometer segment of the FNS railroad, in Brazil. Since 1996, we have operated a segment of the FNS, which connects to the EFC railroad, enabling access to the port of Itaqui, in São Luís, where our Ponta da Madeira maritime terminal is located. A 213.2-kilometer extension is currently under construction by the concession owner and is scheduled to be completed in December 2008. A state-owned company is required to complete a new segment of 148.3 kilometers by December 2009. This project will create a new corridor for the transportation of general cargo, mainly for the export of soybeans, rice and corn produced in the center-northern region of Brazil.
Ferrovia Centro-Atlântica (“FCA”). Our subsidiary FCA operates the central-east regional railway network of the Brazilian national railway system under a 30-year renewable concession, which expires in 2026. The central east network has approximately 7,000 kilometers of track extending into the states of Sergipe, Bahia, Espírito Santo, Minas Gerais, Rio de Janeiro and Goiás and Brasília, the Federal District of Brazil. It connects with our EFVM railroad near the cities of Belo Horizonte, in the state of Minas Gerais and Vitória, in the state of Espírito Santo. FCA operates on the same track gauge as our EFVM railroad and provides access to the Santos Port in the state of São Paulo. In 2007, the FCA railroad transported a total of 11.6 billion ntk of cargo for customers. In 2007, we had a fleet of 477 locomotives and 11,794 wagons at FCA.
MRS Logística S.A. (“MRS”). The MRS railroad, which transported 52.7 billion ntk in 2007, is 1,674 kilometers long and links the Brazilian states of Rio de Janeiro, São Paulo and Minas Gerais. It is operated under a 30-year renewable concession granted in 1996. Our MRS stake has been the subject of administrative proceedings at the Brazilian agency that regulates ground transportation, ANTT, and the Brazilian antitrust authority, CADE. See Item 4. Information on the company—Regulatory matters—Railroad regulation and Item 8. Financial information—Legal proceedings—CADE proceedings.
4.2 Ports and maritime terminals
We operate a port and six maritime terminals principally as a means to complete the delivery of our iron ore and iron ore pellets to bulk carrier vessels serving the seaborne market. See Item 4. Information on the company—Lines of business—Ferrous minerals—Operations—iron ore pellets. We also use our port and terminals to handle customers’ cargo. In 2007, 9% of the cargo handled by our port and terminals represented cargo handled for customers.
Tubarão Port. The Tubarão Port, which covers an area of approximately 18 square kilometers, is located near the Vitória Port in the Brazilian state of Espírito Santo. The iron ore maritime terminal located in this area has two piers. Pier I can accommodate two vessels at a time, one of up to 170,000 DWT on the southern side and one of up to 200,000 DWT on the northern side. Pier II can accommodate one vessel of up to 365,000 DWT at a time, limited at 20 meters draft plus tide. In Pier I there are two ship loaders, which can load up to a combined total of 14,000 metric tons per hour. In Pier II there are two ship loaders that work alternately and can each load up to 16,000 metric tons per hour. In 2007, 101 million metric tons of iron ore and iron ore pellets were shipped through the terminal for us. Praia Mole Terminal, also located in the Tubarão Port, is principally a coal terminal and handled 12 million metric tons in 2007. We operate a grain terminal called Terminal de Produtos Diversos, in the Tubarão area, which handled 6 million metric tons of grains and fertilizers in 2007. We also operate a bulk liquid terminal that handled 1.2 million metric tons in 2007.

46
Ponta da Madeira maritime terminal. The Ponta da Madeira maritime terminal is located near the Itaqui Port in the Brazilian state of Maranhão. The terminal facilities can accommodate three vessels. Pier I can accommodate vessels displacing up to 420,000 DWT. Pier II can accommodate vessels of up to 155,000 DWT. The two berths have a maximum loading rate of 16,000 tons per hour at Pier I and 8,000 tons per hour at Pier II. Pier III has two berths, can accommodate vessels of up to 220,000 DWT and has a maximum loading rate of 8,000 metric tons per hour in each berth. Cargo shipped through our Ponta da Madeira maritime terminal consists principally of our own iron ore production. Other cargo includes manganese ore and copper concentrate produced by us and pig iron and soybeans for unrelated parties. In 2007, 81.2 million metric tons were handled through the terminal for us and 4.7 million metric tons for customers.
Itaguaí maritime terminal – Cia. Portuária Baía de Sepetiba (“CPBS”). CPBS is a wholly-owned subsidiary that operates the Itaguaí terminal, in the Sepetiba Port, in the Brazilian state of Rio de Janeiro. Itaguaí’s maritime terminal has a pier that allows the loading of ships up to 18.1 meters and up to 230,000 DWT. In 2007, the terminal uploaded approximately 25.2 million metric tons of iron ore. From December 2007 to February 2008, Itaguaí operated with limited capacity as a result of an accident with a ship in the terminal. It resumed operations at full capacity in the last week of February 2008.
Guaíba Island maritime terminal. MBR has its own maritime terminal on Guaíba Island in the Sepetiba Bay, in the Brazilian state of Rio de Janeiro. The iron ore terminal has a pier that allows the loading of ships of up to 300,000 DWT. In 2007, the terminal uploaded approximately 43.9 million metric tons of iron ore.
Inácio Barbosa maritime terminal (“TMIB”). We operate the Inácio Barbosa maritime terminal, located in the Brazilian state of Sergipe. The terminal is owned by Petrobras. Vale and Petrobras entered into an agreement in December 2002, which allows Vale to operate this terminal for a period of 10 years. In 2007, 1.7 metric tons of fuel and agricultural and steel products were shipped through TMIB.
Paul Terminal. We ceased to operate the Paul Terminal in April 2007, following the expiration of the operating lease.
4.3 Shipping
We operate in two distinct shipping areas: seaborne dry bulk shipping and tug boat services.
The following table sets forth information on the volume of cargo that our seaborne dry bulk shipping service carried for the periods indicated.
Cargo volume for the year ended December 31, Cargo 2005 2006 2007 (thousand metric tons) Iron ore:
Vale ............................................................................................................................ 1,981 160 1,324 Customers................................................................................................................... 148 148 –
Coal ................................................................................................................................ – 0 147 Other .............................................................................................................................. 2,196 2,243 –
Total ........................................................................................................................... 4,325 2,551 1,471
We operate three capesize vessels, which have been fully dedicated to perform shuttle services from Brazil to
China since May 2007. In May 2007, we entered into long-term freight contracts to develop a dedicated shuttle service from Brazil to China using these vessels. We expect this service to enhance our ability to offer our products in the Chinese market at competitive prices and to increase our market share in China and the global seaborne market.
In late 2006, we restructured our intermodal shipping business, which was conducted through subsidiaries of Docenave. We formally changed Docenave’s name to Log-In in early 2007 and subsequently conducted an initial public offering of Log-In’s shares in June 2007. Log-In is now listed on the Novo Mercado segment of the BOVESPA. Log-In offers port handling and container transportation services, by sea or rail, as well as container storage. It has a fleet of seven ships for coastal shipping, a container terminal (Terminal Vila Velha, or TVV) and two multimodal

47
terminals. In 2007, Log-In’s coastal shipping service transported 79,488 twenty-foot equivalent units (teus), TVV handled 275,737 teus and its express train service moved 44,787 teus.
We also operate a fleet of 24 tug boats (13 owned and 11 chartered) in the ports of Vitória (in the Brazilian state of Espírito Santo), Trombetas (in the Brazilian state of Pará), São Luís (in the Brazilian state of Maranhão) and Aracaju (in the Brazilian state of Sergipe).
4.4 Projects – logistics
• Northern Corridor and Southern Corridor projects. We are investing in our railroads and ports in order to increase our logistics capacity in our integrated iron ore systems. We are investing to increase the capacity of the EFC and EFVM railroads and are expanding the capacity of the Ponta da Madeira and Tubarão ports. The estimated total cost of the Northern Corridor project is US$956 million, and the estimated total cost of the Southern Corridor project is US$553 million. The conclusion of these projects is scheduled for the first half of 2009.
• Litorânea Sul railroad. The Litorânea Sul railroad will be 165-kilometers long and will provide access to the port of Ubu in the state of Espírito Santo, to the south of Tubarão, where a new industrial zone is being created and where the Baosteel CSV steel slab plant, a project in which we have invested, will be located. The estimated total cost of this project, which is subject to board approval, is US$414 million. The conclusion of this project is scheduled for 2011.
5 Other investments
5.1 Steel
Our steel business consists of a pig iron operation conducted through our Ferro-Gusa Carajás unit, in Northern Brazil, and we also have investments in two steel companies, as set forth in the following table. We also have investments in three joint ventures to produce steel slab in Brazil, in order to create additional demand for our iron ore.
Our share of capital Company Location Voting Total Partners (%) Vale ............................ Brazil N/A N/A N/A CSI ............................. California, United States 50 50 JFE Steel Usiminas .................... Brazil 5.89 2.9
Nippon, Usiminas employees, Previ, Votorantim, Camargo Correa and others
Ferro-Gusa Carajás. Our pig iron operation was conducted through our subsidiary Ferro-Gusa Carajás S.A. (“FGC”) until April 2008, when FGC was merged into Vale. We utilize two conventional mini-blast furnaces to produce approximately 350,000 metric tons of pig iron per year, using iron ore from our Carajás mines in northern Brazil. The charcoal source is exclusively from eucalyptus trees grown in a cultivated forest of 82,000 acres, with the total project encompassing approximately 200,000 acres.
California Steel Industries. California Steel Industries (“CSI”) is a flat rolled steel producer located in the United States. CSI produces approximately 1.8 million metric tons of flat steel per year.
Usiminas. In the first half of 2007, we sold Usiminas shares in a public offering for an aggregate of US$728 million. We still own 2.9% of Usiminas’ total capital stock and are a party to a shareholders’ agreement. Usiminas is a large producer of steel in the Brazilian states of Minas Gerais and São Paulo. Its production facilities have nominal annual production capacity of 9.5 million metric tons of crude steel.
48
Joint ventures for steel slab production
• ThyssenKrupp-CSA – Siderúrgica do Atlântico Ltda. We have a minority stake in an integrated steel slab plant in the Brazilian state of Rio de Janeiro, which is currently under construction. Our total investment will be US$420 million, corresponding to a 10% stake in the joint venture. Start-up is scheduled for the first half of 2009.
• Baosteel CSV. In October 2007, we signed an agreement with Baosteel Group Corporation, the largest steel producer in China, to develop an integrated steel slab plant in Brazil, in the state of Espírito Santo. Start-up of this project, which is subject to board approval, is scheduled for 2012. When the plant is completed, we expect to have a 20% stake in the joint venture. Our total investment has not yet been determined.
• Companhia Siderúrgica de Pecém – CSP. In November 2007, we signed a memorandum of understanding with Dongkuk Steel Mill Co. (“Dongkuk”), one of the largest steel producers in South Korea, for the construction of a steel slab plant in the Brazilian state of Ceará with initial production capacity of 2.5 million metric tons per year with the possibility for expansion to 5 million metric tons per year. In April 2008, we signed a new memorandum of understanding with Dongkuk and JFE Steel Corporation (“JFE”) to conduct a feasibility study to analyze the construction of a larger steel slab plant, with initial production capacity of 5 to 6 million metric tons per year. Depending on the outcome of the feasibility study, JFE will either participate in the project as a majority shareholder or not at all. In the latter case, we and Dongkuk will construct the plant as contemplated in the November memorandum of understanding. This project is subject to board approval, and our total investment has not yet been determined.
5.2 Energy investments
Brazil
Energy management and efficient supply in Brazil are priorities for us, given the uncertainties associated with changes in the regulatory environment, and the risk of rising electricity prices and electrical energy shortages (as experienced in Brazil in the second half of 2001). We currently have seven hydroelectric power plants in operation and one under construction in Brazil. We plan to use the electricity produced by these projects for our internal needs. In the first quarter of 2007, Capim Branco II began operations, supplying a portion of our electricity consumption needs in southeastern Brazil. As a large consumer of electricity, we expect that investing in power projects will help to reduce costs and protect us against energy price volatility. However, we may experience construction delays in certain generation projects due to environmental and regulatory issues, which may lead to higher costs.
We also hold 43.85% of a consortium that has a concession to build the Santa Isabel hydroelectric power plant on the Araguaia River, Brazil. We continue our efforts to obtain the necessary environmental license to begin its construction.
We are developing the following energy projects in Brazil:
• Barcarena thermal power plant. In the second half of 2008, we plan to start the construction of a coal-fired thermal power plant in Brazil with capacity of 600 MW. Completion is scheduled for the second half of 2010. The estimated total investment in the project is US$898 million.
• Estreito hydroelectric power plant. In the second half of 2007, we started the construction of the Estreito hydroelectric power plant, located on the Tocantins River, on the border of the Brazilian states of Maranhão and Tocantins. The plant will have an installed capacity of 1,087 MW. Completion is targeted for the second half of 2010. We have a 30% stake in the consortium that will build and operate the plant. Our estimated share of the total investment is US$514 million.

49
• Natural gas exploration. In September 2007, we entered into a memorandum of understanding with Shell Brasil Ltda (“Shell”), to jointly evaluate opportunities and develop partnerships in order to meet our energy needs. As a result of this partnership, we are participating in an exploration block in the Espírito Santo basin, off the southeastern coast of Brazil. In November 2007, we acquired for US$17.5 million the right to explore nine gas exploration blocks in different regions in Brazil, in an auction held by the Brazilian regulatory agency for the oil industry, ANP ( Agência Nacional do Petróleo, Gás Natural e Biocombustíveis ). We intend to use any natural gas discovered to meet our energy needs.
Canada
In 2007, our wholly-owned and operated hydroelectric power plants in Sudbury generated 16% of the electricity requirements of our Sudbury operations. The power plants consist of five separate generation stations with an installed generator nameplate capacity of approximately 56 MW. The output of the plants is limited by water availability, as well as constraints imposed by a water management plan regulated by the provincial government. Over the course of 2007, the power system operator distributed electrical energy at the rate of approximately 198 MW to all surface plants and mines in the Sudbury area.
Low-cost energy is available from purchased hydroelectric power at our Thompson operations. Energy requirements for production from our Canadian sulphide ores are generally about one-fifth of the energy required to process lateritic ores.
Indonesia
Energy costs are a significant component of our nickel production costs for the processing of lateritic ores at our PT Inco operations in Indonesia. Virtually all of PT Inco’s electric furnace power requirements are supplied at low-cost by its two hydroelectric power plants on the Larona River, Larona, generating an average of 165 MW, and Balambano, generating an average of 110 MW. In 2007, PT Inco installed 32 diesel generators in order to supplement its hydroelectric power supply with a source of energy that is not subject to hydrological factors. The new generators have the capacity to provide 32 MW of power.
We are building the Karebbe hydroelectric power generating plant on the Larona River. Karebbe will be the third hydroelectric power plant built by PT Inco, and it is intended to reduce production costs and make possible the production of 90,718 metric tons per year of nickel in matte. The estimated total cost of Karebbe is US$252 million, and start-up is scheduled for the first half of 2011.
New Caledonia
Goro entered into an electricity supply agreement with the local public provider of electricity (Enercal) in 2004. The provision of electricity under this agreement was due to begin in January 2008, but has since been delayed. This agreement governs the provision of at least 50 MW of power to the Goro project. The term of the agreement is 25 years, with options to renew for five additional five-year terms.

50
RESERVES
Presentation of information concerning reserves
The estimates of proven and probable ore reserves at our mines and projects and the estimates of mine life included in this annual report have been prepared by our staff of experienced geologists and engineers or independent consultants and calculated in accordance with the technical definitions required by the U.S. Securities and Exchange Commission, or the SEC. Under the SEC’s Industry Guide 7:
• Reserves are the part of a mineral deposit that could be economically and legally extracted or produced at the time of the reserve determination.
• Proven (measured) reserves are reserves for which (a) quantity is computed from dimensions revealed in outcrops, trenches, working or drill holes; grade and/or quality are computed from the results of detailed sampling and (b) the sites for inspection, sampling and measurement are spaced so closely and the geologic character is so well defined that size, shape, depth and mineral content of reserves are well-established.
• Probable (indicated) reserves are reserves for which quantity and grade and/or quality are computed from information similar to that used for proven (measured) reserves, but the sites for inspection, sampling and measurement are farther apart or are otherwise less adequately spaced. The degree of assurance, although lower than that for proven (measured) reserves, is high enough to assume continuity between points of observation.
We periodically revise our reserve estimates when we have new geological data, economic assumptions or mining plans. During 2008, we are performing an analysis of our reserve estimates for certain projects, which will be reflected in new estimates as of December 31, 2008. Reserve estimates for each operation are for 100% of the operation and assume that we either have or will obtain all of the necessary rights to mine, extract and process ore reserves at each mine. Where we own less than 100% of the operation, reserve estimates have not been adjusted to reflect our ownership interest. For a description of risks relating to reserves and reserve estimates, see Item 3. Key information—Risk factors.
Iron ore reserves
In preparing iron ore reserve data, we used price assumptions that did not exceed the following three-year (2005 to 2007) historical average prices for iron ore:
• Iron ore – Southeastern System fines (SSF) reference price to Asia: US$0.6443 per Fe unit
• Iron ore – Carajás fines (CJF) reference price to Asia: US$0.6541 per Fe unit
Our iron ore reserve estimates are of in-place material after adjustments for mining depletion and mining losses and recoveries, with no adjustments made for metal losses due to processing.
51
Iron ore – Southeastern System mines(1) Proven Probable Total Tonnage Grade Tonnage Grade Tonnage Grade Itabira mines
Conceição ............................... 302.4 53.2 37.7 62.3 340.0 54.2 Minas do Meio ....................... 374.7 53.8 179.4 56.1 554.2 54.5 Centrais mines Água Limpa / Cururu ............. 19.2 45.2 25.3 45.6 44.5 45.4 Gongo Soco ............................ 68.1 65.2 9.0 62.5 77.1 64.9 Brucutu ................................... 320.6 52.7 372.0 50.3 692.6 51.4 Baú.......................................... – – 37.1 55.7 37.1 55.7 Maquiné.................................. 145.2 60.3 133.5 56.2 278.7 58.3 Andrade .................................. 109.9 59.6 14.3 54.7 124.2 59.1 Mariana mines Alegria .................................... 192.5 50.5 56.4 48.2 248.9 50.0 Fábrica Nova .......................... 567.7 47.2 323.0 44.1 890.7 46.1 Fazendão................................. 254.5 50.1 94.5 49.7 349.0 50.0
Timbopeba ................................. – – 73.5 55.2 73.5 55.2 Urucum
Mina de Ferro ......................... – – 59.7 60.9 59.7 60.9 Total Southeastern System............ 2,354.8 52.3 1,415.4 51.3 3,770.2 51.9
(1) Tonnage is stated in millions of metric tons of wet run-of-mine. Grade is % of Fe. Approximate drill hole spacings used to classify the reserves were: 100m x 100m to proven reserves and 200m x 200m to probable reserves.
Iron ore – Southeastern System mines
Type Operating since Projected
exhaustion date Vale interest (%) Itabira mines
Conceição ....................................................... Open pit 1957 2023 100
Minas do Meio ............................................... Open pit 1976 2023 100 Centrais mines 100 Água Limpa / Cururu ..................................... Open pit 2000 2013 50.0 Gongo Soco .................................................... Open pit 2000 2013 100 Brucutu ........................................................... Open pit 1994 2027 100 Baú.................................................................. Open pit – 2029 100 Maquiné.......................................................... Open pit – 2029 100 Andrade(1) ..................................................... Open pit 2005 2027 100
Mariana mines Alegria ............................................................ Open pit 2000 2029 100 Fábrica Nova .................................................. Open pit 2005 2023 100 Fazendão......................................................... Open pit 1976 2032 100 Timbopeba...................................................... Open pit 1984 2008 100
(1) We entered into a 40-year contract with Companhia Siderúrgica Belgo-Mineira to lease the Andrade mine.
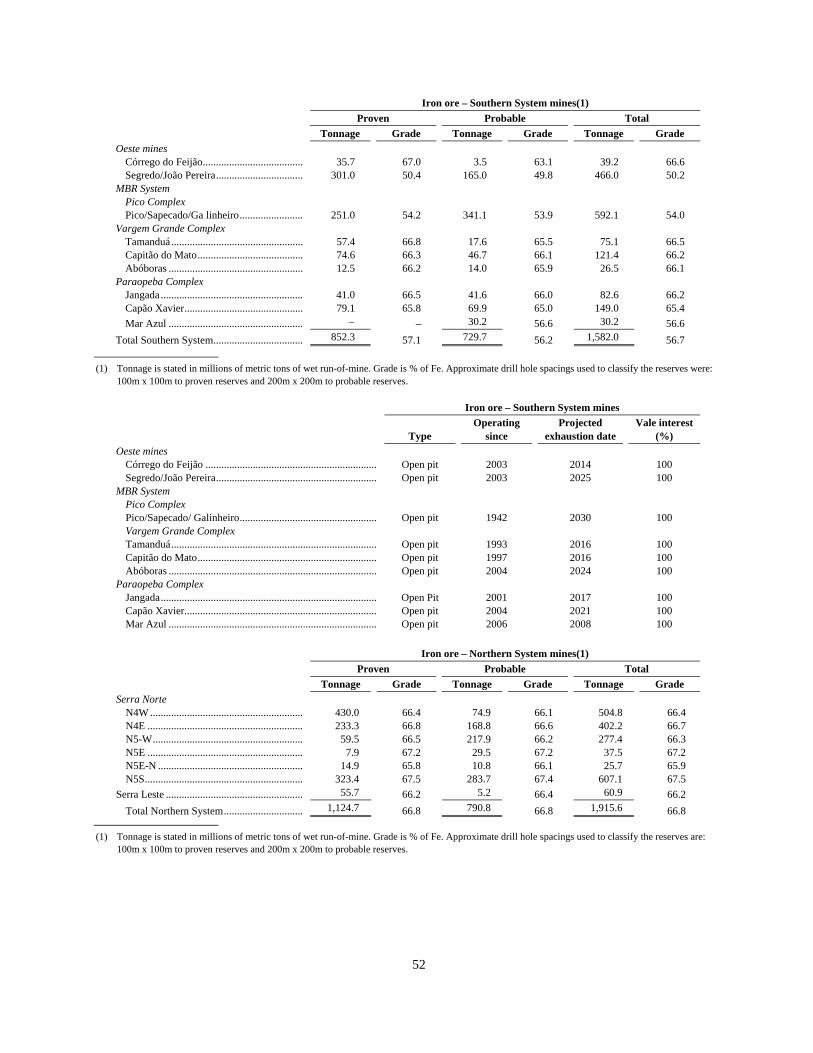
52
Iron ore – Southern System mines(1) Proven Probable Total Tonnage Grade Tonnage Grade Tonnage Grade Oeste mines
Córrego do Feijão...................................... 35.7 67.0 3.5 63.1 39.2 66.6 Segredo/João Pereira................................. 301.0 50.4 165.0 49.8 466.0 50.2
MBR System Pico Complex Pico/Sapecado/Ga linheiro........................ 251.0 54.2 341.1 53.9 592.1 54.0
Vargem Grande Complex Tamanduá.................................................. 57.4 66.8 17.6 65.5 75.1 66.5 Capitão do Mato........................................ 74.6 66.3 46.7 66.1 121.4 66.2 Abóboras ................................................... 12.5 66.2 14.0 65.9 26.5 66.1
Paraopeba Complex Jangada...................................................... 41.0 66.5 41.6 66.0 82.6 66.2 Capão Xavier............................................. 79.1 65.8 69.9 65.0 149.0 65.4 Mar Azul ................................................... – – 30.2 56.6 30.2 56.6
Total Southern System.................................. 852.3 57.1 729.7 56.2 1,582.0 56.7
(1) Tonnage is stated in millions of metric tons of wet run-of-mine. Grade is % of Fe. Approximate drill hole spacings used to classify the reserves were: 100m x 100m to proven reserves and 200m x 200m to probable reserves.
Iron ore – Southern System mines
Type Operating
since Projected
exhaustion date Vale interest
(%) Oeste mines
Córrego do Feijão ................................................................. Open pit 2003 2014 100 Segredo/João Pereira............................................................. Open pit 2003 2025 100
MBR System Pico Complex Pico/Sapecado/ Galinheiro.................................................... Open pit 1942 2030 100 Vargem Grande Complex Tamanduá.............................................................................. Open pit 1993 2016 100 Capitão do Mato.................................................................... Open pit 1997 2016 100 Abóboras ............................................................................... Open pit 2004 2024 100
Paraopeba Complex Jangada.................................................................................. Open Pit 2001 2017 100 Capão Xavier......................................................................... Open pit 2004 2021 100 Mar Azul ............................................................................... Open pit 2006 2008 100
Iron ore – Northern System mines(1) Proven Probable Total Tonnage Grade Tonnage Grade Tonnage Grade Serra Norte
N4W .......................................................... 430.0 66.4 74.9 66.1 504.8 66.4 N4E ........................................................... 233.3 66.8 168.8 66.6 402.2 66.7 N5-W......................................................... 59.5 66.5 217.9 66.2 277.4 66.3 N5E ........................................................... 7.9 67.2 29.5 67.2 37.5 67.2 N5E-N ....................................................... 14.9 65.8 10.8 66.1 25.7 65.9 N5S............................................................ 323.4 67.5 283.7 67.4 607.1 67.5
Serra Leste .................................................... 55.7 66.2 5.2 66.4 60.9 66.2 Total Northern System.............................. 1,124.7 66.8 790.8 66.8 1,915.6 66.8
(1) Tonnage is stated in millions of metric tons of wet run-of-mine. Grade is % of Fe. Approximate drill hole spacings used to classify the reserves are: 100m x 100m to proven reserves and 200m x 200m to probable reserves.

53
Iron ore – Northern System mines
Type Operating
since Projected
exhaustion date Vale interest
(%) Serra Norte
N4W ...................................................................................... Open Pit 1994 2020 100 N4E........................................................................................ Open pit 1984 2017 100 N5-W..................................................................................... Open pit 1998 2023 100 N5E........................................................................................ Open pit 1998 2017 100 N5E-N ................................................................................... Open pit 2003 2016 100 N5S........................................................................................ Open pit – 2025 100
Serra Leste ................................................................................ Open pit – 2039 100
Iron ore – Total reserves for all systems(1) Proven Probable Total Tonnage Grade Tonnage Grade Tonnage Grade
Total Southeastern System ........................... 2,354.8 52.3 1,415.4 51.3 3,770.2 51.9 Total Southern System ................................. 852.3 57.1 729.7 56.2 1,582.0 56.7 Total Northern System ................................. 1,124.7 66.8 790.8 66.8 1,915.6 66.8
Total Vale.................................................. 4,331.8 57.0 2,935.9 56.7 7,267.8 56.9
(1) Tonnage is stated in millions of metric tons of wet run-of-mine. Grade is % of Fe. Changes in iron ore reserves: 2007 versus 2006
Our iron ore reserve estimates decreased from 7,619.3 to 7,267.8 million metric tons. The decrease reflects mining production during the year and the build-up of intermediate and buffer ore stocks, which are composed of ore that has been mined out of in situ but has not been fed to the processing plants. These stocks may be partially reclaimed during operations and are not declared as ore reserves.
Manganese ore reserves
In preparing manganese reserve data, we used price assumptions that did not exceed the three-year (2005 to 2007) historical average price for manganese of US$145.06 per metric ton (published by Commodities Research Unit). We have adjusted ore reserve estimates for extraction losses and metallurgical recoveries during extraction.
Manganese ore reserves(1) Proven Probable Total Tonnage Grade Tonnage Grade Tonnage Grade
Azul .............................................................. – – 42.0 35.2 42.0 35.2 Urucum ......................................................... – – 7.4 45.3 7.4 45.3 Morro da Mina.............................................. 6.0 23.1 3.2 23.0 9.2 23.1
Total .......................................................... 6.0 23.1 52.5 35.9 58.5 34.6
(1) Tonnage is stated in millions of metric tons of wet run-of-mine. Grade is % of Mn.
Manganese ore mines
Type Operating
since Projected
exhaustion date Vale interest
(%)
Azul........................................................................................... Open pit 1985 2017 100 Urucum ..................................................................................... Underground 1976 2020 100 Morro da Mina.......................................................................... Open pit 1902 2030 100
Changes in manganese ore reserves: 2007 versus 2006
Our manganese ore reserve estimates decreased from 60.0 to 58.6 million metric tons in 2007, primarily reflecting mining depletion and, to a lesser extent, the build-up of buffer run-of-mine stockpiles, which are mined out of “in situ” reserves but have not been fed to the plants. These stocks may be partially reclaimed during operations and are not declared as ore reserves.

54
Nickel ore reserves
In preparing nickel reserve data, we used price assumptions that did not exceed the three-year (2005 to 2007) historical average LME spot price for nickel of US$25,337 per metric ton. Our nickel reserve estimates are of in-place material after adjustments for mining depletion and mining losses (or screening and drying in the cases of Sulawesi, Goro and Vermelho) and recoveries, with no adjustments made for metal losses due to processing.
Nickel ore reserves(1) Proven Probable Total Tonnage Grade Tonnage Grade Tonnage Grade
Canada: Sudbury...................................................... 80.6 1.17 79.7 1.17 160.3 1.17 Thompson.................................................. 10.5 1.99 13.7 1.68 24.1 1.82 Voisey’s Bay ............................................. 25.5 3.04 3.4 0.66 28.9 2.76
Indonesia(2): Sulawesi..................................................... 80.4 1.80 80.5 1.76 160.9 1.78
New Caledonia(2): Goro........................................................... 96.2 1.34 23.7 2.01 120.0 1.48
Brazil: Vermelho ................................................... 119.3 1.25 4.3 1.29 123.6 1.25 Onça Puma ................................................ 55.1 1.79 27.6 1.62 82.7 1.73 Total........................................................... 467.6 1.53 232.9 1.54 700.6 1.53
(1) Tonnage is stated in millions of dry metric tons. Grade is % of nickel. (2) We have rights to other properties in Indonesia, New Caledonia and in other locations, which have not yet been fully explored.
Nickel ore mines
Type Operating
since Projected
exhaustion date Vale interest
(%) Canada:
Sudbury.................................................................................. Underground 1885 2044 100 Thompson.............................................................................. Underground 1960 2020 100 Voisey’s Bay ......................................................................... Open pit 2005 2019 100
Indonesia: Sulawesi................................................................................. Open cast 1978 2039 61.0
New Caledonia: Goro....................................................................................... Open pit – 2036 74.0
Brazil: Vermelho ............................................................................... Open pit – 2050 100 Onça Puma ............................................................................ Open pit – 2039 100
Changes in nickel ore reserves: 2007 versus 2006
Reserves at our Sudbury operations decreased from 175 to 160.3 million metric tons, after mining depletion, while nickel grades remained similar. The change was essentially due to reclassification of mineral reserves to mineral resources at the non-operating Murray mine, which was partially offset by exploration additions and re-evaluations at our operating mines.
Reserves at our Thompson operations remained stable at 24.1 million metric tons. Mining depletion was partially offset by ore reserve additions resulting from exploration and mine plan re-evaluations. The estimated average nickel grade declined by 4%.
Reserves at our Voisey’s Bay operations decreased from 31 to 28.9 million metric tons, primarily due to mining depletion, which was partially offset by a reduction in mining dilution based on life-of-mine plan versus actual mining reconciliation results, which also contributed to a 3% increase in the estimated average nickel grade.
Reserves at Sulawesi decreased from 177 to 160.9 million metric tons, after adjustments for mining depletion of 5 million metric tons and a reclassification of ore reserve to mineral resource categories of 11 million metric tons to meet a revised processing feed plant chemistry target with lower iron content based on 2007 operating results.
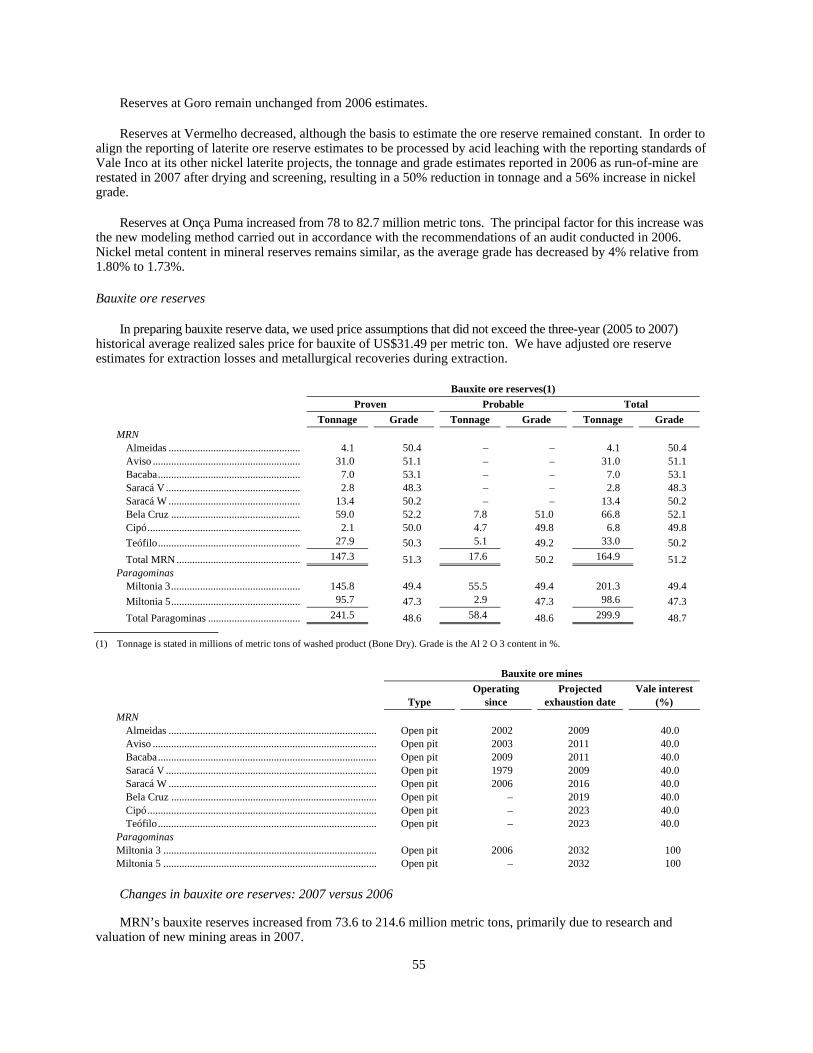
55
Reserves at Goro remain unchanged from 2006 estimates.
Reserves at Vermelho decreased, although the basis to estimate the ore reserve remained constant. In order to align the reporting of laterite ore reserve estimates to be processed by acid leaching with the reporting standards of Vale Inco at its other nickel laterite projects, the tonnage and grade estimates reported in 2006 as run-of-mine are restated in 2007 after drying and screening, resulting in a 50% reduction in tonnage and a 56% increase in nickel grade.
Reserves at Onça Puma increased from 78 to 82.7 million metric tons. The principal factor for this increase was the new modeling method carried out in accordance with the recommendations of an audit conducted in 2006. Nickel metal content in mineral reserves remains similar, as the average grade has decreased by 4% relative from 1.80% to 1.73%.
Bauxite ore reserves
In preparing bauxite reserve data, we used price assumptions that did not exceed the three-year (2005 to 2007) historical average realized sales price for bauxite of US$31.49 per metric ton. We have adjusted ore reserve estimates for extraction losses and metallurgical recoveries during extraction.
Bauxite ore reserves(1) Proven Probable Total Tonnage Grade Tonnage Grade Tonnage Grade
MRN Almeidas .................................................. 4.1 50.4 – – 4.1 50.4 Aviso ........................................................ 31.0 51.1 – – 31.0 51.1 Bacaba...................................................... 7.0 53.1 – – 7.0 53.1 Saracá V ................................................... 2.8 48.3 – – 2.8 48.3 Saracá W .................................................. 13.4 50.2 – – 13.4 50.2 Bela Cruz ................................................. 59.0 52.2 7.8 51.0 66.8 52.1 Cipó.......................................................... 2.1 50.0 4.7 49.8 6.8 49.8 Teófilo...................................................... 27.9 50.3 5.1 49.2 33.0 50.2 Total MRN............................................... 147.3 51.3 17.6 50.2 164.9 51.2
Paragominas Miltonia 3................................................. 145.8 49.4 55.5 49.4 201.3 49.4 Miltonia 5................................................. 95.7 47.3 2.9 47.3 98.6 47.3 Total Paragominas ................................... 241.5 48.6 58.4 48.6 299.9 48.7
(1) Tonnage is stated in millions of metric tons of washed product (Bone Dry). Grade is the Al 2 O 3 content in %.
Bauxite ore mines
Type Operating
since Projected
exhaustion date Vale interest
(%) MRN
Almeidas ............................................................................... Open pit 2002 2009 40.0 Aviso ..................................................................................... Open pit 2003 2011 40.0 Bacaba................................................................................... Open pit 2009 2011 40.0 Saracá V ................................................................................ Open pit 1979 2009 40.0 Saracá W ............................................................................... Open pit 2006 2016 40.0 Bela Cruz .............................................................................. Open pit – 2019 40.0 Cipó....................................................................................... Open pit – 2023 40.0 Teófilo................................................................................... Open pit – 2023 40.0
Paragominas Miltonia 3 ................................................................................. Open pit 2006 2032 100 Miltonia 5 ................................................................................. Open pit – 2032 100
Changes in bauxite ore reserves: 2007 versus 2006
MRN’s bauxite reserves increased from 73.6 to 214.6 million metric tons, primarily due to research and valuation of new mining areas in 2007.
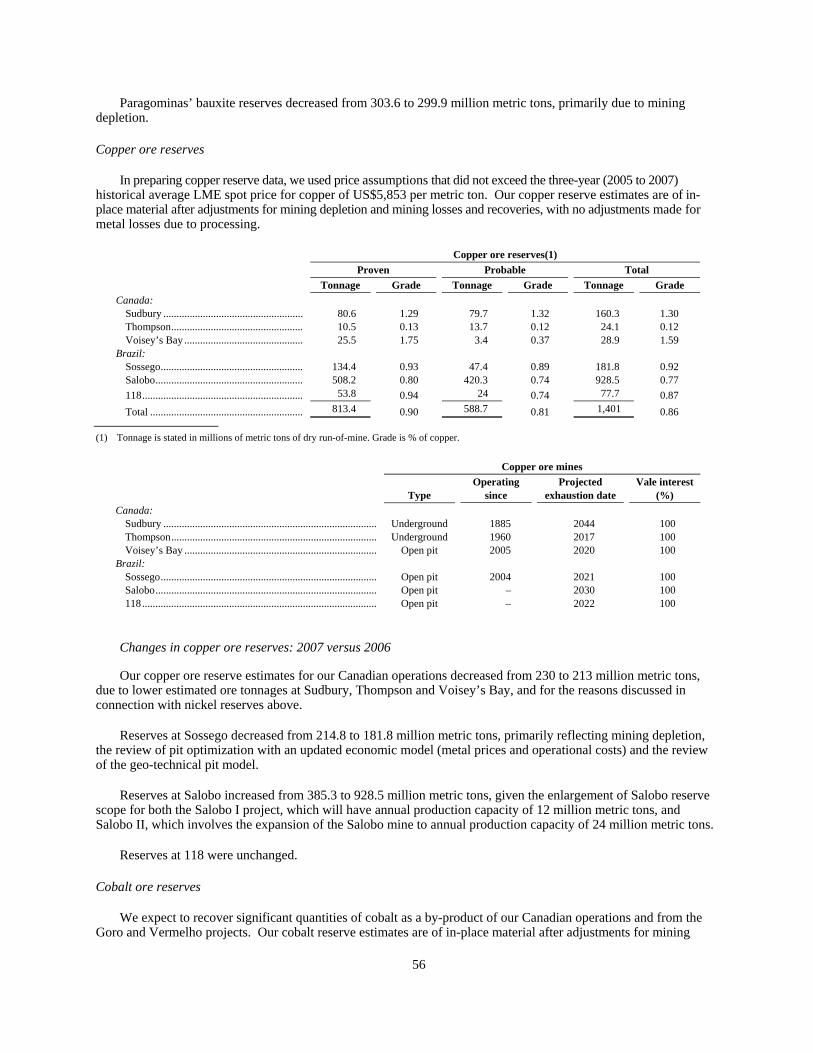
56
Paragominas’ bauxite reserves decreased from 303.6 to 299.9 million metric tons, primarily due to mining depletion.
Copper ore reserves
In preparing copper reserve data, we used price assumptions that did not exceed the three-year (2005 to 2007) historical average LME spot price for copper of US$5,853 per metric ton. Our copper reserve estimates are of in-place material after adjustments for mining depletion and mining losses and recoveries, with no adjustments made for metal losses due to processing.
Copper ore reserves(1) Proven Probable Total Tonnage Grade Tonnage Grade Tonnage Grade
Canada: Sudbury ..................................................... 80.6 1.29 79.7 1.32 160.3 1.30 Thompson.................................................. 10.5 0.13 13.7 0.12 24.1 0.12 Voisey’s Bay ............................................. 25.5 1.75 3.4 0.37 28.9 1.59
Brazil: Sossego...................................................... 134.4 0.93 47.4 0.89 181.8 0.92 Salobo........................................................ 508.2 0.80 420.3 0.74 928.5 0.77 118............................................................. 53.8 0.94 24 0.74 77.7 0.87 Total .......................................................... 813.4 0.90 588.7 0.81 1,401 0.86
(1) Tonnage is stated in millions of metric tons of dry run-of-mine. Grade is % of copper.
Copper ore mines
Type Operating
since Projected
exhaustion date Vale interest
(%) Canada:
Sudbury ................................................................................. Underground 1885 2044 100 Thompson.............................................................................. Underground 1960 2017 100 Voisey’s Bay ......................................................................... Open pit 2005 2020 100
Brazil: Sossego.................................................................................. Open pit 2004 2021 100 Salobo.................................................................................... Open pit – 2030 100 118......................................................................................... Open pit – 2022 100
Changes in copper ore reserves: 2007 versus 2006
Our copper ore reserve estimates for our Canadian operations decreased from 230 to 213 million metric tons, due to lower estimated ore tonnages at Sudbury, Thompson and Voisey’s Bay, and for the reasons discussed in connection with nickel reserves above.
Reserves at Sossego decreased from 214.8 to 181.8 million metric tons, primarily reflecting mining depletion, the review of pit optimization with an updated economic model (metal prices and operational costs) and the review of the geo-technical pit model.
Reserves at Salobo increased from 385.3 to 928.5 million metric tons, given the enlargement of Salobo reserve scope for both the Salobo I project, which will have annual production capacity of 12 million metric tons, and Salobo II, which involves the expansion of the Salobo mine to annual production capacity of 24 million metric tons.
Reserves at 118 were unchanged.
Cobalt ore reserves
We expect to recover significant quantities of cobalt as a by-product of our Canadian operations and from the Goro and Vermelho projects. Our cobalt reserve estimates are of in-place material after adjustments for mining

57
depletion and mining losses (or screening and drying in the cases of Goro and Vermelho) and recoveries, with no adjustments made for metal losses due to processing.
Cobalt ore reserves(1) Proven Probable Total Tonnage Grade Tonnage Grade Tonnage Grade
Canada: Sudbury ..................................................... 80.6 0.04 79.7 0.03 160.3 0.04 Voisey’s Bay............................................. 25.5 0.15 3.4 0.03 28.9 0.14
New Caledonia: Goro .......................................................... 96.2 0.12 23.7 0.09 120.0 0.11
Brazil: Vermelho................................................... 119.3 0.06 4.3 0.07 123.6 0.06 Total .......................................................... 321.6 0.08 111.1 0.04 432.8 0.07
(1) Tonnage is stated in millions of metric tons. Grade is % of cobalt.
Cobalt ore mines
Type Operating
since Projected
exhaustion date Vale interest
(%) Canada:
Sudbury ................................................................................. Underground 1885 2044 100 Voisey’s Bay......................................................................... Open pit 2005 2019 100
New Caledonia: Goro ...................................................................................... Open pit – 2036 74.0
Brazil: Vermelho............................................................................... Open pit – 2050 100
Changes in cobalt ore reserves: 2007 versus 2006
The decrease in our cobalt reserve estimates from 2006 to 2007 was due to lower estimated ore tonnages at Sudbury and Voisey’s Bay, to the change in tonnage and grade at Vermelho, and for the reasons discussed in connection with nickel reserves above. Reserves at Goro in 2007 remain unchanged from the 2006 estimates.
PGMs and other precious metals reserves
We expect to recover significant quantities of precious metals as by-products of our Canadian operations and from the Salobo project. Our reserve estimates are of in-place material after adjustments for mining depletion and mining losses and recoveries, with no adjustments made for metal losses due to processing.
Precious metals reserves(1) Proven Probable Total
Tonnage Grade Tonnage Grade Tonnage Grade Canada:
Sudbury Platinum.................................................... 80.6 0.60 79.7 0.90 160.3 0.80 Palladium .................................................. 80.6 0.70 79.7 1.10 160.3 0.90 Gold........................................................... 80.6 0.30 79.7 0.40 160.3 0.30
Brazil: Sossego Gold........................................................... 134.4 0.30 47.4 0.20 181.8 0.26 Salobo Gold........................................................... 508.2 0.50 420.3 0.40 928.5 0.46 Total – Gold .............................................. 723.2 0.47 547.7 0.44 1,270.6 0.46
(1) Tonnage is stated in millions of dry metric tons. Grade is grams per dry metric ton.
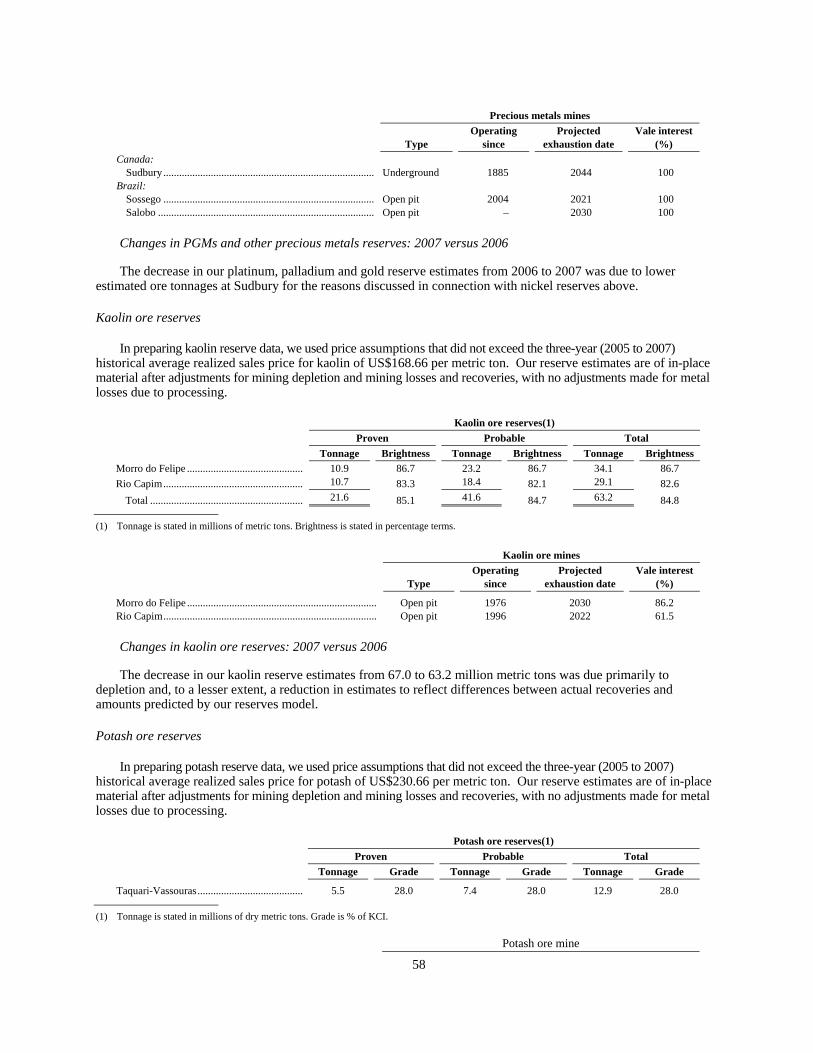
58
Precious metals mines
Type Operating
since Projected
exhaustion date Vale interest
(%) Canada:
Sudbury ................................................................................ Underground 1885 2044 100 Brazil:
Sossego ................................................................................ Open pit 2004 2021 100 Salobo .................................................................................. Open pit – 2030 100
Changes in PGMs and other precious metals reserves: 2007 versus 2006
The decrease in our platinum, palladium and gold reserve estimates from 2006 to 2007 was due to lower estimated ore tonnages at Sudbury for the reasons discussed in connection with nickel reserves above.
Kaolin ore reserves
In preparing kaolin reserve data, we used price assumptions that did not exceed the three-year (2005 to 2007) historical average realized sales price for kaolin of US$168.66 per metric ton. Our reserve estimates are of in-place material after adjustments for mining depletion and mining losses and recoveries, with no adjustments made for metal losses due to processing.
Kaolin ore reserves(1) Proven Probable Total
Tonnage Brightness Tonnage Brightness Tonnage Brightness Morro do Felipe ............................................ 10.9 86.7 23.2 86.7 34.1 86.7 Rio Capim..................................................... 10.7 83.3 18.4 82.1 29.1 82.6
Total .......................................................... 21.6 85.1 41.6 84.7 63.2 84.8
(1) Tonnage is stated in millions of metric tons. Brightness is stated in percentage terms.
Kaolin ore mines
Type Operating
since Projected
exhaustion date Vale interest
(%)
Morro do Felipe ........................................................................ Open pit 1976 2030 86.2 Rio Capim................................................................................. Open pit 1996 2022 61.5
Changes in kaolin ore reserves: 2007 versus 2006
The decrease in our kaolin reserve estimates from 67.0 to 63.2 million metric tons was due primarily to depletion and, to a lesser extent, a reduction in estimates to reflect differences between actual recoveries and amounts predicted by our reserves model.
Potash ore reserves
In preparing potash reserve data, we used price assumptions that did not exceed the three-year (2005 to 2007) historical average realized sales price for potash of US$230.66 per metric ton. Our reserve estimates are of in-place material after adjustments for mining depletion and mining losses and recoveries, with no adjustments made for metal losses due to processing.
Potash ore reserves(1) Proven Probable Total
Tonnage Grade Tonnage Grade Tonnage Grade
Taquari-Vassouras........................................ 5.5 28.0 7.4 28.0 12.9 28.0
(1) Tonnage is stated in millions of dry metric tons. Grade is % of KCI.
Potash ore mine

59
Type Operating
since Projected
exhaustion date Vale interest
(%)
Taquari-Vassouras(1) ............................................................... Underground 1986 2012 100
(1) We have a 25-year lease contract, which was signed in 1991, with Petrobras.
Changes in potash ore reserves: 2007 versus 2006
Our potash reserves decreased from 16.6 to 12.9 million metric tons, primarily reflecting mining depletion in 2007.
Coal reserves
In preparing coal reserve data, we used price assumptions that did not exceed the following (2005 to 2007) historical average realized sales and benchmarking prices for coal:
• Hard metallurgical coal: US$104.87 per metric ton;
• Pulverized coal injection (“PCI”): US$65.66 per metric ton; and
• Thermal coal: US$53.11 per metric ton.
Our coal reserve estimates are of in-place material after adjustments for mining depletion, in-situ moisture content, anticipated mining losses and dilution, but excluding any adjustment for losses associated with beneficiation of raw coal mined to meet saleable product requirements. Our coal reserve estimates were prepared by the following independent consultants: IMC Mining Solutions Pty Ltd (Hebden Seam), ASEAMCO Pty Ltd (North Opencut), SRK Consulting and Tasman Mining Pty Limited (Carborough Downs), MB Mining Consultants and Hoskings Resource Management (Issac Plains), and Snowden Mining Industry Consultants Pty Ltd (Moatize).
Coal ore reserves(1) Proven Probable Total
Coal type Tonnage Tonnage Calorific
value Integra Coal
South Opencut............................................................ Metallurgical Thermal
– – – 30.4 28.5
Middle Liddell Seam ................................................. Metallurgical – – – – Hebden Seam ............................................................. Metallurgical – 36.9 36.9 31.5 North Opencut............................................................ Metallurgical
Thermal – 8.7 8.7 30.4
28.5 Total Integra Coal ...................................................... – 45.6 45.6
Carborough Downs........................................................ Metallurgical PCI
42.0 5.0 47.0 – 31.7
Isaac Plains .................................................................... Metallurgical – PCI 18.4 0.6 19.0 31.0 Thermal 27.8 Broadlea......................................................................... Metallurgical – – – – Moatize .......................................................................... Metallurgical
Thermal 422 416 838 32
– Total ............................................................................. 482.4 512.8 995.2
(1) Tonnage is stated in millions of dry metric tons. Calorific value is stated in Mj/kg and refers to the quality of marketable coal, quoted on a “gross air dried” basis. Marketable coal quality reported is based on 2007 sales contract specifications, except for Moatize.

60
Coal mines
Type Operating
since Projected
exhaustion date Vale interest
(%) Integra Coal ..............................................................................
South Opencut....................................................................... Open pit 1999 2009 61.2 Middle Liddell Seam ............................................................ Underground 1999 2014 61.2 Hebden Seam ........................................................................ Underground – 2023 61.2 North Opencut....................................................................... Open pit 2008 2014 61.2
Carborough Downs................................................................... Underground 2006 2020 80.0 Isaac Plains ............................................................................... Open pit 2006 2016 50.0 Broadlea.................................................................................... Open pit 2006 2011 100 Moatize ..................................................................................... Open pit – 2046 100
Changes in coal reserves: 2007 versus 2006
The year 2007 is the first year for which we have reported coal reserves. We acquired our coal operating assets in 2007 through the acquisition of AMCI Holdings Australia Pty (renamed Vale Australia).
61
REGULATORY MATTERS
In this section, we describe the following:
• mining regulation in Australia, Brazil, Canada, Indonesia and New Caledonia;
• railroad regulation in Brazil;
• electric energy regulation in Australia, Brazil, Canada, Indonesia, and New Caledonia;
• environmental regulation in Australia, Brazil, Canada, Indonesia, New Caledonia, the United States, the European Union and others; and
• Investment Canada Act undertakings.
Mining regulation
Australia – mining regulation
In Australia, the ownership of minerals has been separated from ownership of the surface of land. The governments of each state and territory have passed legislation appropriating the ownership of all minerals to themselves on behalf of the public. Public ownership of minerals underpins the regulation of the mineral resources industry by legislation at the state level.
The key features of the regulatory arrangements in each state and territory are the following:
• The government owns all minerals (with some minor exceptions), separating rights to minerals from other interests in land;
• Exploration and mining activities must be carried out pursuant to a “tenement” from the state;
• Tenements and other licenses are available under mining legislation for purposes incidental to mining including access, storage and some processing activities such as washing and crushing; and
• A tenement will only be granted when certain preconditions have been met. Conditions may include:
• posting a security bond to ensure that the site is rehabilitated at the completion of mining operations. Rehabilitation is generally controlled by conditions contained in the tenement and associated environmental authority;
• payment of any outstanding rent or royalties;
• granting of an environmental authority over the tenement; and
• compliance with the requirements of the relevant state mining legislation.
After the grant is made, the tenement will be subject to further conditions for its duration. The state or territory minister may consent to an assignment subject to satisfaction of transfer conditions.
Subject to compliance with native title requirements, once a tenement is granted by the state or territory, the tenement holder will then have an enforceable right to enter upon the land and undertake all works authorized under that grant and by the empowering legislation. This is a right enforceable against all others, including the land title holders or their tenants.
62
The holder of an exploration or mining tenement must comply with the conditions attached to the grant of the tenement and the regulatory scheme established under the legislation. This may involve significant expenditure, which adds to mining and operating costs. Where a tenement holder fails to comply with the regulatory scheme, it may be liable for financial penalties, prosecution or forfeiture of its tenement.
Although the conditions included in tenements and the regulations governing them may be subject to change or amendment by the state or territory in certain circumstances, it is rare for this to occur unilaterally and without prior notice or negotiation.
All Australian states and territories require that statutory royalties be paid for minerals taken from the land. The amount of royalty, the method of calculation and the minerals covered differ from jurisdiction to jurisdiction. While there are some flat-rate royalties, others involve complicated calculations taking into account the market value of the mineral and an index price set by the jurisdiction.
We own a combination of 430 exploration or mining tenements in Australia.
Mining rights in Australia may also be subject to native title. “Native title” describes the rights and interests of Aboriginal and Torres Strait Islander people in land and waters according to their traditional laws and customs as recognized by the laws of Australia. Native title does not equate to our common understanding of “title” to land in the sense of ownership of land and may consist of different rights and interests. Examples include the right to access land, hunt, gather and fish, conduct ceremonies, camp; and have possession, use, occupation and enjoyment of the land.
Brazil – mining regulation
Under the Brazilian Constitution, all mineral resources in Brazil belong to the Brazilian government. The Brazilian Constitution requires that mining companies incorporate in accordance with Brazilian law. The Brazilian Constitution and Mining Code impose on mining companies various regulatory restrictions relating to, among other things:
• the manner in which mineral deposits are exploited;
• the health and safety of workers and the safety of residential areas located near mining operations;
• the protection and restoration of the environment;
• the prevention of pollution; and
• the support of local communities where mines are located.
Mining companies in Brazil can only prospect and mine for mineral resources pursuant to prospecting authorizations or mining concessions granted by the National Mineral Production Department ( Departamento Nacional de Produção Mineral ), or DNPM, an agency of the Ministry of Mines and Energy of the Brazilian government. DNPM grants prospecting authorizations to a requesting party for an initial period of three years. These authorizations are renewable at DNPM’s discretion for another period of one to three years, provided that the requesting party is able to show that the renewal is necessary for proper conclusion of prospecting activities. On-site prospecting activities must start within 60 days of official publication of the issuance of a prospecting authorization. Upon completion of prospecting activities and geological exploration at the site, the grantee must submit a final report to DNPM. If the geological exploration reveals the existence of a mineral deposit that is economically exploitable, the grantee has one year (which DNPM may extend) from approval of the report by DNPM to apply for a mining concession or to transfer its right to apply for a mining concession to an unrelated party. When a mining concession is granted, the holder of the concession must begin on-site mining activities within six months. DNPM grants mining concessions for an indeterminate period of time lasting until the exhaustion of the mineral deposit. Extracted minerals that are specified in the concession belong to the holder of the concession. With the prior approval of DNPM, the holder of a mining concession can transfer it to an unrelated party that is qualified to own concessions. In some cases, mining concessions are challenged by unrelated parties. We own a combination of 4,342 prospecting authorizations or mining concessions covering approximately 16 million hectares.

63
The Brazilian government charges us a royalty known as the CFEM ( Compensação Financeira pela Exploração de Recursos Minerais ) on the revenues from the sale of minerals we extract, net of taxes, insurance costs and costs of transportation. The current annual rates we pay on our products are listed below.
• iron ore, kaolin, copper, nickel, fertilizers and other minerals: 2%;
• bauxite, potash and manganese ore: 3%; and
• gold: 1%.
The Mining Code and ancillary mining laws and regulations also impose other financial obligations. For example, mining companies must compensate landowners for the damages and loss of income caused by the use and occupation of the land (either for exploitation or exploration) and must also share with the landowners the results of the exploration based on 50% of the CFEM. Mining companies must also compensate the government for damages caused to public lands. A substantial majority of our mines and mining concessions are on lands owned by us or on public lands for which we hold mining concessions.
We are currently engaged in a series of administrative and other legal proceedings alleging that we have failed to pay the proper amount of CFEM. In addition, we are discussing with DNPM the applicable rate for potash. See Item 8. Financial information—Legal proceedings—CFEM-related proceedings.
Canada – mining regulation
At our Sudbury operations, we hold mining rights, surface rights, licenses of occupation and mining claims granted to us by the Province of Ontario. Mining rights are rights to exploit and extract minerals on, in or under the land, and surface rights are rights to use the surface of the land. Mining rights and surface rights may be either owned or leased. Mining rights and surface rights that are owned remain in effect so long as we own the land to which the rights apply.
Mining rights and surface rights that are leased remain in effect for the term of the lease, either 10 or 21 years. Licenses of occupation allow the holder to use licensed land in the manner specified in each license, including the right to dig, excavate and remove ores and minerals from and under the land. Mining claims are rights to explore the land covered by the claim.
We own a combination of mining and surface rights covering 86,159 hectares. We lease a combination of mining and surface rights covering 14,166 hectares of land leased from the Province of Ontario. We do not expect any problems in obtaining renewals of these leases since the only requirement for renewal is payment of a nominal renewal fee. The next lease due for renewal expires in 2010.
We currently hold mining licenses of occupation covering 2,934 hectares in Ontario. We also hold mineral claims covering 1,610 hectares in Ontario and hold a co-owned interest in mineral claims covering an additional 7,010 hectares.
At our Sudbury operations, all properties that contain proven and probable ore reserves are on lands owned by us, with the exception of a portion of ore reserves under Kelly Lake, which is under a 21-year mining lease from the Province of Ontario and which can be accessed from the Copper Cliff South Mine.
The permission of the government of the Province of Ontario is required for us to export from Canada intermediate products derived from our Sudbury ores. In December 2005, the Ontario government granted us permission to continue to export intermediate nickel products to our nickel refinery in Clydach, Wales until December 31, 2015. In December 2005, the Ontario government granted us permission to continue to export semi-refined PGMs concentrate to our precious metals refinery in Acton, England until December 31, 2015. In June 2007, the Ontario government also granted us permission to ship copper anodes, copper concentrate and MK copper concentrate offshore for further processing until June 27, 2012. We are not aware of any reason at this time that would prevent us from reaching an agreement with the Province of Ontario to extend these permits for additional periods upon their expiration.
64
At our Thompson operations, our landholdings or mining rights consist of order-in-council leases (“OIC Leases”), mineral leases and mining claims. OIC Leases were negotiated as part of an agreement entered into in 1956 between Vale Inco and the Province of Manitoba covering the development of the Thompson nickel deposits. We currently hold a total of 2,947 OIC Leases, 29 of which are held by Mystery Lake Nickel Mines Limited, which is owned 82.6% by Vale Inco and 17.4% by Newmont Exploration of Canada and the remainder of which are held by Vale Inco. OIC Leases entitle the lessee to explore for, and mine, all minerals in the subsurface (except hydrocarbons, industrial minerals and superficial deposits that are not incidental to the mining, milling, smelting and refining processes). OIC Leases provide for an initial 21-year term and two subsequent guaranteed renewals of 21 years each, for a total guaranteed lease period of 63 years. Subsequent lease renewals beyond the three guaranteed 21-year terms, can be granted at the discretion of the Province of Manitoba. All of our current OIC Leases have now been renewed twice (each is in its third guaranteed 21-year term) and remain in effect through the 2022-2024 period.
Mineral leases are issued by the Province of Manitoba and convey (i) the exclusive right to the minerals (other than quarry minerals) that occur on or under the land covered by the lease and (ii) access rights to erect buildings and structures (including shafts) to mine within the limits of the lease. The duration of mineral leases is 21 years, and they are renewable at the discretion of the province’s Minister of Science, Technology, Energy and Mines. We hold six mineral leases that cover 4,151.21 hectares in the Thompson nickel belt. These mineral leases remain in effect until April 1, 2013.
We also hold 37 mining claims, a right issued by the Province of Manitoba under provincial legislation, which conveys to the holder exclusive rights to the minerals (other than quarry minerals) that occur on or under the land covered by the claim and access rights to explore for and develop minerals owned by the Province. A mining claim does not, however, entitle the holder to extract minerals from the land covered by the claim. In order to extract minerals from the land covered by a mining claim, the holder must obtain a mineral lease from the Province of Manitoba.
With respect to our Voisey’s Bay operations, we hold a mining lease, surface lease, mining licenses and mineral claims. All of the current estimated proven and probable ore reserves at Voisey’s Bay are located on lands covered by the mining lease, which has a duration of 25 years. The mining lease confers the exclusive right to extract minerals and carry out mineral exploration, mining operations or mining processing and development in, on or under the lands, or part of the lands, covered by the lease so long as we continue to meet the terms and conditions of an agreement entered into in September 2002 between Vale Inco and the Government of Newfoundland and Labrador.
Under the terms of the mining lease, production cannot exceed on average 2.2 million metric tons of ore annually for the first 10 years of mining operations and on average 5.5 million metric tons of ore annually thereafter. The mining lease is subject to an order issued by the provincial government requiring us to complete primary production (smelting, processing or refining) in the Province of Newfoundland and Labrador of all minerals extracted under the lease. However, the government has also issued an order allowing us to export nickel concentrates containing up to 355,000 metric tons of contained nickel until we have completed the construction of a nickel processing facility in the Province. This mining lease can be renewed for further 10-year terms so long as we have been in compliance with the terms of the lease and have applied for such renewal at least three months prior to the expiration of the then current lease.
In conjunction with the mining lease for Voisey’s Bay, we hold a surface lease entitling us to use certain lands necessary for our mining operations. Like the mining lease, the surface lease came into effect on September 30, 2002 for a period of 25 years, and may be renewed for further 10-year terms. We also hold 1,978 mineral claims, which have been grouped into mineral licenses. The mineral licenses expire in 2009 and can be renewed for a further 5-year period. A mineral license is required to explore a parcel of land.
Pursuant to the terms of an option agreement between Vale Inco and International Royalty Corporation, a royalty is payable to International Royalty Corporation on a quarterly basis on the proceeds received by Vale Inco on the sale of its production, equal to 3% of net smelter returns from mining production from Vale Inco’s properties on the mainland portion of Newfoundland and Labrador, including the Voisey’s Bay mine, and a 3% gross royalty (also payable quarterly) is assessed on the gross value of any raw diamonds or gemstones recovered from these properties. To date, there have been no raw diamonds or gemstones recovered from these properties.
65
Indonesia – mining regulation
PT Inco’s operations in Indonesia are conducted pursuant to a Contract of Work with the Indonesian government, which expires in 2025. The Contract of Work gives PT Inco the exclusive right to mine nickel and nickel-containing minerals in certain areas on the Island of Sulawesi and to process and export the nickel and associated minerals recovered from those areas. In exchange, PT Inco pays a royalty fee on, among other items, its nickel production on the concession area and has made certain other commitments. Currently, we are not aware of any information indicating that we would not be able to reach an agreement extending or renewing our mining rights before the Contract of Work’s expiry date. Inability to extend or renew the Contract of Work or secure a right-to-mine past 2025 could reduce PT Inco’s estimated ore reserves and mineral resources and adversely affect PT Inco’s long-term mining plans.
Under the Contract of Work, PT Inco undertook to construct, subject to economic and technical feasibility, two additional production plants in Sulawesi, one in Pomalaa and another in Bahodopi. In satisfaction of PT Inco’s undertaking with respect to the Pomalaa area, PT Inco entered into a Cooperative Resources Agreement with PT Antam Tbk. (“PT Antam”), under which PT Inco delivers to that company about one million wet metric tons of ore annually. If PT Antam terminated this agreement, PT Inco might be required to find an alternative solution to ensure compliance. However, PT Inco expects that this agreement will remain in force.
With respect to the plant at Bahodopi, in early 2008, PT Inco presented a proposal to Indonesia’s Department of Energy and Mineral Resources (“DEMR”) to construct a new processing plant at Sorowako in lieu of PT Inco’s undertaking in the Contract of Work to construct a processing plant at Bahodopi. An independent study conducted in 2007 concluded that it is not economically feasible under current circumstances to build a processing plant at Bahodopi. The Sorowako plant would have production capacity of approximately 22,000 metric tons of nickel product. Ore from Bahodopi and Sorowako would be combined to feed Sorowako’s existing processing facility. PT Inco would continue its exploration program at Bahodopi and continue to study options for developing a processing facility there. Acceptance of the proposal is subject to feasibility studies, the consent of the DEMR, agreements with the Indonesian and local governments and securing necessary permits. The proposal would require a significant capital investment and any decision to proceed will require the approval of the board of directors and board of commissioners of PT Inco. If, for any reason, PT Inco were unable to comply with its undertakings, we could be subject to administrative sanctions.
In 2004, the Indonesian Government issued certain forestry regulations. Pursuant to these regulations, the Indonesian Minister of Forestry requested that PT Inco apply for permits to use forestry land located within the Contract of Work area. Although we had previously taken the position that the terms of the Contract of Work provided us with all authorizations needed to conduct mining activities within this area, we recently decided to apply for permits to use certain forestry land located within the Contract of Work area on the understanding that our rights under our Contract of Work would be respected.
New Caledonia – mining regulation
Concessions in New Caledonia generally represent long-term permits (usually 75-year terms, with some having longer or perpetual terms) granted for mining large deposits which entitle the holder to the exclusive right to exploit, extract and mine. A concession applies to one or several minerals defined by the granting decision along with its geographical location. The granting of a concession is based on the delineation of an exploitable ore body made during exploration activities conducted pursuant to exploration permits. Surface rights, which are rights to use surfaces on or outside mining permits for mining-related activities, can be granted independently of mineral rights.
Our 74%-owned subsidiary, Goro Nickel, currently holds 67 mining concessions in the Massif du Sud in New Caledonia, covering 20,277 hectares and authorizing the mining of nickel, cobalt, chrome, iron ore and manganese. Our Goro project covers 6,571 hectares within eight of these mining concessions, of which four are perpetual in term, two are renewable prior to their expiry in 2016 and one is renewable prior to its expiry date in 2051. Goro Nickel holds 41 surface rights, including surfaces of other owners and an additional free land of the domain. A subsidiary of Vale Inco, Tiébaghi Nickel, holds an additional eight mining concessions outside the Goro project area, in a mining domain called Tiebaghi.

66
In order to mine the concessions it holds (once the construction of the facilities are complete), Goro Nickel must declare its intention to the authorities and describe its technical plan. Goro Nickel has submitted an application for a new operating permit based on the project’s revised configuration. The fact that Goro Nickel does not currently have an operating permit does not currently impact development because the operating permit does not cover construction. We anticipate that the permit will be granted in the first half of 2008.
The enactment of a new mining law may occur as part of the Noumea Accord between New Caledonia and France. New Caledonia is an overseas territorial community ( collectivité territoriale ) of France with significant autonomy except in the areas of foreign relations, defense, judicial, currency and certain other related areas. The Noumea Accord sets forth a process and timetable for increasing the autonomy of New Caledonia over the coming years, with a referendum to be held by 2014 on whether New Caledonia should become fully independent from France. Although we do not believe that these developments will have an adverse effect on the Goro project, there can be no assurances in this regard.
Railroad regulation
Brazil – railroad regulation
The Brazilian Ministry of Transportation and the transportation regulatory agency ( Agência Nacional de Transportes Terrestres ), or ANTT, regulate and supervise the policies of the railroad transportation sector. The federal government may grant private companies concessions for the construction, operation or commercial development of railroads.
Railroad concession contracts granted by the federal government impose certain shareholder ownership limitations. The concession contract for FCA limits shareholder ownership to 20% of the voting capital of the concessionaire, unless such limit is waived by ANTT. We own 99.9% of FCA, which ANTT has authorized. The 20% ownership limitation does not apply to our EFVM and EFC railroads. ANTT also sets different tariff limits for railroad services for each of the concessionaires and each of the different products transported. So long as these limits are respected, the actual prices charged can be negotiated directly with the users of such services.
The MRS concession contract provides that each shareholder can only own up to 20% of the voting capital of the concessionaire, unless otherwise permitted by ANTT. As a result of our acquisitions of CAEMI and Ferteco in 2003, our share in the voting capital of MRS surpassed this threshold. As a result, Vale waived its voting and veto rights with respect to MRS shares in accordance with a 2006 ANTT resolution. We continue to have some voting rights through the shareholdings of a subsidiary.
Our railroad concession contracts have a duration of 30 years and are renewable. The FCA and MRS concessions expire in 2026, and the concessions for EFC and EFVM expire in 2027.
In October 2007, we won the auction for the subconcession for commercial operation for 30 years of a 720-kilometer segment of the FNS railroad, in Brazil.
Electric energy regulation
Australia – electric energy regulation
Australian electricity supply has historically been regulated on an individual state and territory basis, but the electricity market is in a process of moving toward federal-based regulation. The National Electricity Market (“NEM”) (a wholesale electricity pool market) commenced in 1998. The NEM jurisdictions are Queensland, New South Wales, the Australian Capital Territory, Victoria, South Australia and Tasmania. Each of these states and territories are connected electrically, although the interconnectors between states in some cases remain limited. West Australia and the Northern Territory are not connected to the NEM jurisdictions electrically (generally due to the vast distance between the east and west coasts of Australia). West Australia has recently developed its own wholesale electricity market, which is similar to the NEM but with some key differences.
67
Monopoly transmission and distribution assets are subject to regulated pricing (generally revenue cap regulation). Each of these assets were previously regulated by state and territory regulators but have gradually been moved to the jurisdiction of the national regulatory agency, the Australian Energy Regulator.
All electricity customers are able to choose their electricity retailer. States and territories regulate aspects of electricity supply to consumers, but they are presently engaged in a process intended to make energy regulation across states and territories more uniform.
The new Federal Labor Government has recently announced the introduction of a National Emissions Trading Scheme (ETS). Although the details of the ETS have not yet been formalized, the ETS will be a “cap and trade” scheme and is expected to be introduced between 2010 and 2012. From 2008, large users of energy are required to report their consumption and greenhouse gas emissions.
Brazil – electric energy regulation
The power industry in Brazil is regulated by the Ministry of Mines and Energy and the regulatory agency ANEEL. The role of ANEEL is to implement and enforce policies and regulations designated by the Ministry of Mines and Energy and aimed at organizing and regulating the electricity sector and power companies. ANEEL is responsible for ensuring an efficient and economical energy market through regulation, enforcement, as well as monitoring prices and the operational efficiency of power companies.
Under the law governing the electricity sector, concessions grant exclusive rights to generate and transmit or to distribute electricity in a particular area for a period of time that should be sufficient for the concessionaire to recover its investment. The concessions for power generation before December 11, 2003 were granted for up to 35 years and are renewable at the Federal Government’s discretion for an additional period of up to 20 years. Concessions granted after December 11, 2003 are granted for up to 35 years, without the possibility of renewal. Concessionaires (distributors) are required to supply electricity for public services, on a continuing basis, in sufficient quantity and within approved standards of quality.
All of our concessions for power generation in Brazil were granted before December 11, 2003. The next concession to expire has an expiration date in 2028.
Given the hydrologic and integrated nature of the Brazilian electricity generation matrix, Decree No. 2655/1998 created the Mecanismo de Realocação de Energia (Energy Reallocation Mechanism), known as MRE, a mechanism for sharing hydrological risk, and consequently reducing generation volatility among all generators. In order to implement the MRE, ANEEL designates a level of energy production, known as Assured Energy, for each generator that may be reviewed every five years. Assured Energy is calculated in accordance with a statistical model based on average rainfalls in the relevant region, water flows of rivers and water levels in each plant’s reservoir over a multi-year time frame.
Each generator is allowed to enter into contracts to sell up to 100% of its Assured Energy. To the extent a generator has signed contracts for the sale of its Assured Energy, and as long as MRE members, as a whole, are able to meet MRE Assured Energy levels, it receives payments based on these contractual terms, regardless of its level of actual generation. If all MRE members meet their contracted energy and there is a surplus of energy remaining, the net regional surplus generation is allocated among generators in different regions and this energy surplus may be sold in the wholesale market.
All contracts for wholesale energy purchases and sales are currently recorded in the wholesale market, the Câmara de Comercialização de Energia Elétrica, or the CCEE. The CCEE is a nonprofit private entity subject to the authorization, regulation and supervision of ANEEL, and is responsible for operating the wholesale energy market and for ensuring that energy transactions in the short-term market are settled and cleared in an efficient manner. The CCEE is primarily designed to effect the settlement of differences between the amount of energy contracted under bilateral contracts of the several market agents (generators, distributors, traders and large consumers), and the amount of energy actually consumed and produced. The settlement is done in accordance with the CCEE spot prices, which are expressed in R$/MWh and are calculated for each settlement period for each sub-market.

68
Under Law No. 10,848/2004 and the regulations promulgated pursuant to it, jurisdiction of certain regulatory areas is under the Ministry of Mines and Energy rather than ANEEL. Under this law, all consumers of electricity, including large consumers, such as Vale, must contract the totality of their energy needs through contracts. This law creates two parallel markets for energy: a regulated market, in which distributors enter into supply contracts with regulated customers, subject to regulated prices, and an unregulated market, in which consumidores livres, or “free consumers,” enter into contracts with independent power producers at prevailing market prices. Regulated consumers may migrate to the unregulated market, but only after the termination of their long-term contracts. Self-generators of energy, such as Vale, are required to provide a pre-determined percentage of their generated energy from concessions acquired after 2004 to the regulated market for distributors’ acquisition.
Changes in the regulatory environment could adversely impact our energy investments. Valesul is currently engaged in litigation regarding the rates that Light charges Valesul for the transmission of electricity. See Item 8. Financial information—Legal proceedings.
Canada – electric energy regulation
Our wholly-owned and operated hydroelectric power plants in Canada are located in Sudbury, Ontario.
The power industry in Ontario is regulated by the Ontario Energy Board (the “OEB”). The OEB is responsible for setting just and reasonable rates, as well as the licensing of all participants in the electricity sector in Ontario.
Under the legislative framework in Ontario, we are considered to be a generator, transmitter, distributor and retailer of electricity in Ontario. Pursuant to the Definitions and Exemptions Regulations under the Electricity Act (Ontario) and the Ontario Energy Board Act, we are exempt from many of the regulatory requirements related to the electricity industry in Ontario as they pertain to our hydroelectric power plants, including rate regulation, licensing requirements, regulatory codes of conduct and financial record-keeping. In order to maintain our exemption under these rules, we must, among other things, ensure that any price that is charged for transmitting or distributing electricity is no greater than the reasonable costs associated with transmission or distribution.
Indonesia – electric energy regulation
PT Inco’s existing hydroelectric power plants were constructed and are operated pursuant to a 1975 decree of the Indonesian government. These facilities generate the majority of PT Inco’s electricity requirements. The 1975 decree gives the government the right to acquire PT Inco’s hydroelectric power plants upon two years’ notice to PT Inco. No such notice has been given by the government. If this right were to be exercised, the decree provides that the hydroelectric power plants would be acquired by the government at their depreciated value, subject to the government providing PT Inco with sufficient electricity to meet its operating requirements, at a rate based on cost plus a normal profit margin, for the remaining term of PT Inco’s Contract of Work. The new hydroelectric dam that is to be constructed as part of PT Inco’s latest expansion program is also expected to be subject to this decree.
New Caledonia – electric energy regulation
Goro entered into an electricity supply agreement with the local public provider of electricity (Enercal) in 2004. The provision of electricity under this agreement was due to begin in January 2008, but has since been delayed. This agreement governs the provision of at least 50 MW of power to the Goro project. The term of the agreement is 25 years, with options to renew for five additional five-year terms.
Environmental regulation
Environmental legislation is becoming stricter worldwide, which could lead to greater costs for environmental compliance, for instance if we are required to modify installations, develop new procedures or purchase new equipment.
Australia – environmental regulation
Environmental regulation in Australia occurs through legislation at the federal, state and territory levels and, to a limited extent, the common law. For constitutional reasons, most environmental regulation occurs at the state
69
level and affects operations conducted within that state. Environmental laws impact our Australian operations, principally by regulating:
• the emission or discharge of pollutants from our facilities;
• the remediation and/or cleanup of any contamination;
• the storage of hazardous substances;
• the management, storage and disposal of waste and hazardous substances; and
• the emission of noise and odor.
There is a range of offenses for breaches of these environmental laws. Penalties range from substantial fines and jail terms to warning notices. Other consequences include payment of compensation, suspension or revocation of a license, or an order to control, prevent or lessen the environmental harm caused by an offense. Directors and managers can, in some instances, be personally liable for the offenses.
Brazil – environmental regulation
Federal, state and municipal legislation contain provisions for the control and protection of the environment in Brazil. These laws govern the use of natural resources, the reclamation and restoration of mined areas, the control of atmospheric emissions, the treatment of industrial effluents, as well as the use, handling and final disposal of hazardous materials and the control of water resources.
In order to conduct our mining, energy generation and industrial activities, we must prepare environmental impact assessments and submit them to authorities that oversee the granting of environmental permits. We seek to comply with all legal requirements and to achieve good relationships with interested parties, especially communities located near our operations. Our environmental management system is designed to provide a systematic approach to environmental issues.
Under Brazilian Federal Law No. 9,605/1998, non-compliance with environmental laws and regulations can result in criminal penalties, such as imprisonment and other restrictions for individuals (including directors, officers and managers of companies), and fines and the mandatory rendering of public services by companies. Administrative penalties range from warnings and fines to the suspension of corporate activities, and may also include the loss or reduction of incentives, or the cancellation or interruption of credit facilities granted by governmental institutions.
Issuance of environmental licenses. We must obtain environmental licenses in order to build, develop, expand and operate facilities that use natural resources or may pollute the environment. License validities can vary from one to ten years, and have to be renewed for the life of the undertaking. We seek to obtain the legally required licenses for each of our facilities and activities.
In some cases, this process requires a significant amount of time for the preparation of comprehensive environmental reports and their evaluation, as well as for the establishment of appropriate programs for environmental education of communities residing in areas affected by the proposed projects. We enter into agreements with the appropriate federal and state governmental environmental authorities with respect to facilities whenever environmental non-compliance is detected in order to make these facilities compliant.
Environmental compensation. A federal environmental law (No. 9,985/2000) requires payment of “environmental compensation” to state and federal authorities, in order to create and maintain conservation areas, in the amount of at least 0.5% of the total investment of any venture with a material environmental impact. This law authorizes state governments to promulgate regulations setting forth a state-specific rate. There are a number of uncertainties regarding the application of this law, including the rate that will be applied by the state governments and the basis for valuing investments. The Confederação Nacional das Indústrias, of which we are a member, has instituted a constitutional challenge to the federal law, and the Supreme Court of Brazil has meanwhile ruled that such compensation is constitutional, but not the investment percentage rate. The compensation from now on is to be

70
calculated based on the degree of environmental impact and the state governments have been ordered to conform their legislation by removing any percentage and establishing new criteria.
Forest legal protection. Economic development in rural areas is regulated under the Brazilian Forest Code, and there are a number of uncertainties regarding its scope and application. In order to develop projects in areas such as the Amazon basin, we must maintain a certain amount of land undeveloped for environmental conservation. We have a number of projects in areas that are subject to the Forest Code. We currently have enough land to allocate to conservation but, as our operations expand, we may have to acquire additional land to maintain the necessary percentage of undeveloped land. We expect to be able to acquire any additional land needed to comply with the law. We have operations in the Mata Atlântica forest, which is protected under the Brazilian constitution and specific laws aimed at ensuring its sustainable development. Certain laws require us to set aside land in the Mata Atlântica for preservation that is equivalent in area and ecological characteristics to any land that we use for mining activities in the forest. Also, mining activities in certain areas are restricted depending on the stage of vegetation growth.
Prevention and environmental control measures. Our environmental policies also aim to prevent, control and reduce the environmental impact caused by our business operations. We have invested US$187 million in environment-related projects in 2007.
Water use. We are intensive water users in various states with hydrological resources that vary from very high water availability in the Amazon region to scarcity in the northeast of Brazil. The Hydrological Resources Management System implemented throughout Vale includes evaluation of the availability of water in the areas where we operate and programs to rationalize and control water use. We continually monitor new water legislation and regulations and take particular interest in requirements adopted under the National Policy of Hydrological Resources, which defines the conditions for obtaining water use grants and the fees applicable to that use and for effluents disposal.
Environmental control systems. As a mining company, air emissions control is one of our main objectives. Control equipment and systems, such as stockpiles and road water aspersion and use of chemical dust suppressants or installation of filters and electrostatic precipitators at our facilities are complemented by comprehensive monitoring systems and control software. Besides achievement of legal compliance, air quality in the installations and its effects in the neighboring communities are continuously evaluated and we make necessary investments for air quality improvement.
With respect to improvements in water quality, we strive to treat and control the pollutants disposed into the sea and local rivers or other water sources and also use extensive water recycling in our operations. We are researching new processes and technologies for the improvement of water use and recycling and treatment. Through our comprehensive waste management system, we aim to achieve greater control of the generation and disposal of our waste, to develop opportunities to reuse, recycle and to reduce waste.
Our mine decommissioning manual describes a complete set of directives, including technical practices and procedures to be followed during mine closures. The manual outlines procedures for the rehabilitation and monitoring of degraded areas, the main steps and sequence to be followed during closure, and any liabilities that may result after mine closure.
The manual also provides standardized basic criteria and procedures, based on the directives of the CVM and the SEC (FAS 143), for cost evaluation, the establishment of current budgets, future decommissioning and reclamation (see Note 3 to our consolidated financial statements).
The mines water and tailings storage dams and sterile deposits are classified according to a risk matrix involving all the parameters related to construction, operation and safety monitoring. A comprehensive audit program has been established, which evaluates the stability of all those structures and provides the inputs for the development of corrective or preventative action plans when necessary.
Our environmental program also includes reforestation projects, which are intended to protect the soil against erosion and to create buffers between our activities and communities in the surrounding areas. We partner with universities and governmental research entities to conduct extensive research to develop procedures for reforestation, soil protection using native species of the managed regions and for the improvement of the growth and growth rate of
71
seedlings. Comprehensive fauna and flora investigations are performed as an ongoing activity, mainly in the Carajás region, to comprehend and avoid the environmental risks involved in investing in potentially sensitive areas.
We also participate in the maintenance and preservation of Brazilian forests and lands located in federally-designated conservation areas, known as “Conservation Units.” Additionally, in the last 25 years we have also provided support to the indigenous communities in the areas of education, health, infrastructure development and technical assistance with the aim of enhancing life quality and self-sustainability of these communities.
Subterraneous development. A Brazilian environmental decree restricts the development of subterraneous areas, which are deemed to be part of Brazil’s cultural patrimony. The restriction contains a very broad definition of the term “cave,” which could encompass areas where we conduct our mining operations.
Canada – environmental regulation
Vale Inco’s operations in Canada are subject to numerous environmental laws and regulations relating to air emissions, water discharges, soils, recycling and waste management, decommissioning and reclamation, and employee health and safety, among other areas.
SO 2 and CEPA metals emissions reduction. Our Sudbury smelting operations are subject to legislation of the Ontario government requiring Vale Inco to significantly reduce its emissions of sulphur dioxide (SO 2). In 2007, SO 2 emissions from our Sudbury operations were 150,311 metric tons, meeting the required limits. In 2007, we were required to comply with a reduced emissions limit of 175,000 metric tons (previously 265,000 metric tons) and to reduce SO 2 ground level concentrations from the previous limit of 0.50 ppm to 0.34 ppm. From 2008 to 2014, emissions limits could be reduced below 175,000 metric tons depending on actual production rates over a three-year rolling period. In 2015, the limit will fall to 66,000 metric tons for SO 2.
Based on our “life of business” plan, our production in Sudbury can be maintained well beyond the 2015 timeline. Our Sudbury operations achieved the 2007 limits as a result of the installation in 2006 of fluid bed roaster off-gas scrubbing technology at our Sudbury smelter. We believe that this technology, together with our ability to bank and purchase emission allowances as permitted by the 2005 legislation, should allow us to meet the limits in effect until 2014 without seriously affecting production rates at our Sudbury operations or requiring significant additional capital expenditures. Compliance with the 2015 limit will require significant capital expenditures, estimates of which are included in our five-year capital plan. We are currently investigating various technologies in order to meet the 2015 limit.
Emissions from our Thompson smelting operations are also regulated under Manitoba legislation limiting SO 2 emissions to 23,000 metric tons per month and 220,000 metric tons per calendar year. In 2007, emissions from our Thompson operations were within these limits, at 192,325 metric tons for the year.
We also expect that the Canadian federal government will legislate emissions limits before 2015. In April 2006, the federal government, through the Environment Canada department, encouraged base metal smelters and refineries to voluntarily prepare “Pollution Prevention Plans,” addressing “limit targets” for SO 2, particulate and other toxic metals. Following discussions with Environment Canada, the target limits for 2015 for our Sudbury operations were set at 66,000 metric tons for SO 2, matching the Ontario government requirements, 864 metric tons for particulate and a 90% reduction of the CEPA toxic metals (nickel, lead, arsenic and cadmium) from the 1988 baseline. For Manitoba, the limit targets for 2015 are 22,800 metric tons for SO 2, 198 metric tons for particulate and a 90% reduction of the CEPA toxic metals from the 1988 baseline. These target levels are lower than the current emission limits and we will not be able to meet these targets without making significant capital expenditures, and compliance with these targets could adversely affect our production levels, financial results and cash flow particularly for our Thompson operations.
Sudbury and Port Colborne soils. Vale Inco has been working with regulatory authorities and other interested parties to evaluate elevated levels of nickel and other metals in soils in the vicinity of our processing facilities in Sudbury and Port Colborne, Ontario that may be related to the historical emission of windblown metal-containing particulates. Vale Inco voluntarily agreed to conduct detailed risk assessments in Port Colborne and soil remediation has been conducted there. Any efforts we are required to undertake to investigate or remediate these matters may involve significant expenditures. Given the existence of various legal appeals and scientific and

72
medical studies underway, it is not possible to predict the effect these studies and actions could have on our business, results of operation or financial condition.
Smelter emissions. In 2010, a regulation promulgated by the Ontario government (called “Air Pollution Regulation – Local Air Quality”) will take effect with respect to base metal smelters. This regulation incorporates existing air quality standards, but the Ontario Ministry of the Environment plans to revise many of these standards on an ongoing basis for priority contaminants, which include nickel, lead, cadmium, arsenic and others. A new standard for lead and cadmium was issued in 2006. Our five-year capital plan includes estimates for these changes. We are currently evaluating what process modifications may be requested for compliance. We expect the Ministry of the Environment to release its proposed new standard for nickel in 2008.
Canadian regulations for greenhouse gases and Air Pollutants. In April 2007, the Canadian Government announced the Regulatory Framework for Industrial Air Emissions, proposing intensity targets for greenhouse gases and regulated emission targets for certain air pollutants. Compliance to the greenhouse gas targets will require investment in our Canadian operations and/or the purchase of carbon allowances or offsets through a proposed Canadian Carbon Emissions Trading System. Compliance to the proposed regulatory targets for air pollutants will be similar to the requirements in progress through the previously discussed Pollution Prevention Plan. However, at this stage in the legislative process, we do not know what additional operating or capital expenditures will be required to comply with enacted amendments or what effect they will have on our business, financial results or cash flow from operations.
On March 10, 2008, the Canadian government released the greenhouse gas intensity targets for industry. Vale’s Canadian facilities will be required to reduce greenhouse gas intensities from smelting and refining operations by 18% by 2010 and 2% per year between 2010 and 2020 using 2006 as the base year.
Canadian Environmental Protection Act. Pursuant to the Canadian Environmental Protection Act (“CEPA”), in 2006 the government categorized approximately 23,000 chemical substances in terms of two criteria: (a) persistence, bioaccumulation, and inherent toxicity to the environment; and (b) high hazard to humans with a high likelihood of exposure to individuals in Canada. For substances that meet either or both criteria for categorization, screening or detailed assessments must be undertaken, and if deemed necessary, risk management measures may be required. In late 2006, the government began a study of 200 high-priority chemical substances. Cobalt and cobalt chloride are among these chemicals and specific studies with respect to them could begin in early 2009. We cannot predict what impact the CEPA data challenge will have on our business, financial results or cash flow from operations.
Silica (Canada and United States). In 2006, the American Conference of Governmental Industrial Hygienists (ACGIH) adopted new exposure limits for silica. In Thompson and Voisey’s Bay, the ACGIH values are legally binding. The new limits are half the value of the previous limits and represent a significant challenge for compliance requiring significant operational resources. Workplace exposures are being managed with procedural improvements to limit airborne dust generation, ventilation on conveyance systems and the use of respiratory protection devices. In addition, we are investing in upgrading the ventilation in the laboratory at the Voisey’s Bay site and to install ventilation in the new 1-D Lower ore body development project at Thompson. It is not clear at this time what impact, including potential future compensation claims, the new limits will have on our financial results.
Indonesia – environmental regulation
PT Inco’s operations are subject to environmental regulations and permits issued by the Indonesian government. PT Inco’s environmental, health and safety policy includes a commitment to meet or exceed these requirements. In the past, PT Inco’s operations were not in compliance with dust emissions limits.
In 2007, PT Inco completed the final stage of its US$62 million capital project to bring all of its electric furnaces well within the government-mandated dust emissions levels. PT Inco is currently implementing an SO 2 program that is aimed at ensuring compliance with stack discharge limits. This plan, which has been approved by the Indonesian government, includes monitoring and engineering assessments of available mitigation technologies.
In 2007, PT Inco’s site remained in compliance with regulations concerning suspended solids in runoff water and virtually all metals levels. However, during storms it has been difficult to comply with a new discharge
73
regulation for nickel mining and processing activities, released by the Ministry of the Environment in September 2007. This lowered the acceptable level of Chromium 6 from 0.5 milligrams per litre to 0.1 milligrams per litre. A detailed engineering study is underway to optimize site water management and ensure a high level of confidence going forward regarding compliance with this new regulation.
We are in compliance with government standards for soluble nickel.
New Caledonia – environmental regulation
Our Goro project is subject to French and New Caledonian environmental regulations. Environmental baseline monitoring, particularly for the marine environment, continued in 2007. We continue to be in negotiations with the New Caledonian government to obtain an operating permit for the Goro project. In preparation for the operation phase, a new tree nursery capable of producing over 260,000 seedlings was constructed and will begin operations in 2008. We expect to increase the nursery capacity to 1 million seedlings in 2013.
United States – environmental regulation
Clean Air Act. Nickel compounds are among the chemicals or chemical groups regulated as hazardous air pollutants (“HAPs”) under the U.S. Clean Air Act. Pursuant to this legislation, the EPA has been promulgating stringent technology-based standards for controlling emissions of HAPs from designated “major source” categories. This process will continue in the future and ultimately may include the promulgation of additional risk-based standards. Some of these standards may limit emissions of nickel and its compounds, most likely through limits on overall emissions of particulate matter. While it does not appear that the “major source” HAP control program will target emissions at nickel producing or using industries, it is possible that some nickel-emitting sources may ultimately be covered by such standards. We are unable to predict what capital expenditures or increases in operating costs Vale Inco or its customers may incur if that proves to be the case.
Our INMETCO recycling plant received a “Notice of Violation” from the Pennsylvania Department of Environmental Protection for exceeding the particulate concentration limit, violating Title V of the Operating Permit and PA Code 127.444. A capital project to install a baghouse on the furnace discharge is being initiated to address the non-compliance.
European Union – environmental regulation
REACH. In October 2003, the European Commission adopted draft legislation intended to consolidate and streamline a range of EU Directives and Member State Regulations. The new European Chemicals Policy, known as REACH (the acronym for “Registration, Evaluation, and Authorisation of Chemicals”), which came into force on June 1, 2007, establishes an all-encompassing system for the management of both new and existing chemicals that are manufactured in or imported into the EU.
The definition of chemicals is very broad and includes metals, alloys and all metal-containing compounds; it covers feeds and isolated intermediates as well as products.
Under REACH, manufacturers and importers will be required to register all new substances (in annual quantities greater than 1 metric ton) prior to their entry into the European market. There is a phase-in period for registering existing substances based on volume and hazard. In addition, the uses of certain substances deemed to be of very high concern, possibly including some nickel and cobalt substances, will be potential candidates for an authorization process. The authorization application must include an analysis of possible substitutes and, if suitable substitutes are deemed available, a substitution plan. If suitable substitutes are not available, information on relevant research and development activities must be provided, as appropriate. Even if substitutes are available, authorization may still be granted if a robust socioeconomic case can be made for retaining that specific use. The details of how the authorization process will work in practice remain to be determined.
REACH requires manufacturers and importers not only to obtain a large body of hazard data for their substances but also, if dealing with the same substance, to exchange certain information. Vale Inco has joined with other companies that produce and sell nickel, cobalt and precious metal products to create a number of consortia to manage the registration of similar products within the prescribed timescale. We have also formed a consortium with
74
other manganese producers in order to share resources and cooperate towards complying with REACH requirements.
Comprehensive legislative review and risk assessment. EU Regulation 793/93 (EEC), a regulation covering the evaluation of the risks of and controls for existing substances, includes five nickel substances (nickel sulphate, nickel chloride, nickel nitrate, nickel carbonate and nickel metal) as targets. The Danish Environmental Protection Agency (the “Danish EPA”) has been appointed the principal agency for conducting risk assessments on these substances. The Human Health risk assessment was completed in early 2006 and the Danish EPA released a draft risk reduction strategy in late 2006. The main recommendation is a review of the occupational exposure limits for various nickel species. The environmental risk assessment for nickel is expected to be released in 2008.
The nickel industry (through an industry association, the Nickel Institute) is currently in discussions with the EU regarding the potential classification of various nickel compounds under the Dangerous Substances Directive.
International – environmental regulation
ISO and OHSAS certifications. Our environmental management system is based on the International Organization for Standardization (ISO) standard 14001. We have ISO 14001 certificates covering:
• iron ore and pelletizing operations (Alegria, Timbopeba, Água Limpa, Fábrica Nova, Fazendão, Cauê, Conceição, Córrego do Feijão, Brucutu, Morro da Mina, Gongo Soco, Fábrica, Mutuca, Tamanduá, Capitão do Mato, Pico, Capão Xavier, Jangada, Aboboras, Mar Azul and Carajás mines and Fábrica and Tubarão pelletizing plants);
• manganese and ferroalloys plants (Azul and Morro da Mina mines, RDME and RDMN);
• nickel operations (Clydach Refinery, Vale Inco Japan Limited, Jinco Nonferrous Metal, IATM Dalian & Shenyang and Taiwan Nickel Refining Corporation);
• precious metals operations (Acton Refinery);
• port operations (Tubarão port and Itaguaí maritime terminal);
• aluminum operations (Alunorte, Albrás and Valesul); and
• kaolin production facilities (PPSA and CADAM).
Samarco and MRN are also certified under this standard. We also have obtained OHSAS 18001 certificates for the MBR system, Clydach refinery, Acton refinery, as well as the operations of our IATM Dalian & Shenyang and Jinco Nonferrous Metals Co. subsidiaries.
Harmonization of classification and labeling of chemicals. The Globally Harmonized System (“GHS”) is a global hazard classification and compatible labeling system for chemicals promulgated by the International Labour Organization. Although adoption of the GHS by individual countries is voluntary, the Plan of Implementation of the World Summit on Sustainable Development encourages countries to implement the GHS as soon as possible with a view to having the system fully operational by 2008.
Japan has implemented the GHS, while the United States has been enforcing the GHS for transportation purposes since January 2008. Other countries will implement the GHS over the next several years. We do not believe that the adoption of the GHS will have a material impact on our results of operations or financial condition.
75
Investment Canada Act undertakings
We made a number of undertakings to the Canadian Minister of Industry in connection with his approval in 2006 of our acquisition of Inco. We believe we are substantially in compliance with these undertakings, which are briefly described below.
Creation of a Canada-based global nickel business. We committed to locate the headquarters of our global nickel business in Toronto, Ontario and gave Vale Inco a mandate to expand its business as a global leader in the nickel industry. In furtherance of this mandate, we have transferred management responsibility for our interest in existing and future nickel projects to Vale Inco, including our interest in the Onça Puma and Vermelho projects in Brazil. We also undertook not to carry out any layoffs at Canadian operating facilities for at least three years from the date of the acquisition, and to maintain, for an agreed period, aggregate employment at such facilities at no less than 85% of the aggregate employment level as of the date on which the acquisition of Inco occurred.
Acceleration of Voisey’s Bay development project. We undertook to fully support the Voisey’s Bay development project and have expressed our desire to accelerate its implementation.
Enhanced investments in Vale Inco’s long-term future. To help strengthen Vale Inco’s position as a leader in the global nickel mining business and contribute to ensuring the long-term viability of Vale Inco’s operations in Sudbury and Thompson, we undertook to increase Canadian expenditures in a number of areas, including mine exploration and research and development, for a three-year period from the date of the acquisition.
Corporate social responsibility. We undertook to increase spending on employee programs in Canada for a three-year period from the date of the acquisition. We also undertook to increase spending on environmental compliance programs in Canada over that same period.
Continuing contributions to communities. We undertook to maintain Vale Inco’s involvement and commitment to the growth of Ontario’s mining cluster, including its membership in the Mineral Industry Cluster Council. We agreed to respect all agreements entered into by Vale Inco with provincial governments, local governments, labor unions and aboriginal groups, including the Labrador Inuit Association and the Innu Nation, in Canada. We also undertook to honor all commitments made by Vale Inco with regard to the funding of educational institutions in Canada, including commitments made with respect to the Centre for Excellence in Mining Innovation at Laurentian University in Sudbury, Ontario.
Each of the undertakings made by us to the Canadian Minister of Industry is subject to the “Investment Canada Act, Guidelines—Administrative Procedures, Monitoring of Investments.” Among other things, these guidelines state that performance is judged in the context of overall results and that an investor who is unable to fulfill a commitment will not be held accountable where such inability is a result of factors clearly beyond its control.

76
CAPITAL EXPENDITURES
During 2007, Vale made capital expenditures and other investments of US$11.004 billion, of which US$5.423 billion was on organic growth, composed of US$4.682 billion on projects and US$741 million on research and development, while US$2.202 billion was invested in maintaining existing business, and US$3.379 billion in acquisitions. Total capital expenditures in 2007, excluding spending on acquisitions and other investments were US$7.625 billion. This information on capital expenditures includes research and development expenditures, which are treated as a current expense for accounting purposes. See Note 3 to our consolidated financial statements herein.
In October 2007, our board of directors approved an investment budget for 2008 of US$11 billion, the largest annual investment program in our history (compared to expenditures of US$7.625 billion in 2007). This does not include the cost of any acquisitions. The 2008 budget is part of a five-year, US$59 billion strategic investment program that involves expenditures that are almost three times larger than the US$20.082 billion invested, excluding acquisitions, during the five-year period ended in December 31, 2007.
Of the total 2008 budget, 76.7%, or US$8.436 billion, will be allocated to expenditures for organic growth, of which a total of US$7.552 billion has been budgeted for more than 30 projects and US$884 million has been budgeted for research and development, of which US$349 million will be invested in mineral exploration. The remaining US$2.563 billion will be allocated to investments to support existing operations.
The following table summarizes the breakdown of our capital expenditures in 2006 and 2007 and our investment budget in 2008 by major business area.
2006 2007 2008 budget (US$ million) (% of total) (US$ million) (% of total) (US$ million) (% of total)
Ferrous minerals ............................ US$1,994 9.7% US$1,748 15.9 US$3,251 29.6% Non-ferrous minerals .................... 787 3.8 3,129 28.4 3,618 32.9 Aluminum...................................... 850 4.1 859 7.8 755 6.9 Logistics ........................................ 649 3.1 977 8.9 1,870 17.0 Coal................................................ 83 0.4 169 1.5 390 3.5 Energy ........................................... 92 0.4 165 1.5 470 4.3 Steel ............................................... – 279 2.5 81 0.7 Other .............................................. 435 2.1 298 2.7 565 5.1 Acquisitions................................... 15,738 76.3 3,379 30.7 – – Total............................................... US$20,628 100% US$11,004 100% US$11,000 100%
The following table describes our expenditures for our main investment projects in 2007 and our budgeted expenditures for projects in 2008, together with estimated total expenditures for each project. All figures in the table are presented on a cash basis. For a description of the status of each of the projects in the table, see —Lines of business.
Actual Budgeted Business area Project 2007 2008 Total Capex(1) (US$ million) Ferrous minerals and logistics Carajás iron ore mine 74 1,165 2,478 Fazendão iron ore mine 104 50 129 Serra Sul iron ore mine – 145 10,094 Maquiné-Baú iron ore mine – 11 2,207 Itabiritos pelletizing plant 542 341 973 Tubarão VIII pelletizing plant 0.5 95 636 Oman pelletizing plant 0.6 82 546 Northern Corridor 267 334 956 Southern Corridor 54 379 553 Litorânea Sul railroad – 43 414 Non-ferrous Onça Puma nickel mine 537 581 2,297(2) Goro nickel mine 1,125 723 3,212 Totten nickel and copper mine 33 66 362 Voisey’s Bay nickel refinery 30 110 2,177 Vermelho nickel mine 62 91 1,908
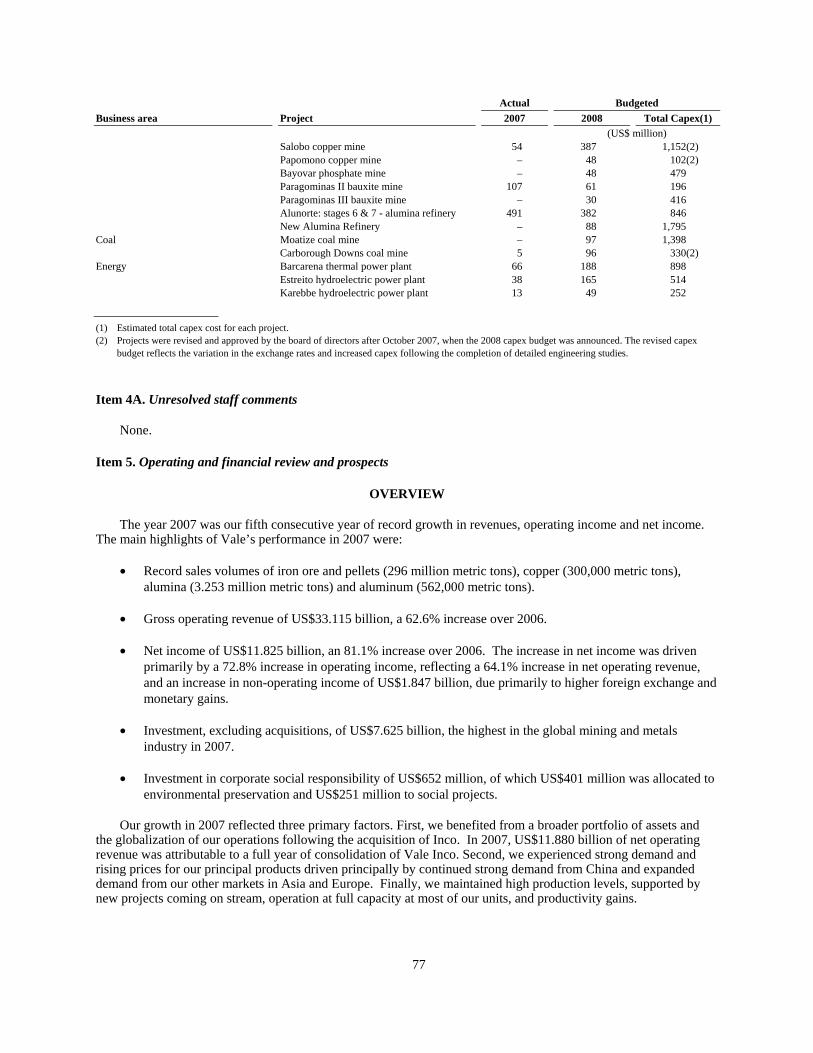
77
Actual Budgeted Business area Project 2007 2008 Total Capex(1) (US$ million) Salobo copper mine 54 387 1,152(2) Papomono copper mine – 48 102(2) Bayovar phosphate mine – 48 479 Paragominas II bauxite mine 107 61 196 Paragominas III bauxite mine – 30 416 Alunorte: stages 6 & 7 - alumina refinery 491 382 846 New Alumina Refinery – 88 1,795 Coal Moatize coal mine – 97 1,398 Carborough Downs coal mine 5 96 330(2) Energy Barcarena thermal power plant 66 188 898 Estreito hydroelectric power plant 38 165 514 Karebbe hydroelectric power plant 13 49 252 (1) Estimated total capex cost for each project. (2) Projects were revised and approved by the board of directors after October 2007, when the 2008 capex budget was announced. The revised capex
budget reflects the variation in the exchange rates and increased capex following the completion of detailed engineering studies. Item 4A. Unresolved staff comments
None.
Item 5. Operating and financial review and prospects
OVERVIEW
The year 2007 was our fifth consecutive year of record growth in revenues, operating income and net income. The main highlights of Vale’s performance in 2007 were:
• Record sales volumes of iron ore and pellets (296 million metric tons), copper (300,000 metric tons), alumina (3.253 million metric tons) and aluminum (562,000 metric tons).
• Gross operating revenue of US$33.115 billion, a 62.6% increase over 2006.
• Net income of US$11.825 billion, an 81.1% increase over 2006. The increase in net income was driven primarily by a 72.8% increase in operating income, reflecting a 64.1% increase in net operating revenue, and an increase in non-operating income of US$1.847 billion, due primarily to higher foreign exchange and monetary gains.
• Investment, excluding acquisitions, of US$7.625 billion, the highest in the global mining and metals industry in 2007.
• Investment in corporate social responsibility of US$652 million, of which US$401 million was allocated to environmental preservation and US$251 million to social projects.
Our growth in 2007 reflected three primary factors. First, we benefited from a broader portfolio of assets and the globalization of our operations following the acquisition of Inco. In 2007, US$11.880 billion of net operating revenue was attributable to a full year of consolidation of Vale Inco. Second, we experienced strong demand and rising prices for our principal products driven principally by continued strong demand from China and expanded demand from our other markets in Asia and Europe. Finally, we maintained high production levels, supported by new projects coming on stream, operation at full capacity at most of our units, and productivity gains.
78
Demand
Demand for iron ore and pellets
Demand for our iron ore and iron ore pellets is a function of the global demand for steel, which is, in turn, strongly influenced by world industrial production. In recent years, we have experienced a significant increase in demand, particularly from China. Global demand for steel has been growing since 2002, and the global demand for iron ore grew at an annual average rate of 9.6% between 2002 and 2007. In China, where we have been the largest single supplier of iron ore since 2006, we expect the demand for imported iron ore to remain strong through the end of this decade, pressuring the global supply.
Demand for iron ore and iron ore pellets exceeded our production capacity throughout 2007, and we expect the same to occur in 2008. We continue to invest to increase capacity, and our programmed iron ore production for 2008 is higher than in 2007, but we continue to face excess demand. We expect to continue meeting some of this demand by purchasing iron ore from third parties for resale to our customers. In 2007, we purchased 8.3 million metric tons of iron ore and 11.7 million metric tons of pellets from third parties.
Demand for nickel
Strong growth in emerging markets, particularly in China, continues to drive demand growth for nickel. In 2007, Chinese nickel demand increased an estimated 90,000 metric tons, or 36% higher than in 2006, and stainless steel output expanded to 7.5 million metric tons, or 41% higher than in 2006.
Volatility in global stainless steel production continues to drive nickel price volatility. In response to rising nickel prices, global stainless steel production in 2007 shifted towards the production of stainless steels with lower nickel content. In addition, an inventory adjustment cycle followed the sharp 21% increase in 2006 of global austenitic stainless steel output. As a result, 2007 production of austenitic stainless steel fell an estimated 7%, and the demand for primary nickel decreased by 2%. Meanwhile, nickel demand for many non-stainless steel applications - non-ferrous alloys, alloy steels, foundry, batteries and others – remained solid.
Despite the cyclical dynamics of the stainless steel industry, we continue to have a positive long-term outlook for nickel. Per capita consumption of stainless steel in high-growth emerging market economies is still low, and the potential for growth in nickel demand arising from non-stainless steel applications is significant.
Demand for aluminum
The global demand for aluminum has been growing significantly. Between 2002 and 2007 it is estimated to have increased at an annual average rate of 7.7%. China has been the primary driver of demand expansion. We expect global demand to continue to expand at a fast pace over the next few years.
Demand for copper
In recent years, growth in copper demand has been driven primarily by Chinese imports. In 2007, the copper market was affected by a tight supply of concentrates and refined metal. Supply is anticipated to remain limited as exchange inventories are low, miners are already producing at full capacity and significant increases in global mine capacity are not expected in the short term.
Demand for coal
Coal prices have increased steadily over the past six years, but current high prices may decline significantly in response to economic conditions. However, we expect continued growth in steel demand, especially in Asia, to underpin strong demand for metallurgical coal. With major port (and often rail) constraints in the short term in Australia, Canada and the United States, we expect new metallurgical coal capacity to be limited. Given these factors and a number of new coke batteries under development, we expect continued favorable market conditions.
The thermal coal market is the most rapidly growing segment of the global coal industry. It is largely a seaborne market, having significantly expanded in recent years. Growth in thermal coal demand is closely related to
79
growth in electricity consumption, which will continue to be driven by global economic growth and particularly economy growth in emerging markets. The cost of fuel is typically the largest variable cost involved in electricity generation and, on an energy basis, coal is currently the cheapest fossil fuel for electricity generation.
Demand for transportation services
Demand for our transportation services in Brazil is primarily driven by growth in the Brazilian economy, mainly in the agricultural and steel sectors. Demand for rail transportation grew more slowly in 2005 and 2006 due to stagnation of Brazilian grain exports and lower Brazilian steel production, but these industries began to recover in 2007.
Production capacity
Capacity expansions are a key factor influencing our revenues. We continue to invest in increasing capacity at a large number of facilities. Completed projects that had a significant effect on 2007 results included the following:
• The expansion of production capacity at Carajás. Since January 2007 we have been operating the Northern System (Carajás) at the level of 100 million metric tons per year. In 2007 we produced 91.7 million metric tons of iron ore in Carajás, compared to 81.8 million metric tons in 2006.
• Production at our Brucutu iron ore mine amounted to 22 million metric tons in 2007, compared to 7.7 million metric tons in 2006, and is expected to reach 30 million metric tons in 2008.
• Production at Alunorte amounted to 4.3 million metric tons in 2007, following the completion of an expansion project in the first quarter of 2006 that was designed to increase its nominal capacity from 2.4 to 4.4 million metric tons per year.
In addition to the above projects, the following major projects will affect our results in 2008:
• The start-up of Goro, which will have production capacity of 60,000 metric tons per year of nickel in matte and 4,600 metric tons per year of cobalt, is scheduled to be completed by the end of 2008.
• The completion of the second phase of the expansion of Paragominas will increase its production capacity to 9.9 million metric tons of bauxite per year.
• The expansion of Alunorte’s production capacity by a further 1.9 million metric tons, which is scheduled to be completed in the second half of 2008.
• The completion of the Itabiritos pellet plant, with annual production capacity of 7 million metric tons, in the second half of 2008, and the increase of annual pellet production capacity at Samarco by 7.6 million metric tons in the first half of 2008.
See Item 4. Information on the Company—Capital Expenditures for more information concerning the projects we currently have under way to increase capacity.
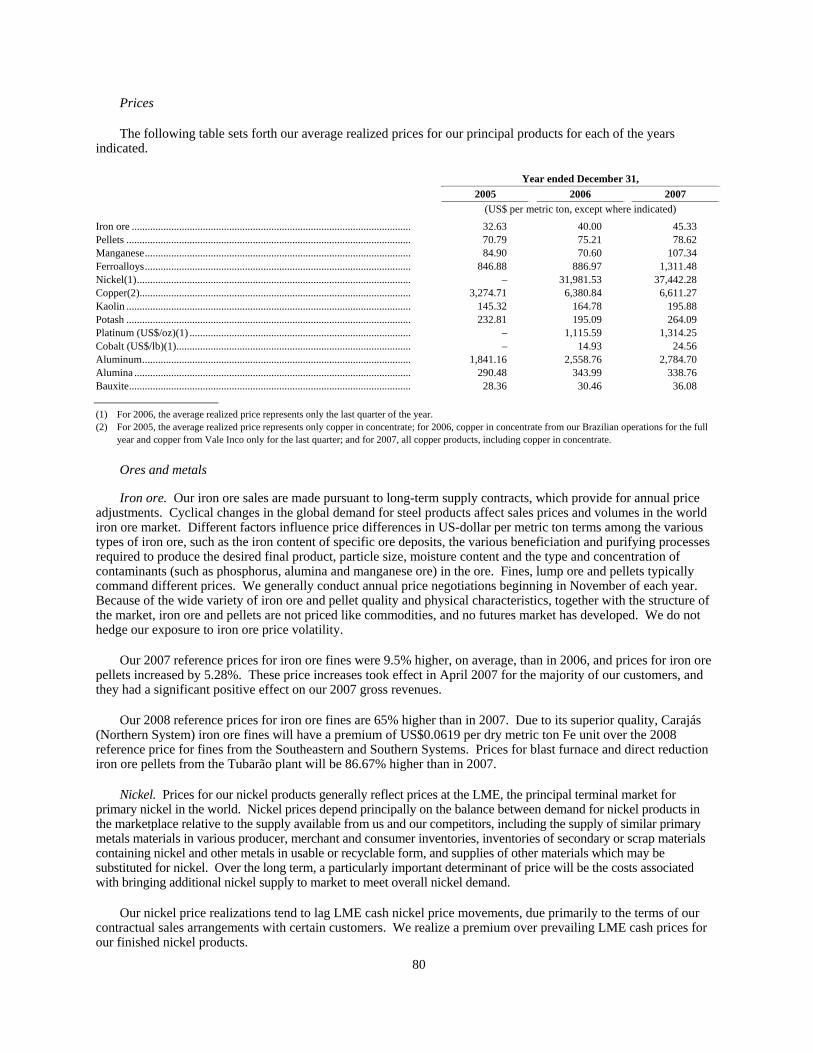
80
Prices
The following table sets forth our average realized prices for our principal products for each of the years indicated.
Year ended December 31, 2005 2006 2007
(US$ per metric ton, except where indicated) Iron ore .......................................................................................................... 32.63 40.00 45.33 Pellets ............................................................................................................ 70.79 75.21 78.62 Manganese..................................................................................................... 84.90 70.60 107.34 Ferroalloys..................................................................................................... 846.88 886.97 1,311.48 Nickel(1)........................................................................................................ – 31,981.53 37,442.28 Copper(2)....................................................................................................... 3,274.71 6,380.84 6,611.27 Kaolin ............................................................................................................ 145.32 164.78 195.88 Potash ............................................................................................................ 232.81 195.09 264.09 Platinum (US$/oz)(1) .................................................................................... – 1,115.59 1,314.25 Cobalt (US$/lb)(1)......................................................................................... – 14.93 24.56 Aluminum...................................................................................................... 1,841.16 2,558.76 2,784.70 Alumina ......................................................................................................... 290.48 343.99 338.76 Bauxite........................................................................................................... 28.36 30.46 36.08
(1) For 2006, the average realized price represents only the last quarter of the year. (2) For 2005, the average realized price represents only copper in concentrate; for 2006, copper in concentrate from our Brazilian operations for the full
year and copper from Vale Inco only for the last quarter; and for 2007, all copper products, including copper in concentrate. Ores and metals
Iron ore. Our iron ore sales are made pursuant to long-term supply contracts, which provide for annual price adjustments. Cyclical changes in the global demand for steel products affect sales prices and volumes in the world iron ore market. Different factors influence price differences in US-dollar per metric ton terms among the various types of iron ore, such as the iron content of specific ore deposits, the various beneficiation and purifying processes required to produce the desired final product, particle size, moisture content and the type and concentration of contaminants (such as phosphorus, alumina and manganese ore) in the ore. Fines, lump ore and pellets typically command different prices. We generally conduct annual price negotiations beginning in November of each year. Because of the wide variety of iron ore and pellet quality and physical characteristics, together with the structure of the market, iron ore and pellets are not priced like commodities, and no futures market has developed. We do not hedge our exposure to iron ore price volatility.
Our 2007 reference prices for iron ore fines were 9.5% higher, on average, than in 2006, and prices for iron ore pellets increased by 5.28%. These price increases took effect in April 2007 for the majority of our customers, and they had a significant positive effect on our 2007 gross revenues.
Our 2008 reference prices for iron ore fines are 65% higher than in 2007. Due to its superior quality, Carajás (Northern System) iron ore fines will have a premium of US$0.0619 per dry metric ton Fe unit over the 2008 reference price for fines from the Southeastern and Southern Systems. Prices for blast furnace and direct reduction iron ore pellets from the Tubarão plant will be 86.67% higher than in 2007.
Nickel. Prices for our nickel products generally reflect prices at the LME, the principal terminal market for primary nickel in the world. Nickel prices depend principally on the balance between demand for nickel products in the marketplace relative to the supply available from us and our competitors, including the supply of similar primary metals materials in various producer, merchant and consumer inventories, inventories of secondary or scrap materials containing nickel and other metals in usable or recyclable form, and supplies of other materials which may be substituted for nickel. Over the long term, a particularly important determinant of price will be the costs associated with bringing additional nickel supply to market to meet overall nickel demand.
Our nickel price realizations tend to lag LME cash nickel price movements, due primarily to the terms of our contractual sales arrangements with certain customers. We realize a premium over prevailing LME cash prices for our finished nickel products.
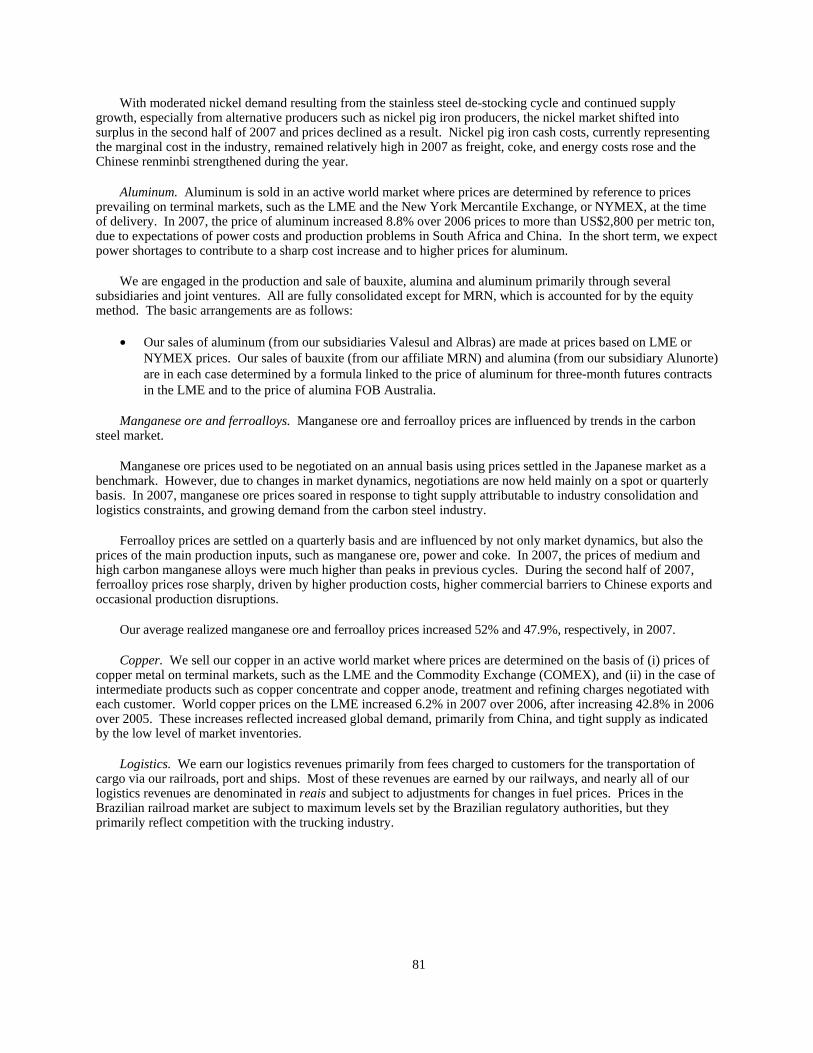
81
With moderated nickel demand resulting from the stainless steel de-stocking cycle and continued supply growth, especially from alternative producers such as nickel pig iron producers, the nickel market shifted into surplus in the second half of 2007 and prices declined as a result. Nickel pig iron cash costs, currently representing the marginal cost in the industry, remained relatively high in 2007 as freight, coke, and energy costs rose and the Chinese renminbi strengthened during the year.
Aluminum. Aluminum is sold in an active world market where prices are determined by reference to prices prevailing on terminal markets, such as the LME and the New York Mercantile Exchange, or NYMEX, at the time of delivery. In 2007, the price of aluminum increased 8.8% over 2006 prices to more than US$2,800 per metric ton, due to expectations of power costs and production problems in South Africa and China. In the short term, we expect power shortages to contribute to a sharp cost increase and to higher prices for aluminum.
We are engaged in the production and sale of bauxite, alumina and aluminum primarily through several subsidiaries and joint ventures. All are fully consolidated except for MRN, which is accounted for by the equity method. The basic arrangements are as follows:
• Our sales of aluminum (from our subsidiaries Valesul and Albras) are made at prices based on LME or NYMEX prices. Our sales of bauxite (from our affiliate MRN) and alumina (from our subsidiary Alunorte) are in each case determined by a formula linked to the price of aluminum for three-month futures contracts in the LME and to the price of alumina FOB Australia.
Manganese ore and ferroalloys. Manganese ore and ferroalloy prices are influenced by trends in the carbon steel market.
Manganese ore prices used to be negotiated on an annual basis using prices settled in the Japanese market as a benchmark. However, due to changes in market dynamics, negotiations are now held mainly on a spot or quarterly basis. In 2007, manganese ore prices soared in response to tight supply attributable to industry consolidation and logistics constraints, and growing demand from the carbon steel industry.
Ferroalloy prices are settled on a quarterly basis and are influenced by not only market dynamics, but also the prices of the main production inputs, such as manganese ore, power and coke. In 2007, the prices of medium and high carbon manganese alloys were much higher than peaks in previous cycles. During the second half of 2007, ferroalloy prices rose sharply, driven by higher production costs, higher commercial barriers to Chinese exports and occasional production disruptions.
Our average realized manganese ore and ferroalloy prices increased 52% and 47.9%, respectively, in 2007.
Copper. We sell our copper in an active world market where prices are determined on the basis of (i) prices of copper metal on terminal markets, such as the LME and the Commodity Exchange (COMEX), and (ii) in the case of intermediate products such as copper concentrate and copper anode, treatment and refining charges negotiated with each customer. World copper prices on the LME increased 6.2% in 2007 over 2006, after increasing 42.8% in 2006 over 2005. These increases reflected increased global demand, primarily from China, and tight supply as indicated by the low level of market inventories.
Logistics. We earn our logistics revenues primarily from fees charged to customers for the transportation of cargo via our railroads, port and ships. Most of these revenues are earned by our railways, and nearly all of our logistics revenues are denominated in reais and subject to adjustments for changes in fuel prices. Prices in the Brazilian railroad market are subject to maximum levels set by the Brazilian regulatory authorities, but they primarily reflect competition with the trucking industry.

82
Acquisitions and divestitures
We have made a number of significant acquisitions and divestitures that have affected our results in recent years, of which the acquisition of Inco has had the biggest impact in our 2006 and 2007 results, as shown in the following table. For more information, see Item 4. Information on the company—Business overview—Significant changes in our business.
Year ended December 31, 2006 Year ended December 31, 2007
Total Vale Attributable to Vale
Inco Total Vale Attributable to Vale
Inco (US$ million) Gross revenues ................................................... US$20,363 US$2,802 US$33,115 US$11,880 Operating costs and expenses ............................ 10,147 2,230 16,463 6,533 Operating income ............................................... 7,637 411 13,194 4,875
The operating costs of Vale Inco in 2006 and 2007 were affected by purchase accounting adjustments in
accordance with SFAS 141 and SFAS 142. Under these standards, the acquired company’s assets, including inventories, are adjusted to their fair value at the time of acquisition. When the inventories are sold, the cost of goods sold reflects this fair value rather than the production cost. Applying these principles, the market value of Vale Inco’s inventories at the time of acquisition was adjusted upward by an aggregate of US$2.008 billion of which US$946 million was recognized in 2006 and US$1.062 billion in 2007.
Currency price changes
Our results are affected by currency price changes, primarily because most of our revenues are denominated in U.S. dollars, while most of our costs of goods sold are denominated in other currencies, principally the real (56.6% in 2007) and the Canadian dollar (23.3%). The acquisition of Inco significantly diversified the currency composition of our operating costs, and our results are now less driven by the value of the real than before. In addition to the effect on operating margins, currency exchange rates affect us because most of our debt is denominated in U.S. dollars while our functional currency is the real.
In recent years, the weakness of the U.S. dollar has had an adverse effect on our operating margins. On the other hand, it has resulted in foreign exchange gains on our U.S. dollar-denominated indebtedness, which we recognize because the real is our functional currency. In 2007, the average exchange rate for one U.S. dollar for the year was R$1.9483, compared to R$2.1771 during 2006, representing an 11.7% increase in the average value of the real for the year. From year-end 2006 to year-end 2007, the U.S. dollar depreciated by 17.2% against the real, compared to depreciation of 8.7% during 2006.
Operating expenses
Our principal operating expenses consist of cost of goods sold, selling, general and administrative expenses and research and development expenses.
Cost of goods sold. Our cost of goods sold consists principally of costs of purchased products for processing or resale, such as iron ore, iron ore pellets, nickel and aluminum products, services (especially ore and waste removal, transportation and maintenance), materials, such as components for railroad and mining equipment, energy (fuel and electric energy), personnel and depreciation and depletion. As described above, in 2006 and 2007 our cost of goods sold also reflect the non-cash effect of purchase accounting adjustments in connection with our acquisition of Inco.
Selling, general and administrative expenses. Our selling, general and administrative expenses consist principally of personnel expense, sales expense and depreciation.
Research and development expenses. Our research and development expenses consist primarily of investments related to mineral exploration and studies for the development of projects, which are recorded as expenses until the economic viability of related mining activities is established.

83
RESULTS OF OPERATIONS—2007 COMPARED TO 2006
Revenues
Our gross operating revenues rose to US$33.115 billion in 2007, a 62.6% increase over 2006. Our net operating revenues increased 64.1% to US$32.242 billion in 2007. The following table summarizes our gross revenues by product and our net operating revenues for the periods indicated:
Year ended December 31, 2006 2007 % change (US$ million)
Ferrous minerals: Iron ore .............................................................................................................. US$10,027 US$11,908 18.8% Iron ore pellets ................................................................................................... 1,979 2,738 38.4 Manganese ......................................................................................................... 55 77 40.0 Ferroalloys ......................................................................................................... 508 711 40.0
Subtotal ........................................................................................................ 12,569 15,434 22.8
Non-ferrous minerals: Nickel and other products(1)............................................................................. 2,802 11,789 320.7 Potash................................................................................................................. 143 178 24.5 Kaolin ................................................................................................................ 218 238 9.2 Copper concentrate(2) ....................................................................................... 779 802 3.0
Subtotal ........................................................................................................ 3,942 13,007 230.0
Aluminum................................................................................................................ 2,381 2,722 14.3
Total minerals and metals............................................................................ 16,511 28,441 72.3 Logistic services ...................................................................................................... 1,376 1,525 10.8 Other products and services(3) ............................................................................... 95 427 349.5
Gross revenues................................................................................................... 20,363 33,115 62.6 Value-added tax....................................................................................................... (712) (873) 22.6
Net operating revenues...................................................................................... US$19,651 US$32,242 64.1% (1) Includes copper, precious metals, cobalt and other by-products produced by Vale Inco. (2) Does not include copper produced by Vale Inco. (3) Including coal.
Iron ore. Gross revenues from iron ore increased by 18.8%, driven primarily by a 13.3% increase in average
selling prices and a 4.8% increase in the volume of iron ore sold. The price increases resulted from a 9.5% increase in 2007 reference prices for iron ore fines, effective as of April 2007 for the majority of our customers, and a 19% increase in 2006 reference prices for iron ore fines, effective as of April 2006 for the majority of our customers. The increase in volumes sold was made possible by the expansion of production capacity at our Carajás mine in January 2007 and the ramp-up of our Brucutu mine. These production increases more than offset the negative impact of heavy rain during the first quarter, which slowed production in the mines and caused rail transportation disruptions in the Southeastern System.
Iron ore pellets. Gross revenues from iron ore pellets increased by 38.4% in 2007. Total volumes sold in 2007 were 32.8% higher than in 2006, primarily reflecting the commencement of operations at São Luís after a temporary shutdown in 2006. The 4.5% average price increase resulted from a 5.28% increase in 2007 reference prices for blast furnace and direct reduction pellets, effective as of April 2007 for the majority of our customers, and a 3% reduction in 2006 reference prices blast furnace and direct reduction pellets, effective as of April 2006 for the majority of our customers.

84
Manganese ore. Gross revenues from manganese ore increased by 40%, reflecting a 52% increase in average selling prices and 9.1% decrease in volume. The decrease in volume was due to a temporary shutdown of our Azul mine from July to December 2007 in order to allow the rail lines that serve to transport our iron ore.
Ferroalloys. Gross revenues from ferroalloys increased by 40.0% due to a 47.9% increase in average selling prices, which was partially offset by a 6.5% decrease in volume largely as a result of furnace repairs at our plant in France.
Nickel and other products. In 2007, revenues from nickel and other products were US$11.789 billion, compared to US$2.802 billion in 2006, when we consolidated Vale Inco for only the last quarter of the year.
Potash. Gross revenues from sales of potash increased by 24.5%, driven by a 35.4% increase in average selling prices and an 8% decline in volume, reflecting problems with mining equipment in the first half of 2007 and lower grade of potash we mined.
Kaolin. Gross revenues from sales of kaolin increased by 9.2%, due principally to a 18.9% increase in average selling prices. Volume decreased by 8.2% due to problems with machinery.
Copper concentrate. Gross revenues from sales of copper concentrate increased by 3%, from US$779 million in 2006 to US$802 million in 2007, due to a 4.7% increase in average selling prices.
Aluminum. Gross revenues from aluminum business increased by 14.3%. This reflected the following factors:
• A 26.2% increase in gross revenues from sales of aluminum, from US$1.244 billion in 2006 to US$1.570 billion in 2007, mainly driven by an 8.8% rise in average selling prices. Volume increased by 15.9%, primarily due to the consolidation of Valesul, which began in July 2006.
• Stable gross revenues from sales of alumina at US$1.102 billion in 2007, compared to US$1.108 billion in 2006. Both average selling prices and volume sold remained stable.
• A 69% increase in gross revenues from sales of bauxite, from US$29 million in 2006 to US$49 million in 2007. Volume increased by 42.6%, reflecting MRN’s increased volume available for sale to unaffiliated customers, given the start-up of our Paragominas mine. Average selling prices increased by 18.5% due to higher LME prices for aluminum, the reference price for our bauxite sales.
Logistics services. Gross revenues from logistics services increased by 10.8%. The increase reflects the appreciation of the real, since our prices are generally denominated in reais, as well as price increases in reais. In particular:
• Revenues from railroad transportation increased by 20.7%, from US$1.011 billion in 2006 to US$1.220 billion in 2007. Average prices increased by 16.1% and volume shipped increased by 3.9%.
• Revenues from port operations increased by 2.3%, from US$261 million in 2006 to US$267 million in 2007. Average prices increased by 7.4%, while volume decreased by 4.4%.
• Revenues from shipping decreased by 63.5%, from US$104 million in 2006 to US$38 million in 2007, due to the sale of our controlling interest in Log-In, which is no longer consolidated.
Other products and services. Gross revenues from other products and services increased from US$95 million in 2006 to US$427 million in 2007, primarily reflecting sales of coal following our acquisition of AMCI Holdings Australia Pty.
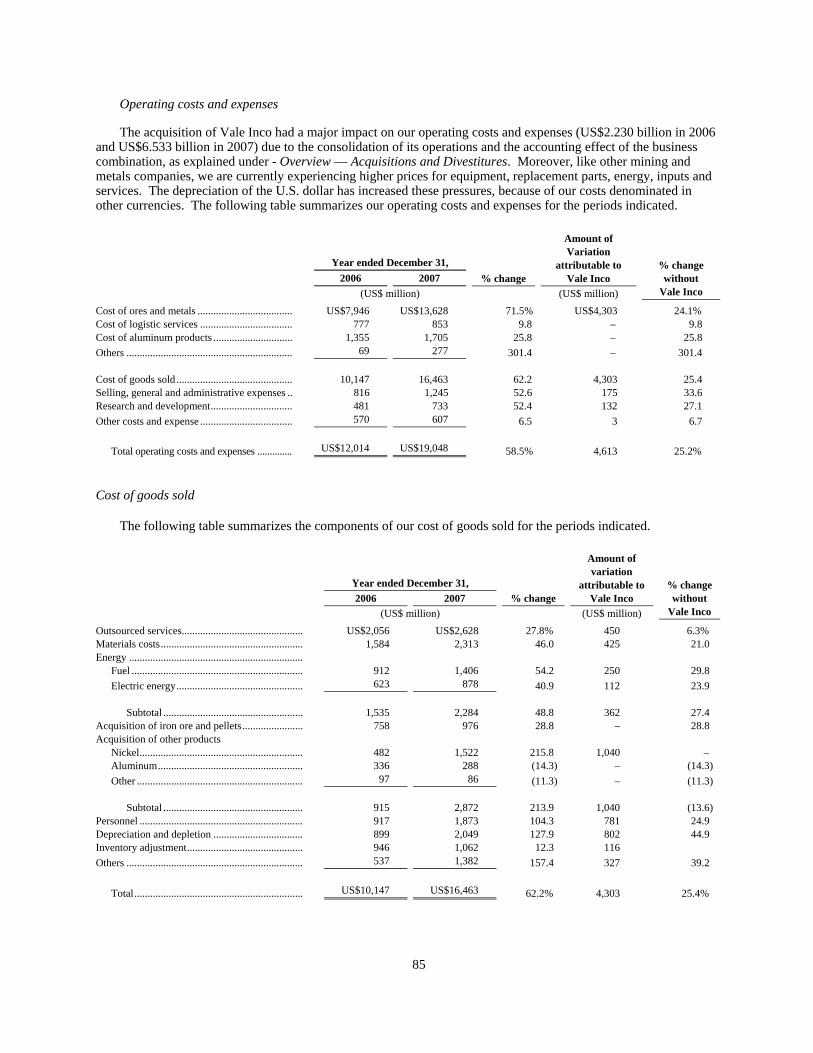
85
Operating costs and expenses
The acquisition of Vale Inco had a major impact on our operating costs and expenses (US$2.230 billion in 2006 and US$6.533 billion in 2007) due to the consolidation of its operations and the accounting effect of the business combination, as explained under - Overview — Acquisitions and Divestitures. Moreover, like other mining and metals companies, we are currently experiencing higher prices for equipment, replacement parts, energy, inputs and services. The depreciation of the U.S. dollar has increased these pressures, because of our costs denominated in other currencies. The following table summarizes our operating costs and expenses for the periods indicated.
Year ended December 31, 2006 2007 % change
Amount of Variation
attributable to Vale Inco
(US$ million) (US$ million)
% change without
Vale Inco
Cost of ores and metals .................................... US$7,946 US$13,628 71.5% US$4,303 24.1% Cost of logistic services ................................... 777 853 9.8 – 9.8 Cost of aluminum products .............................. 1,355 1,705 25.8 – 25.8 Others ............................................................... 69 277 301.4 – 301.4 Cost of goods sold ............................................ 10,147 16,463 62.2 4,303 25.4 Selling, general and administrative expenses .. 816 1,245 52.6 175 33.6 Research and development............................... 481 733 52.4 132 27.1 Other costs and expense ................................... 570 607 6.5 3 6.7
Total operating costs and expenses .............. US$12,014 US$19,048 58.5% 4,613 25.2%
Cost of goods sold
The following table summarizes the components of our cost of goods sold for the periods indicated.
Year ended December 31, 2006 2007 % change
Amount of variation
attributable to Vale Inco
(US$ million) (US$ million)
% change without
Vale Inco
Outsourced services.............................................. US$2,056 US$2,628 27.8% 450 6.3% Materials costs...................................................... 1,584 2,313 46.0 425 21.0 Energy ..................................................................
Fuel ................................................................. 912 1,406 54.2 250 29.8 Electric energy................................................ 623 878 40.9 112 23.9
Subtotal ..................................................... 1,535 2,284 48.8 362 27.4
Acquisition of iron ore and pellets....................... 758 976 28.8 – 28.8 Acquisition of other products
Nickel.............................................................. 482 1,522 215.8 1,040 – Aluminum....................................................... 336 288 (14.3) – (14.3) Other ............................................................... 97 86 (11.3) – (11.3)
Subtotal ..................................................... 915 2,872 213.9 1,040 (13.6)
Personnel .............................................................. 917 1,873 104.3 781 24.9 Depreciation and depletion .................................. 899 2,049 127.9 802 44.9 Inventory adjustment............................................ 946 1,062 12.3 116 Others ................................................................... 537 1,382 157.4 327 39.2
Total................................................................ US$10,147 US$16,463 62.2% 4,303 25.4%
86
Our total cost of goods sold increased by 62.2% from 2006 to 2007. This increase resulted primarily from the following factors:
• Impact of Vale Inco. Of the total increase in our cost of goods sold, US$4.303 billion represents the difference between Vale Inco’s costs for the portion after the acquisition became effective. As described above, part of its costs (US$1.062 billion in 2007 and US$946 million in 2006) related to the recognition of the final purchase accounting adjustments concluded in 2007, relating to the value of Vale Inco inventories.
• Impact of depreciation of the U.S. dollar. Because most of our costs and expenses are denominated in currencies other than the U.S. dollar, the depreciation of the U.S. dollar led to higher costs as expressed in that currency. For example, the average value of the real against the U.S. dollar for the year was 11.7% higher in 2007 than in 2006, which accounted for US$677 million of the increase, excluding Vale Inco.
• Outsourced services. Vale Inco accounted for US$450 million of outsourced services. Excluding Vale Inco, outsourced services costs increased by 6.3% in 2007 due to higher volumes and the depreciation of the U.S. dollar against the real, partially offset by a decrease in outsourcing contracts for ore and waste removal.
• Material costs. Vale Inco accounted for US$425 million of material costs. Excluding Vale Inco, material costs increased by 21% in 2007, primarily reflecting higher volumes, price increase and the depreciation of the U.S. dollar against other currencies.
• Acquisition of iron ore and iron ore pellets. Cost of iron ore and iron ore pellets purchased from other mining companies increased 28.8%. We purchased 11.7 million metric tons of pellets from third parties in 2007, an increase of 31.5% compared to 8.9 million metric tons purchased in 2006. This, and the effect of increased price, were partly offset by an 18.6% decrease in the volume of iron ore purchased from third-party suppliers, to 8.3 million metric tons in 2007 compared to 10.2 million metric tons in 2006.
• Acquisition of other products. Acquisition of nickel products, which includes nickel concentrates for processing under tolling contracts, intermediary products and finished nickel, totaled US$1.522 billion in 2007.
• Energy costs. Vale Inco accounted for US$362 million of energy costs. Excluding Vale Inco, energy costs increased by 27.4% in 2007. The increase in electricity costs primarily reflects 8% higher electricity prices for aluminum production under the Albras electricity contract, which links a portion of the price to the LME price for aluminum, while the increase in fuel costs was driven by higher production and the depreciation of the U.S. dollar.
• Personnel costs. Vale Inco accounted for US$781 million of personnel costs. Excluding Vale Inco, personnel costs increased by 24.9%, reflecting an increase in the number of our employees because of the growth of our operations and the return to in-house solutions for some services such as ore and waste removal at our iron ore mines, and the impact of the 2007 wage increases.
• Other costs. The increase of US$845 million is mainly due to payments of royalties and the consolidation of Taiwan Nickel Refining Company (“TNRC”) beginning in the fourth quarter of 2007. We have a 49.9% stake of TNRC, but since we are the only supplier of nickel feed to TNRC, we consolidated it in accordance with Interpretation 46, “Consolidation of Variable Interest Entities, an Interpretation of ARB No. 51” (FIN 46), issued in January 2003 and revised in December 2003 (FIN 46-R) by the Financial Accounting Standard Board.
Selling, general and administrative expenses
Selling, general and administrative expenses increased by 52.6%. Vale Inco accounted for US$142 million in selling, general and administrative expenses. Excluding the impact of Vale Inco, selling, general and administrative

87
expenses increased by US$287 million, as a result of higher selling expenses due to the increase in sales volume, advertising (including US$74 million related to the launch of the Vale brand) and the appreciation of the other currencies against the U.S. dollar.
Research and development expenses
Research and development expenses increased by 52.4%. Of the US$252 million increase, US$96 million was attributable to Vale Inco. The remainder of the increase primarily reflects an increase in mineral exploration and project studies in several regions, including South America, Asia, Africa and Australia.
Operating income by segment
The following table provides information concerning our operating income by segment and as a percentage of revenues for the periods indicated.
Year ended December 31, 2006 2007
Segment operating income (loss) Segment operating income (loss) (US$ million) (% of net operating
revenues) (US$ million) (% of net operating revenues)
Ferrous minerals Iron ore ......................................................... US$5,168 53.0% US$6,325 54.4% Pellets............................................................ 630 33.3 659 25.3 Manganese ore.............................................. (49) – (9) – Ferroalloys .................................................... 3 0.6 182 28.0
Non-ferrous minerals Nickel and other products ............................ 411 14.7 4,785 40.6 Potash............................................................ 28 20.7 37 22.0 Kaolin ........................................................... – – (32) – Copper concentrate....................................... 464 61.1 252 32.6
Aluminum Alumina and bauxite .................................... 294 26.0 160 13.9 Aluminum..................................................... 631 51.9 668 44.3
Logistics Railroads....................................................... 274 32.9 297 29.1 Ports .............................................................. 64 29.5 22 10.0 Ships ............................................................. (6) – (12) –
Others ................................................................. (275) – (140) –
Total.............................................................. US$7,637 38.9% US$13,194 40.9%
Our operating income increased as a percentage of net operating revenues from 38.9% in 2006 to 40.9% in 2007.
• This increase was driven primarily by increases in the margins on our iron ore, nickel, ferroalloys and potash businesses, which, together with the impact of consolidating Vale Inco and its operating margin of 40.6%, more than offset lower margins in our iron ore pellets, copper, alumina, aluminum and port businesses.
• The increase in margins in our iron ore business primarily reflects higher average selling prices, which more than offset the impact of the appreciation of the real against the U.S. dollar, higher research and development expenditures and higher depreciation charges due to the expansion of our asset base.
• The increased operating margin for nickel and other products reflects in part the impact of the purchase accounting adjustments relating to inventories described above, which adversely affected margins in 2006 to a much greater degree than in 2007. This will not affect our results in 2008.

88
• The margin declines in the alumina, aluminum and port operations segments resulted primarily from price increases of significant inputs such as electricity, oil, coking coal and pitch, a decrease in the average selling price of alumina, and the appreciation of the real against the U.S. dollar.
• The margin declines in the copper concentrate segment resulted primarily from higher costs due to lower copper grades and the appreciation of the real against the U.S. dollar.
• The significant margin increases in the ferroalloys segment are due to higher average prices.
Non-operating income (expenses)
The following table details our net non-operating income (expenses) for the periods indicated.
Year ended December 31, 2006 2007 (US$ million) Financial income ............................................................................................................... US$327 US$295 Financial expenses............................................................................................................. (1,338) (1,592) Foreign exchange and monetary gains, net....................................................................... 529 2,559 Gain on sale of investments .............................................................................................. 674 777 Non-operating income....................................................................................................... US$192 US$2,039
We had net non-operating revenues of US$2.039 billion in 2007, compared to net non-operating revenues of US$192 million in 2006. This change primarily reflects:
• Higher exchange gains due to the higher average level of net U.S. dollar-denominated liabilities resulting from the Inco acquisition combined with the depreciation of the U.S. dollar.
• A decrease in financial income, due mainly to lower average cash balances.
• An increase in financial expenses, principally due to the increase in average debt resulting from the Inco acquisition. This was largely offset by a gain of US$925 million in derivative transactions that we entered into, including a swap of real -denominated debt into U.S. dollar (gain of US$791 million) and a swap hedging some of our personnel costs from reais into dollars (gain of US$127 million).
• US$777 million gain on sale of investments in 2007, including the sale of our interests in Usiminas (US$456 million gain), Log-In (US$238 million gain) and Lion Ore Mining (US$80 million gain).
Income taxes
In 2007, we recorded net income tax expense of US$3.201 billion, compared to US$1.432 billion in 2006. The effective tax rate on our pretax income was 21% in 2007 and 18.3% in 2006. Our effective tax rate is lower than the statutory rate because (i) income of some non-Brazilian subsidiaries is subject to lower rates of tax, (ii) we are entitled under Brazilian law to deduct the amount of our distributions to shareholders that we classify for tax purposes as interest on shareholders’ equity and (iii) we benefit from tax incentives applicable to our earnings on production in certain regions of Brazil.
Affiliates and joint ventures
Our equity in the results of affiliates and joint ventures and provisions for losses on equity investments resulted in a gain of US$595 million in 2007, compared to a gain of US$710 million in 2006. The following table summarizes the composition of our equity in results of affiliates and joint ventures for the periods indicated.
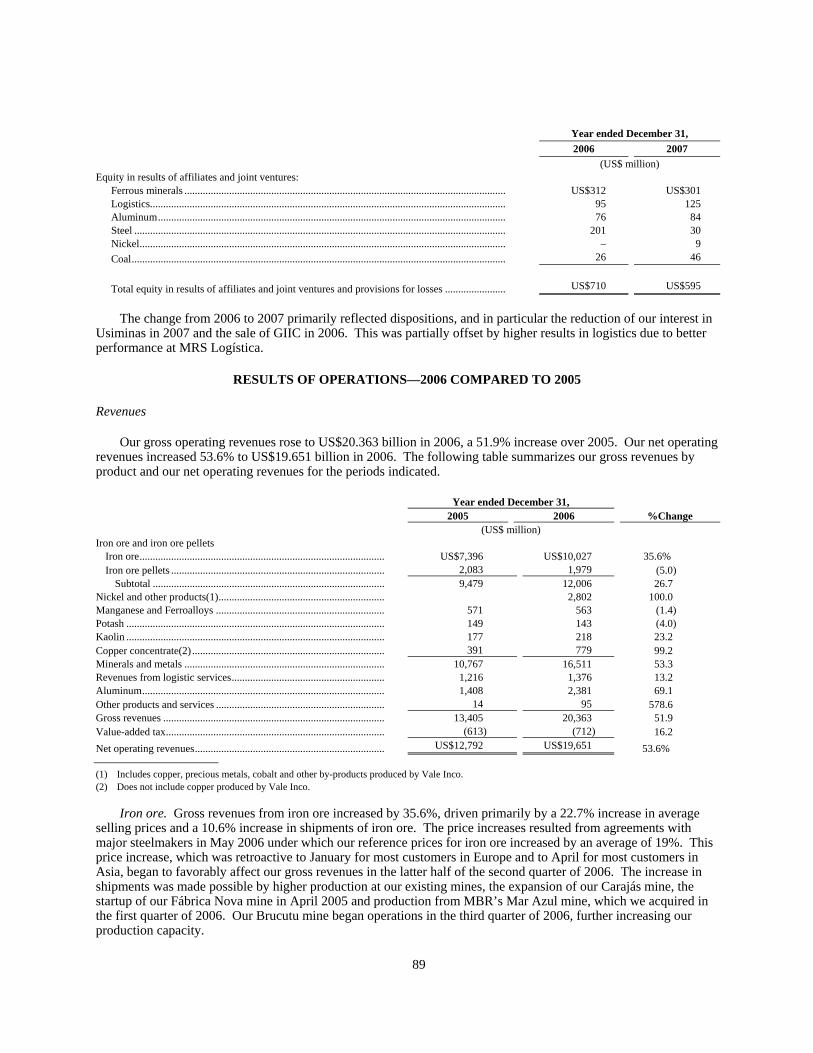
89
Year ended December 31, 2006 2007 (US$ million) Equity in results of affiliates and joint ventures:
Ferrous minerals .......................................................................................................................... US$312 US$301 Logistics....................................................................................................................................... 95 125 Aluminum.................................................................................................................................... 76 84 Steel ............................................................................................................................................. 201 30 Nickel........................................................................................................................................... – 9 Coal.............................................................................................................................................. 26 46 Total equity in results of affiliates and joint ventures and provisions for losses ....................... US$710 US$595
The change from 2006 to 2007 primarily reflected dispositions, and in particular the reduction of our interest in
Usiminas in 2007 and the sale of GIIC in 2006. This was partially offset by higher results in logistics due to better performance at MRS Logística.
RESULTS OF OPERATIONS—2006 COMPARED TO 2005
Revenues
Our gross operating revenues rose to US$20.363 billion in 2006, a 51.9% increase over 2005. Our net operating revenues increased 53.6% to US$19.651 billion in 2006. The following table summarizes our gross revenues by product and our net operating revenues for the periods indicated.
(1) Includes copper, precious metals, cobalt and other by-products produced by Vale Inco. (2) Does not include copper produced by Vale Inco.
Iron ore. Gross revenues from iron ore increased by 35.6%, driven primarily by a 22.7% increase in average selling prices and a 10.6% increase in shipments of iron ore. The price increases resulted from agreements with major steelmakers in May 2006 under which our reference prices for iron ore increased by an average of 19%. This price increase, which was retroactive to January for most customers in Europe and to April for most customers in Asia, began to favorably affect our gross revenues in the latter half of the second quarter of 2006. The increase in shipments was made possible by higher production at our existing mines, the expansion of our Carajás mine, the startup of our Fábrica Nova mine in April 2005 and production from MBR’s Mar Azul mine, which we acquired in the first quarter of 2006. Our Brucutu mine began operations in the third quarter of 2006, further increasing our production capacity.
Year ended December 31, 2005 2006 %Change (US$ million) Iron ore and iron ore pellets
Iron ore............................................................................................. US$7,396 US$10,027 35.6% Iron ore pellets ................................................................................. 2,083 1,979 (5.0)
Subtotal ........................................................................................ 9,479 12,006 26.7 Nickel and other products(1)............................................................... 2,802 100.0 Manganese and Ferroalloys ................................................................ 571 563 (1.4) Potash .................................................................................................. 149 143 (4.0) Kaolin .................................................................................................. 177 218 23.2 Copper concentrate(2) ......................................................................... 391 779 99.2 Minerals and metals ............................................................................ 10,767 16,511 53.3 Revenues from logistic services.......................................................... 1,216 1,376 13.2 Aluminum............................................................................................ 1,408 2,381 69.1 Other products and services ................................................................ 14 95 578.6 Gross revenues .................................................................................... 13,405 20,363 51.9 Value-added tax................................................................................... (613) (712) 16.2 Net operating revenues........................................................................ US$12,792 US$19,651 53.6%
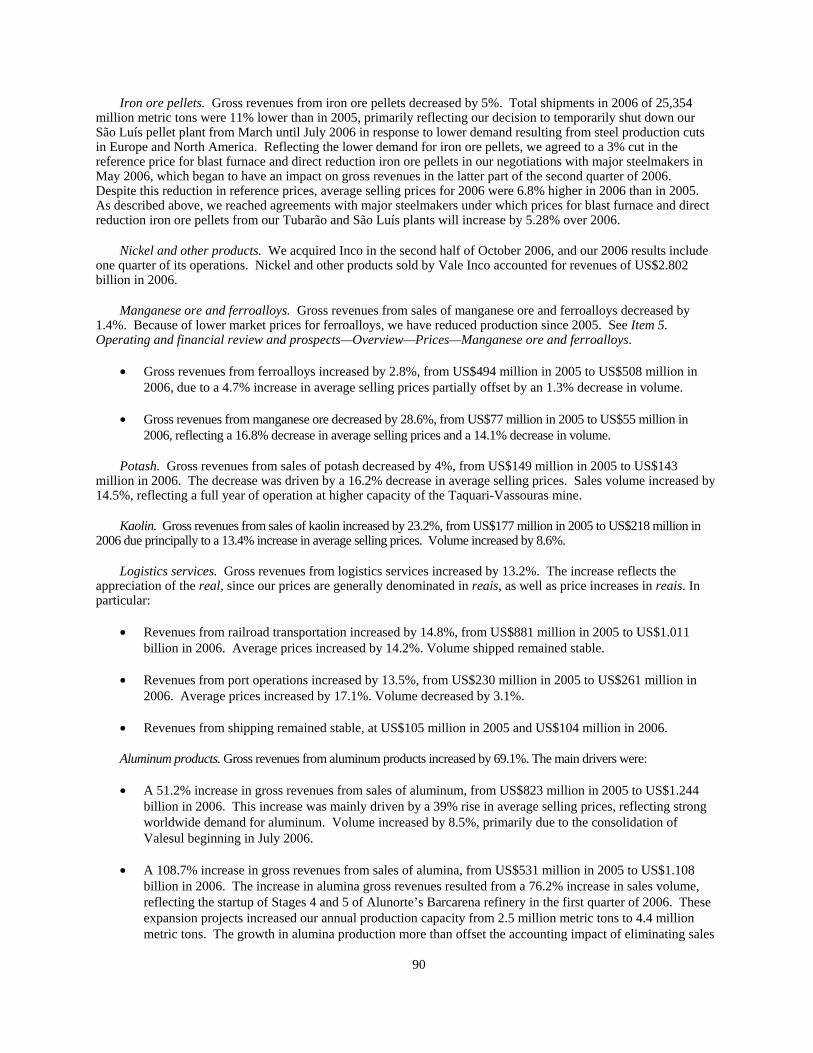
90
Iron ore pellets. Gross revenues from iron ore pellets decreased by 5%. Total shipments in 2006 of 25,354 million metric tons were 11% lower than in 2005, primarily reflecting our decision to temporarily shut down our São Luís pellet plant from March until July 2006 in response to lower demand resulting from steel production cuts in Europe and North America. Reflecting the lower demand for iron ore pellets, we agreed to a 3% cut in the reference price for blast furnace and direct reduction iron ore pellets in our negotiations with major steelmakers in May 2006, which began to have an impact on gross revenues in the latter part of the second quarter of 2006. Despite this reduction in reference prices, average selling prices for 2006 were 6.8% higher in 2006 than in 2005. As described above, we reached agreements with major steelmakers under which prices for blast furnace and direct reduction iron ore pellets from our Tubarão and São Luís plants will increase by 5.28% over 2006.
Nickel and other products. We acquired Inco in the second half of October 2006, and our 2006 results include one quarter of its operations. Nickel and other products sold by Vale Inco accounted for revenues of US$2.802 billion in 2006.
Manganese ore and ferroalloys. Gross revenues from sales of manganese ore and ferroalloys decreased by 1.4%. Because of lower market prices for ferroalloys, we have reduced production since 2005. See Item 5. Operating and financial review and prospects—Overview—Prices—Manganese ore and ferroalloys.
• Gross revenues from ferroalloys increased by 2.8%, from US$494 million in 2005 to US$508 million in 2006, due to a 4.7% increase in average selling prices partially offset by an 1.3% decrease in volume.
• Gross revenues from manganese ore decreased by 28.6%, from US$77 million in 2005 to US$55 million in 2006, reflecting a 16.8% decrease in average selling prices and a 14.1% decrease in volume.
Potash. Gross revenues from sales of potash decreased by 4%, from US$149 million in 2005 to US$143 million in 2006. The decrease was driven by a 16.2% decrease in average selling prices. Sales volume increased by 14.5%, reflecting a full year of operation at higher capacity of the Taquari-Vassouras mine.
Kaolin. Gross revenues from sales of kaolin increased by 23.2%, from US$177 million in 2005 to US$218 million in 2006 due principally to a 13.4% increase in average selling prices. Volume increased by 8.6%.
Logistics services. Gross revenues from logistics services increased by 13.2%. The increase reflects the appreciation of the real, since our prices are generally denominated in reais, as well as price increases in reais. In particular:
• Revenues from railroad transportation increased by 14.8%, from US$881 million in 2005 to US$1.011 billion in 2006. Average prices increased by 14.2%. Volume shipped remained stable.
• Revenues from port operations increased by 13.5%, from US$230 million in 2005 to US$261 million in 2006. Average prices increased by 17.1%. Volume decreased by 3.1%.
• Revenues from shipping remained stable, at US$105 million in 2005 and US$104 million in 2006.
Aluminum products. Gross revenues from aluminum products increased by 69.1%. The main drivers were:
• A 51.2% increase in gross revenues from sales of aluminum, from US$823 million in 2005 to US$1.244 billion in 2006. This increase was mainly driven by a 39% rise in average selling prices, reflecting strong worldwide demand for aluminum. Volume increased by 8.5%, primarily due to the consolidation of Valesul beginning in July 2006.
• A 108.7% increase in gross revenues from sales of alumina, from US$531 million in 2005 to US$1.108 billion in 2006. The increase in alumina gross revenues resulted from a 76.2% increase in sales volume, reflecting the startup of Stages 4 and 5 of Alunorte’s Barcarena refinery in the first quarter of 2006. These expansion projects increased our annual production capacity from 2.5 million metric tons to 4.4 million metric tons. The growth in alumina production more than offset the accounting impact of eliminating sales
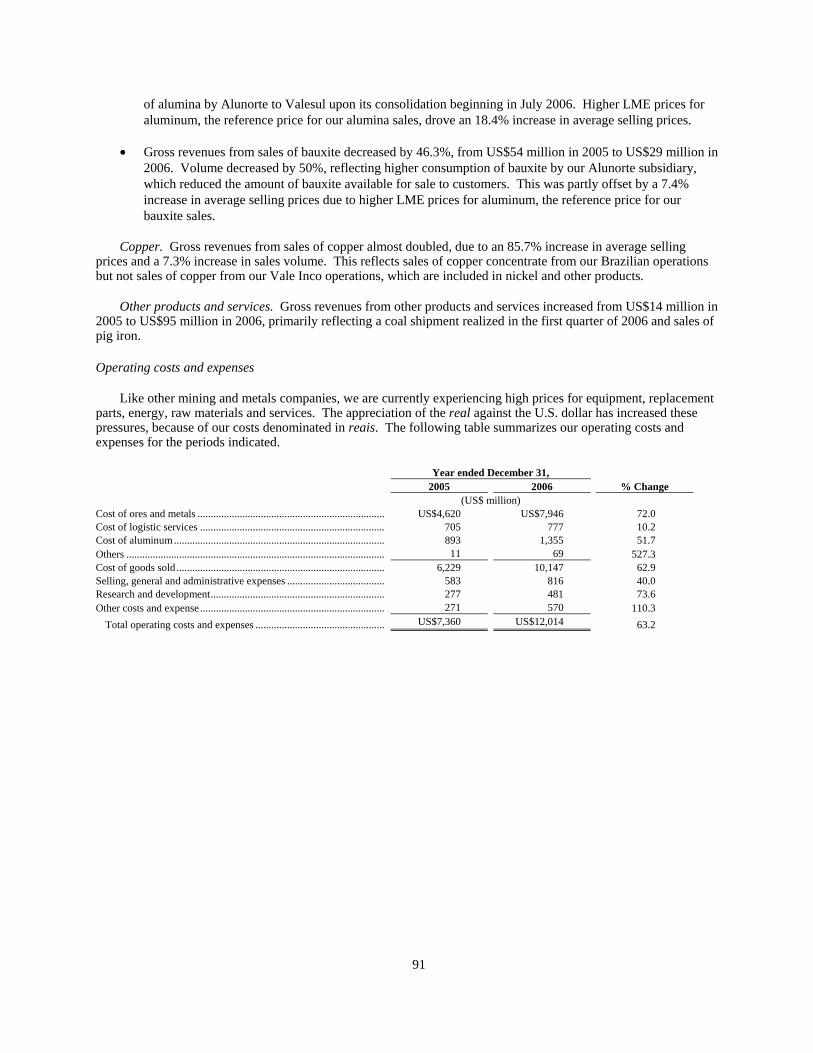
91
of alumina by Alunorte to Valesul upon its consolidation beginning in July 2006. Higher LME prices for aluminum, the reference price for our alumina sales, drove an 18.4% increase in average selling prices.
• Gross revenues from sales of bauxite decreased by 46.3%, from US$54 million in 2005 to US$29 million in 2006. Volume decreased by 50%, reflecting higher consumption of bauxite by our Alunorte subsidiary, which reduced the amount of bauxite available for sale to customers. This was partly offset by a 7.4% increase in average selling prices due to higher LME prices for aluminum, the reference price for our bauxite sales.
Copper. Gross revenues from sales of copper almost doubled, due to an 85.7% increase in average selling prices and a 7.3% increase in sales volume. This reflects sales of copper concentrate from our Brazilian operations but not sales of copper from our Vale Inco operations, which are included in nickel and other products.
Other products and services. Gross revenues from other products and services increased from US$14 million in 2005 to US$95 million in 2006, primarily reflecting a coal shipment realized in the first quarter of 2006 and sales of pig iron.
Operating costs and expenses
Like other mining and metals companies, we are currently experiencing high prices for equipment, replacement parts, energy, raw materials and services. The appreciation of the real against the U.S. dollar has increased these pressures, because of our costs denominated in reais. The following table summarizes our operating costs and expenses for the periods indicated.
Year ended December 31, 2005 2006 % Change (US$ million) Cost of ores and metals ....................................................................... US$4,620 US$7,946 72.0 Cost of logistic services ...................................................................... 705 777 10.2 Cost of aluminum................................................................................ 893 1,355 51.7 Others .................................................................................................. 11 69 527.3 Cost of goods sold ............................................................................... 6,229 10,147 62.9 Selling, general and administrative expenses ..................................... 583 816 40.0 Research and development.................................................................. 277 481 73.6 Other costs and expense ...................................................................... 271 570 110.3
Total operating costs and expenses ................................................. US$7,360 US$12,014 63.2

92
Cost of goods sold
The following table summarizes the components of our cost of goods sold for the periods indicated.
Year ended December, 2006 2005 Total
Attributable to Vale Inco % Change
(US$ million) Outsourced services ....................................................................... US$2,056 132 US$1,483 38.6 Materials costs................................................................................ 1,584 128 1,126 40.7 Energy ............................................................................................
Fuel ............................................................................................. 912 91 630 44.8 Electric energy............................................................................ 623 31 456 36.6 Subtotal ....................................................................................... 1,535 122 1,086 41.3
Acquisition of iron ore and iron ore pellets ................................... 758 – 761 (0.4) Acquisition of other products
Nickel.......................................................................................... 482 482 – – Aluminum................................................................................... 336 – 299 12.4 Other ........................................................................................... 97 32 33 193.9 Subtotal ....................................................................................... 915 514 332 175.6
Personnel ........................................................................................ 917 210 514 78.4 Depreciation and depletion ............................................................ 899 124 585 53.7 Inventory adjustment...................................................................... 946 946 – – Others ............................................................................................. 537 54 342 57.0
Total................................................................................................ US$10,147 US$2,230 US$6,229 62.9%
Our total cost of goods sold increased by 62.9%. This increase resulted primarily from the following factors:
• Impact of Inco acquisition. Vale Inco operations in the fourth quarter of 2006 contributed total cost of goods sold of US$2.230 billion. As described above, US$946 million of this amount relates to purchase accounting adjustments under SFAS 141 and 142 that required us to mark to market the inventories of Inco upon acquisition. The excess of the market price over the production cost of these inventories is included in cost of goods sold when the inventories are sold. We expect to incur a further US$1.062 billion in increased cost of goods sold in 2007 related to the remaining inventories.
• Impact of appreciation of the real. The average value of the real increased 11.8% against the U.S. dollar in 2006 compared to 2005. Because the majority of our costs and expenses are denominated in reais, this led to increased U.S. dollar costs.
• Outsourced services. Outsourced services costs increased by 38.6% in 2006. Of the US$573 million increase, US$132 million was attributable to Vale Inco. The remaining US$441 million increase was driven primarily by the appreciation of the real and higher rail freight costs due to higher iron ore production at our MBR subsidiary, which uses the MRS railway to transport its iron ore to the port. The higher outsourced services costs also reflect increased waste material removal at our mines and higher costs for maintenance services.
• Material costs. Material costs increased by 40.7% in 2006. Of the US$573 million increase, Vale Inco accounted for US$128 million. The remaining US$330 million increase primarily reflected higher volumes and the appreciation of the real against the U.S. dollar.
• Acquisition of iron ore and iron ore pellets. Cost of iron ore and iron ore pellets purchased from other mining companies remained stable, as price increases more than offset declines in metric tons purchased. Iron ore purchased from third-party suppliers in 2006 decreased by 33.8% to 10.2 million metric tons in 2006 compared to 15.4 million metric tons purchased in 2005. We purchased 8.9 million metric tons of iron ore pellets from third-parties in 2006, a decrease of 7.1% compared to 9.7 million metric tons purchased in 2005.

93
• Acquisition of other products. Acquisition of other products increased by US$583 million in 2006, of which US$514 million was attributable to Vale Inco. The remaining US$69 million was driven primarily by higher purchases of bauxite from third parties by Alunorte to supply the expanded operation of Alunorte’s Barcarena alumina refinery. We expect customers’ bauxite purchases to decline following the start-up of the Paragominas mine in 2007.
• Energy costs. Energy costs increased by 41.3% in 2006. Of the US$449 million increase, US$122 million was attributable to Vale Inco. Electricity costs increased by US$167 million, of which US$31 million was attributable to Vale Inco. The remaining increase in electricity costs primarily reflects 31.1% higher electricity prices for aluminum production, driven by the Albras electricity contract, under which a portion of the price is indexed to the LME price for aluminum, and by the consolidation of Valesul, which pays higher prices for its supply of electricity. The volume of electricity consumed also increased by 17.6%. Fuel costs increased by US$282 million, of which Vale Inco accounted for US$91 million. The remaining US$191 million increase was driven by higher production, the appreciation of the real and higher prices.
• Personnel costs. Personnel costs increased by 78.4%. Of the US$403 million increase, US$210 million was attributable to Vale Inco. The remainder of the increase reflects the impact in 2006 of salary increases agreed in July 2005, an increase in the number of our employees as a result of our expansion projects and our consolidation of Valesul, the appreciation of the real against the U.S. dollar, and the payment of a special bonus to employees in August 2006. In July 2006, we agreed on a 3% wage increase that took effect in January 2007.
Selling, general and administrative expenses
Selling, general and administrative expenses increased by 40%. Of the US$233 million increase, US$62 million was attributable to Vale Inco. The remainder of the increase resulted primarily from higher selling expenses due to the increase in sales volume, an annual increase in the salary of administrative employees and the appreciation of the real against the U.S. dollar.
Research and development expenses
Research and development expenses increased by 73.6%. Of the US$204 million increase, US$39 million was attributable to Vale Inco. The remainder of the increase primarily reflects an increase in mineral exploration and project studies in several regions, including South America, Asia, Africa and Australia. The increase also includes US$25 million of expenses relating to the construction of a hydrometallurgical plant for processing copper.
Other costs and expenses
Other costs and expenses more than doubled. The US$299 million increase was primarily attributable to a US$171 million provision for mine closure and other environmental remediation matters, resulting from a comprehensive review.
Operating income by segment
94
The following table provides information concerning our operating income by segment and as a percentage of revenues for the periods indicated.
Year ended December 31, 2005 2006 Segment operating income (loss) Segment operating income (loss)
(US$ million) (% of net operating
revenues) (US$ million) (% of net operating
revenues) Ferrous minerals
Iron ore ................................................. US$4,085 57.0% US$5,168 53.0% Iron ore pellets...................................... 661 33.0 630 33.3 Manganese ore...................................... (11) – (49) – Ferroalloys............................................
......................................................... 83 18.6 3 0.6 Non-ferrous minerals
Nickel and other products .................... – – 411 14.6 Potash ................................................... 44 31.9 28 20.7 Kaolin ................................................... (26) – – – Copper concentrate............................... 146 38.1 464 61.1
Aluminum Alumina ................................................ 37 7.3 294 26.7 Aluminum............................................. 395 48.3 631 51.9 Bauxite.................................................. 5 9.3 – –
Logistics Railroads............................................... 173 23.5 274 32.9 Ports ......................................................
......................................................... 65 33.2 64 29.5 Ships ..................................................... (7) – (6) –
Others ......................................................... (218) – (275) – Total...................................................... US$5,432 42.5% US$7,637 38.9%
Our operating income decreased as a percentage of net operating revenues from 42.5% in 2005 to 38.9% in 2006.
• This decrease was driven primarily by decreases in the margins on our iron ore, manganese, ferroalloys and potash businesses, which, together with the impact of consolidating Inco and its operating margin of 14.6%, more than offset higher margins in our copper, alumina and aluminum businesses.
• The decrease in margins in our iron ore business primarily reflects the impact of the appreciation of the real against the U.S. dollar, higher research and development expenditures, higher depreciation charges due to the expansion of our asset base and higher freight and other outsourced services costs. Together, these factors more than offset the impact of higher average selling prices.
• Revenues and operating margins increased in our copper, alumina and aluminum businesses. In each of these segments, higher prices more than offset the production cost increases described above.
• The significant margin declines in the manganese and ferroalloys segments are due to lower market prices for these products and the higher production costs described above.
• The margin decline in the potash segment is due to the lower potash prices noted above and higher production costs due primarily to the appreciation of the real against the U.S. dollar.
• The operating margin for nickel and other products reflects in part the impact of the purchase accounting adjustments relating to inventories described above.

95
Non-operating income (expenses)
The following table details our net non-operating income (expenses) for the periods indicated.
Year ended December 31, 2005 2006 (US$ million) Financial income ........................................................................................................................ US$123 US$327 Financial expenses...................................................................................................................... (560) (1,338) Foreign exchange and monetary gains (losses)net .................................................................... 299 529 Gain on sale of investments ....................................................................................................... 126 674
Non-operating income (expenses) ............................................................................................. US$(12) US$192
We had net non-operating revenues of US$192 million in 2006, compared to net non-operating expenses of
US$12 million in 2005. This change primarily reflects:
• Higher exchange rate gains on our net U.S. dollar-denominated liabilities caused by the exchange rate variation of Vale Inco’s debt.
• An increase in financial income, due mainly to higher interest rates and higher average cash balances.
• An increase in financial expenses, principally due to a significant increase in average debt incurred in connection with the Inco acquisition.
• A US$674 million gain on sales of investments in 2006, from the sale of our interest in Siderar (US$96 million gain), Usiminas (US$175 million gain), GIIC (US$338 million gain), Nova Era Silicon (US$9 million gain) and Gerdau (US$56 million gain), compared to gains in 2005 related to the sale of the Quebec-Cartier Mining Company (US$126 million gain).
Income taxes
In 2006, we recorded a net income tax expense of US$1.432 billion, compared to US$880 million in 2005. The effective tax rate on our pretax income was 18.3% in 2006 and 16.2% in 2005. Our effective tax rate is lower than the statutory rate because (i)income of some non-Brazilian subsidiaries is subject to lower rates of tax, (ii)we are entitled to deduct the amount of our distributions that we classify for tax purposes as interest on shareholders’ equity and (iii)we benefit from tax incentives applicable to our earnings on production in particular regions of Brazil.
Affiliates and joint ventures
Our equity in the results of affiliates and joint ventures and provisions for losses on equity investments resulted in a gain of US$710 million in 2006, compared to a gain of US$760 million in 2005.
The following table summarizes the composition of our equity in results of affiliates and joint ventures for the periods indicated.
Year ended December 31, 2005 2006 (US$ million)
Equity in results of affiliates and joint ventures: Ferrous minerals ............................................................................................................................. US$435 US$312 Logistics.......................................................................................................................................... 54 95 Aluminum products ........................................................................................................................ 65 76 Steel ................................................................................................................................................ 197 201 Coal................................................................................................................................................. 9 26
Total equity in results of affiliates and joint ventures and provisions for losses ................................ US$760 US$710
96
The change from 2005 to 2006 primarily reflected lower results in ferrous minerals because of the sale of GIIC and higher results in logistics because of better performance at MRS Logistica.
LIQUIDITY AND CAPITAL RESOURCES
Overview
In the ordinary course of business, our principal funding requirements are for capital expenditures, dividend payments and repayment of debt. We have historically met these requirements by using cash generated from operating activities and through borrowings. We believe these sources of funds, together with our cash and cash equivalents on hand, will continue to be adequate to meet our anticipated capital requirements. In 2008, we expect our major cash needs to include repayment of US$1.249 billion of maturing long-term debt, budgeted capital expenditures of US$11.000 billion, and announced minimum dividend payments for 2008 of US$2.500 billion. We expect to meet these cash needs primarily through operating cash flow.
We also regularly review acquisition and investment opportunities, and when suitable opportunities arise we make selected acquisitions and investments to implement our business strategy. We may fund these investments with internally generated funds or with borrowings, supplemented in some cases by dispositions. The acquisition of Inco resulted in a substantial increase in our indebtedness in 2006, and in 2007 we reduced debt, using cash from operations and from asset dispositions, and refinanced to extend our maturity profile. At December 31, 2007, we had US$18.857 billion of long-term debt outstanding, compared with US$21.833 billion at the end of 2006. We prepaid US$4.730 billion of debt during 2007.
Sources of funds
Our principal sources of funds are operating cash flow and borrowings. Our operating activities generated cash flows of US$11.012 billion in 2007. We also generated a total of US$1.042 billion in cash through disposals of businesses and investments in 2007, primarily Log-In and Usiminas.
We believe we are well positioned to make additional borrowings because of our strong cash generation and the favorable maturity profile of our debt, which are reflected in our investment grade rating. We maintained our investment grade rating despite the increase in our debt resulting from the acquisition of Inco, and we are currently rated at BBB (Standard & Poor’s), Baa3 (Moody’s), BBB high (Dominion) and BBB- (Fitch).
At December 31, 2007, we had available committed revolving credit lines totaling US$1.900 billion, of which US$1.150 billion was granted to CVRD International and the balance to Vale Inco. As of December 31, 2007, neither CVRD International nor Vale Inco had drawn any amounts under these facilities, and US$88 million of letters of credit were issued and outstanding pursuant Vale Inco’s facility. In April 2008, we entered into a contract for a committed credit facility with BNDES for R$7.3 billion.
We also raised US$1.880 billion in 2007 by selling notes that will convert to equity upon maturity in 2010. Our wholly-owned subsidiary Vale Capital Limited issued mandatorily convertible notes in two series, both due June 15, 2010. Our total proceeds were US$1.869 billion, net of commissions. The SeriesRIO notes (US$1.296 billion principal amount) are mandatorily convertible into ADSs representing an aggregate maximum of 56,582,040 common shares. The SeriesRIO P notes (US$584 million principal amount) are mandatorily convertible into ADSs representing an aggregate maximum of 30,295,456 preferred class A shares. Both series can convert before maturity under specified circumstances. The conversion rate for both series will depend on the market price of the ADSs on the conversion date.
Uses of funds
Acquisitions
In 2007, we used cash of US$2.926 billion, net of cash acquired, to acquire subsidiaries. The largest components of this amount were for the acquisition of the remaining shares of Vale Inco (US$2.029 billion), the acquisition of Vale Australia (US$645 million), the acquisition of the remaining 18% interest in Ferro Gusa Carajás S.A. (US$20 million), and the acquisition of an additional 6.25% stake of Empreendimentos Brasileiros de
97
Mineração S.A. — EBM (“EBM”) (US$231 million). We also entered into a usufruct agreement giving us the benefit of the remaining 13.75% of EBM’s capital for the next thirty years and paid an initial installment of US$61 million.
Capital expenditures
Capital expenditures amounted to US$6.975 billion in 2007. In 2008, we have budgeted US$11.000 billion for capital expenditures. This amount includes expenditures on projects as well as expenditures for maintenance and exploration. For more information about the specific projects for which we have budgeted funds, see Item 4. Information on the Company—Capital Expenditures.
Dividends
We paid total dividends (including distributions classified for tax purposes as interest on shareholders’ equity) of US$1.875 billion in 2007. The announced minimum dividend amount for 2008 is US$2.500 billion. The first installment of this dividend was approved by our board of directors in the amount of US$1.250 billion and was paid on April 30, 2008. See Item 8. Financial information—Distributions.
Debt
At December 31, 2007, we had an aggregate outstanding debt of US$19.030 billion, consisting of short-term debt of US$1.422 billion (including US$1.249 billion in current portion of long-term debt), and long-term debt (excluding current portion) of US$17.608 billion. At December 31, 2007, US$584 million of our debt was secured by liens on some of our assets. At December 31, 2007, the average debt maturity was 10.7 years, compared with 8.36years in 2006.
Our short-term debt consists primarily of U.S. dollar-denominated trade financing, mainly in the form of export prepayments and export sales advances with foreign and Brazilian financial institutions.
Our major categories of long-term indebtedness are as follows. The amounts given below include the current portion of long-term debt and exclude accrued charges.
• U.S. dollar-denominated loans and financing (US$6.139 billion at December 31, 2007). These loans include export financing lines, import finance from export credit agencies, and loans from commercial banks and multilateral organizations. The largest facility is a pre-export financing facility, secured by future receivables from export sales, that was originally entered into in the amount of US$6.000 billion as part of the refinancing of the Inco acquisition debt. The outstanding amount at December 31, 2007 was US$3.900 billion.
• U.S. dollar-denominated fixed rate notes (US$6.680 billion at December 31, 2007). We have issued several series of fixed rate debt securities through our finance subsidiary Vale Overseas Limited with a Vale guarantee.
• U.S. dollar-denominated loans secured by future export receivables (US$258 million at December 31, 2007). We have a US$550 million securitization program based on existing and future receivables generated by our subsidiary CVRD Overseas Ltd from exports of iron ore and pellets to six of our customers in Europe, Asia and the United States.
• Reais-denominated non-convertible debentures (US$3.340 billion at December 31, 2007). In November 2006, we issued non-convertible debentures in the amount of approximately US$2.600 billion, in two series, with four and seven-year maturities. The first series, approximately US$700 million, matures in 2010 and bears interest at 101.75% of the accumulated variation of the Brazilian CDI (interbank certificate of deposit) interest rate. The second series, approximately US$1.900 billion, matures in 2013 and bears interest at the Brazilian CDI interest rate plus 0.25% per year.

98
• Perpetual notes (US$87 million at December 31, 2007). We have issued perpetual notes that are exchangeable for 48.000 billion preferred shares of MRN. Interest is payable on the notes in an amount equal to dividends paid on the underlying preferred shares.
• Other domestic debt. (US$1.744 billion at December 31, 2007). We have several Brazilian loans, principally from BNDES and commercial banks, most of which are linked to Brazilian floating rates.
Some of our long-term debt instruments contain financial covenants. Our principal covenants require us to maintain certain ratios, such as debt to equity, net debt to EBITDA and interest coverage. We were in full compliance with our financial covenants as of December 31, 2007, and we believe that our existing covenants will not significantly restrict our ability to borrow additional funds as needed to meet our capital requirements.
We believe we will be able to operate within the terms of our financial covenants for the foreseeable future. None of these covenants directly restricts our ability to pay dividends on equity securities at the parent company level.
SHAREHOLDER DEBENTURES
At the time of the first stage of our privatization in 1997, we issued shareholder revenue interests known in Brazil as “debentures participativas” to our then-existing shareholders. The terms of the debentures were established to ensure that our pre-privatization shareholders, including the Brazilian government, would participate alongside us in potential future financial benefits that we derive from exploiting certain mineral resources that were not taken into account in determining the minimum purchase price of our shares in the privatization. In accordance with the debentures deed, holders have the right to receive semiannual payments equal to an agreed percentage of our net revenues (revenues less value-added tax, transport fee and insurance expenses related to the trading of the products) from certain identified mineral resources that we owned at the time of the privatization, to the extent that we exceed defined thresholds of sales volume relating to certain mineral resources, and from the sale of mineral rights that we owned at that time. Our obligation to make payments to the holders will cease when the relevant mineral resources are exhausted. Based on current production levels and estimates for new projects, we began payments relating to copper resources in 2004 and expect to start payments relating to iron ore resources beginning in 2014 for the Northern System and 2019 for the Southeastern system, and payments related to other mineral resources at the end of the current decade.
The total payments made under the shareholder debentures amounted to US$5 million in 2005 and US$6 million in 2006. In 2007 we made total payments under the shareholder debentures in the amount of US$11 million. See Note 19 to our consolidated financial statements for a description of the terms of the debentures.
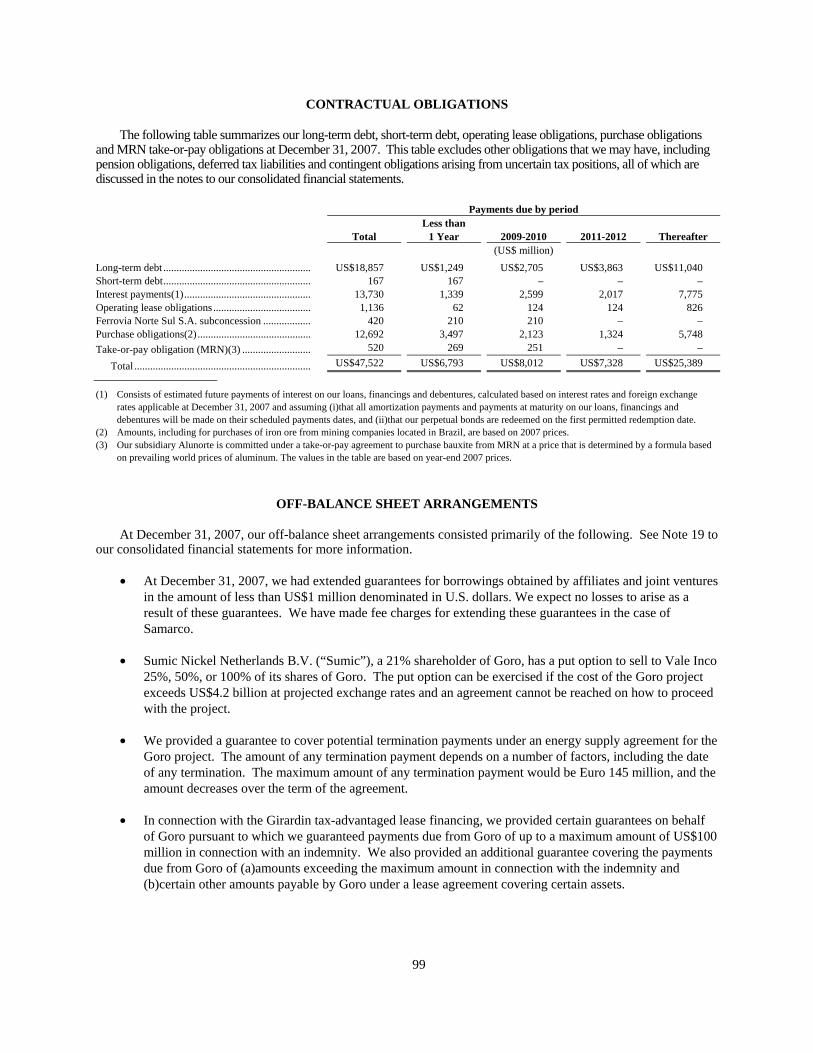
99
CONTRACTUAL OBLIGATIONS
The following table summarizes our long-term debt, short-term debt, operating lease obligations, purchase obligations and MRN take-or-pay obligations at December 31, 2007. This table excludes other obligations that we may have, including pension obligations, deferred tax liabilities and contingent obligations arising from uncertain tax positions, all of which are discussed in the notes to our consolidated financial statements.
Payments due by period Total
Less than 1 Year 2009-2010 2011-2012 Thereafter
(US$ million) Long-term debt ........................................................ US$18,857 US$1,249 US$2,705 US$3,863 US$11,040 Short-term debt........................................................ 167 167 – – – Interest payments(1)................................................ 13,730 1,339 2,599 2,017 7,775 Operating lease obligations..................................... 1,136 62 124 124 826 Ferrovia Norte Sul S.A. subconcession .................. 420 210 210 – – Purchase obligations(2)........................................... 12,692 3,497 2,123 1,324 5,748 Take-or-pay obligation (MRN)(3) .......................... 520 269 251 – –
Total ................................................................... US$47,522 US$6,793 US$8,012 US$7,328 US$25,389
(1) Consists of estimated future payments of interest on our loans, financings and debentures, calculated based on interest rates and foreign exchange rates applicable at December 31, 2007 and assuming (i)that all amortization payments and payments at maturity on our loans, financings and debentures will be made on their scheduled payments dates, and (ii)that our perpetual bonds are redeemed on the first permitted redemption date.
(2) Amounts, including for purchases of iron ore from mining companies located in Brazil, are based on 2007 prices.
(3) Our subsidiary Alunorte is committed under a take-or-pay agreement to purchase bauxite from MRN at a price that is determined by a formula based on prevailing world prices of aluminum. The values in the table are based on year-end 2007 prices.
OFF-BALANCE SHEET ARRANGEMENTS
At December 31, 2007, our off-balance sheet arrangements consisted primarily of the following. See Note 19 to our consolidated financial statements for more information.
• At December 31, 2007, we had extended guarantees for borrowings obtained by affiliates and joint ventures in the amount of less than US$1 million denominated in U.S. dollars. We expect no losses to arise as a result of these guarantees. We have made fee charges for extending these guarantees in the case of Samarco.
• Sumic Nickel Netherlands B.V. (“Sumic”), a 21% shareholder of Goro, has a put option to sell to Vale Inco 25%, 50%, or 100% of its shares of Goro. The put option can be exercised if the cost of the Goro project exceeds US$4.2 billion at projected exchange rates and an agreement cannot be reached on how to proceed with the project.
• We provided a guarantee to cover potential termination payments under an energy supply agreement for the Goro project. The amount of any termination payment depends on a number of factors, including the date of any termination. The maximum amount of any termination payment would be Euro 145 million, and the amount decreases over the term of the agreement.
• In connection with the Girardin tax-advantaged lease financing, we provided certain guarantees on behalf of Goro pursuant to which we guaranteed payments due from Goro of up to a maximum amount of US$100 million in connection with an indemnity. We also provided an additional guarantee covering the payments due from Goro of (a)amounts exceeding the maximum amount in connection with the indemnity and (b)certain other amounts payable by Goro under a lease agreement covering certain assets.

100
CRITICAL ACCOUNTING POLICIES AND ESTIMATES
We believe that the following are our critical accounting policies. We consider an accounting policy to be critical if it is important to our financial condition and results of operations and requires significant judgments and estimates on the part of our management. For a summary of all of our significant accounting policies, see Note 3 to our consolidated financial statements.
Mineral reserves and useful life of mines
We regularly evaluate and update our estimates of proven and probable mineral reserves. Our proven and probable mineral reserves are determined using generally accepted estimation techniques. Calculating our reserves requires us to make assumptions about future conditions that are highly uncertain, including future ore prices, foreign currency exchange rates, inflation rates, mining technology, availability of permits and production costs. Changes in some or all of these assumptions could have a significant impact on our recorded proven and probable reserves.
One of the ways we make our ore reserve estimates is to determine the mine closure dates used in recording the fair value of our asset retirement obligations for environmental and site reclamation costs and the periods over which we amortize our mining assets. Any change in our estimates of total expected future mine or asset lives could have an impact on the depreciation, depletion and amortization charges recorded in our consolidated financial statements under cost of goods sold. Changes in the estimated lives of our mines could also significantly impact our estimates of environmental and site reclamation costs, which are described in greater detail below.
Environmental and site reclamation costs
Expenditures relating to ongoing compliance with environmental regulations are charged against earnings or capitalized as appropriate. These ongoing programs are designed to minimize the environmental impact of our activities.
SFAS 143, “Accounting for Asset Retirement Obligations,” requires that we recognize a liability for the fair value of our estimated asset retirement obligations in the period in which they are incurred, if a reasonable estimate can be made. We consider the accounting estimates related to reclamation and closure costs to be critical accounting estimates because:
• we will not incur most of these costs for a number of years, requiring us to make estimates over a long period;
• reclamation and closure laws and regulations could change in the future or circumstances affecting our operations could change, either of which could result in significant changes to our current plans;
• calculating the fair value of our asset retirement obligations in accordance with SFAS 143 requires us to assign probabilities to projected cash flows, to make long-term assumptions about inflation rates, to determine our credit-adjusted risk-free interest rates and to determine market risk premiums that are appropriate for our operations; and
• given the significance of these factors in the determination of our estimated environmental and site reclamation costs, changes in any or all of these estimates could have a material impact on net income. In particular, given the long periods over which many of these charges are discounted to present value, changes in our assumptions about credit-adjusted risk-free interest rates could have a significant impact on the size of our provision.
Our Environmental Department defines the rules and procedures that should be used to evaluate our asset retirement obligations. The future costs of retirement of all of our mines and sites are reviewed annually, considering the actual stage of exhaustion and the projected exhaustion date of each mine and site. The future estimated retirement costs are discounted to present value using a credit-adjusted risk-free interest rate. At December 31, 2007, we estimated the fair value of our aggregate total asset retirement obligations to be US$975 million.
101
Impairment of long-lived assets and goodwill
We have made acquisitions that included a significant amount of goodwill, as well as fair valuations of intangible and tangible assets. Under generally accepted accounting principles, except for goodwill and indefinite-life intangible assets, all long-lived assets, including these acquired assets, are amortized over their estimated useful lives, and are tested to determine if they are recoverable from operating earnings on an undiscounted cash flow basis over their useful lives whenever events or changes in circumstances indicate that the carrying value may not be recoverable. Factors that could trigger an impairment review include the following:
• significant underperformance relating to expected historical or projected future operating results of entities or business units;
• significant changes in the manner in which we use the acquired assets or our overall business strategy; or
• significant negative industry or economic trends.
When we determine that the carrying value of definite-life intangible assets and long-lived assets may not be recoverable based upon verification of one or more of the above indicators of impairment, we measure any impairment loss based on a projected discounted cash flow method using a discount rate determined by our management to be commensurate with the risk inherent in our current business model.
Beginning in 2002 we ceased to amortize the goodwill balance that existed at December 31, 2001. We are required to assign goodwill to reporting units and test each reporting unit’s goodwill for impairment at least annually, and whenever circumstances indicating that recognized goodwill may not be fully recovered are identified. We perform goodwill impairment tests on September 30 of each year. In the first step of the test we compare a reporting unit’s fair value with its carrying amount to identify any potential goodwill impairment loss. If the carrying amount of a reporting unit exceeds the unit’s fair value, we must carry out the second step of the impairment test to measure the amount, if any, of the unit’s goodwill impairment loss. Goodwill arising from a business combination with a continuing non-controlling interest must be tested for impairment by using an approach that is consistent with the approach that the entity used to measure the non-controlling interest at the acquisition date. For equity investees we determine annually whether there is an other-than-temporary decline in the fair value of the investment.
Purchase price allocation
As of January 3, 2007, we had acquired 100% of Vale Inco. We use the “purchase method” to account for our business combination transactions, which requires that we reasonably determine the fair value of the identifiable assets and liabilities of acquired companies individually, in order to determine the amount of goodwill to be recognized as an intangible asset. Upon the acquisition of assets, which include rights to mine reserves of natural resources, the establishment of values for these assets includes the placing of fair values on purchased reserves, which are classified in the balance sheet as property, plant and equipment.
With respect to Vale Inco, the preliminary purchase price allocations based on the fair values of acquired assets and liabilities were based on management’s preliminary internal valuation estimates. Such allocations were finalized in the second quarter of 2007, based on valuation and other studies, performed by us with the assistance of outside valuation specialists. The differences between the preliminary and final allocations are discussed in Note 7 to our financial statements.
Derivatives and hedging activity
SFAS 133, “Accounting for Derivative Financial Instruments and Hedging Activities,” as amended by SFAS 137, SFAS 138 and SFAS 149, requires that we recognize all derivative financial instruments as either assets or liabilities on our balance sheet and measure such instruments at fair value. Changes in the fair value of derivatives are recorded in each period in current earnings or in other comprehensive income (outside net income), in the latter case depending on whether a transaction is designated as an effective cash flow hedge. Fair value adjustments to our derivatives were recorded in current net income, unless designated as cash flow hedges. We designated certain derivative instruments as cash flow hedges, as permitted under SFAS 133, of which the corresponding unrealized fair value adjustments were recognized directly to shareholders’ equity. In 2007, we recorded to the income
102
statement an unrealized gain of US$917 million in relation to fair value adjustments on derivative instruments and US$29 million to other comprehensive income in relation to derivative instruments designated as cash flow hedges.
Income taxes
In accordance with SFAS 109, “Accounting for Income Taxes,” we recognize deferred tax effects of tax losses carryforward and temporary differences in our consolidated financial statements. We record a valuation allowance when we believe that it is more likely than not that tax assets will not be fully recoverable in the future.
When we prepare our consolidated financial statements, we estimate our income taxes based on regulations in the various jurisdictions where we conduct business. This requires us to estimate our actual current tax exposure and to assess temporary differences that result from deferring treatment of certain items for tax and accounting purposes. These differences result in deferred tax assets and liabilities, which we show on our consolidated balance sheet. We must then assess the likelihood that our deferred tax assets will be recovered from future taxable income. To the extent we believe that recovery is not likely, we establish a valuation allowance. When we establish a valuation allowance or increase this allowance in an accounting period, we record a tax expense in our statement of income. When we reduce the valuation allowance, we record a tax benefit in our statement of income.
Determining our provision for income taxes, our deferred tax assets and liabilities and any valuation allowance to be recorded against our net deferred tax assets requires significant management judgment and estimates and assumptions about matters that are highly uncertain. For each income tax asset, we evaluate the likelihood of whether some portion or all of the asset will not be realized. The valuation allowance made in relation to accumulated tax losses carryforward depends on our assessment of the probability of generation of future taxable profits within the legal entity in which the related deferred tax asset is recorded based on our production and sales plans, selling prices, operating costs, environmental costs, group restructuring plans for subsidiaries and site reclamation costs and planned capital costs.
Effective January 1, 2007, we adopted the provisions of FIN 48, “Accounting for Uncertainty in Income Taxes—an Interpretation of FASB Statement No.109,” which clarifies the accounting for uncertain income tax benefit positions by prescribing a minimum recognition threshold that a tax position is required to meet before being recognized in the financial statements. FIN 48 also provides guidance on the recognition of previously recognized income tax items, measurement, classification, interest and penalties, accounting in interim periods and financial statement disclosure. Under FIN 48, we recognize the tax benefit from an uncertain tax position only if it is more likely than not that the tax position will be sustained upon examination by the taxing authorities, based on the technical merits of the tax position. The amount of the tax benefit recognized in our financial statements from such positions is the largest amount that has a greater than 50% likelihood of being upheld upon final resolution.
Due to our size and the number of tax jurisdictions in which we conduct our global business operations, we are subject to income tax audits on a regular basis. As a result, we have tax reserves allocated to potential tax obligations around the world.
We believe we have sufficiently provided for all audit exposures and assessments. Settlements of these audits or the expiration of the statute of limitations on the assessment of income taxes for any tax year may result in an increase or reduction of future tax positions.
Contingencies
We disclose material contingent liabilities unless the possibility of any loss arising is considered remote, and material contingent assets where the inflow of economic benefits is probable. We discuss our material contingencies in Note 19 to our financial statements.
We account for contingencies in accordance with SFAS 5, “Accounting for Contingencies,” which requires that we record an estimated loss from a loss contingency when information available prior to issuance of our financial statements indicates that it is probable that a future event will confirm that an asset has been impaired or a liability has been incurred at the date of the financial statements, and the amount of the loss can be reasonably estimated. In particular, given the uncertain nature of Brazilian tax legislation, the assessment of potential tax liabilities requires significant management judgment. By their nature contingencies will only be resolved when one or more future
103
events occur or fail to occur — and typically those events will occur a number of years in the future. Assessing such liabilities, particularly in the uncertain Brazilian legal environment, inherently involves the exercise of significant management judgment and estimates of the outcome of future events.
The provision for contingencies at December 31, 2007, totaling US$2.453 billion, consists of provisions of US$519 million, US$311 million, US$1.605 billion and US$18 million for labor, civil, tax and other claims, respectively.
Employee post-retirement benefits
We sponsor a defined benefit pension plan covering some of our retirees. We account for these benefits in accordance with SFAS No.132 — “Employers’ Disclosure about Pensions and Other Postretirement Benefits” and SFAS No.158 — “Employers’ Accounting for Defined Benefit Pension and Other Postretirement Plans,” as amended.
The determination of the amount of our obligations for pension benefits depends on certain actuarial assumptions. These assumptions are described in Note 18 to our consolidated financial statements and include, among others, the expected long-term rate of return on plan assets and increases in salaries. In accordance with U.S. GAAP, actual results that differ from our assumptions and are not a component of net benefit costs for the year are recorded in other comprehensive income (loss).
Item 6. Directors, senior management and employees
BOARD OF DIRECTORS
Overview
Our board of directors, sets general guidelines and policies for our business and monitors the implementation of those guidelines and policies by our executive officers. The board of directors holds regularly scheduled meetings on a monthly basis and holds additional meetings when called by its chairman, vice-chairman or any two directors. Decisions of the board of directors require a quorum of a majority of the directors and are taken by majority vote.
Under the Brazilian Corporation Law, the board of directors must have at least three members. Each director and his or her respective alternate are elected at a general shareholders’ meeting and are subject to removal at any time. Our bylaws state that the board of directors consists of eleven members and eleven alternates. Our employees have the right to appoint one director and an alternate. Under the Brazilian Corporation Law, members of the board of directors must be shareholders of Vale. Members of the board of directors are elected for two-year terms and can be re-elected. Each alternate director serves on behalf of a specific board member. In the absence of the director for whom an alternate director is acting, that alternate director may attend and vote at meetings of the board of directors.
Nine of our 11 current directors and nine of our current alternate directors were appointed to their positions by Valepar, our principal shareholder, pursuant to Valepar’s shareholders’ agreement and the provisions of the Brazilian Corporation Law. For a description of the procedures under which our directors are elected, see Item 10.
Additional information—Memorandum and Articles of Incorporation—Common shares and preferred shares—General. For a description of Valepar’s shareholders’ agreement, see Item 7. Major shareholders and related party transactions—Major shareholders—Principal shareholder.
Directors of Vale
The following table lists the current members of the board of directors. All of our directors, except for Luciano Galvão Coutinho, were elected or re-elected, as the case may be, at our annual shareholders’ meeting in April 2007. Mr.Luciano Galvão Coutinho was elected in August 2007, and replaced Mr.Demian Fiocca, who was elected at the April shareholders’ meeting, but did not assume office. The terms of all of our directors will expire in 2009. The alternate position corresponding to Mr.Francisco Augusto da Costa e Silva is vacant.
Year first elected Position Age

104
Sérgio Ricardo Silva Rosa(1)......................................... 2003 Chairman 48 Mário da Silveira Teixeira Júnior(1).............................. 2003 Vice-Chairman 62 José Ricardo Sasseron(1) ............................................... 2007 Director 52 Jorge Luiz Pacheco(1).................................................... 2003 Director 53 Sandro Kohler Marcondes(1)......................................... 2007 Director 44 Renato da Cruz Gomes(1).............................................. 2001 Director 55 Masami Iijima(2)............................................................ 2008 Director 57 Oscar Augusto de Camargo Filho(1) ............................. 2003 Director 70 Luciano Galvão Coutinho(1) ......................................... 2007 Director 61 João Batista Cavaglieri(4) .............................................. 2007 Director 52 Francisco Augusto da Costa e Silva(3).......................... 2005 Director 59
(1) Appointed by Valepar and approved at the shareholders’ meeting. (2) Nominated by the board of directors in April 2008 to substitute Hiroshi Tada, who resigned in March 2008. The nomination of Mr.Iijima will be
confirmed by shareholders in the first general shareholders’ meeting following the annual shareholders’ meeting held on April 29, 2008. (3) Nominated by Vale’s non-controlling shareholders in 2005 and reappointed in 2007. (4) Appointed by our employees and approved at the shareholders’ meeting.
The following table lists the alternate members of the board of directors.
Year first elected Position Age Sérgio Ricardo Lopes de Farias(1) ................................ 2005 Alternate Director 43 Luiz Carlos de Freitas(1)................................................ 2007 Alternate Director 55 Rita de Cássia Paz Andrade Robles(1) .......................... 2005 Alternate Director 41 Luiz Mariano de Campos(1) .......................................... 2007 Alternate Director 66 José Mauro Guahyba de Almeida(1) ............................. 2005 Alternate Director 63 João Moisés de Oliveira(1) ............................................ 2000 Alternate Director 63 Hidehiro Takahashi(1) ................................................... 2005 Alternate Director 52 Wanderlei Viçoso Fagundes(1)...................................... 2003 Alternate Director 62 Caio Marcelo de Medeiros Melo(1)............................... 2007 Alternate Director 35 Paulo Soares de Souza(2)............................................... 2007 Alternate Director 44
(1) Appointed by Valepar and approved at the shareholders’ meeting. (2) Appointed by our employees and approved at the shareholders’ meeting.
Below is a summary of the business experience, areas of expertise, and principal outside business interests of our current directors.
Sérgio Ricardo Silva Rosa. Mr.Rosa joined our board of directors in April 2003 and was designated as Chairman in May 2003. Mr.Rosa is currently the chief executive officer of PREVI — Caixa de Previdência dos Funcionários do Banco do Brasil, or Previ, where he has been an executive officer since 2000. He is also a director of Valepar and chief executive officer of Litel Participações S.A. Mr.Rosa has been a director of Brasil Telecom Participações since December 2000, and of Sauípe S.A. since May 2001. Prior to joining Previ, Mr.Rosa served as President of the Confederação Nacional dos Bancários from June 1994 to May 2000. From January 1995 to December 1996, Mr.Rosa was an alderman of the municipality of São Paulo. He received his degree in journalism from Universidade de São Paulo.
Mário da Silveira Teixeira Júnior. Mr.Teixeira joined our board of directors in May 2003. In July 1971, Mr.Teixeira joined Bradesco S.A. Corretora de Títulos e Valores Mobiliários, where he served as an executive officer from March 1983 to January 1984, when he was appointed as head department officer of Banco Bradesco S.A. In 1992 he became managing officer, in 1998 vice-president and from March 1999 until July 2001 he was a member of the board of directors. From July 2001 to March 2002, Mr.Teixeira was CEO of Bradespar and, in March 2002, he returned to the board of directors of Banco Bradesco S.A. In addition, he is a director of Valepar, VBC Participações S.A., VBC Energia S.A., Companhia Paulista de Força e Luz — CPFL, CPFL Energia S.A., CPFL Geração de Energia S.A., Companhia Piratininga de Força e Luz, Vice-chairman of the board of directors of Banco Bradesco S.A., non-voting member of the Managing Board of Banco Espírito Santo S.A., located in Lisbon, Portugal, and Vice-chairman of the board of directors of BES Investimento do Brasil S.A. — Banco de Investimento. He also served as Vice-President of ANBID — Associação Nacional dos Bancos de Investimento, member of the Management Board of ABRASCA — Associação Brasileira das Companhias Abertas, and director of Companhia Siderúrgica Nacional — CSN, Latasa

105
S.A., Globo Cabo S.A., São Paulo Alpargatas S.A. and Tigre S.A. Tubos e Conexões. Mr.Teixeira received a degree in civil engineering and business administration from Mackenzie Presbyterian University, São Paulo.
José Ricardo Sasseron. Mr.Sasseron joined our board of directors in April 2007. Mr. Sasseron began his career in 1980 at Banco do Brasil. From 1996 to 1998, he was chairman of the fiscal council of Previ. In 2001, he was a member of the Conselho de Gestão e Previdência Complementar (CGPC)and was president of the Associação Nacional dos Participantes de Fundo de Pensão (ANAPAR). From 2005 to 2007, he was chairman of the board of directors of Sauípe S.A., and in 2004 he returned to Previ, where he was a member of the Conselho Deliberativo until 2006. Mr.Sasseron is currently an officer of Previ. He received his bachelor’s degree in history from the Universidade de São Paulo.
Jorge Luiz Pacheco. Mr.Pacheco joined our board of directors in April 2003. Mr.Pacheco has been manager of strategic investments at Previ since December 2000, and prior to this time worked at Banco do Brasil S.A. since 1973. He has also served as a director of Valepar and a director of Litel, and has held an officer position in the fiscal council of Companhia Siderúrgica Belgo-Mineira. He received his degree in economics from Faculdade de Ciências Econômicas — FCPE — Cândido Mendes/RJ, and post-graduate degrees in finance and business management from IBMEC/RJ.
Sandro Kohler Marcondes. Mr.Marcondes joined our board of directors in April 2007. He is currently an officer of Banco do Brasil, where he has worked in various capacities both in Brazil and abroad since 1982. Since 2005, he has been an officer of BB Leasing, Banco do Brasil Securities in New York, BB Securities in London and BB Tur. Mr.Marcondes received his bachelor’s degree in business administration from the Universidade Estadual de Guarapuava and a master’s degree from the Fundação Getulio Vargas in São Paulo.
Renato da Cruz Gomes. Mr.Gomes joined our board of directors in April 2001. Mr.Gomes has been an executive officer of Bradespar S.A. since 2000. From 1976 through 2000, Mr.Gomes held a variety of positions within BNDES and has participated on the boards of directors of many companies, in the last 15years, namely Aracruz, Iochpe Maxíon, Bahia Sul, Globo Cabo and Latasa. He was also a member of the advisory board of Fator Sinergia — Fundo de Investimento de Valores Mobiliários em Ações and the investment committee of Bradesco Templeton Value and Liquidity Fund. Mr.Gomes has been an executive officer of Valepar since April 2001 and is a member of Valepar’s board of directors. He received his degree in engineering from Universidade Federal do Estado do Rio de Janeiro — UFRJ, and his post-graduate degree in management development from SDE.
Masami Iijima. Mr.Iijima joined our board of directors in April 2008. Since April 1974, Mr.Iijima has served in a variety of positions at Mitsui & Co. UK Plc. and Mitsui & Co. Ltd., where he is currently the Executive Managing Officer. Mr.Iijima received a degree in business administration from Yokohoma National University, in Japan.
Oscar Augusto de Camargo Filho. Mr.Camargo Filho joined our board of directors in October 2003. He is currently a partner of CWA Consultoria Empresarial. From 1999 to 2003, Mr.Camargo Filho served as chairman of the board of directors of MRS Logística. From 1973 to 2003, he held various positions with CAEMI, including CEO and member of its board of directors. From 1963 until 1973, he held a variety of positions within Motores Perkins S.A., including commercial officer and sales and services manager. He received his law degree from Faculdade de Direito at the Universidade de São Paulo.
João Batista Cavaglieri. Mr.Cavaglieri joined the board of directors in April 2007. Since 1990, Mr.Cavaglieri has been a union leader, and in 1996 he became president of the Espírito Santo and Minas Gerais Railway Employees Union, which represents the employees living in Vitória and along Estrada de Ferro Vitória-Minas (EFVM).
Francisco Augusto da Costa e Silva. Mr.Costa e Silva joined our board of directors in April 2005. He is also a partner of Bocater, Camargo, Costa e Silva — Advogados Associados, a law firm in Rio de Janeiro. Mr.Costa e Silva also serves as a director of Banco do Brasil S.A., Comitê de Ética de Associação dos Analistas e Profissionais de Investimento do Mercado de Capitais (APIMEC), and the development committee of Pontifícia Universidade Católica do Rio de Janeiro (PUC/RJ). He started his career at Banco Nacional do Desenvolvimento Econômico e Social — BNDES, where he held a variety of positions, including executive officer. Previously, he served on the board of directors of several companies and entities namely Solpart Participações S.A., Aracruz Celulose S.A., Pisa Papel de Imprensa S.A., Fundação de Assistência e Previdência Social do BNDES — FAPES and Rio de Janeiro Stock Exchange — BVRJ. Mr.Costa e Silva also served as President of the CVM and of the Council of Securities Regulators of the Americas — COSRA, joined Comissão da Moeda e do Crédito — COMOC and the Supplemental
106
Pension Plan Council and served on the executive committee of the International Organization of Securities Commissions - IOSCO. Mr.Costa e Silva received his law degree from Universidade do Estado da Guanabara, currently Universidade do Estado do Rio de Janeiro — UERJ, and his MBA degree from COPPEAD, at Universidade Federal do Rio de Janeiro — UFRJ.
Luciano Galvão Coutinho. Mr.Coutinho joined our board of directors in 2007. He is also the president of BNDES. He holds a Ph.D. in economics from Cornell University and is an invited professor at the University of Campinas. Specialist in international and industrial economics, he has written and edited several books and articles, which have been published in Brazil and abroad. In 1994, Mr.Coutinho coordinated a Study on the Competitiveness of Brazilian Industry, which entailed an extensive mapping of the Brazilian industrial sector by almost one hundred specialists. He was executive secretary of the Ministry of Science and Technology from 1985 to 1988, where he participated in the restructuring of the Ministry and in the design of policies relating to complex areas such as biotechnology, information technology, chemistry, mechanics and new materials. Born in Pernambuco, Mr.Coutinho holds an undergraduate degree in economics from the University of São Paulo, where he received the award Gastão Vidigal for best economics student. He holds a masters degree in economics from the Economic Research Institute of the University of São Paulo. Mr.Coutinho has been a visiting professor at the University of São Paulo, the University of Paris XIII, the University of Texas and the Ortega y Gasset Institute. Before assuming the presidency of BNDES, Mr.Coutinho was a partner of LCA Consultores, where he provided expert advice on antitrust, international trade and economics.
EXECUTIVE OFFICERS
Overview
The executive officers are our legal representatives and are responsible for day-to-day operations and the implementation of the general policies and guidelines set forth by the board of directors. Our bylaws provide for a minimum of six and a maximum of eleven executive officers. The board of directors appoints executive officers for two-year terms and may remove them at any time. According to the Brazilian Corporation Law, executive officers must be Brazilian residents. The executive officers hold regularly scheduled meetings on a weekly basis and hold additional meetings when called by any executive officer.
Executive officers
The following table lists our current executive officers. The term of each of our executive officers expires in 2009.
Year of
appointment Position Age
Roger Agnelli .............................................. 2001 Chief Executive Officer 49 Fabio de Oliveira Barbosa........................... 2002 Chief Financial Officer 47 José Carlos Martins ..................................... 2004 Executive Officer (Ferrous Minerals) 58
Murilo de Oliveira Ferreira ......................... 2005 Executive Officer
(Nickel, Marketing & Sales of Copper 54
Eduardo de Salles Bartolomeo.................... 2006 Aluminum)
Executive Officer (Logistics) 44
Carla Grasso ................................................ 2001 Executive Officer
(Human Resources & Corporate Services) 46
Tito Botelho Martins ................................... 2006 Executive Officer
(Non Ferrous Minerals & Energy) 45 Demian Fiocca............................................. 2007 Executive Officer (Management & Sustainability) 39
We have summarized below the experience, areas of expertise, and principal outside business interests of our current executive officers.
Roger Agnelli. Mr.Agnelli was appointed CEO and president of Vale in July 2001. Prior to his appointment, he was the chairman of Vale’s board of directors from May 2000 until July 2001. Mr.Agnelli developed his professional career at the Bradesco financial group, the largest bank in Brazil, from 1981 to 2001, where he became executive director of Bank Bradesco in 1998, remaining in that office until 2000. Due to his activities in the areas of investment, mergers & acquisitions and asset management, he was director of UGB and Vice-President of ANBID — Brazil’s National Association of Investment Banks. Mr.Agnelli was also President and CEO of Bradesco from March 2000 to July 2001
107
and a member of the board of directors of several major companies in Brazil and abroad, such as Companhia Paulista de Força e Luz, Companhia Siderúrgica Nacional (CSN), Latas de Alumínio-LATASA, VBC Energia, Brasmotor, Mahle Metal Leve, Rio Grande Energia, Suzano Petroquimica, Serra da Mesa Energia, Duke Energy and of PETROBRAS. From 2003 until 2007, he was a member of the Economic and Social Development Council (CDES), an advisory body of the President of Brazil. He is presently a member of the International Investment Council, formed to advise the President of South Africa, Dr.Thabo Mbeki, and of the International Advisory Investment Council to the President of the Republic of Mozambique, Dr. Armando Guebuza. Mr.Roger Agnelli also is the vice-president of the Center of Industries of the States of Rio de Janeiro, a member of the board of directors of Asea BrownBoveri (ABB)and of Spectra Energy and member of the International Advisory Committee of New York Exchange (NYSE). Mr.Agnelli has a degree in economics from the Fundação Armando Álvares Penteado, in São Paulo, Brazil.
Fabio de Oliveira Barbosa. Mr.Barbosa was appointed as our chief financial officer and investor relations director in May 2002. Prior to that, Mr.Barbosa served as a member of our board of directors from April 2000 to March 2002. Prior to joining us, Mr.Barbosa has served as secretary of the National Treasury at the Ministry of Finance since July 1999, after having held the position of assistant secretary in the previous years. From 1992 to 1995, he served as advisor to the executive board of the World Bank, in Washington D.C. At the Ministry of the Economic and Finance he was Deputy and Head of the Fiscal Policy Unit from 1990 to 1992. He was an Economic Advisor and head of the Economics Analysis Unit, both at the Ministry of Planning, from 1988 to 1990. Mr.Barbosa held a variety positions at the Ministry of Industry and Commerce, the Paraná State Development Institute, the Ministry of Labor and the Institute for applied Economic Research (IPEA). He was also the chairman of the Board of Director of CAEMI, Banco do Estado de São Paulo S/A, and also a Board Member of Banco do Brasil S/A, Caixa Econômica Federal, Companhia Siderúrgica de Tubarão and Telecomunicações de São Paulo (TELESP). He holds a degree in Economics from the Federal University in the State of Minas Gerais (UFMG) and a Master degree (A.b.D.) in Economics from the Brasilia University (UNB). He attended several educational programs at INSEAD, IMD, MIT and attended a specialized course in Financial Programming and Policy at the International Monetary Fund.
José Carlos Martins. Mr.Martins was appointed as an executive officer of our ferrous minerals division in April 2005, and he was originally appointed as an executive officer of holdings, energy and business development in April 2004. He has over 30years of experience in the metals industry. He was an officer and president of Aços Villares from 1986 to 1996 and chief managing officer of the steel area at CSN, from 1997 to 1999. In 1999, Mr.Martins became President of Latasa, one of the largest aluminum can producers in Latin America. Upon the purchase of Latasa by Rexam, a United Kingdom company, in 2003, he became president and CEO of Rexam’s South American beverage can division, Rexam Beverage Can South America. Mr.Martins has a B.A. degree in Economics from Pontifícia Universidade Católica de São Paulo.
Murilo de Oliveira Ferreira. Mr.Ferreira was appointed Vale Inco’s President and Chief Executive Officer in January 2007 and continues to serve as an executive officer of Vale. He oversees the Company’s nickel business, as well as marketing and sales of copper and aluminum products. He previously served as an executive officer of our holdings, energy and business development areas. He joined us in 1977 and has vast experience in several areas of Vale, particularly aluminum and ferroalloys. In 1998 he was appointed executive officer of commerce and finance at Vale do Rio Doce Alumínio S.A. — ALUVALE, a holding company of Vale that was merged into Vale in December 2003. Mr.Ferreira was the CEO of Alumínio Brasileiro S.A.- ALBRAS Aside from being the Director of the Department of Aluminum since December 2003, Mr.Ferreira is also a member of the board of directors of MRN — Mineração Rio do Norte S.A., Valesul Alumínio S.A. and Alumina do Norte do Brasil S.A.—ALUNORTE. Mr.Ferreira has a B.A. degree from Escola de Administração de Empresas, Fundação Getulio Vargas (FGV), and an MBA from EBAP-FGV.
Eduardo de Salles Bartolomeo. Mr.Bartolomeo was appointed as an executive officer of our logistics division in December 2006. Previously, Mr.Bartolomeo served as logistics operations department officer from January 2004 to July 2006. Thereafter, Mr.Bartolomeo worked as Chief Executive Officer of PETROFLEX from August to December 2006. He started his career at COSIPA - Cia. Siderúrgica Paulista — as a trainee in 1988 and was promoted to head officer of the slab conditioning and conversion department, in 1989, where he stayed until1991. From 1994 to 2003, Mr.Bartolomeo worked for AMBEV — Cia. De Bebidas das Américas, where he held a variety of positions, including regional plant officer. Mr.Bartolomeo obtained a metallurgical engineering degree from the Universidade Federal Fluminense — UFF and an MBA from the Catholic University of Leuven, Belgium.
108
Carla Grasso. Ms.Grasso was appointed as an executive officer of the human resources and corporate services area in October 2001. From December 1997 to October 2001, Ms.Grasso served as the personnel, management and IT officer to Vale’s Corporate Centre. Before joining Vale, she acted as secretary of the Brazilian supplementary social security office, from January 1994 to November 1997; as advisor to the Ministry of Social Security, from December 1992 to December 1993; as deputy coordinator of fiscal policy at the Ministry of Finance, from October to December 1992; as finance advisor and coordinator of the Macroeconomics and Social areas of the Brazilian Presidency office, from March 1990 to October 1992; as advisor to the Ministry of Planning, from November 1988 to March 1990; and as advisor to the Presidency of Sebrae — Serviço Brasileiro de Apoio à Pequena e Média Empresa, from January to November 1988. In 1997, she was appointed as an executive officer of Fundação Vale do Rio Doce de Habitação e Desenvolvimento Social. Ms.Grasso has both a B.A. degree in Economics and an M.A. in Economics from UnB.
Tito Botelho Martins. Mr.Martins was appointed as Vale’s executive officer for corporate affairs and energy in April 2006 and for non-ferrous minerals and energy in May 2008, where he had already served as the Managing Director of the Corporate Finance Department from August 1999 to September 2003. Previously, from 1985 to 1999, he held different positions in Vale’s financial areas. Mr.Martins was also the CEO of CAEMI Mining and Metallurgy Corp. and CEO and chairman of MBR Minerações Brasileiras Reunidas from 2003 to 2006. As a result of his expertise in the fields of administration and finance, Mr.Martins became a member of the board of directors of several corporations both in Brazil and abroad. Among them, it is worth mentioning Vale Foundation, FCA Railways, Samarco Mining Co., Ferroban Railways, Açominas Steel Co., Gulf Industrial Investment Company (GIIC)in Bahrain, Itabrasco and Hispanobras. Mr.Martins holds a Bachelor’s degree in Economics from the Federal University of Minas Gerais (UFMG)and a Master’s degree in Management from the Federal University of Rio de Janeiro (IEAD). He has attended other executive education programs at INSEAD (France) and at the Kellogg School of Management of the Northwestern University (USA).
Demian Fiocca. Mr.Fiocca was appointed Executive Officer of Information Technology and Management of Vale in August 2007 and for management and sustainability in May 2008. He received his undergraduate and masters degrees in economics from the University of São Paulo and completed an executive training program through IESE (Instituto de Estudios Superiores) at Harvard. Mr.Fiocca was president of BNDES from April 2006 to April 2007 and was vice-president from December 2004 to March 2006, during which time he was primarily responsible for information technology and security, infrastructure and basic inputs. Mr.Fiocca was the head of the economics committee of the Ministry of Planning, Budget and Management in 2004 and the head of the Division of International Affairs in 2003. Between 2000 and 2003, he was head of economics at Grupo Telefônica and a member of the committee responsible for its economic strategy in Brazil. In 2003, he became the advisor to the president of Telefônica in his role as advisor to the Conselho de Desenvolvimento Econômico e Social. As chief economist of HSBC Bank in Brazil from 1998 to 2000, Mr.Fiocca managed the economic department and was responsible for the analysis of economies and markets as well as the publication of the bank’s bulletins on economics research. Mr.Fiocca is the author of A Oferta de Moeda na Macroeconomia Keynesiana (“The Money Supply in Keynesian Macroeconomics”) and of several other articles on economics. From 1994 to 1998, Mr.Fiocca was a writer and editor of Folha de São Paulo, for which he authored a weekly column in the “Money” section for two years. He carried out research activities at the Institute for Economic, Social and Political Studies (Instituto de Estudos Econômicos, Sociais e Políticos) of São Paulo between 1992 and 1994, including the coordination of a study commissioned by the Inter-American Development Bank on the process of regional integration in Mercosur. Mr.Fiocca represented BNDES as member of the Board of Director’s of Valepar from 2005 to April 2007.
FISCAL COUNCIL
Under the Brazilian Corporation Law, corporations may have a fiscal council, a corporate body whose members are elected by shareholders and are independent of our management and external auditors. The primary responsibility of the fiscal council under the Brazilian Corporation Law is to monitor management’s activities and review the financial statements, reporting its findings to the shareholders. We have established a permanent fiscal council, which may have from three to five members. In addition, Vale’s bylaws have empowered our fiscal council to take responsibility for additional matters as described below.
In compliance with the listed company audit committee rules of the NYSE and the SEC, effective July 31, 2005, we have designated and empowered our fiscal council to perform the role of the audit committee in reliance on the exemption set forth in Exchange Act Rule10A-3(c)(3). This measure was undertaken pursuant to an amendment to our bylaws approved by the shareholders on July 19, 2005. Our board of directors has determined that Mr.Aníbal Moreira dos Santos is a financial expert.
109
Under our bylaws, our fiscal council is responsible for establishing procedures for the receipt, retention and treatment of any complaints related to accounting, controls and audit issues, as well as procedures for the confidential, anonymous submission of concerns regarding such matters; recommending and assisting our board of directors in the appointment, establishment of compensation and dismissal of the independent auditors; pre-approving the services to be rendered by our independent auditors; and overseeing the work performed by the external auditors, with powers to suspend the payment of compensation to the independent auditors and to resolve disagreements between management and the auditors regarding financial reporting.
The members of our fiscal council must meet applicable eligibility requirements under the Brazilian Corporation Law. A member of our fiscal council cannot (i)hold office as a member of the board of directors, fiscal council or advisory committee of any company that competes with Vale or otherwise has conflicting interests with Vale, unless compliance with this requirement is expressly waived by a decision taken by the shareholders in a shareholders’ meeting, (ii)be an employee or member of the management of Vale or its subsidiaries and affiliates, or (iii)be a spouse or relative within the third degree by affinity or consanguinity of an officer or director of Vale.
On April 29, 2008, the shareholders elected the current members of the fiscal council and their respective alternates. The members of the fiscal council are elected for one-year terms. Holders of preferred class A shares, including the golden shares, may elect one member of the fiscal council and the respective alternate. Minority holders of common shares comprising at least 10% of the common shares outstanding may also elect one member of the fiscal council and the respective alternate. The terms of the members of the fiscal council expire at the next annual shareholders’ meeting following their election.
The following table lists the current members of the fiscal council.
First year of appointment
Bernard Appy(1) .......................................................................................................................... 2006 Antônio José Figueiredo Ferreira(2) ............................................................................................ 2008 Marcelo Amaral Moraes(2).......................................................................................................... 2004 Aníbal Moreira dos Santos(2) ...................................................................................................... 2005
(1) Appointed by the preferred shareholders. (2) Appointed by Valepar.
The following table lists the alternate members of the fiscal council.
First year of appointment
Marcus Pereira Aucélio(1) ........................................................................................................... 2008 Marcos Coimbra(2) ...................................................................................................................... 2006 Oswaldo Mário Pêgo de Amorim Azevedo(2) ............................................................................ 2004 Vacant........................................................................................................................................... –
(1) Appointed by the preferred shareholders. (2) Appointed by Valepar.
We have summarized below the experience, areas of expertise, and principal outside business interests of the current members of our fiscal council.
Bernard Appy. Mr.Appy was elected as a member of the fiscal council of Vale in April 2006. Since April 2006 he holds the office of Deputy Minister of the Ministry of Finance of Brazil, which he previously held from January 2003 to May 2005. From May 2005 to March 2006, he held the position of Secretary for Economic Policies at the Ministry of Finance of Brazil. Since 1997, Mr.Appy is a member of faculty of the Economics Department of the School of Business, Economics and Accounting of Pontifícia Universidade Católica de São Paulo — PUC-SP. From 1995 to 2002, he was a partner of LCA Consultores Ltda., a consulting firm in economics. Mr.Appy received a B.A. in Economics from the Universidade de São Paulo — USP, and concluded M.A. classes in Economics at Universidade Estadual de Campinas -UNICAMP.
Antônio José de Figueiredo Ferreira. Mr.Ferreira was elected as a member of Vale’s fiscal council in April 2008. From July 2005 until April 2008, he was chairman of Vale’s Accounting Committee, and from May 2005
110
until June 2005, he was chairman of Vale’s Audit Committee. Mr. Ferreira worked at Banco do Brasil for 32years, where he held positions in the Audit and Information Technology areas. Thereafter, from 1996 until May 2007, Mr.Ferreira acted as Internal Audit Chief of Caixa de Previdência dos Funcionários do Banco do Brasil — PREVI. Mr. Ferreira received a B.A. in Mechanics Engineering from the Universidade de São Paulo (“USP”), and in Law from the Universidade Federal do Rio de Janeiro (“UFRJ”). He also concluded an MBA in Internal Audit at Universidade de São Paulo (“USP”) and in Finance and Corporate Law at Fundação Getulio Vargas do Rio de Janeiro (“FGV-Rio”). Mr.Ferreira has also concluded an MBA in Management and Private Pension Programs from the Wharton School of the University of Pennsylvania.
Marcelo Amaral Moraes. Since 2004, Mr.Moraes has served as a member of the fiscal council of Vale. He joined Darby Stratus in August 2006 as the officer responsible for the development of Darby Brazil Mezzanine Fund. Prior to joining Darby, Mr.Moraes worked at Bradespar S.A. as an Investment Manager for six years. From 1995 to 2000, he worked in the mergers and acquisitions and capital markets departments of Banco Bozano, Simonsen. In 2004, he was an alternate member of the board of directors of Net Serviços S.A., and in 2003, he was an alternate member of the board of directors of Vale. Mr.Moraes has a B.A. in Economics from Universidade Federal do Rio de Janeiro — UFRJ, and a MBA from COPPEAD, also at UFRJ.
Aníbal Moreira dos Santos. Since 2005, Mr.Santos has served as a member of the fiscal council of Vale. He was an executive officer of Caemi Canada Inc., Caemi Canada Investments Inc., CMM Overseas, Ltd., Caemi International Holdings BV and Caemi International Investments NV, subsidiaries of CAEMI, from 1998 to 2003, when he retired. From 1983 to 2003, he was chief accounting officer of CAEMI. From 1999 to 2003, he was a member of the fiscal council of CADAM S.A., and he was an alternate member of the board of directors of MBR and Empreendimentos Brasileiros de Mineração S.A. — EBM from 1998 to 2003. Mr.Santos is an accountant with a degree from Escola Técnica de Comércio da Fundação Getúlio Vargas.
ADVISORY COMMITTEES
Advisory committees
Our bylaws establish the following technical and advisory committees to the board of directors:
• The Executive Development Committee is responsible for reporting on general human resources policies, analyzing and reporting on the adequacy of compensation levels for our executive officers, proposing and updating guidelines for evaluating the performance of our executive officers, and reporting on policies relating to health and safety.
• The Strategy Committee is responsible for reviewing and making recommendations to the board of directors concerning: the strategic guidelines and plan submitted annually to the board by our executive officers, the company’s annual and multi-annual investment budgets, investment or divestiture opportunities submitted by executive officers, and mergers and acquisitions.
• The Finance Committee is responsible for reviewing and making recommendations to the board of directors concerning: our financial policies and the internal financial control systems, compatibility between the level of distributions to shareholders and the parameters established in the annual budget, and the consistency between our general dividend policy and capital structure.
• The Accounting Committee is responsible for: making nominating an employee to be responsible for internal auditing of the company, reporting on auditing policies and the execution of the company’s annual auditing plan, tracking the results of the company’s internal auditing, and identifying, prioritizing, and submitting recommendations to the executive officers, and analyzing and making recommendations with regard to our annual report and financial statements.
• The Governance and Sustainability Committee is responsible for: evaluating and recommending improvements to the effectiveness of our corporate governance practices and the functioning of our board of directors, recommending improvements to the code of ethical conduct and our management system in
111
order to avoid conflicts of interests between the company and its shareholders or management, issuing reports on potential conflicts of interest between the company and its shareholders or management, and reporting on policies relating to corporate responsibility, such as environmental and social responsibility.
COMPENSATION OF DIRECTORS, EXECUTIVE OFFICERS, FISCAL COUNCIL MEMBERS AND ADVISORY COMMITTEES
General
Under our bylaws, our shareholders are responsible for establishing the aggregate compensation we pay to the members of our board of directors and our executive officers. Our shareholders determine this annual aggregate compensation at the general shareholders’ meeting each year. In order to establish aggregate director and officer compensation, our shareholders usually take into account various factors, which range from attributes, experience and skills of our directors and executive officers to the recent performance of our operations. Once aggregate compensation is established, the members of our board of directors are then responsible for distributing such aggregate compensation in compliance with our bylaws among the directors and executive officers, in the latter case, at the recommendation of the chief executive officer. The Executive Development Committee of our board of directors makes recommendations to the board concerning the annual aggregate compensation of the executive officers. In addition to fixed compensation, our executive officers are also eligible for bonuses and incentive payments.
For the year ended December 31, 2007, we paid US$24.2 million in aggregate to the executive officers, of which US$8.3 million was fixed compensation and US$15.9 million was variable compensation and benefits in kind granted, and US$0.8 million in aggregate to the members of our board of directors for services in all capacities, all of which was fixed compensation. The amounts accrued to provide pension, retirement or similar benefits for our executive officers was US$0.7 million. There is no similar benefits payment for the members of our board of directors.
As of April 30, 2008, the total number of common shares owned by our directors and executive officers was 166,922, and the total number of preferred class A shares owned by our directors and executive officers was 888,504. None of our directors or executive officers beneficially owns one percent or more of any class of our shares.
Fiscal council
During 2007, the monthly amount we paid to each of the members of the fiscal council was US$4,800 excluding benefits. We paid an aggregate of US$346,000 to members of the fiscal council in 2007. In addition, the members of the fiscal council are reimbursed for travel expenses related to the performance of their functions.
Advisory committees
We paid an aggregate of US$136,735 to members of Vale’s advisory committees in 2007. In addition, the members of Vale’s advisory committees are reimbursed for travel expenses related to the performance of their functions.
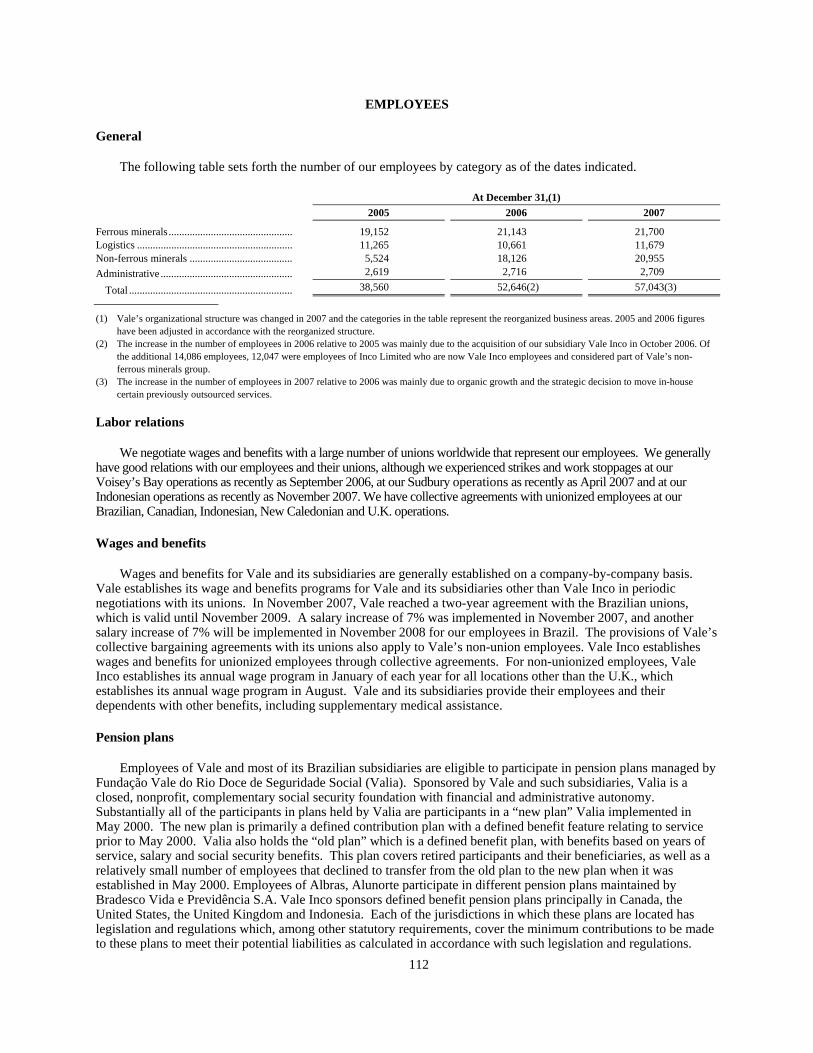
112
EMPLOYEES
General
The following table sets forth the number of our employees by category as of the dates indicated.
At December 31,(1) 2005 2006 2007
Ferrous minerals............................................... 19,152 21,143 21,700 Logistics ........................................................... 11,265 10,661 11,679 Non-ferrous minerals ....................................... 5,524 18,126 20,955 Administrative .................................................. 2,619 2,716 2,709
Total .............................................................. 38,560 52,646(2) 57,043(3)
(1) Vale’s organizational structure was changed in 2007 and the categories in the table represent the reorganized business areas. 2005 and 2006 figures have been adjusted in accordance with the reorganized structure.
(2) The increase in the number of employees in 2006 relative to 2005 was mainly due to the acquisition of our subsidiary Vale Inco in October 2006. Of the additional 14,086 employees, 12,047 were employees of Inco Limited who are now Vale Inco employees and considered part of Vale’s non-ferrous minerals group.
(3) The increase in the number of employees in 2007 relative to 2006 was mainly due to organic growth and the strategic decision to move in-house certain previously outsourced services.
Labor relations
We negotiate wages and benefits with a large number of unions worldwide that represent our employees. We generally have good relations with our employees and their unions, although we experienced strikes and work stoppages at our Voisey’s Bay operations as recently as September 2006, at our Sudbury operations as recently as April 2007 and at our Indonesian operations as recently as November 2007. We have collective agreements with unionized employees at our Brazilian, Canadian, Indonesian, New Caledonian and U.K. operations.
Wages and benefits
Wages and benefits for Vale and its subsidiaries are generally established on a company-by-company basis. Vale establishes its wage and benefits programs for Vale and its subsidiaries other than Vale Inco in periodic negotiations with its unions. In November 2007, Vale reached a two-year agreement with the Brazilian unions, which is valid until November 2009. A salary increase of 7% was implemented in November 2007, and another salary increase of 7% will be implemented in November 2008 for our employees in Brazil. The provisions of Vale’s collective bargaining agreements with its unions also apply to Vale’s non-union employees. Vale Inco establishes wages and benefits for unionized employees through collective agreements. For non-unionized employees, Vale Inco establishes its annual wage program in January of each year for all locations other than the U.K., which establishes its annual wage program in August. Vale and its subsidiaries provide their employees and their dependents with other benefits, including supplementary medical assistance.
Pension plans
Employees of Vale and most of its Brazilian subsidiaries are eligible to participate in pension plans managed by Fundação Vale do Rio Doce de Seguridade Social (Valia). Sponsored by Vale and such subsidiaries, Valia is a closed, nonprofit, complementary social security foundation with financial and administrative autonomy. Substantially all of the participants in plans held by Valia are participants in a “new plan” Valia implemented in May 2000. The new plan is primarily a defined contribution plan with a defined benefit feature relating to service prior to May 2000. Valia also holds the “old plan” which is a defined benefit plan, with benefits based on years of service, salary and social security benefits. This plan covers retired participants and their beneficiaries, as well as a relatively small number of employees that declined to transfer from the old plan to the new plan when it was established in May 2000. Employees of Albras, Alunorte participate in different pension plans maintained by Bradesco Vida e Previdência S.A. Vale Inco sponsors defined benefit pension plans principally in Canada, the United States, the United Kingdom and Indonesia. Each of the jurisdictions in which these plans are located has legislation and regulations which, among other statutory requirements, cover the minimum contributions to be made to these plans to meet their potential liabilities as calculated in accordance with such legislation and regulations.
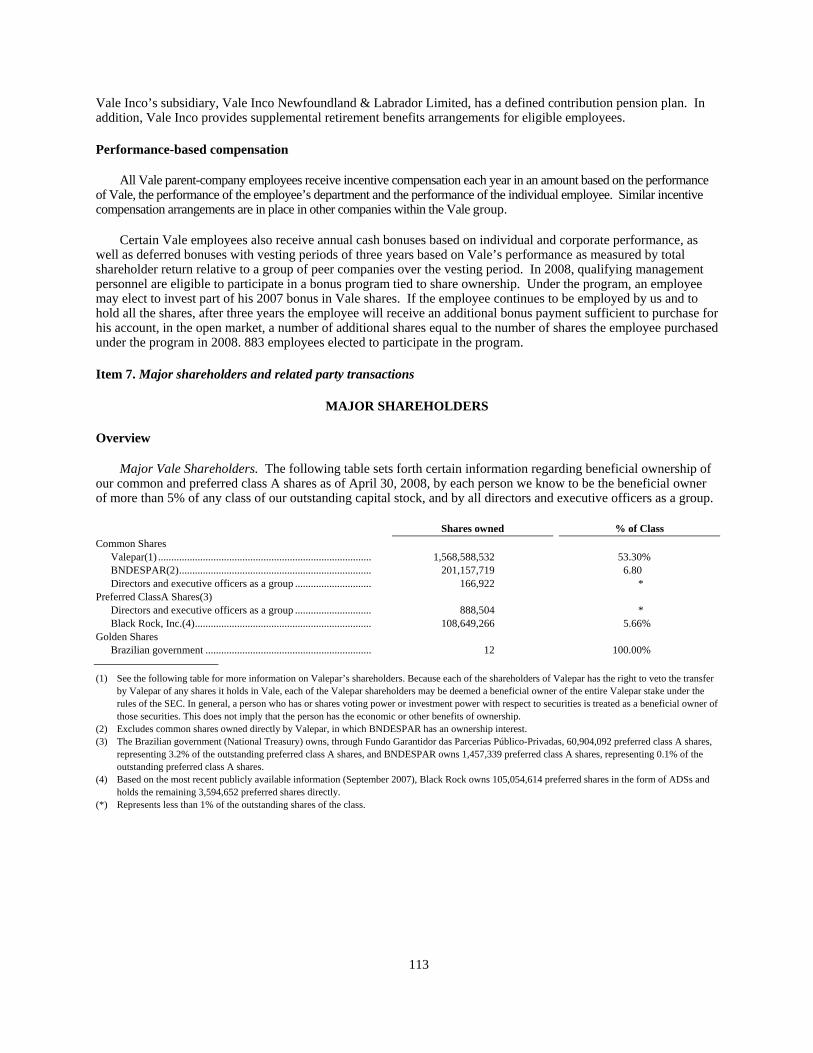
113
Vale Inco’s subsidiary, Vale Inco Newfoundland & Labrador Limited, has a defined contribution pension plan. In addition, Vale Inco provides supplemental retirement benefits arrangements for eligible employees.
Performance-based compensation
All Vale parent-company employees receive incentive compensation each year in an amount based on the performance of Vale, the performance of the employee’s department and the performance of the individual employee. Similar incentive compensation arrangements are in place in other companies within the Vale group.
Certain Vale employees also receive annual cash bonuses based on individual and corporate performance, as well as deferred bonuses with vesting periods of three years based on Vale’s performance as measured by total shareholder return relative to a group of peer companies over the vesting period. In 2008, qualifying management personnel are eligible to participate in a bonus program tied to share ownership. Under the program, an employee may elect to invest part of his 2007 bonus in Vale shares. If the employee continues to be employed by us and to hold all the shares, after three years the employee will receive an additional bonus payment sufficient to purchase for his account, in the open market, a number of additional shares equal to the number of shares the employee purchased under the program in 2008. 883 employees elected to participate in the program.
Item 7. Major shareholders and related party transactions
MAJOR SHAREHOLDERS
Overview
Major Vale Shareholders. The following table sets forth certain information regarding beneficial ownership of our common and preferred class A shares as of April 30, 2008, by each person we know to be the beneficial owner of more than 5% of any class of our outstanding capital stock, and by all directors and executive officers as a group.
Shares owned % of Class Common Shares
Valepar(1) ................................................................................. 1,568,588,532 53.30% BNDESPAR(2)......................................................................... 201,157,719 6.80 Directors and executive officers as a group ............................. 166,922 *
Preferred ClassA Shares(3) Directors and executive officers as a group ............................. 888,504 * Black Rock, Inc.(4)................................................................... 108,649,266 5.66%
Golden Shares Brazilian government ............................................................... 12 100.00%
(1) See the following table for more information on Valepar’s shareholders. Because each of the shareholders of Valepar has the right to veto the transfer by Valepar of any shares it holds in Vale, each of the Valepar shareholders may be deemed a beneficial owner of the entire Valepar stake under the rules of the SEC. In general, a person who has or shares voting power or investment power with respect to securities is treated as a beneficial owner of those securities. This does not imply that the person has the economic or other benefits of ownership.
(2) Excludes common shares owned directly by Valepar, in which BNDESPAR has an ownership interest. (3) The Brazilian government (National Treasury) owns, through Fundo Garantidor das Parcerias Público-Privadas, 60,904,092 preferred class A shares,
representing 3.2% of the outstanding preferred class A shares, and BNDESPAR owns 1,457,339 preferred class A shares, representing 0.1% of the outstanding preferred class A shares.
(4) Based on the most recent publicly available information (September 2007), Black Rock owns 105,054,614 preferred shares in the form of ADSs and holds the remaining 3,594,652 preferred shares directly.
(*) Represents less than 1% of the outstanding shares of the class.
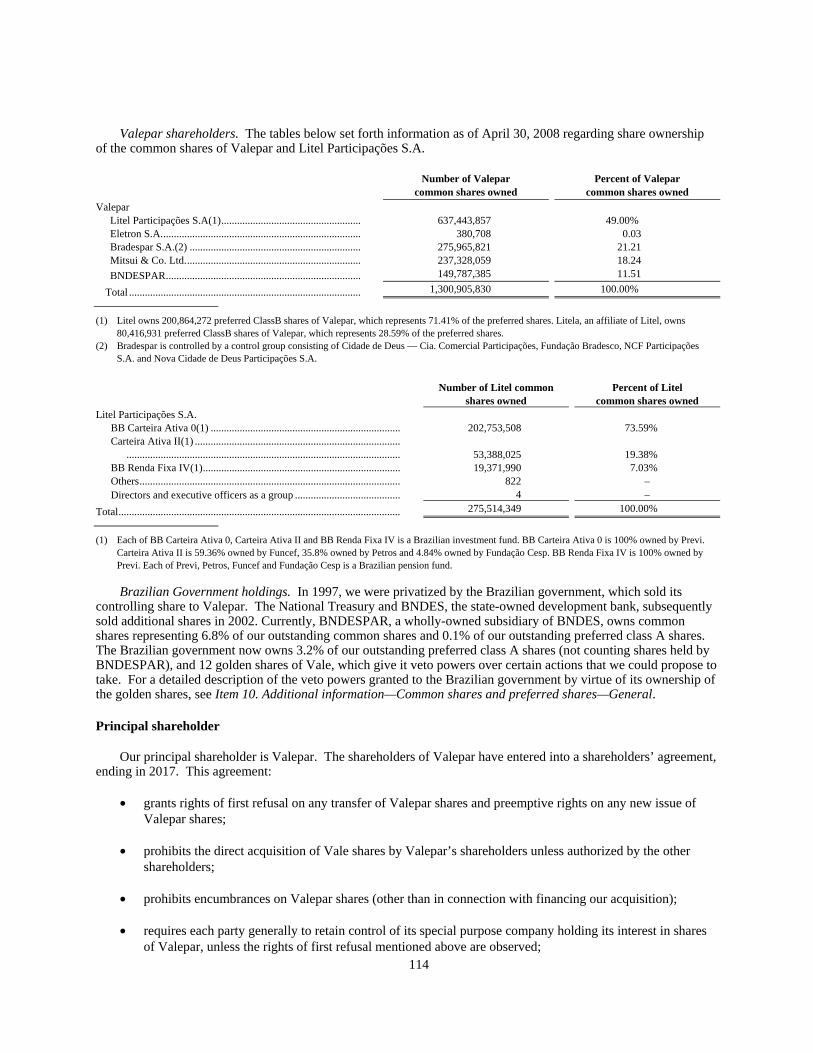
114
Valepar shareholders. The tables below set forth information as of April 30, 2008 regarding share ownership of the common shares of Valepar and Litel Participações S.A.
Number of Valepar
common shares owned Percent of Valepar
common shares owned Valepar
Litel Participações S.A(1)..................................................... 637,443,857 49.00% Eletron S.A............................................................................ 380,708 0.03 Bradespar S.A.(2) ................................................................. 275,965,821 21.21 Mitsui & Co. Ltd................................................................... 237,328,059 18.24 BNDESPAR.......................................................................... 149,787,385 11.51
Total ........................................................................................ 1,300,905,830 100.00%
(1) Litel owns 200,864,272 preferred ClassB shares of Valepar, which represents 71.41% of the preferred shares. Litela, an affiliate of Litel, owns 80,416,931 preferred ClassB shares of Valepar, which represents 28.59% of the preferred shares.
(2) Bradespar is controlled by a control group consisting of Cidade de Deus — Cia. Comercial Participações, Fundação Bradesco, NCF Participações S.A. and Nova Cidade de Deus Participações S.A.
Number of Litel common
shares owned Percent of Litel
common shares owned Litel Participações S.A.
BB Carteira Ativa 0(1) ........................................................................ 202,753,508 73.59% Carteira Ativa II(1) ..............................................................................
........................................................................................................ 53,388,025 19.38% BB Renda Fixa IV(1)........................................................................... 19,371,990 7.03% Others................................................................................................... 822 – Directors and executive officers as a group ........................................ 4 –
Total........................................................................................................... 275,514,349 100.00%
(1) Each of BB Carteira Ativa 0, Carteira Ativa II and BB Renda Fixa IV is a Brazilian investment fund. BB Carteira Ativa 0 is 100% owned by Previ. Carteira Ativa II is 59.36% owned by Funcef, 35.8% owned by Petros and 4.84% owned by Fundação Cesp. BB Renda Fixa IV is 100% owned by Previ. Each of Previ, Petros, Funcef and Fundação Cesp is a Brazilian pension fund.
Brazilian Government holdings. In 1997, we were privatized by the Brazilian government, which sold its controlling share to Valepar. The National Treasury and BNDES, the state-owned development bank, subsequently sold additional shares in 2002. Currently, BNDESPAR, a wholly-owned subsidiary of BNDES, owns common shares representing 6.8% of our outstanding common shares and 0.1% of our outstanding preferred class A shares. The Brazilian government now owns 3.2% of our outstanding preferred class A shares (not counting shares held by BNDESPAR), and 12 golden shares of Vale, which give it veto powers over certain actions that we could propose to take. For a detailed description of the veto powers granted to the Brazilian government by virtue of its ownership of the golden shares, see Item 10. Additional information—Common shares and preferred shares—General.
Principal shareholder
Our principal shareholder is Valepar. The shareholders of Valepar have entered into a shareholders’ agreement, ending in 2017. This agreement:
• grants rights of first refusal on any transfer of Valepar shares and preemptive rights on any new issue of Valepar shares;
• prohibits the direct acquisition of Vale shares by Valepar’s shareholders unless authorized by the other shareholders;
• prohibits encumbrances on Valepar shares (other than in connection with financing our acquisition);
• requires each party generally to retain control of its special purpose company holding its interest in shares of Valepar, unless the rights of first refusal mentioned above are observed;

115
• allocates Valepar’s and our board seats;
• commits the Valepar shareholders to support a dividend policy by Vale of 50% distribution of Vale’s net profit for each fiscal year, unless the Valepar shareholders commit to support a different dividend policy for a given year;
• provides for the maintenance by Vale of a capital structure that does not exceed specified debt to equity thresholds;
• requires the Valepar shareholders to vote their indirectly held Vale shares and to cause their representatives on Vale’s board of directors to vote only in accordance with decisions made at Valepar pre-meetings held prior to meetings of Vale’s board of directors or shareholders; and
• establishes supermajority voting requirements for certain significant actions relating to Valepar or to us.
Pursuant to the Valepar shareholders’ agreement, holders of at least 75% of the Valepar common shares must agree to enable Valepar to support any of the following matters:
• any amendment of Vale’s bylaws;
• any increase of Vale’s capital stock by share subscription, creation of a new class of shares, change in the characteristics of the existing shares or any capital reduction of Vale;
• any issuance of any debentures of Vale, whether convertible into shares of Vale, participation certificates upon compensation, call options or any other security of Vale;
• any determination of issuance price for any new shares of capital stock or other security of Vale;
• any amalgamation, spin-off or merger to which Vale is a party, as well as any change to Vale’s corporate form;
• any dissolution, receivership, bankruptcy or any other voluntary act for financial reorganization or any suspension thereof;
• the election and replacement of Vale’s board of directors, including the chairman of the board, and any officer of Vale;
• the disposal or acquisition of equity participation in any other company by Vale, as well as the acquisition of any shares of capital stock of Vale or Valepar;
• the participation by Vale in a group of companies or in a consortium of any kind;
• the execution of distribution, investment, sales exportation, technology transfer, trademark license, patent exploration, license to use and lease agreements, to which Vale will be a party;
• the approval and amendment of Vale’s business plan;
• the determination of the compensation of the directors of Vale, as well as the duties of the board;
• any profit sharing among the administrators of Vale;
• the determination of the compensation of Vale’s officers;
• any change in the corporate purpose of Vale;
116
• the distribution or non-distribution of any dividends (including distributions classified as interest on shareholders’ equity) on any shares of capital stock of Vale other than as provided in Vale’s bylaws;
• the appointment and replacement of Vale’s independent auditor;
• the creation of any “in rem” guarantee, granting of guarantees including rendering of sureties by Vale with respect to obligations of any unrelated party, including any affiliates or subsidiaries;
• the passing of any resolution on any matter which, pursuant to applicable law, entitles a shareholder to withdrawal rights;
• the appointment and replacement by the board of directors of any representative of Vale in subsidiaries, companies related to Vale or other companies in which Vale is entitled to appoint directors and officers; and
• any change in the debt to equity threshold, as defined in the shareholders’ agreement.
In addition, the shareholders’ agreement provides that any issuance of participation certificates by Vale or any disposition of Vale’s shares held by Valepar requires the unanimous consent of all of Valepar’s shareholders.
American Depositary Shares
As of April 30, 2008, American Depositary Shares represented 27.0% of our outstanding common shares and 43.8% of our outstanding preferred class A shares.
RELATED PARTY TRANSACTIONS
At December 31, 2007, we had extended guarantees for borrowings obtained by our affiliate Samarco in the amount of less than US$1 million. See Note 19 to our consolidated financial statements.
We have arm’s-length commercial relationships in the ordinary course of our business with Mitsui, a shareholder of Valepar (our principal shareholder), and with a number of companies that are affiliated with shareholders of Valepar, such as Acesita, Belgo Mineira, Cemig and Usiminas (in all of which Previ holds an interest). We also have arm’s-length commercial relationships in the ordinary course of our business with subsidiaries of companies on whose boards our CEO currently serves or has served as a director, such as Asea BrownBoveri and Petrobras.
We and BNDES, the Brazilian state-owned development bank, are parties to a contract relating to authorizations for mining exploration. (BNDES is the parent company of one of our major shareholders, BNDESPAR.) This contract, which we refer to as the Mineral Risk Contract, provides for the joint development of certain unexplored mineral deposits that form part of our Northern System (Carajás), as well as proportional participation in any profits earned from the development of such resources. Iron ore and manganese ore deposits already identified at the time we entered into the Mineral Risk Contract (in March 1997) were specifically excluded from the contract. The Mineral Risk Contract was extended in 2007, with specific rules for all exploration projects and exploration targets and mineral rights covered under the Mineral Risk Contract. In addition, BNDES has participated in certain of our financing arrangements. For more information on our transactions with BNDES, see Item 5. Liquidity and capital resources—Sources of funds.
For information regarding investments in affiliated companies and joint ventures and for information regarding transactions with major related parties, see Notes 19 and 21 to our consolidated financial statements.

117
Item 8. Financial information
LEGAL PROCEEDINGS
We and our subsidiaries are defendants in numerous legal actions in the normal course of business, including civil, administrative, tax, social security and labor proceedings. See Note 19 to our consolidated financial statements.
CADE proceedings
The primary Brazilian antitrust regulator, Conselho Administrativo de Defesa Econômica, or CADE, conducts post-transaction reviews of nearly all of our acquisitions and joint ventures. We are currently involved in litigation relating to one such review, as described below. In two other proceedings, CADE is alleging that we have engaged in illegal anticompetitive conduct in connection with our logistics business. If CADE were to find that we have engaged in anticompetitive conduct, it could order us to cease the conduct and/or to pay fines.
In August 2005, CADE issued a decision in connection with its post-transaction review of our acquisitions of Mineração Socoimex S.A., S.A. Mineração Trindade-Samitri, Ferteco Mineração S.A., Belém-Administrações e Participações Ltda. and CAEMI Mineração e Metalurgia S.A. as well as the unwinding of our former cross-shareholdings with Companhia Siderúrgica Nacional. CADE approved these transactions subject to the condition that Vale waive its voting and veto rights with respect to its stake in MRS Logística S.A. (which Vale did in 2006) and either (i)sell all of the assets we acquired through our acquisition of Ferteco Mineração S.A. in 2001, or (ii) fully waive our rights of first refusal relating to the Casa de Pedra iron ore mine.
We appealed and obtained an injunction permitting us to postpone complying with the decision until the resolution of the appeal. The federal circuit court ( Justiça Federal de Brasília ) ruled against us in February 2006, and the federal appellate court ( Tribunal Regional Federal ) upheld its decision in March 2007. Our subsequent appeals to the Brazilian Supreme Court ( Superior Tribunal de Justiça, or STJ ) and the Constitutional Court ( Supremo Tribunal Federal, or STF ) were rejected, but we have filed another appeal with the STF. Our injunction against the CADE decision will remain in effect until the exhaustion of all our appeals.
Following the federal circuit court’s unfavorable decision in February 2006, we filed a motion for declaratory judgment with the same court, requesting the following declarations: (i)that a longer time period, to permit an audit of the Ferteco and Casa de Pedra assets, is necessary to comply with the part of the CADE decision relating to Casa de Pedra, (ii)that the rights of first refusal relating to Casa de Pedra have economic value, and (iii)that we are entitled to indemnification before waiving our rights of first refusal. The federal circuit court rendered an unfavorable interlocutory decision in August 2007 with respect to our request for an injunction, and our appeal from that decision is still pending, as is the decision on the merits in the underlying case.
In January 2008, CADE fined us US$23 million for 631days of non-compliance with its decision, disregarding the validity of the injunction we obtained. We filed an action with the federal circuit court to annul the penalty, which is pending. In the meantime, the court has permitted us to post a bank guaranty instead of depositing the amount of the fine before the conclusion of the appeal.
Privatization-related suits
Numerous lawsuits challenging the legality of the minimum auction price fixed in our 1997 privatization are pending, including a number of class action lawsuits. The lower courts issued favorable decisions in these lawsuits, which were appealed by the respective plaintiffs. Certain cases were resolved in our favor by the higher courts. In the remaining cases, in which the plaintiffs have challenged the price paid for the controlling block of Vale and other aspects of the privatization, the higher courts overruled (in 2005) the lower courts and ordered that the proceedings be re-submitted to the lower courts to continue with discovery on the issue of the basis for establishing the minimum price in the privatization program. We have jointly appealed these decisions to the Brazilian Supreme Court ( STJ ) and are awaiting official publication of its determination. We do not believe that, individually or in the aggregate, these actions will adversely affect the outcome of the privatization process or otherwise have a material adverse effect on us.
118
Praia Mole suit
We were a defendant in a public civil action seeking to annul the concession agreement through which we and certain other defendants operate the Praia Mole maritime terminal in the Brazilian state of Espírito Santo. This case was decided in our favor in November 2007, but the plaintiff filed an appeal with the federal circuit court in April 2008, which is still pending.
Itabira suits
We are a defendant in two separate actions brought by the municipality of Itabira, in the Brazilian state of Minas Gerais. In one of the actions, filed in August 1996, the municipality of Itabira alleges that our Itabira iron ore mining operations have caused environmental and social damages and claims damages with respect to the degradation of the site of one of our mines, as well as the immediate restoration of the affected ecological complex and the performance of compensatory environmental programs in the region. The damages sought, as adjusted from the date of the claim, amount to approximately US$1.032 billion. We believe that this action is without merit. In the other action, the municipality of Itabira is claiming the right to be reimbursed for expenses it has incurred in connection with public services rendered as a consequence of our mining activities. The damages sought, as adjusted from the date of the claim, amount to approximately US$1.196 billion. We believe these suits are without merit.
CFEM-related proceedings
We are currently a defendant in a series of administrative proceedings and one judicial proceeding brought by the National Mineral Production Department ( Departamento Nacional de Produção Mineral ), or DNPM, an agency of the Ministry of Mines and Energy of the Brazilian government. The most significant of these proceedings was brought against us in March 2006, alleging that we have failed to pay the full amount of a mining royalty, known as the CFEM, on revenues generated by our iron ore and manganese activities. (For details about the CFEM, see Item 4. Information on the company—Regulatory matters—Mining regulation.) We believe that the DNPM’s allegations are without merit. The aggregate amount claimed in the administrative proceedings and in the judicial proceeding is approximately US$1.411 billion.
We are a defendant in a judicial proceeding brought in 2002 by the Municipality of Mariana, alleging that we owe royalties (“CFEM”) on our pelletization activities. We do not believe pelletization activities are subject to CFEM. For more information about CFEM, see Item 4. Regulatory matters—Mining regulation.
We are also involved in litigation with the DNPM regarding the applicable CFEM rate for potash. Brazilian legislation establishes a 2% rate for fertilizers. As the potash commercialized by Vale is used as fertilizer, we believe the applicable rate is 2%. The DNPM believes that the end-use of potash is irrelevant for purposes of determining the applicable rate and that the rate applicable to our potash products is 3%. For more information about the CFEM, see Item 4. Information on the company—Regulatory matters—Mining regulation.
Tax litigation
We are engaged in litigation with respect to certain aspects of recent tax regulation that requires earnings from foreign subsidiaries to be included in the determination of income taxes payable in Brazil. We obtained an injunction in February 2003 suspending our obligation to pay the disputed amounts. This injunction remains in effect by virtue of a pending appeal that we filed with the federal appellate courts in September 2005 against an unfavorable decision issued by lower federal courts in July 2005. Meanwhile, the tax authorities have initiated a new administrative proceeding to enforce this tax regulation.
Valesul litigation
In accordance with an agency resolution, the Brazilian electricity regulatory agency, ANEEL, authorized the electricity company of the state of Rio de Janeiro (LIGHT — Serviços de Eletricidade S.A., or “Light”) to charge certain larger consumers in Rio de Janeiro, including our aluminum subsidiary Valesul, several additional fees as part of the tariff for the use of the distribution system. Valesul began a challenge to the legality of this charge in January 2004 and obtained a favorable decision in June of that year. On appeal, this decision was overruled, in
119
September 2004, thereby forcing Valesul to resume making payments pending resolution of an appeal to the national Supreme Court ( STJ ).
DISTRIBUTIONS
Under our dividend policy, our management proposes to our board of directors, no later than January 31 of each year, a minimum value per share, expressed in U.S. dollars, that will be distributed in that year to our shareholders. Distributions may be classified for tax purposes either as dividends or interest on shareholders’ equity, and references to “dividends” should be understood to include all distributions regardless of their tax classification, unless stated otherwise. We determine the dividend payment in U.S. dollars, considering our expected free cash flow generation in the year of distribution. The proposal establishes two installments to be paid in the months of April and October of each year. It is submitted to the board of directors in the meetings scheduled for the months of April and October. Once approved, dividends are paid in reais and converted into U.S. dollars at prevailing exchange rates on the last business day before the board meetings in April and October of each year.
Management can also propose to the board of directors, depending on the evolution of our cash flow performance, a further payment to shareholders of an amount per share over and above the minimum dividend initially established. For 2008, our management has proposed to the board of directors a minimum dividend of US$2.500 billion. We have been paying the same amount on both common and preferred class A shares in accordance with our bylaws. The first installment of this dividend of US$1.250 billion was paid on April 30, 2008.
Under Brazilian law and our bylaws, we are required to distribute to our shareholders an annual amount equal to not less than 25% of the distributable amount, referred to as the mandatory dividend, unless the board of directors advises our shareholders at our shareholders’ meeting that payment of the mandatory dividend for the preceding year is inadvisable in light of our financial condition. For a discussion of dividend distribution provisions under the Brazilian Corporation Law and our bylaws, see Item 10. Additional information.
Distributions classified for tax purposes as dividends which are paid to ADR holders and to non-resident shareholders will not be subject to Brazilian withholding tax, unless the distribution is paid from profits generated prior to December 31, 1995. These distributions will be subject to Brazilian withholding tax at varying rates. Distributions classified for tax purposes as interest on shareholders’ equity which are paid to ADR holders and to non-resident shareholders are currently subject to Brazilian withholding tax. See Item 10. Additional information—Taxation—Brazilian tax considerations.
By law, we are required to hold an annual shareholders’ meeting by April 30 of each year at which an annual dividend may be declared. Additionally, our board of directors may declare interim dividends. Under the Brazilian Corporation Law, dividends are generally required to be paid to the holder of record on a dividend declaration date within 60days following the date the dividend was declared, unless a shareholders’ resolution sets forth another date of payment, which, in either case, must occur prior to the end of the fiscal year in which the dividend was declared. A shareholder has a three-year period from the dividend payment date to claim dividends (or payments of interest on shareholders’ equity) in respect of its shares, after which we will have no liability for such payments. From 1997 to 2003, all distributions took the form of interest on shareholders’ equity. In each year since 2004, part of the distribution was made in the form of interest on shareholders’ equity and part as dividends. See Item 10. Additional information—Common shares and preferred shares—Payments on shareholders’ equity.
We make cash distributions on the common shares and preferred class A shares underlying the American Depositary Shares in Brazilian currency to the custodian on behalf of the depositary. The custodian then converts such proceeds into U.S. dollars and transfers such U.S. dollars to be delivered to the depositary for distribution to holders of American depositary receipts. For more information on Brazilian tax policies regarding dividend distributions, see Item 10. Additional information—Taxation—Brazilian tax considerations.
The following table sets forth the cash distributions we paid to holders of common shares and preferred class A shares for the periods indicated. Amounts have been restated to give effect to stock splits that we have carried out in subsequent periods. We have calculated U.S. dollar conversions using the commercial selling rate in effect on the date of payment. Amounts are stated gross of any applicable withholding tax.
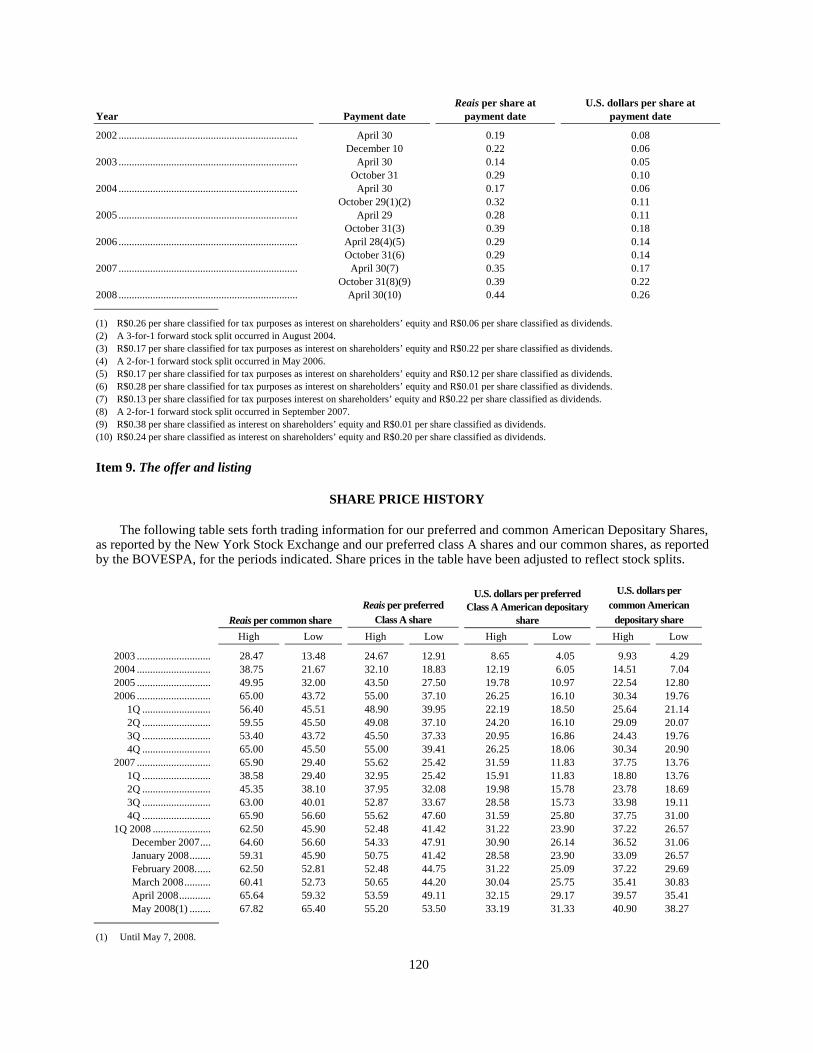
120
Year Payment date Reais per share at
payment date U.S. dollars per share at
payment date
2002 .................................................................... April 30 0.19 0.08 December 10 0.22 0.06 2003 .................................................................... April 30 0.14 0.05 October 31 0.29 0.10 2004 .................................................................... April 30 0.17 0.06 October 29(1)(2) 0.32 0.11 2005 .................................................................... April 29 0.28 0.11 October 31(3) 0.39 0.18 2006 .................................................................... April 28(4)(5) 0.29 0.14 October 31(6) 0.29 0.14 2007 .................................................................... April 30(7) 0.35 0.17 October 31(8)(9) 0.39 0.22 2008 .................................................................... April 30(10) 0.44 0.26
(1) R$0.26 per share classified for tax purposes as interest on shareholders’ equity and R$0.06 per share classified as dividends. (2) A 3-for-1 forward stock split occurred in August 2004. (3) R$0.17 per share classified for tax purposes as interest on shareholders’ equity and R$0.22 per share classified as dividends. (4) A 2-for-1 forward stock split occurred in May 2006. (5) R$0.17 per share classified for tax purposes as interest on shareholders’ equity and R$0.12 per share classified as dividends. (6) R$0.28 per share classified for tax purposes as interest on shareholders’ equity and R$0.01 per share classified as dividends. (7) R$0.13 per share classified for tax purposes interest on shareholders’ equity and R$0.22 per share classified as dividends. (8) A 2-for-1 forward stock split occurred in September 2007. (9) R$0.38 per share classified as interest on shareholders’ equity and R$0.01 per share classified as dividends. (10) R$0.24 per share classified as interest on shareholders’ equity and R$0.20 per share classified as dividends. Item 9. The offer and listing
SHARE PRICE HISTORY
The following table sets forth trading information for our preferred and common American Depositary Shares, as reported by the New York Stock Exchange and our preferred class A shares and our common shares, as reported by the BOVESPA, for the periods indicated. Share prices in the table have been adjusted to reflect stock splits.
Reais per common share Reais per preferred
Class A share
U.S. dollars per preferred Class A American depositary
share
U.S. dollars per common American
depositary share
High Low High Low High Low High Low
2003 ............................ 28.47 13.48 24.67 12.91 8.65 4.05 9.93 4.29 2004 ............................ 38.75 21.67 32.10 18.83 12.19 6.05 14.51 7.04 2005 ............................ 49.95 32.00 43.50 27.50 19.78 10.97 22.54 12.80 2006 ............................ 65.00 43.72 55.00 37.10 26.25 16.10 30.34 19.76 1Q .......................... 56.40 45.51 48.90 39.95 22.19 18.50 25.64 21.14 2Q .......................... 59.55 45.50 49.08 37.10 24.20 16.10 29.09 20.07 3Q .......................... 53.40 43.72 45.50 37.33 20.95 16.86 24.43 19.76 4Q .......................... 65.00 45.50 55.00 39.41 26.25 18.06 30.34 20.90 2007 ............................ 65.90 29.40 55.62 25.42 31.59 11.83 37.75 13.76 1Q .......................... 38.58 29.40 32.95 25.42 15.91 11.83 18.80 13.76 2Q .......................... 45.35 38.10 37.95 32.08 19.98 15.78 23.78 18.69 3Q .......................... 63.00 40.01 52.87 33.67 28.58 15.73 33.98 19.11 4Q .......................... 65.90 56.60 55.62 47.60 31.59 25.80 37.75 31.00 1Q 2008 ...................... 62.50 45.90 52.48 41.42 31.22 23.90 37.22 26.57
December 2007.... 64.60 56.60 54.33 47.91 30.90 26.14 36.52 31.06 January 2008........ 59.31 45.90 50.75 41.42 28.58 23.90 33.09 26.57 February 2008...... 62.50 52.81 52.48 44.75 31.22 25.09 37.22 29.69 March 2008.......... 60.41 52.73 50.65 44.20 30.04 25.75 35.41 30.83 April 2008............ 65.64 59.32 53.59 49.11 32.15 29.17 39.57 35.41 May 2008(1) ........ 67.82 65.40 55.20 53.50 33.19 31.33 40.90 38.27
(1) Until May 7, 2008.
121
STOCK TRADING MARKETS
Our publicly traded share capital consists of common shares and preferred class A shares, each without par value. Our common shares and our preferred class A shares are publicly traded in Brazil on BOVESPA, under the ticker symbols VALE3 and VALE5, respectively. Our common shares and preferred class A shares also trade on the LATIBEX, under the ticker symbols XVALO and XVALP, respectively. The LATIBEX is an electronic market created in 1999 by the Madrid stock exchange in order to enable trading of Latin American equity securities in euro denomination.
Our common American Depositary Shares, each representing one common share, have traded on the New York Stock Exchange (NYSE) since March 2002, under the ticker symbol RIO. Our preferred American Depositary Shares, each representing one preferred class A share, have been traded on the NYSE since June 2000, under the ticker symbol RIOPR. The preferred class A American Depositary Shares had previously traded in the over-the-counter market since 1994. JPMorgan Chase Bank serves as the depositary for both the common and the preferred American Depositary Shares. On April 30, 2008, there were 1,544,307,842 American Depositary Shares outstanding, representing 43.8% of our preferred class A shares, 27.0% of our common shares or 32.0% of our total share capital.
Item 10. Additional information
MEMORANDUM AND ARTICLES OF ASSOCIATION
Company objectives and purposes
Our corporate purpose is defined by our bylaws to include:
• the exploitation of mineral deposits in Brazil and abroad by means of extraction, processing, industrialization, transportation, shipment and commerce of mineral goods;
• the building and operation of railways and the exploitation of own or unrelated-party rail traffic;
• the building and operation of own or unrelated-party maritime terminals, and the exploitation of nautical activities for the provision of support within the harbor;
• the provision of logistics services integrated with cargo transport, comprising generation, storage, transshipment, distribution and delivery within the context of a multimodal transport system;
• the production, processing, transport, industrialization and commerce of all and any source and form of energy, also involving activities of production, generation, transmission, distribution and commerce of its products, derivatives and sub products;
• the carrying-on, in Brazil or abroad, of other activities that may be of direct or indirect consequence for the achievement of its corporate purpose, including research, industrialization, purchase and sale, importation and exportation, the exploitation, industrialization and commerce of forest resources and the provision of services of any kind whatsoever; and
• constituting or participating in any fashion in other companies, consortia or associations directly or indirectly related to its business purpose.
Directors’ powers
Under the Brazilian Corporation Law, if a director or an executive officer has a conflict of interest with the company in connection with any proposed transaction, the director or executive officer may not vote in any decision of the board of directors or of the board of executive officers regarding such transaction and must disclose the nature and extent of the conflicting interest for transcription in the minutes of the meeting. In any case, a director or an executive officer may not transact any business with the company, including any borrowings, except on reasonable
122
or fair terms and conditions that are identical to the terms and conditions prevailing in the market or offered by unrelated parties. Under our bylaws, shareholders set the aggregate compensation payable to directors and executive officers. The board of directors allocates the compensation among its members and the executive officers. See Item 6. Directors, management and employees—Compensation. Our bylaws do not establish any mandatory retirement age limits.
COMMON SHARES AND PREFERRED SHARES
Set forth below is certain information concerning our authorized and issued share capital and a brief summary of certain significant provisions of our bylaws and the Brazilian Corporation Law. This description does not purport to be complete and is qualified by reference to our bylaws (an English translation of which has been filed with the SEC) and to the Brazilian Corporation Law.
General
Our bylaws authorize the issuance of up to 3.6 billion common shares and up to 7.2 billion preferred class A shares, in each case based solely on the approval of the board of directors without any additional shareholder approval.
Each common share entitles the holder thereof to one vote at meetings of our shareholders. Holders of common shares are not entitled to any preference relating to our dividends or other distributions.
Holders of preferred class A shares and the golden shares are generally entitled to the same voting rights as holders of common shares, except with respect to the election of members of the board of directors, and are entitled to a minimum annual non-cumulative preferential dividend of (i) at least 3% of the book value per share, calculated in accordance with the financial statements, which serve as reference for the payment of dividends, or (ii) 6% of their pro rata share of our paid-in capital, whichever is higher. Non-controlling shareholders holding common shares representing at least 15% of our voting capital, and preferred class A shares representing at least 10% of our total share capital, have the right to appoint each one member and an alternate to our board of directors. If no group of common or preferred class A shareholders meets the thresholds described above, shareholders holding preferred class A or common shares representing at least 10% of our total share capital are entitled to combine their holdings to appoint one member and an alternate to our board of directors. Holders of preferred class A shares and the golden shares may elect one member of the permanent fiscal council and the respective alternate. Non-controlling holders of common shares comprising at least 10% of the common shares outstanding may also elect one member of the fiscal council and an alternate.
The Brazilian government holds 12 golden shares of Vale. The golden shares are preferred shares that entitle its holder to the same rights (including with respect to voting and dividend preference) as holders of preferred class A shares. In addition, the holder of the golden shares is entitled to veto any proposed action relating to the following matters:
(1) a change in our name;
(2) a change in the location of our head office;
(3) a change in our corporate purpose as regards the mining activities;
(4) any liquidation of our company;
(5) any disposal or winding up of activities of any one or more of the following stages of our iron ore mining integrated systems:
(a) mineral deposits, ore deposits, mines;
(b) railways; or
(c) ports and maritime terminals;
123
(6) any change in the bylaws relating to the rights accorded to the classes of capital stock issued by us; and
(7) any change in the bylaws relating to the rights accorded the golden shares.
Calculation of distributable amount
At each annual shareholders’ meeting, the board of directors is required to recommend, based on the executive officers’ proposal, how to allocate our earnings for the preceding fiscal year. For purposes of the Brazilian Corporation Law, a company’s net income after income taxes and social contribution taxes for such fiscal year, net of any accumulated losses from prior fiscal years and amounts allocated to employees’ and management’s participation in earnings represents its “net profits” for such fiscal year. In accordance with the Brazilian Corporation Law, an amount equal to our “net profits,” as further reduced by amounts allocated to the legal reserve, to the contingency reserve or to the unrealized income reserve established by us in compliance with applicable law (discussed below) and increased by reversals of reserves constituted in prior years, will be available for distribution to shareholders in any particular year. Such amount, the adjusted net profits, is herein referred to as the distributable amount. We may also establish discretionary reserves, reserves for investment projects and fiscal investment reserves, as discussed below.
Legal reserve. Under the Brazilian Corporation Law, we are required to maintain a legal reserve to which we must allocate 5% of our “net profits” for each fiscal year until the amount of the reserve equals 20% of our paid-in capital. Net losses, if any, may be charged against the legal reserve.
Discretionary reserves. Under the Brazilian Corporation Law, a company may also provide for discretionary allocations of “net profits” to the extent set forth in its bylaws. Our bylaws provide for one discretionary depletion reserve, which may be taken into account in allocating net profits for any fiscal year. We currently maintain a tax incentive depletion reserve established in respect of certain mining operations. Appropriations to the tax incentive depletion reserve are deductible for tax purposes. The discretionary depletion reserve has not been used since 1996, when the related tax incentive expired. For more details, see Note 16 to our consolidated financial statements. There are no limits on the size or amount of proceeds that may be retained in the discretionary depletion reserve. However, the sum of the legal reserve, the depletion reserve and the reserve for investment projects, in an amount not greater than 50% of distributable net profit up to a maximum of the company’s share capital, may not exceed the amount of our paid-in capital.
Contingency reserve. Under the Brazilian Corporation Law, a portion of our “net profits” may also be discretionally allocated to a “contingency reserve” for an anticipated loss that is deemed probable in future years. Any amount so allocated in a prior year must be either reversed in the fiscal year in which the loss was anticipated if such loss does not in fact occur or charged off in the event that the anticipated loss occurs. We have never allocated an amount to the contingency reserve.
Reserve for investment projects. Under the Brazilian Corporation Law, we may allocate a portion of our “net profits” for discretionary appropriations for plant expansion and other capital investment projects, the amount of which is based on a capital budget previously presented by management and approved by shareholders. Under Law No. 10,303/2001, capital budgets with a duration longer than one year must be reviewed at each annual shareholders’ meeting. After completion of the relevant capital projects, we may retain the appropriation until shareholders vote to transfer all or a portion of the reserve to capital or retained earnings.
Unrealized income reserve. As of March 1, 2002, under Law No. 10,303/2001, the amount by which the mandatory dividend exceeds the “realized” portion of net profits for any particular year may be allocated to the unrealized income reserve. The “realized” portion of net profits is the amount by which “net profits” exceed the sum of (i) our net positive results, if any, from the equity method of accounting for earnings and losses of our subsidiaries and certain affiliates, and (ii) the profits, gains or return obtained on transactions completed after the end of the following fiscal year.
Tax incentive investment reserve. Under the Brazilian tax laws, a portion of “net profits” may also be allocated to a general “tax incentive investment reserve” in amounts corresponding to reductions in our income tax generated by credits for particular government-approved investments.

124
The Brazilian Corporation Law provides that all discretionary allocations of “net profits,” including discretionary reserves, the contingency reserve, the unrealized income reserve and the reserve for investment projects, are subject to approval by the shareholders voting at the annual meeting and can be transferred to capital or used for the payment of dividends in subsequent years. The fiscal incentive investment reserve and legal reserve are also subject to approval by the shareholders voting at the annual meeting and may be transferred to capital but are not available for the payment of dividends in subsequent years.
Our calculation of “net profits” and allocations to reserves for any fiscal year are determined on the basis of financial statements prepared in accordance with the Brazilian Corporation Law. Our consolidated financial statements have been prepared in accordance with U.S. GAAP and, although our allocations to reserves and dividends will be reflected in these financial statements, investors will not be able to calculate such allocations or required dividend amounts from our consolidated financial statements.
Mandatory dividend
The Brazilian Corporation Law and our bylaws prescribe that we must distribute to our shareholders in the form of dividends or interest on shareholders’ equity an annual amount equal to not less than 25% of the distributable amount, referred to as the mandatory dividend, unless the board of directors advises our shareholders at our general shareholders’ meeting that payment of the mandatory dividend for the preceding year is inadvisable in light of our financial condition. The fiscal council must review any such determination and report it to the shareholders. In addition to the mandatory dividend, our board of directors may recommend to the shareholders payment of dividends from other funds legally available therefore. Any payment of interim dividends will be netted against the amount of the mandatory dividend for that fiscal year. The shareholders must also approve the recommendation of the board of directors with respect to any required distribution. The amount of the mandatory dividend is subject to the size of the legal reserve, the contingency reserve, and the unrealized income reserve. The amount of the mandatory dividend is not subject to the size of the discretionary depletion reserve. See Item 10. Additional information—Common shares and preferred shares—Calculation of distributable amount. To date, our board of directors has never determined that payment of the mandatory dividend was inadvisable.
In November 2002, our board of directors approved a new dividend policy. See Item 8. Financial information—Distributions.
Dividend preference of preferred shares
Pursuant to our bylaws, holders of preferred class A shares and the golden shares are entitled to a minimum annual non-cumulative preferential dividend equal to (i) at least 3% of the book value per share, calculated in accordance with the financial statements which serve as reference for the payment of dividends, or (ii) 6% of their pro rata share of our paid-in capital, whichever is higher. To the extent that we declare dividends in any particular year in amounts which exceed the preferential dividends on preferred class A shares, and after holders of common shares have received distributions equivalent, on a per share basis, to the preferential dividends on preferred class A shares, holders of common shares and preferred class A shares shall receive the same additional dividend amount per share. Since the first step of our privatization in 1997, we have had sufficient distributable amounts to be able to distribute equal amounts to both common and preferred shareholders.
Other matters relating to preferred class A shares
Our bylaws do not provide for the conversion of preferred class A shares into common shares. In addition, the preferred class A shares do not have any preference upon our liquidation and there are no redemption provisions associated with the preferred class A shares.
Distributions classified as shareholders’ equity
Pursuant to a change in Brazilian tax law effective January 1, 1996, Brazilian companies are permitted to pay limited amounts to shareholders and treat such payments as an expense for Brazilian income tax purposes. In accordance with Law No. 9,249 dated December 26, 1995, our bylaws provide for the distribution of interest on shareholders’ equity as an alternative form of payment to shareholders. The interest rate applied is limited to the Brazilian long-term interest rate, or TJLP, for the applicable period. The deduction of the amount of interest paid
125
cannot exceed the greater of (1) 50% of net income (after the deduction of the provision of social contribution on net profits and before the deduction of the provision of the corporate income tax) before taking into account any such distribution for the period in respect of which the payment is made or (2) 50% of the sum of retained earnings and profit reserves. Any payment of interest on shareholders’ equity to shareholders is subject to Brazilian withholding income tax at the rate of 15%, except for a beneficiary located in a tax haven jurisdiction (i.e. a country that does not impose income tax or that imposes it at a maximum rate lower than 20%), in which case the rate is 25%. Under our bylaws, the amount paid to shareholders as interest on shareholders’ equity (net of any withholding tax) may be included as part of any mandatory and minimum dividend. Under the Brazilian Corporation Law, we are obligated to distribute to shareholders an amount sufficient to ensure that the net amount received, after payment by us of applicable Brazilian withholding taxes in respect of the distribution of interest on shareholders’ equity, is at least equal to the mandatory dividend.
Mandatorily convertible notes
In 2007, our wholly-owned subsidiary Vale Capital Limited issued mandatorily convertible notes in two series, both due June 15, 2010. The Series RIO notes (US$1.296 billion principal amount) are mandatorily convertible into ADSs representing an aggregate maximum of 56,582,040 common shares. The Series RIO P notes (US$584 million principal amount) are mandatorily convertible into ADSs representing an aggregate maximum of 30,295,456 preferred class A shares. Both series can convert before maturity under specified circumstances. The conversion rate for both series will depend on the market price of the ADSs on the conversion date. Under the indentures governing the notes, additional interest is due to each noteholder in an amount in U.S. dollars equal to any cash distribution net of any applicable withholding tax and fees paid by the Depositary of our ADSs to the holder of one ADS, multiplied by the number of ADSs that would be received by the noteholder upon conversion of the notes at the conversion rate specified in the applicable indenture.
Voting rights
Each common share entitles the holder thereof to one vote at meetings of our shareholders. Holders of preferred class A shares are entitled to the same voting rights as holders of common shares except that they may not vote on the election of members of the board of directors, except in the event of dividend arrearages, as described below. One of the members of the permanent fiscal council and his or her alternate are elected by majority vote of the holders of preferred class A shares. Holders of preferred class A shares and common shares may, in certain circumstances, combine their respective holdings to elect members of our board of directors.
The golden shares entitle the holder thereof to the same voting rights as holders of preferred class A shares. The golden shares also confer certain other significant voting rights in respect of particular actions, as described under Item 10. Additional information—Common shares and preferred shares—General.
The Brazilian Corporation Law provides that non-voting or restricted-voting shares, such as the preferred class A shares, acquire unrestricted voting rights beginning when a company has failed for three consecutive fiscal years (or for any shorter period set forth in a company’s constituent documents) to pay any fixed or minimum dividend to which such shares are entitled and continuing until payment thereof is made. Our bylaws do not set forth any such shorter period.
Any change in the preferences or advantages of our preferred class A shares, or the creation of a class of shares having priority over the preferred class A shares, would require the approval of holders of a majority of the outstanding preferred class A shares, voting as a class at a special meeting.
Shareholders’ meetings
A general shareholders’ meeting convenes each year to decide all matters relating to our corporate purposes and to pass such resolutions as they deem necessary for our protection and well being.
Pursuant to the Brazilian Corporation Law, shareholders voting at a general shareholders’ meeting have the power, among other powers, to:
• amend the bylaws;
126
• elect or dismiss members of the board of directors and members of the fiscal council at any time;
• receive annual reports by management and accept or reject management’s financial statements and recommendations including the allocation of net profits and the distributable amount for payment of the mandatory dividend and allocation to the various reserve accounts;
• authorize the issuance of debentures;
• suspend the rights of a shareholder in default of obligations established by law or by the bylaws;
• accept or reject the valuation of assets contributed by a shareholder in consideration for issuance of capital stock;
• pass resolutions to reorganize our legal form, to merge, consolidate or split us, to dissolve and liquidate us, to elect and dismiss our liquidators and to examine their accounts; and
• authorize management to file for bankruptcy or to request a concordata.
All shareholders’ meetings, including the annual shareholders’ meeting, are convened by publishing, no fewer than 15 days prior to the scheduled meeting date and no fewer than three times, a notice in the Diário Oficial do Estado do Rio de Janeiro and in a newspaper with general circulation in the city where we have our registered office, which is Rio de Janeiro. Our shareholders have previously designated Jornal do Commercio for this purpose. Also, as our shares are traded on BOVESPA, we must publish a notice in a São Paulo based newspaper. Such notice must contain the agenda for the meeting and, in the case of an amendment to our bylaws, an indication of the subject matter. In addition, under our bylaws, the holder of the golden shares is entitled to a minimum of 15 days prior formal notice to its legal representative of any general shareholders’ meeting to consider any proposed action subject to the veto rights accorded to the golden shares. See Item 10. Additional information—Common shares and preferred shares—General.
A shareholders’ meeting may be held if shareholders representing at least one-quarter of the voting capital are present. If no such quorum is present, notice must again be given in the same manner as described above except for the eight-days prior notice, and a meeting may then be convened without any specific quorum requirement, subject to the minimum quorum and voting requirements for certain matters, as discussed below. A shareholder without a right to vote may attend a general shareholders’ meeting and take part in the discussion of matters submitted for consideration.
Except as otherwise provided by law, resolutions of a shareholders’ meeting are passed by a simple majority vote, abstentions not being taken into account. Under the Brazilian Corporation Law, the approval of shareholders representing at least one-half of the issued and outstanding voting shares is required for the types of action described below, as well as, in the case of clause (a) and clause (b), a majority of issued and outstanding shares of the affected class:
(a) creating a new class of preferred shares or disproportionately increasing an existing class of preferred shares relative to the other classes of shares, other than to the extent permitted by the bylaws;
(b) changing a priority, preference, right, privilege or condition of redemption or amortization of any class of preferred shares or creating any class of non-voting preferred shares that has a priority, preference, right, condition or redemption or amortization superior to an existing class of shares, such as the preferred shares;
(c) reducing the mandatory dividend;
(d) changing the corporate purposes;
(e) merging us with another company or consolidating or splitting us;
(f) dissolving or liquidating us;
(g) participating in a centralized group of companies as defined under the Brazilian Corporation Law; and

127
(h) canceling any ongoing liquidation of us.
Whenever the shares of any class of capital stock are entitled to vote, each share is entitled to one vote. Annual shareholders’ meetings must be held by April 30 of each year. Shareholders’ meetings are called, convened and presided over by the chairman or by the vice-chairman of our board of directors. A shareholder may be represented at a general shareholders’ meeting by an attorney-in-fact appointed not more than one year before the meeting, who must be a shareholder, a company officer or a lawyer. For a public company, such as us, the attorney-in-fact may also be a financial institution.
Redemption rights
Our common shares and preferred class A shares are not redeemable, except that a dissenting shareholder is entitled under the Brazilian Corporation Law to obtain redemption upon a decision made at a shareholders’ meeting by shareholders representing at least 50% of the voting shares:
(1) to create a new class of preferred shares or to disproportionately increase an existing class of preferred shares relative to the other classes of shares (unless such actions are provided for or authorized by the bylaws);
(2) to modify a preference, privilege or condition of redemption or amortization conferred on one or more classes of preferred shares, or to create a new class with greater privileges than the existing classes of preferred shares;
(3) to reduce the mandatory distribution of dividends;
(4) to change our corporate purposes;
(5) to merge us with another company or consolidate us;
(6) to transfer all of our shares to another company in order to make us a wholly-owned subsidiary of such company, a stock merger;
(7) to approve the acquisition of control of another company at a price which exceeds certain limits set forth in the Brazilian Corporation Law;
(8) to approve our participation in a centralized group of companies as defined under the Brazilian Corporation Law; or
(9) in the event that the entity resulting from (a) a merger, (b) a stock merger as described in clause (6) above or (c) a spin-off that we conduct fails to become a listed company within 120 days of the general shareholders’ meeting at which such decision was taken.
Only holders of shares adversely affected by the changes mentioned in items (1) and (2) above may require us to redeem their shares. The right of redemption mentioned in items (5), (6) and (8) above may only be exercised if our shares do not satisfy certain tests of liquidity at the time of the shareholder resolution. The right of redemption lapses 30 days after publication of the minutes of the relevant general shareholders’ meeting, unless, in the case of items (1) and (2) above, the resolution is subject to confirmation by the preferred shareholders (which must be made at a special meeting to be held within one year), in which case the 30-day term is counted from the publication of the minutes of the special meeting.
We would be entitled to reconsider any action giving rise to redemption rights within 10 days following the expiration of such rights if the redemption of shares of dissenting shareholders would jeopardize our financial stability. Law No. 9,457, dated May 5, 1997, which amended the Brazilian Corporation Law, contains provisions, which, among other provisions, restrict redemption rights in certain cases and allow companies to redeem their shares at their economic value, subject to certain requirements. Our bylaws currently do not provide that our capital stock will be redeemable at its economic value and, consequently, any redemption pursuant to the Brazilian Corporation Law would be made at no less than the book value per share, determined on the basis of the last balance
128
sheet approved by the shareholders; provided that if the general shareholders’ meeting giving rise to redemption rights occurred more than 60 days after the date of the last approved balance sheet, a shareholder would be entitled to demand that his or her shares be valued on the basis of a new balance sheet dated within 60 days of such general shareholders’ meeting.
Preemptive rights
Each of our shareholders has a general preemptive right to subscribe for shares in any capital increase, in proportion to his or her shareholding. A minimum period of 30 days following the publication of notice of a capital increase is assured for the exercise of the right and the right is negotiable. Under our bylaws and the Brazilian Corporation Law, our board of directors may decide not to extend preemptive rights to our shareholders, or to reduce the 30-day period for the exercise of preemptive rights, in each case with respect to any issuance of shares, debentures convertible into shares or warrants in the context of a public offering, subject to the limit on the number of shares that may be issued with the approval of the board without any additional shareholder approval. In the event of a capital increase that would maintain or increase the proportion of capital represented by preferred class A shares, holders of preferred American depositary receipts will have preemptive rights to subscribe only to newly issued preferred class A shares. In the event of a capital increase that would reduce the proportion of capital represented by preferred class A shares, shareholders will have preemptive rights to subscribe for preferred class A shares, in proportion to their shareholdings, and for common shares only to the extent necessary to prevent dilution of their overall interest in us. In the event of a capital increase that would maintain or increase the proportion of capital represented by common shares, shareholders will have preemptive rights to subscribe only to newly issued common shares. In the event of a capital increase that would reduce the proportion of capital represented by common shares, holders of common shares will have preemptive rights to subscribe for preferred class A shares only to the extent necessary to prevent dilution of their overall interest in us.
Tag-along rights
According to the Brazilian Corporation Law, in the event of a sale of control of the Company, the acquirer is obliged to offer to holders of common voting shares the right to sell their shares for a price equal to at least 80% of the price paid for the common voting shares representing control.
Form and transfer
Our preferred class A shares and common shares are in book-entry form registered in the name of each shareholder or its nominee. The transfer of such shares is made under the Brazilian Corporation Law, which provides that a transfer of shares is effected by our transfer agent, Banco Bradesco S.A., upon presentation of valid share transfer instructions to us by a transferor or its representative. When preferred shares or common shares are acquired or sold on a Brazilian stock exchange, the transfer is effected on the records of our transfer agent by a representative of a brokerage firm or the stock exchange’s clearing system. Transfers of shares by a foreign investor are made in the same way and are executed by the investor’s local agent, who is also responsible for updating the information relating to the foreign investment furnished to the Central Bank.
BOVESPA operates a central clearing system through Companhia Brasileira de Liquidação e Custódia, or CBLC. A holder of our shares may participate in this system and all shares elected to be put into the system will be deposited in custody with CBLC (through a Brazilian institution that is duly authorized to operate by the Central Bank and maintains a clearing account with CBLC). The fact that such shares are subject to custody with the relevant stock exchange will be reflected in our registry of shareholders. Each participating shareholder will, in turn, be registered in the register of our beneficial shareholders that is maintained by CBLC and will be treated in the same way as registered shareholders.
MATERIAL CONTRACTS
For information concerning our material contracts, see Item 4. Information on the company and Item 5. Operating and financial review and prospects.
129
EXCHANGE CONTROLS AND OTHER LIMITATIONS AFFECTING SECURITY HOLDERS
There are no restrictions on ownership of our capital stock by individuals or legal entities domiciled outside Brazil. However, the right to convert dividend payments and proceeds from the sale of preferred class A shares or common shares into foreign currency and to remit such amounts outside Brazil is subject to restrictions under foreign investment legislation which generally requires, among other things, that the relevant investment be registered with the Central Bank of Brazil. These restrictions on the remittance of foreign capital abroad could hinder or prevent the custodian for the preferred class A shares or common shares represented by American Depositary Shares, or holders who have exchanged American Depositary Shares for preferred class A shares or common shares, from converting dividends, distributions or the proceeds from any sale of preferred class A shares or common shares, as the case may be, into U.S. dollars and remitting such U.S. dollars abroad. Delays in, or refusal to grant any required government approval for conversions of Brazilian currency payments and remittances abroad of amounts owed to holders of American Depositary Shares could adversely affect holders of American depositary receipts.
Under Resolution No. 2,689/2000, foreign investors may invest in almost all financial assets and engage in almost all transactions available in the Brazilian financial and capital markets, provided that certain requirements are fulfilled. In accordance with Resolution No. 2,689/2000, the definition of foreign investor includes individuals, legal entities, mutual funds and other collective investment entities, domiciled or headquartered outside Brazil.
Under Resolution No. 2,689/2000, a foreign investor must:
• appoint at least one representative in Brazil, with powers to perform actions relating to its investment,
• complete the appropriate foreign investor registration form,
• register as a foreign investor with the CVM, and
• register its foreign investment with the Central Bank.
Securities and other financial assets held by foreign investors pursuant to Resolution No. 2,689/2000 must be registered or maintained in deposit accounts or under the custody of an entity duly licensed by the Central Bank or the CVM. In addition, securities trading is restricted to transactions carried out on stock exchanges or through organized over-the-counter markets licensed by the CVM, except for subscription, bonification, conversion of debentures into shares, securities indexes, purchase and sale of investment funds quotas and, if permitted by the CVM, going private transactions, canceling or suspension of trading. Moreover, the offshore transfer or assignment of the securities or other financial assets held by foreign investors pursuant to Resolution No. 2,689/2000 are prohibited, except for transfers resulting from a corporate reorganization, or occurring upon the death of an investor by operation of law or will.
Resolution No. 1,927/1992 of the National Monetary Council, which is the restated and amended Annex V to Resolution No. 1,289/1997, which we call the Annex V Regulations, provides for the issuance of depositary receipts in foreign markets in respect of shares of Brazilian issuers. It provides that the proceeds from the sale of American Depositary Shares by holders of American depositary receipts outside Brazil are free of Brazilian foreign investment controls and holders of American Depositary Shares who are not resident in a tax haven jurisdiction ( i.e., a country or location that does not impose taxes on income or where the maximum income tax rate is lower than 20%, or where the legislation imposes restrictions on disclosure of the shareholding composition or the ownership of the investment) will be entitled to favorable tax treatment.
An electronic registration has been issued by the custodian in the name of the depositary with respect to the American Depositary Shares. Pursuant to this electronic registration, the custodian and the depositary are able to convert dividends and other distributions with respect to the preferred class A shares or common shares represented by American Depositary Shares into foreign currency and to remit the proceeds outside Brazil. If a holder exchanges American Depositary Shares for preferred class A shares or common shares, the holder may continue to rely on the custodian’s electronic registration for only five business days after the exchange. After that, the holder must seek to obtain its own electronic registration with the Central Bank under Law No. 4,131/1962 or Resolution No. 2,689/2000. Thereafter, unless the holder has registered its investment with the Central Bank, such holder may not convert into
130
foreign currency and remit outside Brazil the proceeds from the disposition of, or distributions with respect to, such preferred class A shares or common shares.
As of March 14, 2005, there is a single foreign exchange market in Brazil. Foreign currencies may only be purchased through a Brazilian bank authorized to operate in this market. In the past, under Brazilian regulations, foreign exchange transactions were carried out on either the commercial rate exchange market or the floating rate exchange market. Rates in the two markets were generally the same. Although rates are freely negotiated in the foreign exchange market, they may be strongly influenced by the Central Bank’s intervention.
Under Brazilian law, whenever there is a serious imbalance in Brazil’s balance of payments or reasons to foresee a serious imbalance, the Brazilian government may impose temporary restrictions on the remittance to foreign investors of the proceeds of their investments in Brazil, and on the conversion of Brazilian currency into foreign currencies. Such restrictions may hinder or prevent the custodian or holders who have exchanged American Depositary Shares for underlying preferred class A shares or common shares from converting distributions or the proceeds from any sale of such shares, as the case may be, into U.S. dollars and remitting such U.S. dollars abroad. In the event the custodian is prevented from converting and remitting amounts owed to foreign investors, the custodian will hold the reais it cannot convert for the account of the holders of American depositary receipts who have not been paid. The depositary will not invest the reais and will not be liable for interest on those amounts. Furthermore, any reais so held will be subject to devaluation risk against the U.S. dollar.
TAXATION
The following summary contains a description of the principal Brazilian and U.S. federal income tax consequences of the ownership and disposition of preferred class A shares, common shares or American Depositary Shares. You should know that this summary does not purport to be a comprehensive description of all the tax considerations that may be relevant to a holder of preferred class A shares, common shares or American Depositary Shares.
Holders of preferred class A shares, common shares, or American Depositary Shares should consult their own tax advisors to discuss the tax consequences of the purchase, ownership and disposition of preferred class A shares, common shares or American Depositary Shares, including, in particular, the effect of any state, local or other national tax laws.
Although there is at present no treaty to avoid double taxation between Brazil and the United States, but only a common understanding between the two countries according to which income taxes paid in one may be offset against taxes to be paid in the other, both countries’ tax authorities have been having discussions that may result in the execution of such a treaty. In this regard, the two countries signed a Tax Information Exchange Agreement on March 20, 2007. We cannot predict whether or when such a treaty will enter into force or how, if entered into, such a treaty will affect the U.S. holders, as defined below, of preferred class A shares, common shares, or American Depositary Shares.
Brazilian tax considerations
The following discussion summarizes the principal Brazilian tax consequences of the acquisition, ownership and disposition of preferred class A shares, common shares or American Depositary Shares by a holder not deemed to be domiciled in Brazil for purposes of Brazilian taxation (“Non-Brazilian Holder”). It is based on the tax laws of Brazil and regulations thereunder in effect on the date hereof, which are subject to change (possibly with retroactive effect). This discussion does not specifically address all of the Brazilian tax considerations applicable to any particular Non-Brazilian Holder. Therefore, each Non-Brazilian Holder should consult his or her own tax advisor concerning the Brazilian tax consequences of an investment in preferred class A shares, common shares, or American Depositary Shares.
Shareholder distributions
Brazilian corporations, such as us, classify for tax purposes distributions to shareholders as either dividends or interest on shareholders’ equity.
131
Dividends. Amounts distributed as dividends, including distributions in kind, will generally not be subject to income tax withholding if the distribution is paid by us from profits of periods beginning on or after January 1, 1996 (1) to the depositary in respect of the preferred class A shares or common shares underlying the American Depositary Shares or (2) to a Non-Brazilian Holder in respect of preferred class A shares or common shares. Dividends paid from profits generated before January 1, 1996 may be subject to Brazilian withholding income tax at varying rates depending on the year the profits were generated.
Interest on shareholders’ equity. Amounts distributed as interest on shareholders’ equity are generally subject to income tax withholding at the rate of 15%, except if:
• the beneficiary is exempt from tax in Brazil, in which case the distribution is free of Brazilian tax, or
• the beneficiary is located in a Tax Haven Jurisdiction (as defined below) (a “Tax Haven Holder”), in which case the applicable income tax withholding rate is 25%.
Interest on shareholders’ equity is calculated as a percentage of shareholders’ equity, as stated in the statutory accounting records. The interest rate applied may not exceed the TJLP, as determined by the Central Bank of Brazil from time to time. In addition, the amount of distributions classified as interest on shareholders’ equity may not be more than the greater of (1) 50% of net income (after the deduction of the provision of social contribution on net profits but before taking into account such payment of interest and the provision of corporate income tax) for the period in respect of which the payment is made, or (2) 50% of the sum of retained earnings and profit reserves as of the date of the beginning of the fiscal year in respect of which the payment is made. Payments of interest on shareholders’ equity are deductible for corporate income tax and social contribution on net profit purposes, to the extent of the limits described above. Therefore, the benefit to us, as opposed to making a distribution classified as a dividend payment, is a reduction in our corporate taxes charge equivalent to 34% of such amount.
Taxation of capital gains. Taxation of Non-Brazilian Holders for capital gains depends on the status of the holder as either:
(1) not resident or domiciled in a Tax Haven Jurisdiction (as defined below) and registered with the Central Bank of Brazil and the CVM to invest in Brazil in accordance with Resolution No. 2,689, or a holder of American Depositary Shares; or
(2) any other Non-Brazilian Holder whose investment is not registered with the Central Bank and Non-Brazilian Holders resident in a Tax Haven Jurisdiction (i.e., a jurisdiction that does not impose income tax or where the maximum income tax rate is lower than 20% or where internal legislation imposes restrictions on the disclosure of share or investment ownership).
Investors identified in item (1) are subject to favorable tax treatment, as described below.
According to Law No. 10,833, dated December 29, 2003, capital gains realized by a Non-Brazilian Holder from the disposition of “assets located in Brazil” are subject to taxation in Brazil.
Preferred class A shares and common shares qualify as assets located in Brazil, and the disposition of such assets by a Non-Brazilian Holder may be subject to income tax on the gains assessed, in accordance with the rules described below, regardless of where or with whom the transaction is carried out.
There is some uncertainty as to whether American Depositary Shares qualify as “assets located in Brazil” for purposes of Law No. 10,833/03. Arguably, ADSs do not constitute assets located in Brazil and therefore the gains realized by a Non-Brazilian Holder on the disposition of ADSs to another Non-Brazilian resident should not be subject to tax in Brazil. However, we cannot assure you that the Brazilian courts would uphold this interpretation of the definition of “assets located in Brazil” in connection with the taxation of gains realized by a Non-Brazilian Holder on the disposition of ADSs. Consequently, gains on a disposition of ADSs by a Non-Brazilian Holder (whether in a transaction carried out with another Non-Brazilian Holder or a person domiciled in Brazil) may be subject to income tax in Brazil in accordance with the rules applicable to a disposition of shares.

132
Although there are grounds to sustain otherwise, the deposit of preferred class A shares or common shares in exchange for ADSs may be subject to Brazilian income tax if the acquisition cost of the preferred class A shares or common shares is lower than the average price of such shares, which is calculated as either:
(i) the average price per preferred class A share or common share on the Brazilian stock exchange in which the greatest number of such shares were sold on the day of deposit; or
(ii) if no preferred class A shares or common shares were sold on that day, the average price on the Brazilian stock exchange in which the greatest number of preferred class A shares or common shares were sold in the 15 trading sessions immediately preceding such deposit.
The difference between the acquisition cost and the average price of the preferred class A shares or common shares calculated as described above will be considered to be a capital gain subject to taxation. There are grounds to sustain that such taxation is not applicable with respect to investors registered under the rules of Resolution No. 2,689/2000, provided these are not Tax Haven Holders.
The withdrawal of ADSs in exchange for preferred class A shares or common shares is not subject to Brazilian income tax, assuming compliance with applicable regulations regarding the registration of the investment with the Brazilian Central Bank.
For purposes of Brazilian taxation, the income tax rules on gains related to disposition of preferred class A shares or common shares vary depending on:
• the domicile of the Non-Brazilian Holder,
• the method by which such Non-Brazilian Holder has registered its investment with the Central Bank, and/or
• how the disposition is carried out, as described below.
The gain realized as a result of a transaction on a Brazilian stock, future and commodities exchange is the difference between: (i) the amount in Brazilian currency realized on the sale or disposition and (ii) the acquisition cost, without any adjustment for inflation, of the shares sold.
Capital gains realized by a Non-Brazilian Holder on a sale or disposition of preferred class A shares or common shares carried out on a Brazilian stock exchange (which includes the transactions carried out on the organized over-the-counter market) are:
• exempt from income tax when the Non-Brazilian Holder (i) has registered its investment in Brazil with the Central Bank in accordance with Resolution No. 2,689/2000 (a “2,689 holder”) and (ii) is not a Tax Haven Holder; or
• in all other cases, subject to income tax at a 15% rate In these cases, a withholding income tax at a rate of 0.005% of the sale value is levied on the transaction and can be offset with the eventual income tax due on the capital gain.
Any other gains assessed on a sale or disposition of preferred class A shares or common shares that is not carried out on a Brazilian stock exchange are subject to income tax at a 15% rate - except for gains realized by Tax Haven Holders, which are subject to income tax at a 25% rate.
With respect to transactions conducted on the Brazilian non-organized over-the-counter market, with brokerage, a withholding income tax at a rate of 0.005% on the sale value is also levied on the transaction and can be offset against the eventual income tax due on the capital gain. There can be no assurance that the current favorable treatment of 2,689 holders will continue in the future.
In the case of a redemption of preferred class A shares, common shares, or ADSs or a capital reduction by a Brazilian corporation, the positive difference between the amount received by the Non-Brazilian Holder and the acquisition cost of the preferred class A shares, common shares or ADSs redeemed is treated as capital gain
133
derived from the sale or exchange of shares not carried out on a Brazilian stock exchange market and is therefore generally subject to income tax at the rate of 15%, while the 25% rate applies to Tax Haven Holders.
Any exercise of preemptive rights relating to the preferred class A shares or common shares will not be subject to Brazilian taxation. Any gains realized by a Non-Brazilian Holder on the disposition of preemptive rights relating to preferred class A shares or common shares in Brazil will be subject to Brazilian income taxation in accordance with the same rules applicable to the sale or disposition of preferred class A shares or common shares.
Tax on foreign exchange and financial transactions
Foreign exchange transactions. Brazilian law imposes a tax on foreign exchange transactions, or the IOF/Exchange Tax. The IOF/Exchange Tax applies to the conversion of reais into foreign currency and to the conversion of foreign currency into reais. Currently, for most foreign currency exchange transactions, the IOF/Exchange Tax is assessed at a rate of 0.38%, although other rates may apply to particular operations. Starting March 17, 2008, certain foreign exchange transactions are not subject to the IOF/Exchange Tax, namely those relating to share transactions carried out on a stock exchange or in a public offering registered with the CVM, or for the underwriting of shares, provided that the issuer is authorized to trade its shares at the stock exchange and, as long as supported by Decree No 6,391 of the National Monetary Council. The same applies for dividends and interest on shareholders’ equity. The Brazilian government may increase the rate at any time up to 25% of the foreign exchange transaction amount. However, any increase in rates cannot be applied retroactively.
Transactions involving bonds and securities. Brazilian law imposes a tax on transactions involving bonds and securities, or the IOF/Bonds Tax, including those carried out on a Brazilian stock exchange. The rate of IOF/Bonds Tax applicable to transactions involving preferred class A shares, common shares or ADSs is currently zero. The Brazilian government may increase such rate at any time up to 1.5% of the transaction amount per day, but the tax cannot be applied retroactively.
Temporary contribution on financial transactions. Until December 31, 2007, as a general rule, transactions carried out in Brazil that resulted in the transfer of funds from an account maintained with a Brazilian financial institution were subject to the temporary contribution on financial transactions, or the CPMF Tax, which was levied at a rate of 0.38% on any bank account withdrawals.
However, as of January 1, 2008, the CPMF Tax is no longer in force and is not applicable to any transaction carried out after that date. The Brazilian government may attempt to reestablish the CPMF Tax after February 2008, by submitting a new proposal to the Brazilian Congress. In the event the CPMF Tax is reestablished, it will apply only after a period of 90 days has elapsed after enactment of the respective introductory legislation (“vacatio legis”) and only with regard to prospective triggering events.
Other Brazilian taxes. There are no Brazilian inheritance, gift or succession taxes applicable to the ownership, transfer or disposition of preferred class A shares, common shares or ADSs by a Non-Brazilian Holder, except for gift and inheritance taxes which are levied by some states of Brazil on gifts made or inheritances bestowed by a Non-Brazilian Holder to individuals or entities resident or domiciled within such states in Brazil. There are no Brazilian stamp, issue, registration, or similar taxes or duties payable by holders of preferred class A shares or common shares or American Depositary Shares.
U.S. federal income tax considerations
This summary does not purport to be a comprehensive description of all the U.S. federal income tax consequences of the acquisition, holding or disposition of the preferred class A shares, common shares or American Depositary Shares. This summary applies to U.S. holders, as defined below, who hold their preferred class A shares, common shares or American Depositary Shares as capital assets and does not apply to special classes of holders, such as:
• certain financial institutions,
• insurance companies,
134
• dealers in securities or foreign currencies,
• tax-exempt organizations,
• securities traders who elect to account for their investment in preferred class A shares, common shares or American Depository Shares on a mark-to-market basis,
• persons holding preferred class A shares, common shares or American Depositary Shares as part of hedge, straddle, conversion or other integrated financial transaction for tax purposes,
• holders whose functional currency for U.S. federal income tax purposes is not the U.S. dollar,
• partnerships or other holders treated as “pass-through entities” for U.S. federal income tax purposes,
• persons subject to the alternative minimum tax, or
• persons owning, actually or constructively, 10% or more of our voting shares.
This discussion is based on the Internal Revenue Code of 1986, as amended to the date hereof, administrative pronouncements, judicial decisions and final, temporary and proposed Treasury Regulations, all as in effect on the date hereof. These authorities are subject to differing interpretations and may be changed, perhaps retroactively, so as to result in U.S. federal income tax consequences different from those discussed below. There can be no assurance that the U.S. Internal Revenue Service (the “IRS”) will not challenge one or more of the tax consequences discussed herein or that a court will not sustain such a challenge in the event of litigation. This summary does not address any aspect of state, local or non-U.S. tax law.
HOLDERS SHOULD CONSULT THEIR TAX ADVISORS WITH REGARD TO THE APPLICATION OF THE U.S. FEDERAL INCOME TAX LAWS TO THEIR PARTICULAR SITUATIONS AS WELL AS ANY TAX CONSEQUENCES ARISING UNDER THE LAWS OF ANY STATE, LOCAL OR NON-U.S. TAXING JURISDICTION.
This discussion is also based, in part, on representations of the depositary and the assumption that each obligation in the deposit agreement and any related agreement will be performed in accordance with its terms.
As used herein, the term “U.S. holder” means a beneficial owner of preferred class A shares, common shares, or American Depositary Shares that is, for U.S. federal income tax purposes:
• a citizen or resident alien individual of the United States,
• a corporation created or organized in or under the laws of the United States or of any political subdivision thereof, or
• otherwise subject to U.S. federal income taxation on a net income basis with respect to the preferred class A shares, common shares, or American Depositary Shares.
The term U.S. holder also includes certain former citizens of the United States.
The U.S. federal income tax treatment of a partner in a partnership (or any other entity classified as a “pass-through entity” for U.S. federal income tax purposes) that holds preferred class A shares, common shares or American Depositary Shares generally will depend on such partner’s particular circumstances and on the activities of the partnership. Partners in such partnerships (or other pass-through entities) should consult their own tax advisors.
In general, for U.S. federal income tax purposes, holders of American depositary receipts evidencing American Depositary Shares will be treated as the beneficial owners of the preferred class A shares or common shares represented by those American Depositary Shares. Deposits and withdrawals of preferred class A shares or common shares by holders in exchange for American Depositary Shares will not result in the realization of gain or loss for U.S. federal income tax purposes.

135
Taxation of dividends. The gross amount of a distribution paid on American Depositary Shares, preferred class A shares or common shares, including distributions paid in the form of payments of interest on capital for Brazilian tax purposes, out of our current or accumulated earnings and profits (as determined for U.S. federal income tax purposes) will be taxable to you as foreign source dividend income and will not be eligible for the dividends-received deduction allowed to corporate shareholders under U.S. federal income tax law. The amount of any such distribution will include the amount of Brazilian withhholding taxes, if any, withheld on the amount distributed. To the extent that a distribution exceeds our current and accumulated earnings and profits, such distribution will be treated as a nontaxable return of capital to the extent of your basis in the American Depositary Shares, preferred class A shares or common shares, as the case may be, with respect to which such distribution is made, and thereafter as a capital gain.
You will be required to include dividends paid in reais in income in an amount equal to their U.S. dollar value calculated by reference to an exchange rate in effect on the date such distribution is received by the depositary, in the case of American Depositary Shares, or by you, in the case of common shares or preferred class A shares. If the depositary or you do not convert such reais into U.S. dollars on the date they are received, it is possible that you will recognize foreign currency loss or gain, which would be ordinary loss or gain, when the reais are converted into U.S. dollars. If you hold American Depositary Shares, you will be considered to receive a dividend when the dividend is received by the depositary.
Subject to certain exceptions for short-term and hedged positions, the U.S. dollar amount of dividends received by certain noncorporate taxpayers, including individuals, prior to January 1, 2011 with respect to the American Depositary Shares will be subject to taxation at a maximum rate of 15% if the dividends are “qualified dividends.” Dividends paid on the American Depositary Shares will be treated as qualified dividends if (i) the American Depositary Shares are readily tradable on an established securities market in the United States and (ii) the Company was not, in the year prior to the year in which the dividend was paid, and is not, in the year in which the dividend is paid, a passive foreign investment company (“PFIC”). The American Depositary Shares are listed on the New York Stock Exchange and will qualify as readily tradable on an established securities market in the United States so long as they are so listed. Based on Vale’s audited financial statements and relevant market and shareholder data, Vale believes that it was not treated as a PFIC for U.S. federal income tax purposes with respect to its 2006 or 2007 taxable year. In addition, based on Vale’s audited financial statements and its current expectations regarding the value and nature of its assets, the sources and nature of its income, and relevant market and shareholder data, Vale does not anticipate becoming a PFIC for its 2008 taxable year.
Based on existing guidance, it is not entirely clear whether dividends received with respect to the preferred class A shares and common shares will be treated as qualified dividends (and therefore whether such dividends will qualify for the maximum rate of taxation of 15%), because the preferred class A shares and common shares are not themselves listed on a U.S. exchange. In addition, the U.S. Treasury has announced its intention to promulgate rules pursuant to which holders of American Depositary Shares, preferred class A shares or common stock and intermediaries through whom such securities are held will be permitted to rely on certifications from issuers to establish that dividends are treated as qualified dividends. Because such procedures have not yet been issued, it is not clear whether we will be able to comply with them. Holders of American Depositary Shares, preferred class A shares and common shares should consult their own tax advisors regarding the availability of the reduced dividend tax rate in the light of their own particular circumstances.
Subject to generally applicable limitations and restrictions, you will be entitled to a credit against your United States federal income tax liability, or a deduction in computing your U.S. federal taxable income, for Brazilian income taxes withheld by us. You must satisfy minimum holding period requirements to be eligible to claim a foreign tax credit for Brazilian taxes withheld on dividends. The limitation on foreign taxes eligible for credit is calculated separately for specific classes of income. For this purpose dividends paid by us on our shares will generally constitute “passive income” (or, for some holders, “financial services income”). Foreign tax credits may not be allowed for withholding taxes imposed in respect of certain short-term or hedged positions in securities or in respect of arrangements in which a U.S. holder’s expected economic profit is insubstantial. U.S. holders should consult their own tax advisors concerning the implications of these rules in light of their particular circumstances.
Taxation of capital gains. Upon a sale or exchange of preferred class A shares, common shares or American Depositary Shares, you will recognize a capital gain or loss for U.S. federal income tax purposes equal to the difference, if any, between the amount realized on the sale or exchange and your adjusted tax basis in the preferred class A shares, common shares or American Depositary Shares. This gain or loss will be long-term capital gain or loss if your holding period in the preferred class A shares, common shares or American Depositary Shares exceeds one year. The net amount of long-term capital gain recognized by individual U.S. holders prior to January 1, 2011

136
generally is subject to taxation at a maximum rate of 15%. Your ability to use capital losses to offset income is subject to limitations.
Any gain or loss will be U.S. source gain or loss for U.S. foreign tax credit purposes. Consequently, if a Brazilian withholding tax is imposed on the sale or disposition of American Depositary Shares, preferred class A shares or common shares, and you do not receive significant foreign source income from other sources you may not be able to derive effective U.S. foreign tax credit benefits in respect of such Brazilian withholding tax. You should consult your own tax advisor regarding the application of the foreign tax credit rules to your investment in, and disposition of, American Depositary Shares, preferred class A shares or common shares.
If a Brazilian tax is withheld on the sale or disposition of shares, the amount realized by a U.S. holder will include the gross amount of the proceeds of such sale or disposition before deduction of the Brazilian tax. See Item 10. Additional information—Taxation—Brazilian tax considerations.
Information reporting and backup withholding. Information returns may be filed with the Internal Revenue Service in connection with distributions on the preferred class A shares, common shares or American Depositary Shares and the proceeds from their sale or other disposition. You may be subject to United States backup withholding tax on these payments if you fail to provide your taxpayer identification number or comply with certain certification procedures or otherwise establish an exemption from backup withholding. If you are required to make such a certification or to establish such an exemption, you generally must do so on IRS Form W-9.
The amount of any backup withholding from a payment to you will be allowed as a credit against your U.S. federal income tax liability and may entitle you to a refund, provided that the required information is timely furnished to the Internal Revenue Service.
DOCUMENTS ON DISPLAY
We are subject to the information requirements of the Securities Exchange Act of 1934, as amended, and accordingly file reports and other information with the SEC. Reports and other information filed by us with the SEC may be inspected and copied at the public reference facilities maintained by the SEC at 100 F Street, N.E., Washington, D.C. 20549. You can obtain further information about the operation of the Public Reference Room by calling the SEC at 1-800-SEC-0330. You may also inspect Vale’s reports and other information at the offices of the New York Stock Exchange, 11 Wall Street, New York, New York 10005, on which Vale’s American Depositary Shares are listed. Our SEC filings are also available to the public from the SEC’s website at http://www.sec.gov. For further information on obtaining copies of Vale’s public filings at the New York Stock Exchange, you should call (212) 656-5060. We also file financial statements and other periodic reports with the CVM.
Item 11. Quantitative and qualitative disclosures about market risk
RISK MANAGEMENT
We consider the effective management of risk a key objective to support our growth strategy and financial flexibility. In furtherance of this objective, the board of directors has established an enterprise risk management policy and a risk management committee. Our risk management policy is designed to promote an effective risk management system and to ensure that enterprise-level risks are reported at least quarterly to the risk management committee. The risk management committee assists our executive officers in overseeing and reviewing information regarding our enterprise risk management activities and framework, including the significant policies, procedures and practices employed to manage risk. In 2008, the members of the risk management committee are: Fabio de Oliveira Barbosa, Chief Financial Officer, Murilo Ferreira, Executive Officer (Nickel, Marketing & Sales of Copper and Aluminum), Guilherme Cavalcanti, Corporate Finance Director, and Jennifer Maki, Vale Inco Chief Financial Officer. One position on the risk management committee, previously held by Gabriel Stoliar who was Executive Officer (Planning and Business Development), is currently vacant.
We address some market risks through the use of derivative instruments. Considering the nature of our business and operations, the principal market risks we face are:

137
• interest rate risk,
• exchange rate risk, and
• product price risk.
We hedge our market risk only when considered necessary to support our corporate strategy or to maintain our target level of financial flexibility. Our risk management activities are conducted in accordance with the risk management policy, which generally prohibits speculative trading and requires diversification of transactions and counterparties. We monitor and evaluate our overall position regularly in order to evaluate financial results and impact on our cash flow. We also periodically review the credit limits and creditworthiness of our hedging counterparties.
We recognize all derivatives on our balance sheet at fair value, and the gain or loss in fair value is included in current earnings (in accordance with SFAS 133 – “Accounting for Derivative Financial Instruments and Hedging Activities,” as amended by SFAS 137 and SFAS 138). The asset (liability) balances at December 31, 2007 and 2006 and the movement in fair value of derivative financial instruments are shown in the following table.
Gold
Interestrates
(LIBOR) CurrenciesAluminumproducts Copper Nickel Platinum Total
(US$ million)
Fair value at January 1, 2006 ........... US$(45) US$(4) US$– US$(210) US$1 US$(1) US$– US$(259) Gain (loss) recognized upon
consolidation of Vale Inco ......... – 4 9 – (364) 62 (22) (311) Financial settlement ......................... 19 2 (6) 102 – (87) – 30 Unrealized gains (losses)
in the year .................................... (23) 4 (19) (187) 65 42 2 (116) Effect of exchange rate changes....... (4) – – (23) – – – (27) Unrealized gain (loss) at
December 31, 2006...................... US$(53) US$6 US$(16) US$(318) US$(298) US$16 US$(20) US$(683)
Fair value at January 1, 2007 ........... US$(53) US$6 US$(16) US$(318) US$(298) US$16 US$(20) US$(683) Financial settlement ......................... 33 (6) (284) 112 240 (38) 13 70 Unrealized gains (losses)
in the year .................................... (7) (6) 860 153 (129) 63 (17) 917 Effect of exchange rate changes....... (9) 1 71 (45) (1) 1 – 18 Unrealized gain (loss)
December 31, 2007...................... US$(36) US$(5) US$631 US$(98) US$(188) US$42 US$(24) US$322
We are exposed to interest rate risk on our outstanding borrowings and on future debt issuances. Our floating
rate debt consists principally of U.S. dollar borrowings related to trade finance and loans from commercial banks and multilateral organizations and real borrowings related to the debentures and the property and services acquisition financing issued in the local market. In general, our non- real currency floating rate debt is principally subject to changes in the London Interbank Offered Rate in U.S. dollars (USD LIBOR). Consequently, fluctuations in the USD LIBOR may adversely impact our cash flows. To mitigate the effects of interest rate volatility we take advantage of natural hedges allowed by the positive correlation between U.S. dollar floating interest rates and metals prices. When natural hedges are not present, we may opt to realize the same effect with the aid of financial instruments. Our floating rate debt denominated in reais is mainly subject to changes in the CDI (Interbank Deposit Certificate), benchmark interest rate in the Brazilian domestic market, and TJLP, the Brazilian long-term interest rate.
The following table sets forth our floating and fixed rate long-term debt, categorized by local and foreign currency, and as a percentage of our total long-term debt portfolio at the dates indicated, including loans from unrelated parties, except for accrued charges and translation adjustments, as reflected in our consolidated financial statements.

138
At December 31,
2006 2007 (US$ million, except percentages) Floating rate debt:
Real-denominated ...................................................................................... 3,125 14.5% 5,071 27.4% Denominated in other currencies ............................................................... 10,924 50.5 6,272 33.8
Fixed rate debt: Real-denominated ...................................................................................... 21 0.1 1 0 Denominated in other currencies ............................................................... 7,543 34.9 7,180 38.8
Subtotal .................................................................................................. 21,613 100.0 18,525 100.0 Translation adjustments(1) .................................................................... 48 – – – Accrued charges..................................................................................... 172 – 331 –
Total ....................................................................................................... 21,833 – 18,856 –
(1) Adjustment due to accounting conversion method, which entails converting all assets and liabilities into U.S. dollars at the prevailing exchange rate at each balance sheet date or the first available exchange rate if a rate on December 31 is not available.
The following table provides information about our debt obligations as of December 31, 2007. It presents the principal cash flows and related weighted average interest rates of these obligations by expected maturity date. Weighted average variable interest rates are based on the applicable reference rate at December 31, 2007. Actual cash flows of these debt obligations are denominated mainly in U.S. dollars or reais, as indicated.
Weighted average interest
rate(1)(2) 2008 2009 2010 2011 2012 To 2036 Total
Fair value cash flow at 12/31/07(3)
US$-denominated (%) (US$ million) Fixed rate
Bonds ............................ 6.89% – – – – 400 6,279.9 6,679.9 6,929.9 Loans............................. 5.56% 14.3 7.4 3.1 1.6 0.1 28.1 54.6 54.6 Securitization Notes ...... 5.75% 53.0 55.2 57.5 30.0 32.5 30.0 258.2 258.2
Floating Rate Loans............................. 5.56% 202.2 291.5 296.6 477.3 217.1 557.7 2,042.4 2,170.1 Trade Finance ............... 5.25% 5.0 – 1,250.0 2,025.0 375.0 400.0 4,055.0 4,315.1
Subtotal ...................... 274.6 354.1 1,607.1 2,533.8 1,024.7 7,295.7 13,090.1 13,727.8 Real-denominated Fixed Rate Loans .............. 10.92% – – – – – 1.3 1.3 1.3 Floating Rate Loans .......... 10.92% 587.0 29.8 876.7 29.8 29.8 3,281.7 4,834.9 4,834.9
Subtotal.......................... 587.0 29.8 876.7 29.8 29.8 3,283.0 4,836.2 4,836.2 Denominated in other currencies Fixed Rate Loan................ 8.61% 47.2 4.5 5.9 14.4 1.8 114.7 188.4 188.4 Floating Rate Loan............ 5.92% 9.3 8.3 7.9 7.7 4.0 50.9 88.1 88.1
Subtotal.......................... 56.5 12.8 13.8 22.1 5.8 165.6 276.5 276.5 No maturity ....................... – – – – – 322.3 322.3 322.3
Total............................... 918.1 396.7 2,497.7 2,585.8 1,060.3 11,066.5 18,525.1 19,162.8
(1) Weighted average interest rates do not take into account the effect of the derivatives. (2) Weighted average variable interest rates are based on the applicable reference rate at December 31, 2007. (3) Includes only long-term debt obligations.
Primarily to hedge the exposure arising from our real floating rate debt, we have entered into cross-currency
interest rate derivative transactions. Our interest rate derivatives portfolio consists of interest rate swaps to convert real floating rate exposures to U.S.-dollar fixed and floating rate exposures.
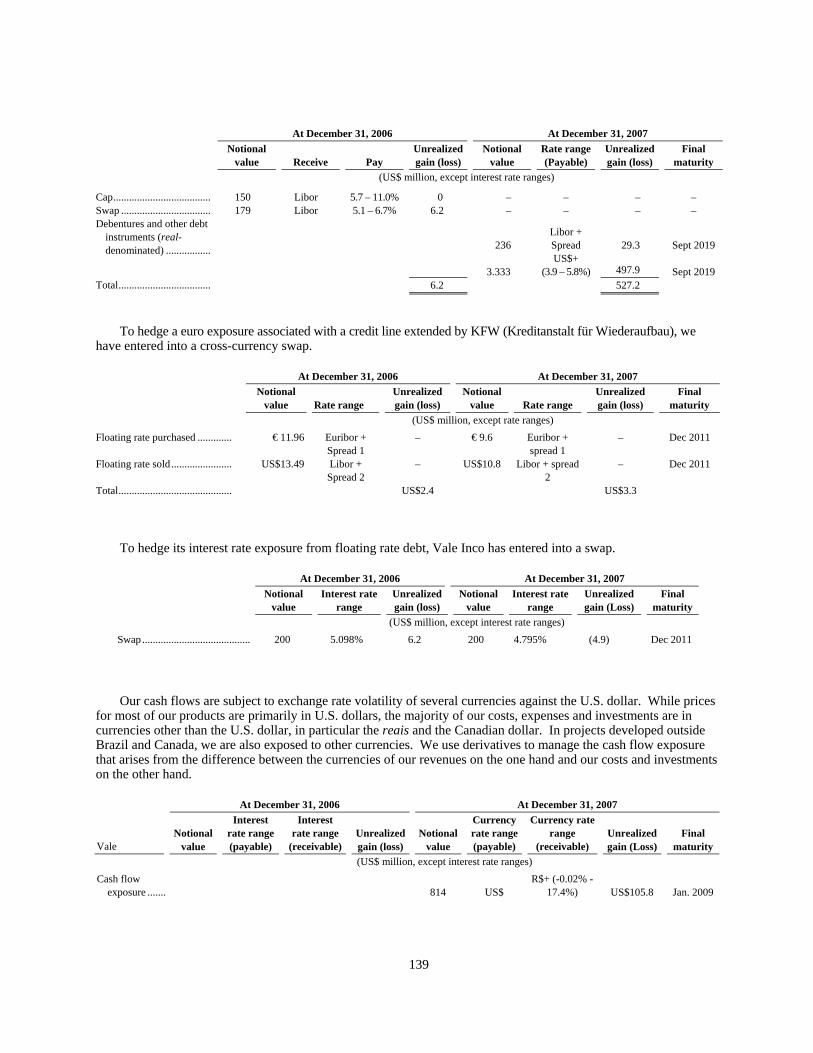
139
At December 31, 2006 At December 31, 2007
Notional
value Receive Pay Unrealized gain (loss)
Notional value
Rate range (Payable)
Unrealized gain (loss)
Final maturity
(US$ million, except interest rate ranges)
Cap..................................... 150 Libor 5.7 – 11.0% 0 – – – – Swap .................................. 179 Libor 5.1 – 6.7% 6.2 – – – –
236 Libor + Spread 29.3 Sept 2019
Debentures and other debt instruments (real-denominated) .................
3.333 US$+
(3.9 – 5.8%) 497.9 Sept 2019 Total................................... 6.2 527.2
To hedge a euro exposure associated with a credit line extended by KFW (Kreditanstalt für Wiederaufbau), we have entered into a cross-currency swap.
At December 31, 2006 At December 31, 2007
Notional value Rate range
Unrealized gain (loss)
Notional value Rate range
Unrealized gain (loss)
Final maturity
(US$ million, except rate ranges) Floating rate purchased ............. € 11.96 Euribor +
Spread 1 – € 9.6 Euribor +
spread 1 – Dec 2011
Floating rate sold....................... US$13.49 Libor + Spread 2
– US$10.8 Libor + spread 2
– Dec 2011
Total........................................... US$2.4 US$3.3
To hedge its interest rate exposure from floating rate debt, Vale Inco has entered into a swap.
At December 31, 2006 At December 31, 2007
Notional
value Interest rate
range Unrealized gain (loss)
Notional value
Interest rate range
Unrealized gain (Loss)
Final maturity
(US$ million, except interest rate ranges) Swap ......................................... 200 5.098% 6.2 200 4.795% (4.9) Dec 2011
Our cash flows are subject to exchange rate volatility of several currencies against the U.S. dollar. While prices for most of our products are primarily in U.S. dollars, the majority of our costs, expenses and investments are in currencies other than the U.S. dollar, in particular the reais and the Canadian dollar. In projects developed outside Brazil and Canada, we are also exposed to other currencies. We use derivatives to manage the cash flow exposure that arises from the difference between the currencies of our revenues on the one hand and our costs and investments on the other hand.
At December 31, 2006 At December 31, 2007
Vale Notional
value
Interest rate range (payable)
Interest rate range
(receivable) Unrealized gain (loss)
Notional value
Currency rate range (payable)
Currency rate range
(receivable) Unrealized gain (Loss)
Final maturity
(US$ million, except interest rate ranges) Cash flow exposure ....... 814 US$
R$+ (-0.02% - 17.4%) US$105.8 Jan. 2009

140
At December 31, 2006 At December 31, 2007
Vale Inco Notional
value Average
price Unrealized gain (loss)
Notional value
Price range
Unrealized gain (loss)
Final maturity
(US$ million, average price and notional amount in millions of local currency noted) Chinese yuan forward purchase contracts ........................ 83 0.129 0.1 – – – – Australian dollar forward purchase contracts ........................ 80 0.716 5.3 – – – – Euro forward purchase contracts........................................ 55 1.237 5.0 – – – – Pounds sterling forward purchase contracts ........................ 1 1.766 0.2 – – – – Total................................................. 10.6 –
In connection with the acquisition of Inco, we used derivative instruments to minimize the effects of fluctuations in the exchange rate between the Canadian dollar and the U.S. dollar, and hedged part of our expenditure relating to the acquisition. The outstanding Canadian-dollar derivative transactions at December 31, 2006 are shown in the table below. These derivative transactions were settled on January 3, 2007, together with the acquisition of the remaining shares of Inco.
At December 31, 2006 At December 31, 2007
Notional
value Price
Range Unrealized gain (loss)
Notional value
Rate Range
Unrealized gain (loss)
Final maturity
(US$ million, except rate ranges) CAD forward purchase contracts................ 2,053 1.13-1.16 (28.5) – – – –
Product price risk
We are exposed to various market risks relating to the volatility of world market prices for the following products:
• iron ore and iron ore pellets, which represented 44.3% of our 2007 gross consolidated revenues;
• nickel, which represented 30.3% of our 2007 gross consolidated revenues;
• aluminum products, which represented 8.2% of our 2007 gross consolidated revenues;
• copper products, which represented 6.0% of our 2007 gross consolidated revenues;
• PGMs and other precious metals, which represented 1.3% of our 2007 gross consolidated revenues; and
• other products.
We hedge certain product price risk. Currently, our derivatives transactions include nickel forward purchase and sale contracts, aluminum forward contracts and options, copper options, as well as positions in gold, platinum, natural gas and fuel derivative instruments. Our risk management policy with respect to product price risk has been to settle all commodity derivatives contracts in cash without physical delivery of product. We do not enter into derivative transactions to hedge exposure from iron ore and iron ore pellets. We also do not enter into derivative transactions to hedge risk from kaolin, manganese ore or ferroalloys.

141
Nickel
We do not generally use derivative instruments to hedge our exposure to fluctuations in nickel prices. However, we do enter into LME forward purchase contracts with respect to fixed-price nickel contracts, in order to maintain exposure to nickel price risk. The purchases of concentrate, cathode or other nickel metal for use as feed in our processing facilities create price risk since the feed price is generally fixed before the refined nickel is available for sale. We enter into LME sell contracts to match the pricing on the sale to the pricing of the purchase. The following table sets forth certain information with respect to our nickel derivatives portfolio at December 31, 2006 and 2007.
At December 31, 2006 At December 31, 2007
Quantity Average
Price Unrealized gain (loss) Quantity
Price Range
Unrealized gain (loss)
Final maturity
(metric tons)
(US$ per metric ton)
(US$ million)
(metric tons)
(US$ per metric ton)
(US$ million)
Forward purchase contracts ........ 6.780 30,283 19.6 8.229 19,950-46,300 (37.4) Dec. 2009 Forward sales contracts............... 996 31,580 (3.4) 3.072 25,565-32,890 15.9 Apr. 2008 Total ............................................ 16.2 (21.5)
A substantial portion of our forward purchase contracts are offset by fixed price customer contracts. For accounting purposes, we treated the fixed price customer contracts as derivatives and the unrealized gain as at December 31, 2007 was $40 million ($22 million loss at December 31, 2006).
In addition to the above, as at December 31, 2007, we had outstanding contracts to purchase intermediate nickel and copper which have a provisional pricing settlement based on commodity indices. For accounting purposes, we treated the provisional pricing aspect of the contracts as embedded derivatives. The net unrealized gain on such embedded derivatives was $23 million at December 31, 2007 ($nil at December 31, 2006).
Aluminum
In order to manage the risk associated with fluctuations in aluminum prices, in 2006 we engaged in hedging transactions involving put and call options, as well as forward contracts. The use of derivative instruments had the purpose of mitigating the volatility of our cash flow generated by our future production of aluminum to ensure the payment of the service of the debt to finance the acquisition of Inco. The following table sets forth certain information with respect to our aluminum derivatives portfolio at December 31, 2006 and 2007.
At December 31, 2006 At December 31, 2007
Notional
value Price range
Unrealized gain (loss)
Notional value
Price range
Unrealized gain (loss)
Final maturity
(metric tons
of Al) (US$ per
metric ton) (US$ million)(metric tons
of Al) (US$ per metric
ton) (US$
million) Puts purchased......................... 564,100 1,375-2,500 54.8 354,000 2,000-2,550 8.1 Dec. 2008 Forwards sold.......................... 81,000 1,502-2,650 (21.2) 48,000 2,200-2,750 (5.2) Dec. 2008 Calls sold................................. 582,100 1,565-2,815 (144.8) 354,000 2,300-3,150 (28.9) Dec. 2008 Other instruments.................... 120,000 1,400-1,700 (130.4) 69,000 1,400-1,700 (54.7) Dec. 2008 Total ........................................ (241.6) (80.7)
Our subsidiary Albras has an embedded energy derivative with an unrealized loss of US$191.3 million as of December 31, 2007 and US$180.9 million as of December 31, 2006.
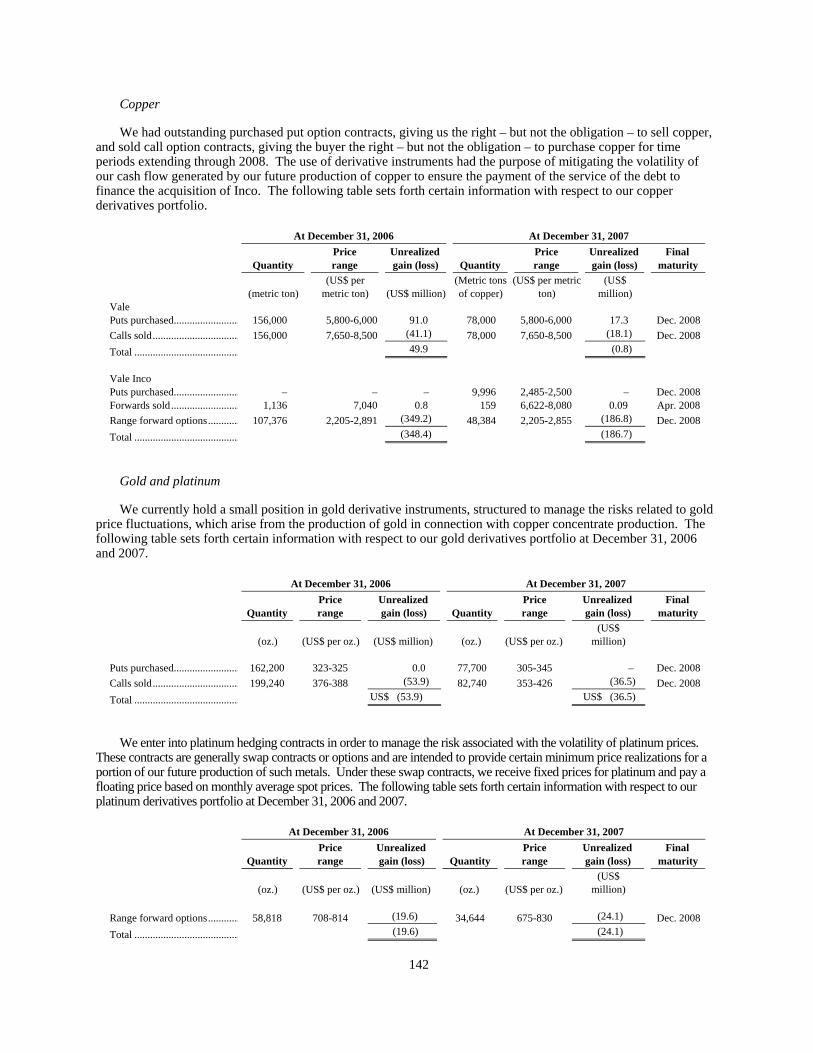
142
Copper
We had outstanding purchased put option contracts, giving us the right – but not the obligation – to sell copper, and sold call option contracts, giving the buyer the right – but not the obligation – to purchase copper for time periods extending through 2008. The use of derivative instruments had the purpose of mitigating the volatility of our cash flow generated by our future production of copper to ensure the payment of the service of the debt to finance the acquisition of Inco. The following table sets forth certain information with respect to our copper derivatives portfolio.
At December 31, 2006 At December 31, 2007
Quantity Price range
Unrealized gain (loss) Quantity
Price range
Unrealized gain (loss)
Final maturity
(metric ton) (US$ per
metric ton) (US$ million)(Metric tons of copper)
(US$ per metric ton)
(US$ million)
Vale Puts purchased......................... 156,000 5,800-6,000 91.0 78,000 5,800-6,000 17.3 Dec. 2008 Calls sold................................. 156,000 7,650-8,500 (41.1) 78,000 7,650-8,500 (18.1) Dec. 2008 Total ........................................ 49.9 (0.8) Vale Inco Puts purchased......................... – – – 9,996 2,485-2,500 – Dec. 2008 Forwards sold.......................... 1,136 7,040 0.8 159 6,622-8,080 0.09 Apr. 2008 Range forward options............ 107,376 2,205-2,891 (349.2) 48,384 2,205-2,855 (186.8) Dec. 2008 Total ........................................ (348.4) (186.7)
Gold and platinum
We currently hold a small position in gold derivative instruments, structured to manage the risks related to gold price fluctuations, which arise from the production of gold in connection with copper concentrate production. The following table sets forth certain information with respect to our gold derivatives portfolio at December 31, 2006 and 2007.
At December 31, 2006 At December 31, 2007
Quantity Price range
Unrealized gain (loss) Quantity
Price range
Unrealized gain (loss)
Final maturity
(oz.) (US$ per oz.) (US$ million) (oz.) (US$ per oz.) (US$
million) Puts purchased......................... 162,200 323-325 0.0 77,700 305-345 – Dec. 2008 Calls sold................................. 199,240 376-388 (53.9) 82,740 353-426 (36.5) Dec. 2008 Total ........................................ US$ (53.9) US$ (36.5)
We enter into platinum hedging contracts in order to manage the risk associated with the volatility of platinum prices. These contracts are generally swap contracts or options and are intended to provide certain minimum price realizations for a portion of our future production of such metals. Under these swap contracts, we receive fixed prices for platinum and pay a floating price based on monthly average spot prices. The following table sets forth certain information with respect to our platinum derivatives portfolio at December 31, 2006 and 2007.
At December 31, 2006 At December 31, 2007
Quantity Price range
Unrealized gain (loss) Quantity
Price range
Unrealized gain (loss)
Final maturity
(oz.) (US$ per oz.) (US$ million) (oz.) (US$ per oz.) (US$
million) Range forward options............ 58,818 708-814 (19.6) 34,644 675-830 (24.1) Dec. 2008 Total ........................................ (19.6) (24.1)
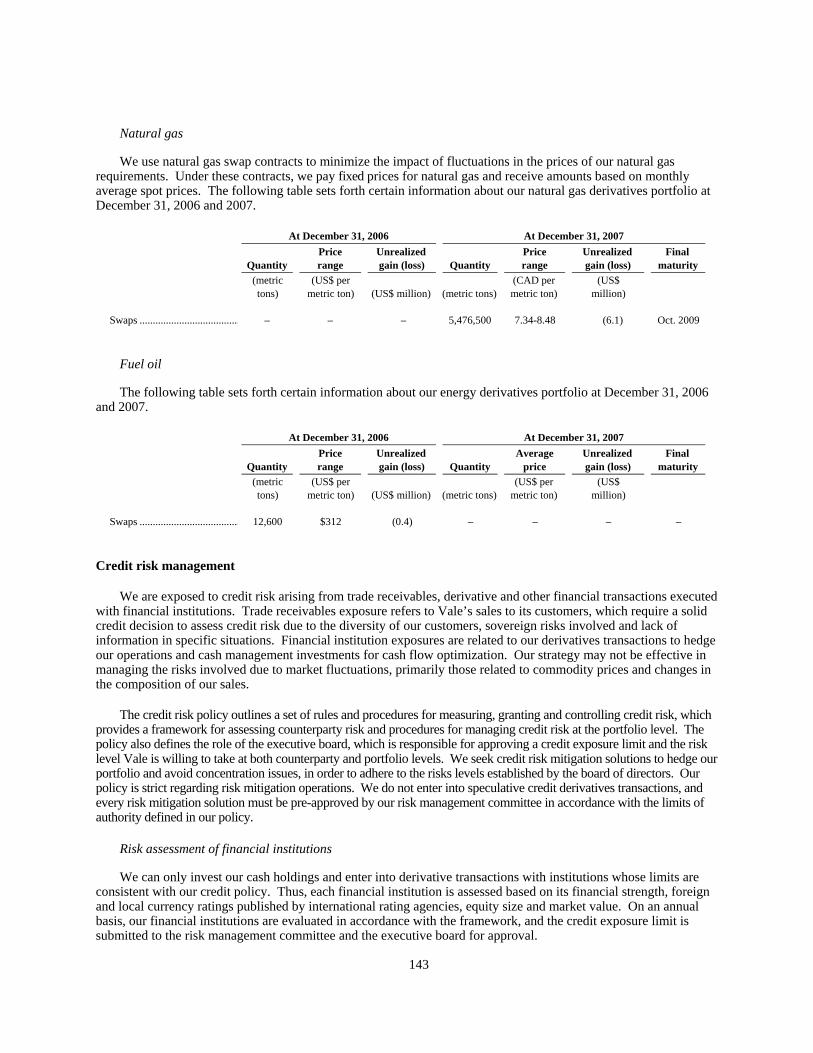
143
Natural gas
We use natural gas swap contracts to minimize the impact of fluctuations in the prices of our natural gas requirements. Under these contracts, we pay fixed prices for natural gas and receive amounts based on monthly average spot prices. The following table sets forth certain information about our natural gas derivatives portfolio at December 31, 2006 and 2007.
At December 31, 2006 At December 31, 2007
Quantity Price range
Unrealized gain (loss) Quantity
Price range
Unrealized gain (loss)
Final maturity
(metric tons)
(US$ per metric ton) (US$ million) (metric tons)
(CAD per metric ton)
(US$ million)
Swaps ...................................... – – – 5,476,500 7.34-8.48 (6.1) Oct. 2009
Fuel oil
The following table sets forth certain information about our energy derivatives portfolio at December 31, 2006 and 2007.
At December 31, 2006 At December 31, 2007
Quantity Price range
Unrealized gain (loss) Quantity
Average price
Unrealized gain (loss)
Final maturity
(metric tons)
(US$ per metric ton) (US$ million) (metric tons)
(US$ per metric ton)
(US$ million)
Swaps ...................................... 12,600 $312 (0.4) – – – –
Credit risk management
We are exposed to credit risk arising from trade receivables, derivative and other financial transactions executed with financial institutions. Trade receivables exposure refers to Vale’s sales to its customers, which require a solid credit decision to assess credit risk due to the diversity of our customers, sovereign risks involved and lack of information in specific situations. Financial institution exposures are related to our derivatives transactions to hedge our operations and cash management investments for cash flow optimization. Our strategy may not be effective in managing the risks involved due to market fluctuations, primarily those related to commodity prices and changes in the composition of our sales.
The credit risk policy outlines a set of rules and procedures for measuring, granting and controlling credit risk, which provides a framework for assessing counterparty risk and procedures for managing credit risk at the portfolio level. The policy also defines the role of the executive board, which is responsible for approving a credit exposure limit and the risk level Vale is willing to take at both counterparty and portfolio levels. We seek credit risk mitigation solutions to hedge our portfolio and avoid concentration issues, in order to adhere to the risks levels established by the board of directors. Our policy is strict regarding risk mitigation operations. We do not enter into speculative credit derivatives transactions, and every risk mitigation solution must be pre-approved by our risk management committee in accordance with the limits of authority defined in our policy.
Risk assessment of financial institutions
We can only invest our cash holdings and enter into derivative transactions with institutions whose limits are consistent with our credit policy. Thus, each financial institution is assessed based on its financial strength, foreign and local currency ratings published by international rating agencies, equity size and market value. On an annual basis, our financial institutions are evaluated in accordance with the framework, and the credit exposure limit is submitted to the risk management committee and the executive board for approval.

144
The credit policy only allows Vale to perform financial transactions with institutions that hold at least an A- foreign currency credit rating. In the event the rating of the institution is capped by the sovereign ceiling, the foreign currency rating of the country in which the institution is incorporated has to be at least equal to Brazil’s rating, and the local currency rating of the institution has to be at least A-. Each credit limit is monitored according to the current market value, ratings and an established threshold. If the market value or rating approach the threshold, the financial institution is subject to a new evaluation and the credit limits are reviewed.
Customer risk assessment
Vale’s credit policy establishes a set of rules under which the executive board approves an Annual Exposure Limit for trade receivables, representing the maximum credit exposure Vale is permitted to take. This exposure limit is applied to each of our business units. For those companies in which Vale is the controlling shareholder, the limits are established according to such policy. For the other companies, Vale’s executive board recommends a credit limit in line with Vale’s policy.
Customers are evaluated considering their credit quality as measured by the strength of their financial statements, company size, past payment performance, country risk, ratings and market value, if available. A credit limit is established for each customer, which is approved according to our credit policy framework and the limits of authority therein. Credit limits are monitored according to the current exposure and customer creditworthiness and are subject to a new evaluation if they are not consistent with the established parameters by the date of approval. An annual review for each credit limit is mandatory under our credit policy.
Item 12. Description of securities other than equity securities
Not applicable.
PART II
Item 13. Defaults, dividend arrearages and delinquencies
None.
Item 14. Material modifications to the rights of security holders and use of proceeds
None.
Item 15. Controls and procedures
EVALUATION OF DISCLOSURE CONTROLS AND PROCEDURES
Our management, with the participation of our chief executive officer and chief financial officer, has evaluated the effectiveness of our disclosure controls and procedures as of December 31, 2007. There are inherent limitations to the effectiveness of any system of disclosure controls and procedures, including the possibility of human error and the circumvention or overriding of the controls and procedures. Accordingly, even effective disclosure controls and procedures can only provide reasonable assurance of achieving their control objectives. Based upon our evaluation, our chief executive officer and chief financial officer have concluded that our disclosure controls and procedures were effective to provide reasonable assurance that information required to be disclosed by us in the reports filed or submitted under the Exchange Act is recorded, processed, summarized and reported, within the time periods specified in the applicable rules and forms, and that it is accumulated and communicated to our management, including our chief executive officer and chief financial officer, as appropriate to allow timely decisions regarding required disclosure.
MANAGEMENT’S REPORT ON INTERNAL CONTROL OVER FINANCIAL REPORTING
The management of Vale is responsible for establishing and maintaining adequate internal control over financial reporting. The company’s internal control over financial reporting is a process designed to provide reasonable
145
assurance regarding the reliability of financial reporting and the preparation of financial statements for external purposes in accordance with generally accepted accounting principles. The company’s internal control over financial reporting includes those policies and procedures that: (i) pertain to the maintenance of records that, in reasonable detail, accurately and fairly reflect the transactions and dispositions of the assets of the company; (ii) provide reasonable assurance that transactions are recorded as necessary to permit preparation of financial statements in accordance with generally accepted accounting principles, and that receipts and expenditures of the company are being made only in accordance with authorizations of management and directors of the company; and (iii) provide reasonable assurance regarding prevention or timely detection of unauthorized acquisition, use, or disposition of the company’s assets that could have a material effect on the financial statements.
Because of its inherent limitations, internal control over financial reporting may not prevent or detect misstatements. Also, projections of any evaluation of the effectiveness to future periods are subject to the risk that controls may become inadequate because of changes in conditions, and that the degree of compliance with the policies or procedures may deteriorate.
Vale’s management has assessed the effectiveness of the company’s internal control over financial reporting as of December 31, 2007 based on the criteria established in “Internal Control – Integrated Framework” issued by the Committee of Sponsoring Organizations of the Treadway Commission (“COSO”). Based on such assessment and criteria, Vale’s management has concluded that the company’s internal control over financial reporting was effective as of December 31, 2007.
The effectiveness of Vale’s internal control over financial reporting as of December 31, 2007 has been audited by PricewaterhouseCoopers Auditores Independentes, an independent registered public accounting firm, as stated in their report which appears herein.
CHANGES IN INTERNAL CONTROLS
Our management identified no change in our internal control over financial reporting during our fiscal year ended December 31, 2007 that has materially affected or is reasonably likely to materially affect our internal control over financial reporting.
Item 16A. Audit committee financial expert
As described in Item 16D of this Form 20-F, in lieu of establishing an independent audit committee, we have given our fiscal council the necessary powers to qualify for the exemption from the audit committee requirements set forth in Exchange Act Rule 10A-3(c)(3). Our board of directors has determined that one of the members of our fiscal council, Mr. Aníbal Moreira dos Santos, is an audit committee financial expert. Mr. Moreira dos Santos meets the applicable independence requirements for fiscal council membership under Brazilian law. He also meets the New York Stock Exchange independence requirements that would apply to audit committee members in the absence of our reliance on the exemption set forth in Exchange Act Rule 10A-3(c)(3).
Item 16B. Code of ethics
Vale has adopted a code of ethical conduct that applies to all board members, executive officers and employees, including the chief executive officer, the chief financial officer and the principal accounting officer. We have posted this code of ethical conduct on our website, at: http://www.vale.com (under English Version, Investors; Corporate Governance; Code of Ethics). Copies of our code of ethical conduct may be obtained without charge by writing to us at the address set forth on the front cover of this Form 20-F. We have not granted any implicit or explicit waivers from any provision of our code of ethical conduct since its adoption.

146
Item 16C. Principal accountant fees and services
PRINCIPAL ACCOUNTANT FEES
PricewaterhouseCoopers Auditores Independentes billed the following fees to us for professional services in 2006 and 2007.
Year ended December 31, 2006 2007 (US$ thousand) Audit fees .................................................................................................................................................... 5,072 7,385 Audit-related fees........................................................................................................................................ 1,295 614 Tax fees ....................................................................................................................................................... 91 327 All other fees............................................................................................................................................... 14 386
Total fees..................................................................................................................................................... 6,472 8,712
“Audit Fees” are the aggregate fees billed by PricewaterhouseCoopers for the audit of our consolidated and
annual financial statements and reviews of interim financial statements and attestation services that are provided in connection with statutory and regulatory filings or engagements. “Audit-Related Fees” are fees charged by PricewaterhouseCoopers for assurance and related services that are reasonably related to the performance of the audit or review of our financial statements and are not reported under “Audit Fees.” In 2006 and 2007, Audit-Related Fees consisted primarily of fees for services related to Vale’s preparation for the assessment required under Section 404 of the Sarbanes-Oxley Act. “Tax Fees” relate primarily to the review of the annual federal tax return and review of accuracy of the tax computation procedures with respect to income tax and sales taxes.
AUDIT COMMITTEE PRE-APPROVAL POLICIES AND PROCEDURES
Our fiscal council currently serves as our audit committee for purposes of the Sarbanes-Oxley Act of 2002. Pursuant to a written policy, our fiscal council requires management to obtain the fiscal council’s approval before engaging any external auditor to provide any audit or permitted non-audit services to us or our consolidated subsidiaries.
Under the policy, the fiscal council has pre-approved a detailed list of services based on detailed proposals from our auditors up to specified monetary limits set forth in the policy. Services that are not listed or that exceed the specified limits must be separately pre-approved by the fiscal council. The fiscal council is provided with reports on the services provided under the policy on a periodic basis, and the list of pre-approved services is updated periodically. The policy also sets forth a list of prohibited services. Internal control related services must be specifically pre-approved by the fiscal council.
Item 16D. Exemptions from the listing standards for audit committees
Under the listed company audit committee rules of the NYSE and the SEC, we are required to comply with Exchange Act Rule 10A-3, which requires that we either establish an audit committee composed of members of the board of directors that meets specified requirements or designate and empower our fiscal council to perform the role of the audit committee in reliance on the exemption set forth in Exchange Act Rule 10A-3(c) (3). We have designated and empowered our fiscal council to perform this role. In our assessment, our fiscal council will be able to act independently and to satisfy the other requirements of Exchange Act Rule 10A-3.
Item 16E. Purchases of equity securities by the issuer and affiliated purchasers
Not applicable.
147
PART III
Item 17. Financial statements
We have responded to Item 18 in lieu of responding to this Item.
Item 18. Financial statements
Reference is made to pages F-1 to F-47.
Item 19. Exhibits
Exhibit Number 1 Bylaws of Companhia Vale do Rio Doce, as amended August 30, 2007, incorporated by reference
to our report on Form 6-K furnished to the SEC on September 4, 2007
8 List of Subsidiaries
12.1 Certification of Chief Executive Officer of Vale pursuant to Rules 13a-14 and 15d-14 under the Securities Exchange Act of 1934
12.2 Certification of Chief Financial Officer of Vale pursuant to Rules 13a-14 and 15d-14 under the
Securities Exchange Act of 1934
13.1 Certification of Chief Executive Officer and Chief Financial Officer of Vale, pursuant to Section 906 of the Sarbanes-Oxley Act of 2002
15.1 Consent of PricewaterhouseCoopers
15.2 Consent of Hoskings Resource Management
15.3 Consent of ASEAMCO Pty Ltd
15.4 Consent of IMC Mining Solutions Pty Ltd
15.5 Consent of MB Mining Consultants
15.6 Consent of Tasman Mining Pty Limited
15.7 Consent of SRK Consulting
15.8 Consent of Snowden
The amount of long-term debt securities of Vale or its subsidiaries authorized under any individual outstanding agreement does not exceed 10% of Vale’s total assets on a consolidated basis. Vale hereby agrees to furnish the SEC, upon its request, a copy of any instruments defining the rights of holders of its long-term debt or of its subsidiaries for which consolidated or unconsolidated financial statements are required to be filed.
148
GLOSSARY
Alumina Aluminum oxide. It is the main component of bauxite, and extracted from bauxite ore in a chemical refining process. It is the principal raw material in the electro-chemical process from which aluminum is produced.
Anthracite The hardest coal type, which contains a high percentage of fixed carbon and a
low percentage of volatile matter. Anthracite is the highest rank coal and it contains approximately 90% fixed carbon, more than any other form of coal. Anthracite has a semi-metallic luster and is capable of burning with little smoke. Mainly used for metallurgical purposes.
Austenitic stainless steel Steel that contains a significant amount of chromium and sufficient nickel to
stabilize the austenite microstructure, giving to the steel good formability and ductibility and improving its high temperature resistance. On average, austenitic stainless steels usually contain 8-10% nickel. They are used in a wide variety of applications, ranging from consumer products to industrial process equipment, as well as for power generation and transportation equipment, kitchen appliances and many other applications where strength, corrosion and high temperature resistance are required.
Austenitic stainless steel ratio
The ratio of nickel-based stainless steels (austenitic steels) relative to all stainless steels produced.
Bauxite A rock composed primarily of hydrated aluminum oxides. It is the principal
ore of alumina, the raw material from which aluminum is made. Beneficiation A variety of processes whereby extracted ore from mining is reduced to
particles that can be separated into ore-mineral and waste, the former suitable for further processing or direct use.
Coal Coal is a black or brownish-black solid combustible substance formed by the
decomposition of vegetable matter without access to air. The rank of coal, which includes anthracite, bituminous coal (both are called hard coal), subbituminous coal, and lignite, is based on fixed carbon, volatile matter, and heating value.
Cobalt Cobalt is a hard, lustrous, silver-gray metal found in ores, and used in the
preparation of magnetic, wear-resistant, and high-strength alloys (particularly for jet engines and turbines). Its compounds are also used in the production of inks, paints, and varnishes.
Coke Coal that has been processed in a coke oven, for use as a reduction agent in
blast furnaces and in foundries for the purposes of transforming iron ore into pig iron.
Concentration Physical, chemical or biological process to increase the grade of the metal or
mineral of interest. Copper A reddish brown metallic element. Copper is highly conductive, both
thermally and electrically. It is highly malleable and ductile and is easily rolled into sheet and drawn into wire.
149
Copper anode Copper anode is a metallic product of the converting stage of smelting process that is cast into blocks and generally contains 99 percent copper content, which requires further processing to produce refined copper cathodes.
Copper cathode Copper plate with purity higher than or equal to 99.9% that is produced by an
electrolytic process. Copper concentrate Material produced by concentration of copper minerals contained in the
copper ore. It is the raw material used in smelters to produce copper metal. DR Direct reduction. Process that removes oxygen from iron ore by using natural
gas or coal. The resulting product has an iron content of 90-92%. DRI Direct reduced iron. Iron ore lumps or pellets converted by the direct
reduction process, used mainly as a scrap substitute in electric arc furnace steel making.
DWT Deadweight ton. The measurement unit of a vessel’s capacity for cargo, fuel
oil, stores and crew, measured in metric tons of 1,000 kg. A vessel’s total deadweight is the total weight the vessel can carry when loaded to a particular load line.
Electrowon copper cathode Refined copper cathode is a metallic product produced by an electrochemical
process in which copper is recovered by dissolving copper anode in an electrolyte and plating it onto an electrode. Electrowon copper cathodes generally contain 99.99 percent copper content.
Fe unit A measure of the iron content in the iron ore that is equivalent to 1% iron
content in one metric ton of iron ore. Ferritic stainless steel Steel that contains significant amount of chromium, but does not contain
sufficient nickel and/or manganese to stabilize the austenite microstructure. Ferroalloys Ferroalloys are alloys of iron that contain one or more other chemical
elements. These alloys are used to add these other elements into molten metal, usually in steel making. The principal ferroalloys are those of manganese, silicon and chromium.
FOB Free on board. It indicates that the purchaser pays for shipping, insurance and all
the other costs associated with transportation of the goods to their destination. Gold A precious metal sometimes found free in nature, but usually found in
conjunction with silver, quartz, calcite, lead, tellurium, zinc or copper. It is the most malleable and ductile metal, a good conductor of heat and electricity and unaffected by air and most reagents.
Grade The proportion of metal or mineral present in ore or any other host material. Hard metallurgical coal Metallurgical coking coal with the required properties to produce a
stronger/harder metallurgical coke.
150
Hematitinha A lump ore originated from Vale’s Southern System with the coarsest particle size in the range of 6.35 mm to 19 mm diameter, varying from 75 to 90% between different mines and ores, that is only sold in the Brazilian domestic market.
HBI Hot briquetted iron. Direct reduced iron that has been processed into
briquettes. Because DRI may spontaneously combust during transportation, HBI is preferred when the metallic material must be stored or moved.
Iridium A dense, hard, brittle, silvery-white transition metal of the platinum family
that occurs in natural alloys with platinum or osmium. Iridium is used in high-strength alloys that can withstand high temperatures, primarily in high-temperature apparatus, electrical contacts, and as a hardening agent for platinum.
Iron ore pellets Agglomerated ultra-fine iron ore particles of a size and quality suitable
for particular iron making processes. Our iron ore pellets range in size from 8 mm to 18 mm.
Kaolin A fine white aluminum silicate clay derived from rock composed chiefly
of feldspar, which is used as a coating agent, filler, extender and absorbent in the paper, paint, ceramics and other industries.
Lump ore Iron ore or manganese ore with the coarsest particle size in the range of
6.35 mm to 50 mm diameter, but varying slightly between different mines and ores.
Manganese A hard brittle metallic element found primarily in the minerals pyrolusite,
hausmannite and manganate. Manganese is essential to the production of virtually all steels and is important in the production of cast iron.
Metallurgical coal A bituminous hard coal with a quality that allows the production of coke.
Normally used in coke ovens for metallurgical purposes. Methanol An alcohol fuel largely used in the production of chemical and plastic compounds. Mineral deposit(s) or mineralized material(s)
A mineralized body that has been intersected by a sufficient number of closely spaced drill holes and/or underground/surface samples to support sufficient tonnage and grade of metal(s) or mineral(s) of interest to warrant further exploration-development work.
Mineral resource A concentration or occurrence of minerals of economic interest in such form
and quantity that could justify an eventual economic extraction. The location, quantity, grade, geological characteristics and continuity of a mineral resource are known, estimated or interpreted from specific geological evidence through drill holes, trenches and/or outcrops. mineral resources are sub-divided, in order of increasing geological confidence, into Inferred, Indicated and Measured Resources.

151
MK copper concentrate MK copper concentrate, or MK chalcocite copper concentrate, is an intermediate copper product. The smelting process of combined nickel-copper concentrate produces a nickel-copper matte product, which is separated into two streams of intermediate products, including MK chalcocite copper concentrate, for further processing and refining. MK chalcocite copper concentrate, which contains 70-75% copper, is the feedstock material for copper smelter, producing copper anodes.
Nickel A silvery white metal that takes on a high polish. It is hard, malleable, ductile,
somewhat ferromagnetic, and a fair conductor of heat and electricity. It belongs to the iron-cobalt group of metals and is chiefly valuable for the alloys it forms, such as stainless steel and other corrosion-resistant alloys.
Nickel matte An intermediate smelter product that must be further refined to obtain
pure metal. Nickel pig iron A low-grade nickel product, made from lateritic ores, suitable primarily for
use in stainless steel production. Nickel pig iron typically has a nickel grade of 1.5-6% if produced from blast furnaces and 10-25% if produced from electric furnaces, with iron accounting for most of the balance. Nickel pig iron can also contain chrome, manganese, and impurities such as silica, phosphorus, sulphur and carbon.
Ntk Net ton (the weight of the goods being transported excluding the weight of the
wagon) kilometer. Open-pit mining Method of extracting rock or minerals from the earth by their removal from an
open pit. Open-pit mines for extraction of ore are used when deposits of commercially useful minerals or rock are found near the surface; that is, where the overburden (surface material covering the valuable deposit) is relatively thin or the material of interest is structurally unsuitable for underground mining.
Oxides Compounds of oxygen with another element. For example, magnetite is an
oxide mineral formed by the chemical union of iron with oxygen. Palladium A silver-white metal that is ductile and malleable, used primarily in
automobile-emissions control devices, jewelry, electrical and chemical applications.
Pellet feed fines Ultra-fine iron ore (less than 0.15 mm) generated by mining and grinding.
This material is aggregated into iron ore pellets through an agglomeration process.
Phosphate A phosphorous compound, which occurs in natural ores and is used as a raw
material for primary production of fertilizers, animal feeds and detergents. Pig iron Product of smelting iron ore usually with coke and limestone in a blast furnace. Platinum A dense, precious, grey-white transition metal that is ductile and malleable
and occurs in some nickel and copper ores. Platinum is resistant to corrosion and is used in jewelry, laboratory equipment, electrical contacts, dentistry, automobile-emissions control devices, flat panel TVs and hard disk drives.
152
Platinum-group metals (PGMs)
Consist of platinum, palladium, rhodium, ruthenium, osmium and iridium, of which osmium has no industrial application and no economic value, while platinum and palladium have the greatest economic value.
Potash A potassium chloride compound, chiefly KCl, used as simple fertilizer and in
the production of mixture fertilizer. Precious metals Metals valued for their color, malleability, and rarity, with a high economic
value driven not only by their practical industrial use, but also by their role as investments. The widely-traded precious metals are gold, silver, platinum and palladium.
Primary aluminum White metal that is obtained in the electro-chemical process of reduction of
the aluminum oxide. Probable (indicated) reserves Reserves for which quantity and grade and/or quality are computed form
information similar to that used for proven (measured) reserves, but the sites for inspection, sampling and measurement are farther apart or are otherwise less adequately spaced. The degree of assurance, although lower that that for proven (measured) reserves, is high enough to assume continuity between points of observation.
Proven (measured) reserves Reserves for which (a) quantity is computed from dimensions revealed in
outcrops, trenches, working or drill holes; grade and/or quality are computed from the results of detailed sampling and (b) the sites for inspection, sampling and measurement are spaced so closely and the geologic character is so well defined that size, shape, depth and mineral content of reserves are well-established.
Pulverized coal injection (PCI)
Type of coal with specific properties ideal for direct injtection via the tuyeres of blast furnaces. This type of coal does not require any processing or coke making, and can be direct injected into the blast furnaces, replacing lump cokes to be charged from the top of the blast furnaces.
Reserves The part of a mineral deposit that could be economically and legally extracted
or produced at the time of the reserve determination. Rhodium A hard, silvery-white, durable metal that has a high reflectance and is
primarily used in combination with platinum for automobile-emission control devices and as an alloying agent for hardening platinum.
Run-of-mine (ROM) Ore in its natural (unprocessed) state, as mined, without having been crushed. Ruthenium A hard, white metal that can harden platinum and palladium used to make
severe wear-resistant electrical contacts and in other applications in the electronics industry.
Secondary or scrap nickel Stainless steel scrap containing small quantities of nickel. Seaborne market Comprises the total ore trade between countries using ocean bulk vessels. Silver A ductile and malleable metal used in photography, coins and medal
fabrication, and in industrial applications.

153
Sinter feed (also known as fines)
Iron ore fines with particles in the range of 0.15 mm to 6.35 mm diameter. Suitable for sintering.
Sintering The agglomeration of sinter feed, binder and other materials, into a coherent
mass by heating without melting, to be used as metallic charge into a blast furnace.
Slabs The most common type of semi-finished steel. Traditional slabs measure 10
inches thick and 30-85 inches wide (and average approximately 20 feet long), while the output of the recently developed “thin slab” casters is approximately two inches thick. Subsequent to casting, slabs are sent to the hot-strip mill to be rolled into coiled sheet and plate products.
Stainless steel Alloy steel containing at least 10% chromium and with superior corrosion
resistance. It may also contain other elements such as nickel, manganese, niobium, titanium, molybdenum, copper, in order to improve mechanical, thermal properties and service life. It is primarily classified as austenitic (200 and 300 series), ferritic (400 series), martensitic, duplex or precipitation hardening grades.
Stainless steel scrap ratio The ratio of secondary nickel units (either in the form of nickel-bearing,
stainless steel scrap, or in alloy steel, foundry and nickel-based alloy scrap) relative to all nickel units consumed in the manufacture of new stainless steel.
Thermal coal A type of coal that is suitable for energy generation in thermal power stations. Troy ounce One troy ounce equals 31.103 grams. Underground mining Mineral exploitation in which extraction is carried out beneath the
earth’s surface.
154
SIGNATURES
The registrant hereby certifies that it meets all of the requirements for filing on Form 20-F and that it has duly caused and authorized the undersigned to sign this annual report on its behalf.
COMPANHIA VALE DO RIO DOCE
By: /s/ Roger Agnelli Name: Roger Agnelli Title: Chief Executive Officer By: /s/ Fabio de Oliveira Barbosa Name: Fabio de Oliveira Barbosa Title: Chief Financial Officer Date: May 13, 2008

F-1
COMPANHIA VALE DO RIO DOCE INDEX TO CONSOLIDATED FINANCIAL STATEMENTS
Page
Report of Independent Registered Public Accounting Firm F-2
Consolidated Balance Sheets as of December 31, 2007 and 2008 F-3
Consolidated Statements of Income for the years ended December 31, 2007,. 2006 and 2005 F-5
Consolidated Statements of Cash Flows for the years ended December 31, 2007, 2006 and 2005 F-6
Consolidated Statements of Changes in Stockholders’ Equity for the years ended December 31, 2007, 2006 and 2005
F-7
Notes to the Consolidated Financial Statements F-8
Report of Independent Registered Public Accounting Firm
F-2
To the Board of Directors and Stockholders Companhia Vale do Rio Doce
In our opinion, the accompanying consolidated balance sheets and the related consolidated statements of income, of cash flows and of changes in stockholders’ equity present fairly, in all material respects, the financial position of Companhia Vale do Rio Doce and its subsidiaries at December 31, 2007 and 2006, and the results of their operations and their cash flows for each of the three years in the period ended December 31, 2007 in conformity with accounting principles generally accepted in the United States of America. Also in our opinion, the Company maintained, in all material respects, effective internal control over financial reporting as of December 31, 2007, based on criteria established in Internal Control – Integrated Framework issued by the Committee of Sponsoring Organizations of the Treadway Commission (COSO). The Company’s management is responsible for these financial statements, for maintaining effective internal control over financial reporting and for its assessment of the effectiveness of internal control over financial reporting, included in Management’s Report on Internal Control over Financial Reporting appearing under Item 15. Our responsibility is to express opinions on these financial statements and on the Company’s internal control over financial reporting based on our integrated audits (which were integrated audits in 2007 and 2006). We conducted our audits in accordance with the standards of the Public Company Accounting Oversight Board (United States). Those standards require that we plan and perform the audits to obtain reasonable assurance about whether the financial statements are free of material misstatement and whether effective internal control over financial reporting was maintained in all material respects. Our audits of the financial statements included examining, on a test basis, evidence supporting the amounts and disclosures in the financial statements, assessing the accounting principles used and significant estimates made by management, and evaluating the overall financial statement presentation. Our audit of internal control over financial reporting included obtaining an understanding of internal control over financial reporting, assessing the risk that a material weakness exists, and testing and evaluating the design and operating effectiveness of internal control based on the assessed risk. Our audits also included performing such other procedures as we considered necessary in the circumstances. We believe that our audits provide a reasonable basis for our opinions.
As discussed in Note 18 to the consolidated financial statement, the Company changed the manner in which it accounts for defined benefit pension and other retirement plans in 2006.
A company’s internal control over financial reporting is a process designed to provide reasonable assurance regarding the reliability of financial reporting and the preparation of financial statements for external purposes in accordance with generally accepted accounting principles. A company’s internal control over financial reporting includes those policies and procedures that (i) pertain to the maintenance of records that, in reasonable detail, accurately and fairly reflect the transactions and dispositions of the assets of the company; (ii) provide reasonable assurance that transactions are recorded as necessary to permit preparation of financial statements in accordance with generally accepted accounting principles, and that receipts and expenditures of the company are being made only in accordance with authorizations of management and directors of the company; and (iii) provide reasonable assurance regarding prevention or timely detection of unauthorized acquisition, use, or disposition of the company’s assets that could have a material effect on the financial statements.
Because of its inherent limitations, internal control over financial reporting may not prevent or detect misstatements. Also, projections of any evaluation of effectiveness to future periods are subject to the risk that controls may become inadequate because of changes in conditions, or that the degree of compliance with the policies or procedures may deteriorate.
PricewaterhouseCoopers Auditores Independentes
Rio de Janeiro, Brazil February 28, 2008
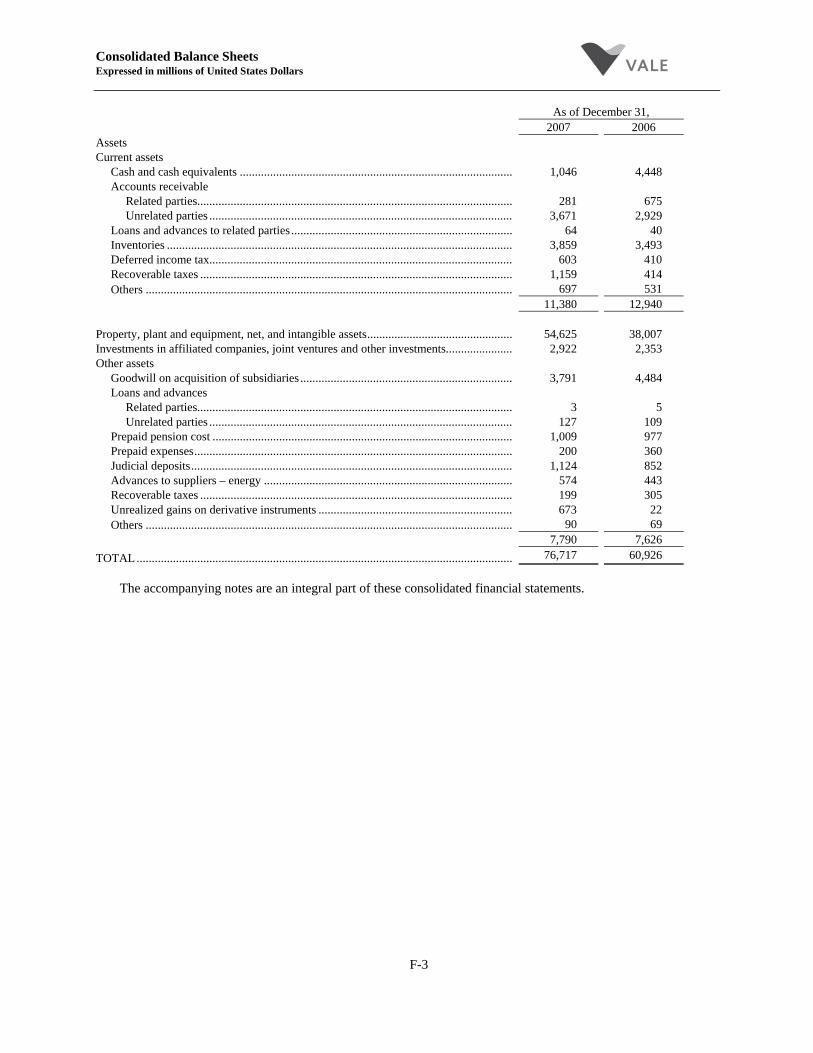
Consolidated Balance Sheets Expressed in millions of United States Dollars
F-3
As of December 31, 2007 2006
Assets Current assets
Cash and cash equivalents .......................................................................................... 1,046 4,448 Accounts receivable
Related parties........................................................................................................ 281 675 Unrelated parties .................................................................................................... 3,671 2,929
Loans and advances to related parties ......................................................................... 64 40 Inventories .................................................................................................................. 3,859 3,493 Deferred income tax.................................................................................................... 603 410 Recoverable taxes ....................................................................................................... 1,159 414 Others ......................................................................................................................... 697 531
11,380 12,940 Property, plant and equipment, net, and intangible assets................................................ 54,625 38,007 Investments in affiliated companies, joint ventures and other investments...................... 2,922 2,353 Other assets
Goodwill on acquisition of subsidiaries ...................................................................... 3,791 4,484 Loans and advances
Related parties........................................................................................................ 3 5 Unrelated parties .................................................................................................... 127 109
Prepaid pension cost ................................................................................................... 1,009 977 Prepaid expenses......................................................................................................... 200 360 Judicial deposits.......................................................................................................... 1,124 852 Advances to suppliers – energy .................................................................................. 574 443 Recoverable taxes ....................................................................................................... 199 305 Unrealized gains on derivative instruments ................................................................ 673 22 Others ......................................................................................................................... 90 69
7,790 7,626 TOTAL............................................................................................................................ 76,717 60,926
The accompanying notes are an integral part of these consolidated financial statements.

Consolidated Balance Sheets Expressed in millions of United States Dollars (Except number of shares)
F-4
As of December 31, 2007 2006
Liabilities and stockholders’ equity Current liabilities
Suppliers ...................................................................................................................... 2,430 2,382 Payroll and related charges .......................................................................................... 734 451 Minimum annual dividends attributed to stockholders ................................................ 2,683 1,494 Current portion of long-term debt – unrelated parties.................................................. 1,249 711 Short-term debt ............................................................................................................ 167 723 Loans from related parties ........................................................................................... 6 25 Provision for income taxes........................................................................................... 1,198 817 Taxes payable and royalties ......................................................................................... 322 149 Employees post retirement benefits ............................................................................. 131 107 Sub-concession ............................................................................................................ 210 – Unrealized losses on derivative instruments ................................................................ 346 – Provisions for asset retirement obligations .................................................................. 64 – Others .......................................................................................................................... 543 453
10,083 7,312
Long-term liabilities Employees post retirement benefits ............................................................................. 2,204 1,841 Long-term debt – unrelated parties .............................................................................. 17,608 21,122 Provisions for contingencies (Note 19 (c)) .................................................................. 2,453 1,641 Unrealized losses on derivative instruments ................................................................ 5 705 Deferred income tax..................................................................................................... 5,725 4,527 Provisions for asset retirement obligations .................................................................. 911 676 Sub-concession ............................................................................................................ 210 – Others .......................................................................................................................... 1,687 618
30,803 31,130 Minority interests.............................................................................................................. 2,555 2,811
Commitments and contingencies (Note 19)
Stockholders’ equity (Note 16) Preferred class A stock – 7,200,000,000 no-par-value shares authorized and
1,919,516,400 issued............................................................................................... 4,953 4,702 Common stock – 3,600,000,000 no-par-value shares authorized and
2,999,797,716 issued............................................................................................... 7,742 3,806 Treasury stock – 30,341,144 preferred and 56,582,040 common shares ..................... (389) (389) Additional paid-in capital ............................................................................................ 498 498 Mandatory convertible notes in common shares .......................................................... 1,288 – Mandatory convertible notes in preferred shares ......................................................... 581 – Other cumulative comprehensive income (deficit) ...................................................... 1,655 (1,004) Undistributed retained earnings ................................................................................... 15,317 9,555 Unappropriated retained earnings ................................................................................ 1,631 2,505
33,276 19,673
TOTAL............................................................................................................................. 76,717 60,926
The accompanying notes are an integral part of these consolidated financial statements.

Consolidated Statements of Income Expressed in millions of United States Dollars (Except per share amounts)
F-5
Year ended December 31, 2007 2006 2005
Operating revenues, net of discounts, returns and allowances Sales of ores and metals.......................................................................................... 28,441 16,511 10,767 Revenues from logistic services.............................................................................. 1,525 1,376 1,216 Aluminum products ................................................................................................ 2,722 2,381 1,408 Other products and services .................................................................................... 427 95 14
33,115 20,363 13,405 Taxes on revenues................................................................................................... (873) (712) (613) Net operating revenues ........................................................................................... 32,242 19,651 12,792
Operating costs and expenses Cost of ores and metals sold ................................................................................... (13,628) (7,946) (4,620) Cost of logistic services .......................................................................................... (853) (777) (705) Cost of aluminum products..................................................................................... (1,705) (1,355) (893) Others ..................................................................................................................... (277) (69) (11)
(16,463) (10,147) (6,229) Selling, general and administrative expenses.......................................................... (1,245) (816) (583) Research and development ..................................................................................... (733) (481) (277) Others ..................................................................................................................... (607) (570) (271)
(19,048) (12,014) (7,360) Operating income......................................................................................................... 13,194 7,637 5,432 Non-operating income (expenses)
Financial income..................................................................................................... 295 327 123 Financial expenses .................................................................................................. (1,592) (1,338) (560) Foreign exchange and monetary gains, net ............................................................. 2,559 529 299 Gain on sale of investments .................................................................................... 777 674 126
2,039 192 (12) Income before income taxes, equity results and minority interests.............................. 15,233 7,829 5,420 Income taxes
Current .................................................................................................................... (3,901) (1,134) (754) Deferred .................................................................................................................. 700 (298) (126)
(3,201) (1,432) (880) Equity in results of affiliates and joint ventures and other investments ....................... 595 710 760 Minority interests......................................................................................................... (802) (579) (459)
Net income................................................................................................................... 11,825 6,528 4,841 Basic and diluted earnings per share
Earnings per preferred share ................................................................................... 2.41 1.35 1.05 Earnings per common share.................................................................................... 2.41 1.35 1.05 Earnings per convertible notes linked to preferred share(*).................................... 3.30 – – Earnings per convertible notes linked to common share(*) .................................... 3.51 – –
(*) Basic earnings per share only as dilution assumes conversion.
The accompanying notes are an integral part of these consolidated financial statements.
Consolidated Statements of Cash Flows Expressed in millions of United States Dollars
F-6
Year ended December 31, 2007 2006 2005
Cash flows from operating activities: Net income ................................................................................................................................................... 11,825 6,528 4,841 Adjustments to reconcile net income to cash provided by operating activities:
Depreciation, depletion and amortization ............................................................................................. 2,186 997 619 Dividends received ................................................................................................................................ 394 516 489 Equity in results of affiliates and joint ventures.................................................................................... (595) (710) (760) Deferred income taxes........................................................................................................................... (700) 298 126 Loss on sale of property, plant and equipment ..................................................................................... 168 106 26 Gain on sale of investments................................................................................................................... (777) (674) (126) Foreign exchange and monetary losses (gains), net.............................................................................. (2,827) (917) (237) Unrealized derivative losses (gains), net............................................................................................... (917 116 101 Minority interests .................................................................................................................................. 802 579 459 Interest payable (receivable), net .......................................................................................................... 102 36 62 Others .................................................................................................................................................... 115 (93) (132)
Decrease (increase) in assets: Accounts receivable .............................................................................................................................. 235 (438) (416) Inventories ............................................................................................................................................. (343) 859 (138) Others .................................................................................................................................................... (292) (12) (639)
Increase (decrease) in liabilities: Suppliers ................................................................................................................................................ 998 (47) 279 Payroll and related charges.................................................................................................................... 170 (86) 40 Income taxes.......................................................................................................................................... 393 84 413 Others .................................................................................................................................................... 75 90 154
Net cash provided by operating activities.................................................................................................... 11,012 7,232 5,161 Cash flows from investing activities:
Loans and advances receivable Related parties
Additions .................................................................................................................................. (33) (18) (27) Repayments .............................................................................................................................. 10 11 115
Others .............................................................................................................................................. 1 (16) – Judicial deposits..................................................................................................................................... (125) (78) (59) Additions to investments ....................................................................................................................... (324) (107) (103) Additions to property, plant and equipment.......................................................................................... (6,651) (4,431) (3,977) Proceeds from disposal of investments ................................................................................................. 1,042 837 126 Proceeds from disposals of property, plant and equipment .................................................................. – 49 16 Cash used to acquire subsidiaries, net of cash acquired........................................................................ (2,926) (13,201) (737) Net cash used in investing activities ..................................................................................................... (9,006) (16,954) (4,646)
Cash flows from financing activities: Short-term debt, additions............................................................................................................................ 4,483 4,912 763 Short-term debt, repayments........................................................................................................................ (5,040) (4,233) (849) Loans
Related parties Additions......................................................................................................................................... 259 10 10 Repayments..................................................................................................................................... (273) (50) (43)
Issuances of long-term debt Related parties ....................................................................................................................................... – 14 15 Others .................................................................................................................................................... 7,212 21,993 1,757
Treasury stock.............................................................................................................................................. – (301) – Repayments of long-term debt
Others .................................................................................................................................................... (11,130) (7,635) (884) Proceeds from mandatory convertible notes................................................................................................ 1,869 – – Interest attributed to stockholders................................................................................................................ (1,875) (1,300) (1,300) Dividends to minority interest ..................................................................................................................... (714) (65) – Net cash provided by (used in) financing activities .................................................................................... (5,209) 13,345 (531) Increase (decrease) in cash and cash equivalents ........................................................................................ (3,203) 3,623 (16) Effect of exchange rate changes on cash and cash equivalents................................................................... (199) (216) (192) Cash and cash equivalents, beginning of period.......................................................................................... 4,448 1,041 1,249
Cash and cash equivalents, end of period.................................................................................................... 1,046 4,448 1,041 Cash paid during the period for:
Interest on short-term debt .................................................................................................................... (49) (9) (9) Interest on long-term debt ..................................................................................................................... (1,289) (565) (243) Income tax ............................................................................................................................................. (3,284) (586) (481)
Non-cash transactions Interest capitalized................................................................................................................................. (78) (126) (86) Issuance of preferred stock for the acquisition of Caemi, net of cash acquired ................................... – (2,552) –
The accompanying notes are an integral part of these consolidated financial statements.

Consolidated Statements of Changes in Stockholders’ Equity Expressed in millions of United States Dollars (Except number of shares and per share amounts)
F-7
Year ended December 31, 2007 2006 2005
Preferred class A stock (including twelve special shares) Beginning of the period............................................................................................................... 4,702 2,150 1,176 Capital increase ........................................................................................................................... – 2,552 – Transfer from undistributed retained earnings ............................................................................ 251 – 974 End of the period ......................................................................................................................... 4,953 4,702 2,150
Common stock Beginning of the period............................................................................................................... 3,806 3,806 2,121 Transfer from undistributed retained earnings ............................................................................ 3,936 – 1,685 End of the period ......................................................................................................................... 7,742 3,806 3,806
Treasury stock Beginning of the period............................................................................................................... (389) (88) (88) Acquisitions................................................................................................................................. – (301) – End of the period ......................................................................................................................... (389) (389) (88)
Additional paid-in capital Beginning and end of the period ................................................................................................. 498) 498 498
Mandatory convertible notes in common shares Beginning and end of the period ................................................................................................. – – – Change in the period.................................................................................................................... 1,288 – –
1,288 – – Mandatory convertible notes in preferred shares
Beginning and end of the period ................................................................................................. – – – Change in the period.................................................................................................................... 581 – –
581 – – Other cumulative comprehensive income (deficit)
Cumulative translation adjustments Beginning of the period ........................................................................................................ (1,628) (2,856) (3,869) Change in the period............................................................................................................. 2,968 1,228 1,013 End of the period .................................................................................................................. 1,340 (1,628) (2,856)
Unrealized gain on available-for-sale securities Beginning of the period ........................................................................................................ 271 127 95 Change in the period............................................................................................................. (60) 144 32 End of the period .................................................................................................................. 211 271 127
Superavit (deficit) accrued pension plan Beginning of the period ........................................................................................................ 353 460 – Change in the period............................................................................................................. (278) (107) – End of the period .................................................................................................................. 75 353 –
Cash flow hedge Beginning of the period ........................................................................................................ – – – Change in the period............................................................................................................. 29 – – End of the period .................................................................................................................. 29 – –
Total other cumulative comprehensive income (deficit) ................................................................... 1,655 (1,004) (2,729) Undistributed retained earnings
Beginning of the period............................................................................................................... 9,555 4,357 4,143 Transfer from unappropriated retained earnings ......................................................................... 9,949 5,198 2,873 Transfer to capital stock .............................................................................................................. (4,187) – (2,659) End of the period ......................................................................................................................... 15,317 9,555 4,357
Unappropriated retained earnings Beginning of the period............................................................................................................... 2,505 3,983 3,315
Net income............................................................................................................................ 11,825 6,528 4,841 Interest attributed to mandatory convertible debt Preferred class A stock .......................... (22) – –
Common stock............................................................................................................... (45) – – Dividends and interest attributed to stockholders
Preferred class A stock .................................................................................................. (1,049) (1,098) (469) Common stock............................................................................................................... (1,634) (1,710) (831)
Appropriation to reserves ..................................................................................................... (9,949) (5,198) (2,873) End of the period ......................................................................................................................... 1,631 2,505 3,983
Total stockholders’ equity .................................................................................................................. 33,276 19,673 11,977
Preferred class A stock (including twelve special shares) ................................................................. 1,919,516,400 1,919,516,400 1,662,910,956 Common stock.................................................................................................................................... 2,999,797,716 2,999,797,716 2,999,797,716 Treasury stock
Beginning of the period............................................................................................................... (86,927,072) (56,627,872) (56,629,844) Acquisitions................................................................................................................................. – (30,299,200) – Sales............................................................................................................................................. 3,888 – 1,972 End of the period ......................................................................................................................... (86,923,184) (86,927,072) (56,627,872)
4,832,390,932 4,832,387,044 4,606,080,800 Dividends and interest attributed to stockholders (per share): Preferred class A stock (including twelve special shares) ................................................................. 0.56 0.58 0.29 Common stock.................................................................................................................................... 0.56 0.58 0.29
The accompanying notes are an integral part of these consolidated financial statements.

Notes to the Consolidated Financial Statements
F-8
1 The Company and its operation
Companhia Vale do Rio Doce (Vale) is a limited liability company, duly organized and existing under the laws of the Federative Republic of Brazil. The operations are carried out through Vale and our subsidiary companies, joint ventures and affiliates, and mainly consist of mining, non-ferrous metal production and logistics, as well as energy, aluminum and steel activities.
On December 31, 2007 the main operating subsidiaries we consolidate are as follows:
Subsidiary % ownership % voting capital
Head office location Principal activity
Alumina do Norte do Brasil S.A. – Alunorte (“Alunorte”)................................ 57.03 59.02 Brazil Alumina Alumínio Brasileiro S.A. – Albras (“Albras”)....................................... 51.00 51.00 Brazil Aluminum CADAM S.A (CADAM).............................. 61.48 100.00 Brazil Kaolin CVRD International S.A............................... 100.00 100.00 Swiss Trading CVRD Overseas Ltd. .................................... 100.00 100.00 Cayman Islands Trading Vale Inco Limited(1) .................................... 100.00 100.00 Canada Nickel Ferrovia Centro-Atlântica S.A. ..................... 99.99 100.00 Brazil Logistics Minerações Brasileiras Reunidas S.A. – MBR(5).............................. 92.99 92.99 Brazil Iron ore Mineração Onça Puma Ltda 100.00 100.00 Brazil Nickel Pará Pigmentos S.A. (“PPSA”)..................... 86.17 85.57 Brazil Kaolin PT International Nickel Indonesia Tbk (“PT Inco”)(2) .................................... 61.16 61.16 Indonesia Nickel Rio Doce Manganês S.A............................... 100.00 100.00 Brazil Manganese and Ferroalloys Rio Doce Manganèse Europe – RDME ............ 100.00 100.00 France Ferroalloys Rio Doce Manganese Norway – RDMN .......... 100.00 100.00 Norway Ferroalloys Valesul Aumínio S.A.(3) .............................. 100.00 100.00 Brazil Aluminum Vale Australia Pty Ltd.(4)............................. 100.00 100.00 Australia Coal
(1) Subsidiary consolidated as from October 2006 (Note 13); (2) Through Vale Inco Limited; (3) Subsidiary consolidated as from July 2006 (Note 13); (4) Subsidiary consolidated as from april de 2007 (Note 6); and (5) See Note 6. 2 Basis of consolidation
All majority-owned subsidiaries in which we have both share and management control are consolidated. All significant intercompany accounts and transactions are eliminated. Our variable interest entities in which we are the primary beneficiary are consolidated. Investments in unconsolidated affiliates and joint ventures are accounted for by the equity method (Note 13).
We evaluate the carrying value of our listed investments relative to publicly available quoted market prices. If the quoted market price is below book value, and such decline is considered other than temporary, we write-down our equity investments to quoted market value.

Notes to the Consolidated Financial Statements
F-9
We define joint ventures as businesses in which we and a small group of other partners each participate actively in the overall entity management, based on a shareholders agreement. We define affiliates as businesses in which we participate as a minority stockholder but with significant influence over the operating and financial policies of the investee.
Our investments in hydroelectric projects are made via consortium contracts under which we have an undivided interest in assets and are liable for our proportionate share of liabilities and expenses, which are based on our proportionate share of power output. We do not have joint liability for any obligations, and all our recorded costs, income, assets and liabilities relate to the entities within our group. Since there is no separate legal entity for the project, there are no separate financial statements, income tax return, net income or shareholders’ equity. As confirmed by our external legal counsel, Brazilian corporate law explicitly states that no separate legal entity arises from consortium contract. Accordingly, we recognize our proportionate share of costs and our undivided interest in assets relating to hydroelectric projects (Note 12).
3 Summary of significant accounting policies
The preparation of financial statements requires management to make estimates and assumptions that affect the reported amounts of assets and liabilities and disclosure of contingent assets and liabilities at the date of the financial statements and the reported amounts of revenues and expenses during the reporting period. Estimates are used for, but not limited to, the selection of useful lives of property, plant and equipment, provisions necessary for contingent liabilities, fair values assigned to assets and liabilities acquired in business combinations, income tax valuation allowances, employee post retirement benefits and other similar evaluations. Actual results could differ from those estimates.
(a) Basis of presentation
We have prepared our consolidated financial statements in accordance with accounting principles generally accepted in the United States of America (“US GAAP”), which differ in certain respects from the accounting practices adopted in Brazil that we use in preparing our statutory financial statements.
As from July 1, 1997, when we concluded that the Brazilian economy had ceased to be highly inflationary, we changed our functional currency from the reporting currency (U.S. Dollars) to the Brazil currency (Brazilian Reais), for Brazilian operations and extensions thereof. Accordingly, we translated the U.S. Dollar amounts of non-monetary assets and liabilities into Reais at the current exchange rate, and those amounts became the new accounting bases for such assets and liabilities.
For the Brazilian operations, the U.S. Dollar amounts for the periods and years presented have been remeasured (translated) from the Brazilian currency amounts in accordance with the criteria set forth in Statement of Financial Accounting Standards (SFAS) 52—“Foreign Currency Translation” (SFAS 52).
We have remeasured all assets and liabilities into U.S. Dollars at the exchange rate at each balance sheet date (2007- R$1.7713 and 2006- R$2.1342 to US$1.00 or the first available exchange rate if exchange on December 31, was not available), and all accounts in the statements of income (including amounts exchange gains and losses on assets and liabilities denominated in foreign currency) at the average rates prevailing during the period. The translation gain or loss resulting from this remeasurement process is included in the cumulative translation adjustments account in stockholders’ equity.
The net exchange transaction gain (loss) included in our statement of income was US$1,639, US$452 and US$227 in 2007, 2006 and 2005, respectively, included within the line “Foreign exchange and monetary gains (losses), net.”
Notes to the Consolidated Financial Statements
F-10
(b) Business combinations
We adopt the procedures determined by SFAS 141—“Business Combinations” to recognize acquisitions of interests in other companies. The method of accounting used in our business combination transactions is the “purchase method”, which requires that acquirers reasonably determine the fair value of the identifiable assets and liabilities of acquired companies, individually, in order to determine the goodwill paid on the purchase to be recognized as an intangible asset. On the acquisition of assets, which include the rights to mine reserves of natural resources, the establishment of values for these assets includes the determination of fair values on purchased reserves, which are classified in the balance sheet as “Property, plant and equipment.”
Through December 31, 2001, goodwill was amortized in a systematic manner over the periods estimated to be benefited. As required by SFAS 142—“Goodwill and Other Intangible Assets” from January 1, 2002 goodwill resulting from the acquisitions is no longer amortized, but is tested for impairment at least annually and reduced to fair value to the extent any such impairment is identified.
(c) Inventories
Inventories are stated at the average cost of purchase or production, lower than replacement or realizable values. We record allowances for slow moving or obsolete inventories when considered appropriate, reflecting our periodic assessment of recoverability.
We classify proven and probable reserve quantities attributable to stockpiled inventory as inventory and account for them as processed when they are removed from the mine. These reserve quantities are not included in the total proven and probable reserve quantities used in the units of production, depreciation, depletion and amortization calculations.
(d) Property, plant and equipment
Property, plant and equipment are recorded at cost, including interest cost incurred during the construction of major new facilities. We compute depreciation on the straight-line basis at annual average rates which take into consideration the useful lives of the assets, as follows: 3.03% for railroads, 3.65% for buildings, 3.78% for installations and 3.25% for mining development costs and 7.30% for other equipment. Expenditures for maintenance and repairs are charged to operating costs and expenses as incurred.
We capitalize the costs of developing major new ore bodies or expanding the capacity of operating mines and amortize these to operations on the unit-of-production method based on the total probable and proven quantity of ore to be recovered. Exploration costs are expensed. After economic viability of mining activities is established, subsequent development costs are capitalized. We capitalize mine development costs as from the time the development phase commences.
(e) Available-for-sale equity securities
Equity securities classified as “available-for-sale” are recorded in accordance with SFAS 115 “Accounting for Certain Investments in Debt and Equity Securities.” Accordingly, we exclude unrealized holding gains and losses, net of taxes, if applicable, from income and recognize them, net of tax effects, as a separate component of stockholders’ equity until realized.
(f) Revenues and expenses
Revenues are recognized when title has transferred to the customer or services are rendered. Revenue from exported products is recognized when such products are loaded on board the ship. Revenue from products sold in the domestic market is recognized when delivery is made to the customer. Revenue from transportation services is recognized when the service order has been fulfilled. Expenses and costs are recognized on the accrual basis.

Notes to the Consolidated Financial Statements
F-11
(g) Asset retirement obligations
Retirement of long-lived assets is accounted for in accordance with SFAS 143—“Accounting for Asset Retirement Obligations.” Our retirement obligations consist primarily of estimated closure costs, the initial measurement of which is recognized as a liability discounted to present values and subsequently accreted through earnings. An asset retirement cost equal to the initial liability is capitalized as part of the related asset’s carrying value and depreciated over the asset’s useful life.
(h) Compensated absences
We fully accrue the employees’ compensation liability for vacations vested during the year.
(i) Income taxes
The deferred tax effects of tax loss carryforwards and temporary differences have been recognized in the consolidated financial statements pursuant to SFAS 109—“Accounting for Income Taxes.” A valuation allowance is made when we believe that it is more likely than not that tax assets will not be fully recoverable in the future.
(j) Statement of cash flows
Cash flows relating to overnight financing and investment are reported net. Short-term investments that have a ready market and original maturities to us, when purchased, of 90 days or less are classified as “Cash equivalents.”
(k) Earnings per share
Earnings per share are computed by dividing net income by the weighted average number of common and preferred shares outstanding during the period.
(l) Interest attributable to stockholders
Brazilian corporations are permitted to distribute interest attributable to stockholders’ equity. The calculation is based on the stockholders’ equity amounts as stated in the statutory accounting records and the interest rate applied may not exceed the long-term interest rate (TJLP) determined by the Brazilian Central Bank. Also, such interest may not exceed 50% of net income for the year nor 50% of retained earnings plus revenue reserves.
The amount of interest attributed to stockholders is deductible for purposes of taxes on income. Accordingly, the benefit to us, as opposed to making a dividend payment, is a reduction in our income tax charge. Income tax of 15% is withheld on behalf of the stockholders relative to the interest distribution. Under Brazilian law, interest attributable to stockholders is considered as part of the annual minimum dividend (Note 16). This notional interest distribution is treated for accounting purposes as a deduction from stockholders’ equity in a manner similar to a dividend.
(m) Derivatives and hedging activities
We apply SFAS 133—“Accounting for Derivative Financial Instruments and Hedging Activities”, as amended by SFAS 137, SFAS 138 and SFAS 149. Those standards require that we recognize all derivative financial instruments as either assets or liabilities on our balance sheet and measure such instruments at fair value. Changes in the fair value of derivatives are recorded in each period in current earnings or in other comprehensive income, in the latter case depending on whether a transaction is designated as an effective hedge and has been effective during the period.
(n) Comprehensive income
We present comprehensive income as part of the Statement of Changes in Stockholders’ Equity, in compliance with SFAS 130—“Reporting Comprehensive Income”, net of taxes.
Notes to the Consolidated Financial Statements
F-12
(o) Pension and other post retirement benefits
We sponsor private pension and other post retirement benefits for our employees which are actuarially determined and recognized as an asset or liability or both depending on the funded or unfunded status of each plan in accordance with SFAS 158—“Employees’ Accounting for Defined Benefit Pension and Other Post retirement Plans.” This Statement, issued in 2006, amended previously issued statements. The cost of our defined benefit and prior service costs or credits that arise during the period and are not components of net periodic benefit costs are recorded in other cumulative comprehensive income (deficit).
(p) Removal of waste materials to access mineral deposits
Stripping costs (the costs associated with the removal of overburden and other waste materials) incurred during the development of a mine, before production commences, are capitalized as part of the depreciable cost of developing the property. Such costs are subsequently amortized over the useful life of the mine based on proven and probable reserves.
Post-production stripping costs are recorded as cost of production when incurred.
4 Recently-issued accounting pronouncements
In December 2007, the Financial Accounting Standard (FASB) issued SFAS 160, which clarifies that a no controlling interest in a subsidiary is an ownership interest in the consolidated entity that should be reported as equity in the consolidated financial statements. SFAS 160 is effective for fiscal years, and interim periods within those fiscal years, beginning on or after December 15, 2008 (that is, in the case of Vale, January 1, 2009). Earlier adoption is prohibited. SFAS 160 shall be applied prospectively as of the beginning of the fiscal year in which this Statement is initially applied, except for the presentation and disclosure requirements. The presentation and disclosure requirements shall be applied retrospectively for all periods presented. The Company is currently evaluating the impact of such new pronouncement in its consolidated financial statements but believes that it will not generate a material impact on the Company’s consolidated results of operations or financial position.
In December 2007, the FASB issued SFAS 141(R), “Statement of Financial Accounting Standards No. 141 (revised 2007).” SFAS 141(R) retains the fundamental requirements in SFAS 141 that the acquisition method of accounting (which SFAS 141 called the purchase method) be used for all business combinations and for an acquirer to be identified for each business combination. SFAS 141(R) defines the acquirer as the entity that obtains control of one or more businesses in the business combination and establishes the acquisition date as the date that the acquirer achieves control. SFAS 141 did not define the acquirer, although it included guidance on identifying the acquirer. SFAS 141(R)’s scope is broader than that of SFAS 141, which applied only to business combinations in which control was obtained by transferring consideration. The result of applying SFAS 141’s guidance on recognizing and measuring assets and liabilities in a step acquisition was to measure them at a blend of historical costs and fair values. In addition, SFAS 141(R) requires to measure the noncontrolling interest in the acquiree at fair value which results in recognizing the goodwill attributable to the noncontrolling interest in addition to that attributable to the acquirer. SFAS 141(R) applies prospectively to business combinations for which the acquisition date is on or after the beginning of the first annual reporting period beginning on or after December 15, 2008 (that is, in the case of Vale, January 1, 2009). An entity may not apply it before that date. The effective date of this Statement is the same as that of the related SFAS 160, “Noncontrolling Interests in Consolidated Financial Statements–an amendment of ARB No. 51” (described below). We are currently studying the possible effects which may arise upon adoption of this standard.
In February 2007, the FASB issued SFAS 159, “The Fair Value Option for Financial Assets and Financial Liabilities.” SFAS No. 159 permits entities to choose to measure many financial instruments and certain other items at fair value. The objective is to improve financial reporting by providing entities with the opportunity to mitigate volatility in reported earnings caused by measuring related assets and liabilities differently without having to apply complex hedge accounting provisions. This Statement is expected to expand the use of fair value measurement, which is consistent with the Board’s long-term measurement objectives for accounting for financial instruments. The fair value option established by this Statement permits all entities to choose to measure eligible items at fair value at specified election dates. This standard is effective for fiscal years that begin after November 15, 2007. We are currently studying the possible effects which may arise upon adoption of this standard.

Notes to the Consolidated Financial Statements
F-13
In September 2006, the FASB issued SFAS 157—“Fair value measurements”, which defines fair value, establishes a framework for measuring fair value, and expands disclosures about fair value measurements. This Statement applies under other accounting pronouncements that require or permit fair value measurements, the FASB having previously concluded in those accounting pronouncements that fair value is the relevant measurement attribute. Accordingly, this Statement does not require any new fair value measurements. This Statement is effective for financial statements issued for fiscal years beginning after November 15, 2007 and interim periods within those fiscal years (that is, in the case of Vale, January 1, 2008). We are currently studying the possible effects which may arise upon adoption of this standard.
5 Our privatization
In May 1997, we were privatized by the Brazilian Government, which transferred voting control to Valepar S.A. (“Valepar”). The Brazilian Government has retained certain rights with respect to our future decisions and those of Valepar and has also caused us to enter into agreements which may affect our activities and results of operations in the future. These rights and agreements are:
• Preferred Special Share. The Brazilian Government holds twelve preferred special shares of Vale which confers upon it permanent veto rights over changes in our (i) name, (ii) location of our headquarters (iii) corporate purpose with respect to mineral exploration, (iv) continued operation of our integrated iron ore mining systems and (v) certain other matters.
• Shareholder revenue interests. On April 18, 1997, we issued to shareholders of record (including the Brazilian Government) revenue interests providing holders thereof with the right to receive semi-annual payments based on a percentage of our net revenues above threshold production volumes from identified mining resources. These instruments are not secured by the corresponding mineral reserves and deposits (Note 19 (e)).
6 Major acquisitions and disposals
In October 2007, we were awarded, in an auction, a 30-year sub-concession for commercial exploitation of the North-South railroad (FNS – Ferrovia Norte Sul) for US$837, payable in three installments. The first installment, equal to US$412 and corresponding to 50% was paid in December 2007. The second installment, equal to 25%, is to be paid in December 2008, and the last installment falls due upon the completion of the railroad. The remaining installments are indexed to the general price index (IGP-DI) and accrue interest of 12% p.a. from the settlement date of the first installment.
In July 2007, we sold our total interest in Lion Ore Mining International Ltd. (held by our subsidiary Vale Inco), corresponding to 1.8% of total common shares for US$105 generating a gain of US$80.
In June 2007, we sold through a primary and secondary public offering, 25,213,664 common shares, representing 57.84% of the total capital of our subsidiary Log-In Logística Intermodal S.A. for US$179, recording a gain of US$155.
In July 2007, we sold an additional 5.1% stake for US$24 recording a gain of US$21. Since December 31, 2007, we hold 31.27% of the voting and total capital of this entity, which is accounted for as an equity investee.
In May 2007, we sold in a public offering, part of our shareholding in Usinas Siderúrgicas de Minas Gerais S.A. – USIMINAS, an available-for-sale investee, for US$728, recording a gain of US$456. We have retained the minimum number of shares required to participate in the current shareholders agreement of the investee.
In May 2007, we acquired a further 6.25% of the total share capital of Empreendimentos Brasileiros de Mineração S.A. (EBM), whose main asset is its interest in MBR, for US$231 and as a result, our direct and indirect stake in MBR increased to, 92.99% of total and voting capital. We simultaneously entered into an usufruct agreement with minority shareholders whereby they transferred to us all rights and obligations with respect to their EBM shares, including rights to dividends for the next 30 years, for which we will make an initial payment of
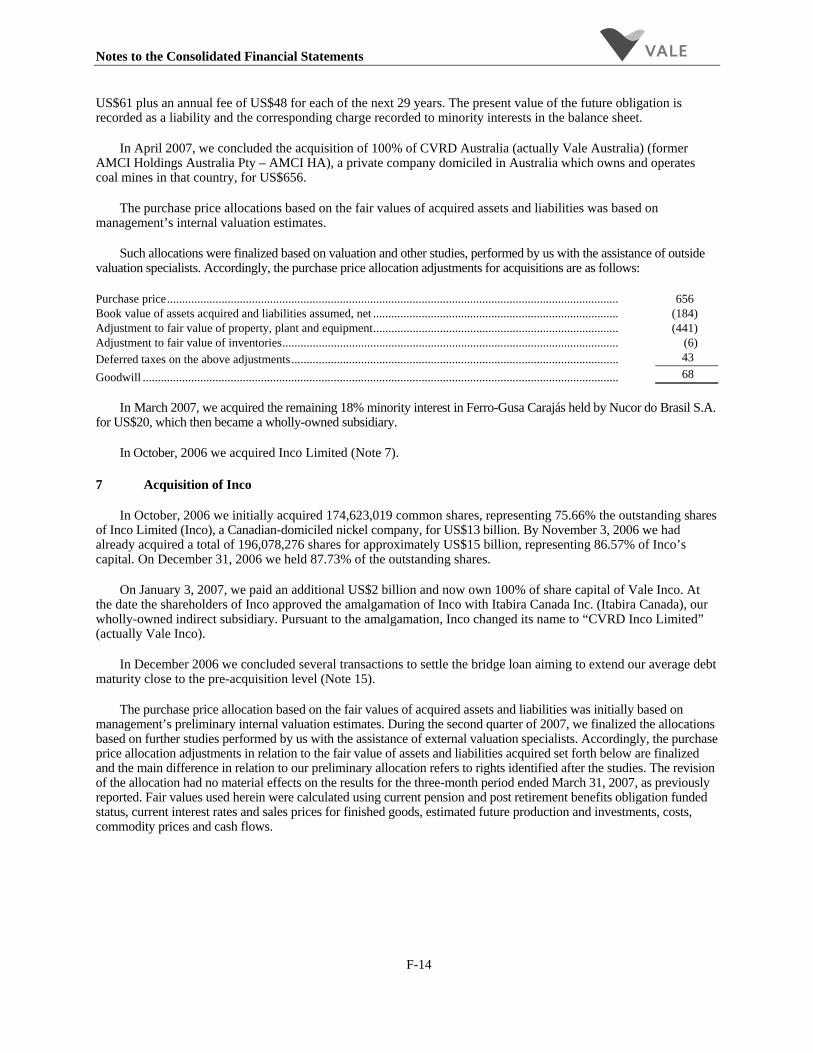
Notes to the Consolidated Financial Statements
F-14
US$61 plus an annual fee of US$48 for each of the next 29 years. The present value of the future obligation is recorded as a liability and the corresponding charge recorded to minority interests in the balance sheet.
In April 2007, we concluded the acquisition of 100% of CVRD Australia (actually Vale Australia) (former AMCI Holdings Australia Pty – AMCI HA), a private company domiciled in Australia which owns and operates coal mines in that country, for US$656.
The purchase price allocations based on the fair values of acquired assets and liabilities was based on management’s internal valuation estimates.
Such allocations were finalized based on valuation and other studies, performed by us with the assistance of outside valuation specialists. Accordingly, the purchase price allocation adjustments for acquisitions are as follows:
Purchase price..................................................................................................................................................... 656 Book value of assets acquired and liabilities assumed, net ................................................................................. (184) Adjustment to fair value of property, plant and equipment................................................................................. (441) Adjustment to fair value of inventories............................................................................................................... (6) Deferred taxes on the above adjustments............................................................................................................ 43
Goodwill ............................................................................................................................................................. 68 In March 2007, we acquired the remaining 18% minority interest in Ferro-Gusa Carajás held by Nucor do Brasil S.A.
for US$20, which then became a wholly-owned subsidiary.
In October, 2006 we acquired Inco Limited (Note 7).
7 Acquisition of Inco
In October, 2006 we initially acquired 174,623,019 common shares, representing 75.66% the outstanding shares of Inco Limited (Inco), a Canadian-domiciled nickel company, for US$13 billion. By November 3, 2006 we had already acquired a total of 196,078,276 shares for approximately US$15 billion, representing 86.57% of Inco’s capital. On December 31, 2006 we held 87.73% of the outstanding shares.
On January 3, 2007, we paid an additional US$2 billion and now own 100% of share capital of Vale Inco. At the date the shareholders of Inco approved the amalgamation of Inco with Itabira Canada Inc. (Itabira Canada), our wholly-owned indirect subsidiary. Pursuant to the amalgamation, Inco changed its name to “CVRD Inco Limited” (actually Vale Inco).
In December 2006 we concluded several transactions to settle the bridge loan aiming to extend our average debt maturity close to the pre-acquisition level (Note 15).
The purchase price allocation based on the fair values of acquired assets and liabilities was initially based on management’s preliminary internal valuation estimates. During the second quarter of 2007, we finalized the allocations based on further studies performed by us with the assistance of external valuation specialists. Accordingly, the purchase price allocation adjustments in relation to the fair value of assets and liabilities acquired set forth below are finalized and the main difference in relation to our preliminary allocation refers to rights identified after the studies. The revision of the allocation had no material effects on the results for the three-month period ended March 31, 2007, as previously reported. Fair values used herein were calculated using current pension and post retirement benefits obligation funded status, current interest rates and sales prices for finished goods, estimated future production and investments, costs, commodity prices and cash flows.

Notes to the Consolidated Financial Statements
F-15
This information relates to our ownership of 100% of Vale Inco’s shares.
Total disbursements ........................................................................................................................................ 17,023 Transaction costs ............................................................................................................................................ 38 Purchase price................................................................................................................................................. 17,061 Book value of assets acquired and liabilities assumed, net ............................................................................. (4,657) Adjustment to fair value of inventory ............................................................................................................. (2,008) Adjustment to fair value of property, plant and equipment and intangible assets ........................................... (12,723) Change of control obligations ......................................................................................................................... 949 Adjustment to fair value of other liabilities assumed...................................................................................... 795 Deferred taxes on the above adjustments........................................................................................................ 3,188
Goodwill ......................................................................................................................................................... 2,605
The main effects between the preliminary valuation reported in 2006 and final allocations, of US$1,271, reflect the increase in fair value of the nickel mines and the related deferred taxes, which was reclassified to reduce goodwill.
Pro forma unaudited information considers our acquisition of 100% of Inco as though the transaction had occurred on January 1, 2006.
December 31, 2006 (unaudited) 2006 2005
CVRD
Consolidated Inco Pro
forma CVRD
Consolidated Inco Pro forma Net operating revenues............................. 19,651 5,351 25,002 12,792 4,518 17,310 Operating costs and expenses ................... (12,014) (3,627) (15,641) (7,360) (3,645) (11,005) Operating income ..................................... 7,637 1,724 9,361 5,432 873 6,305 Non-operating income (expenses) ............ 192 (598) (406) (12) (1,065) (1,077) Income before income taxes, equity results and minority interests................. 7,829 1,126 8,955 5,420 (192) 5,228 Income taxes............................................. (1,432) (429) (1,861) (880) 23 (857) Equity in results of affiliates and joint ventures .................................. 710 – 710 760 – 760 Minority interests ..................................... (579) 35 (544) (459) (141) (600)
Net income ............................................... 6,528 732 7,260 4,841 (310) 4,531 In our opinion, the unaudited pro forma combined results of operations may not be indicative of the actual
results that would have occurred had the acquisitions been consummated on January 1, 2006.
8 Income taxes
Income taxes in Brazil comprise federal income tax and social contribution, which is an additional federal tax. The statutory composite enacted tax rate applicable in the periods presented is 34% represented by a 25% federal income tax rate plus a 9% social contribution rate.
In other countries where we have operations the applicable tax rate varied from 3.29% to 43.15%.
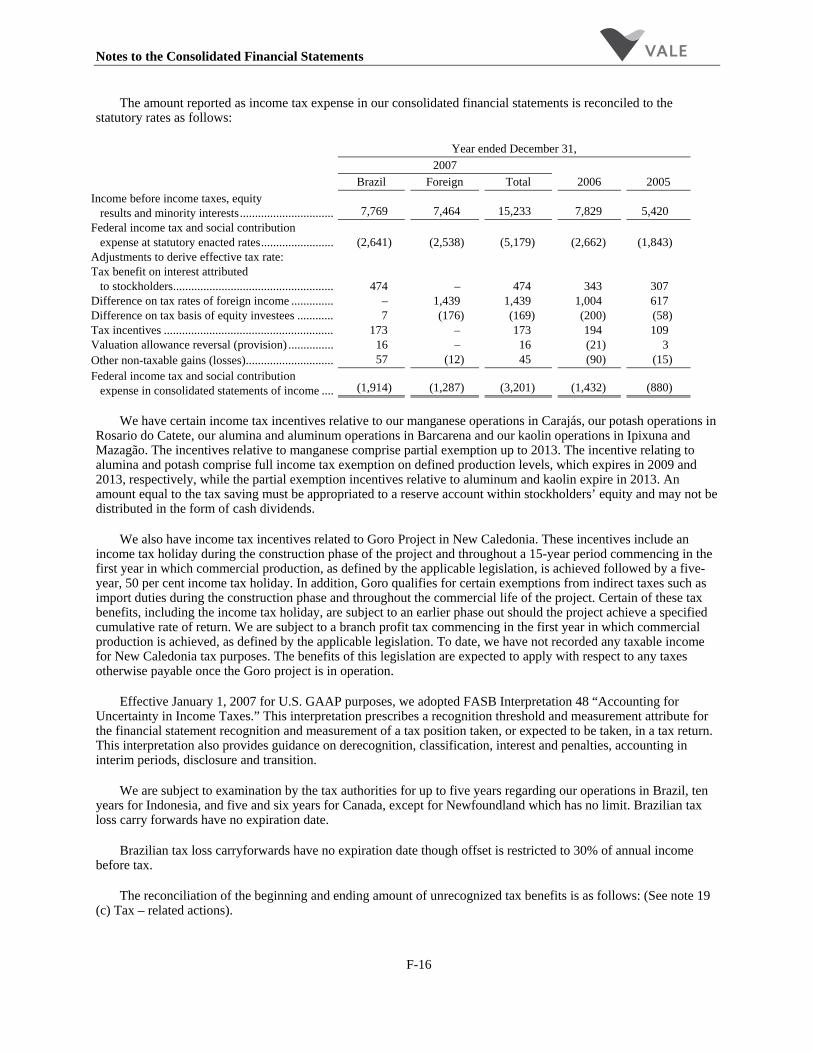
Notes to the Consolidated Financial Statements
F-16
The amount reported as income tax expense in our consolidated financial statements is reconciled to the statutory rates as follows:
Year ended December 31, 2007 Brazil Foreign Total 2006 2005
Income before income taxes, equity results and minority interests............................... 7,769 7,464 15,233 7,829 5,420 Federal income tax and social contribution expense at statutory enacted rates........................ (2,641) (2,538) (5,179) (2,662) (1,843) Adjustments to derive effective tax rate: Tax benefit on interest attributed to stockholders..................................................... 474 – 474 343 307 Difference on tax rates of foreign income .............. – 1,439 1,439 1,004 617 Difference on tax basis of equity investees ............ 7 (176) (169) (200) (58) Tax incentives ........................................................ 173 – 173 194 109 Valuation allowance reversal (provision) ............... 16 – 16 (21) 3 Other non-taxable gains (losses)............................. 57 (12) 45 (90) (15) Federal income tax and social contribution expense in consolidated statements of income .... (1,914) (1,287) (3,201) (1,432) (880)
We have certain income tax incentives relative to our manganese operations in Carajás, our potash operations in
Rosario do Catete, our alumina and aluminum operations in Barcarena and our kaolin operations in Ipixuna and Mazagão. The incentives relative to manganese comprise partial exemption up to 2013. The incentive relating to alumina and potash comprise full income tax exemption on defined production levels, which expires in 2009 and 2013, respectively, while the partial exemption incentives relative to aluminum and kaolin expire in 2013. An amount equal to the tax saving must be appropriated to a reserve account within stockholders’ equity and may not be distributed in the form of cash dividends.
We also have income tax incentives related to Goro Project in New Caledonia. These incentives include an income tax holiday during the construction phase of the project and throughout a 15-year period commencing in the first year in which commercial production, as defined by the applicable legislation, is achieved followed by a five-year, 50 per cent income tax holiday. In addition, Goro qualifies for certain exemptions from indirect taxes such as import duties during the construction phase and throughout the commercial life of the project. Certain of these tax benefits, including the income tax holiday, are subject to an earlier phase out should the project achieve a specified cumulative rate of return. We are subject to a branch profit tax commencing in the first year in which commercial production is achieved, as defined by the applicable legislation. To date, we have not recorded any taxable income for New Caledonia tax purposes. The benefits of this legislation are expected to apply with respect to any taxes otherwise payable once the Goro project is in operation.
Effective January 1, 2007 for U.S. GAAP purposes, we adopted FASB Interpretation 48 “Accounting for Uncertainty in Income Taxes.” This interpretation prescribes a recognition threshold and measurement attribute for the financial statement recognition and measurement of a tax position taken, or expected to be taken, in a tax return. This interpretation also provides guidance on derecognition, classification, interest and penalties, accounting in interim periods, disclosure and transition.
We are subject to examination by the tax authorities for up to five years regarding our operations in Brazil, ten years for Indonesia, and five and six years for Canada, except for Newfoundland which has no limit. Brazilian tax loss carry forwards have no expiration date.
Brazilian tax loss carryforwards have no expiration date though offset is restricted to 30% of annual income before tax.
The reconciliation of the beginning and ending amount of unrecognized tax benefits is as follows: (See note 19 (c) Tax – related actions).
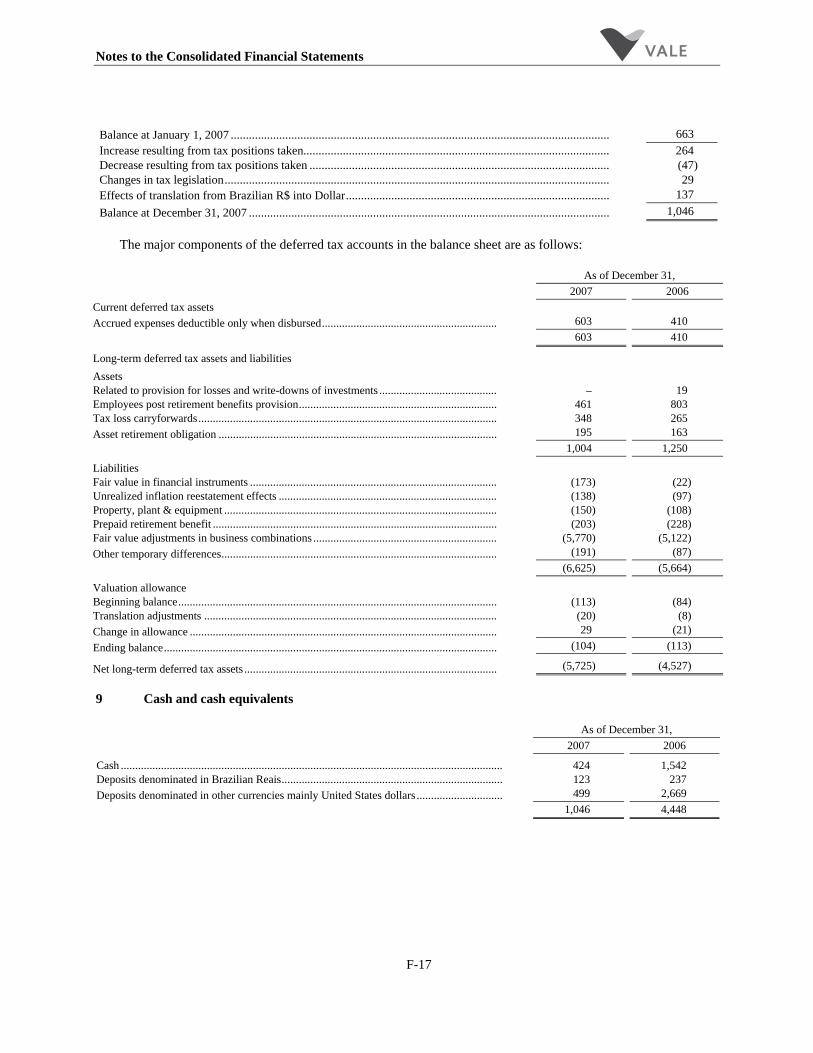
Notes to the Consolidated Financial Statements
F-17
Balance at January 1, 2007 ............................................................................................................................. 663 Increase resulting from tax positions taken..................................................................................................... 264 Decrease resulting from tax positions taken ................................................................................................... (47) Changes in tax legislation............................................................................................................................... 29 Effects of translation from Brazilian R$ into Dollar....................................................................................... 137 Balance at December 31, 2007 ....................................................................................................................... 1,046
The major components of the deferred tax accounts in the balance sheet are as follows:
As of December 31, 2007 2006 Current deferred tax assets Accrued expenses deductible only when disbursed............................................................. 603 410
603 410
Long-term deferred tax assets and liabilities Assets Related to provision for losses and write-downs of investments ......................................... – 19 Employees post retirement benefits provision..................................................................... 461 803 Tax loss carryforwards........................................................................................................ 348 265 Asset retirement obligation ................................................................................................. 195 163 1,004 1,250
Liabilities Fair value in financial instruments ...................................................................................... (173) (22) Unrealized inflation reestatement effects ............................................................................ (138) (97) Property, plant & equipment ............................................................................................... (150) (108) Prepaid retirement benefit ................................................................................................... (203) (228) Fair value adjustments in business combinations ................................................................ (5,770) (5,122) Other temporary differences................................................................................................ (191) (87) (6,625) (5,664)
Valuation allowance Beginning balance............................................................................................................... (113) (84) Translation adjustments ...................................................................................................... (20) (8) Change in allowance ........................................................................................................... 29 (21) Ending balance.................................................................................................................... (104) (113)
Net long-term deferred tax assets ........................................................................................ (5,725) (4,527)
9 Cash and cash equivalents
As of December 31, 2007 2006
Cash ..................................................................................................................................... 424 1,542 Deposits denominated in Brazilian Reais............................................................................. 123 237 Deposits denominated in other currencies mainly United States dollars .............................. 499 2,669
1,046 4,448
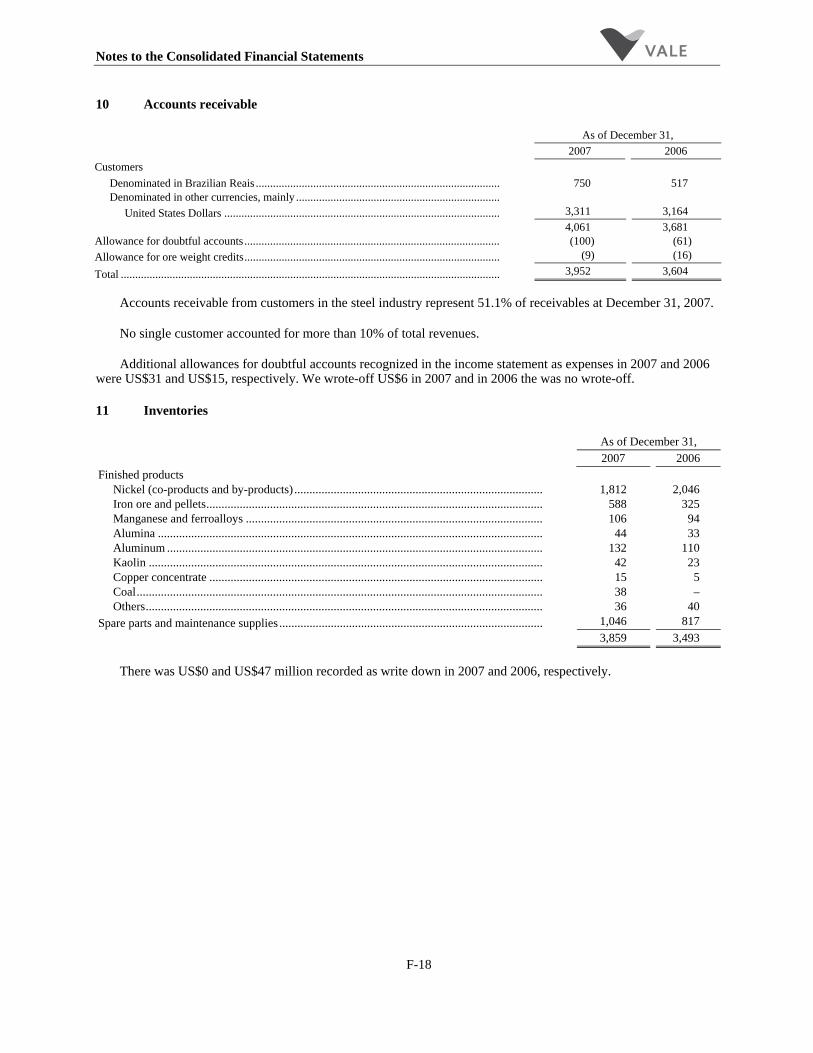
Notes to the Consolidated Financial Statements
F-18
10 Accounts receivable
As of December 31, 2007 2006
Customers Denominated in Brazilian Reais ..................................................................................... 750 517 Denominated in other currencies, mainly .......................................................................
United States Dollars ................................................................................................ 3,311 3,164 4,061 3,681 Allowance for doubtful accounts......................................................................................... (100) (61) Allowance for ore weight credits......................................................................................... (9) (16)
Total .................................................................................................................................... 3,952 3,604 Accounts receivable from customers in the steel industry represent 51.1% of receivables at December 31, 2007.
No single customer accounted for more than 10% of total revenues.
Additional allowances for doubtful accounts recognized in the income statement as expenses in 2007 and 2006 were US$31 and US$15, respectively. We wrote-off US$6 in 2007 and in 2006 the was no wrote-off.
11 Inventories
As of December 31, 2007 2006 Finished products
Nickel (co-products and by-products) .................................................................................. 1,812 2,046 Iron ore and pellets............................................................................................................... 588 325 Manganese and ferroalloys .................................................................................................. 106 94 Alumina ............................................................................................................................... 44 33 Aluminum ............................................................................................................................ 132 110 Kaolin .................................................................................................................................. 42 23 Copper concentrate .............................................................................................................. 15 5 Coal...................................................................................................................................... 38 – Others................................................................................................................................... 36 40
Spare parts and maintenance supplies ....................................................................................... 1,046 817
3,859 3,493 There was US$0 and US$47 million recorded as write down in 2007 and 2006, respectively.
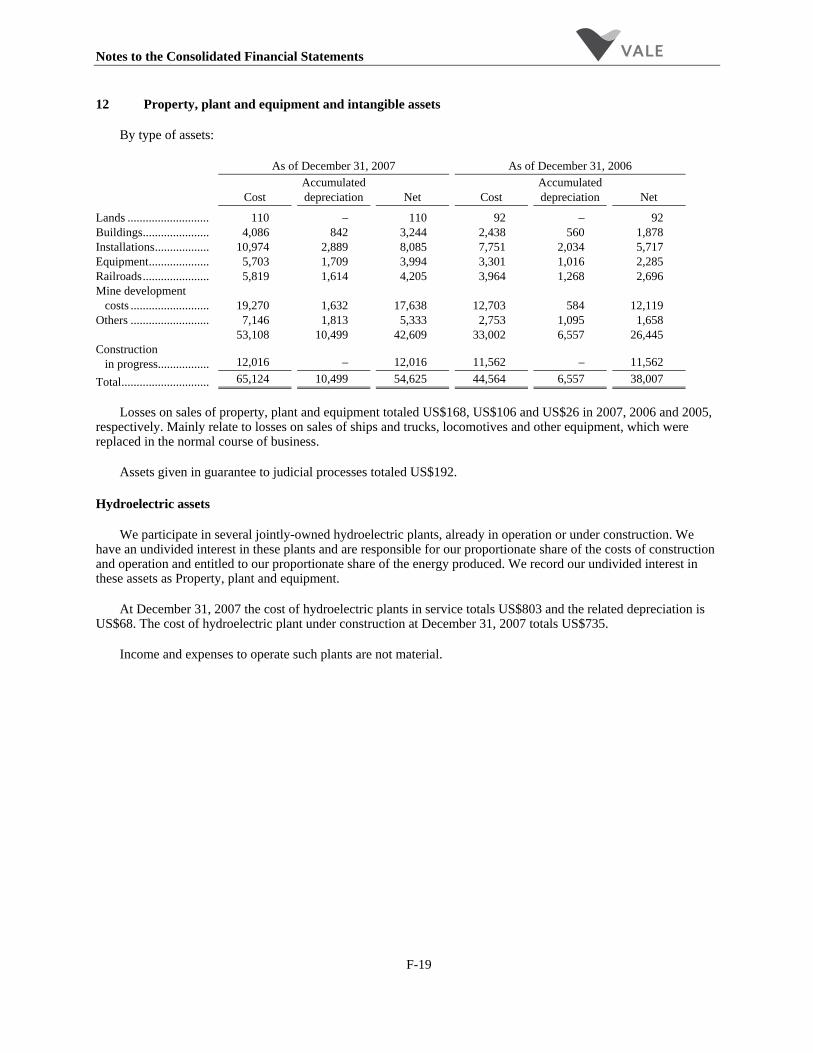
Notes to the Consolidated Financial Statements
F-19
12 Property, plant and equipment and intangible assets
By type of assets:
As of December 31, 2007 As of December 31, 2006
Cost Accumulated depreciation Net Cost
Accumulated depreciation Net
Lands ........................... 110 – 110 92 – 92 Buildings...................... 4,086 842 3,244 2,438 560 1,878 Installations.................. 10,974 2,889 8,085 7,751 2,034 5,717 Equipment.................... 5,703 1,709 3,994 3,301 1,016 2,285 Railroads...................... 5,819 1,614 4,205 3,964 1,268 2,696 Mine development costs .......................... 19,270 1,632 17,638 12,703 584 12,119 Others .......................... 7,146 1,813 5,333 2,753 1,095 1,658 53,108 10,499 42,609 33,002 6,557 26,445 Construction in progress................. 12,016 – 12,016 11,562 – 11,562
Total............................. 65,124 10,499 54,625 44,564 6,557 38,007
Losses on sales of property, plant and equipment totaled US$168, US$106 and US$26 in 2007, 2006 and 2005, respectively. Mainly relate to losses on sales of ships and trucks, locomotives and other equipment, which were replaced in the normal course of business.
Assets given in guarantee to judicial processes totaled US$192.
Hydroelectric assets
We participate in several jointly-owned hydroelectric plants, already in operation or under construction. We have an undivided interest in these plants and are responsible for our proportionate share of the costs of construction and operation and entitled to our proportionate share of the energy produced. We record our undivided interest in these assets as Property, plant and equipment.
At December 31, 2007 the cost of hydroelectric plants in service totals US$803 and the related depreciation is US$68. The cost of hydroelectric plant under construction at December 31, 2007 totals US$735.
Income and expenses to operate such plants are not material.
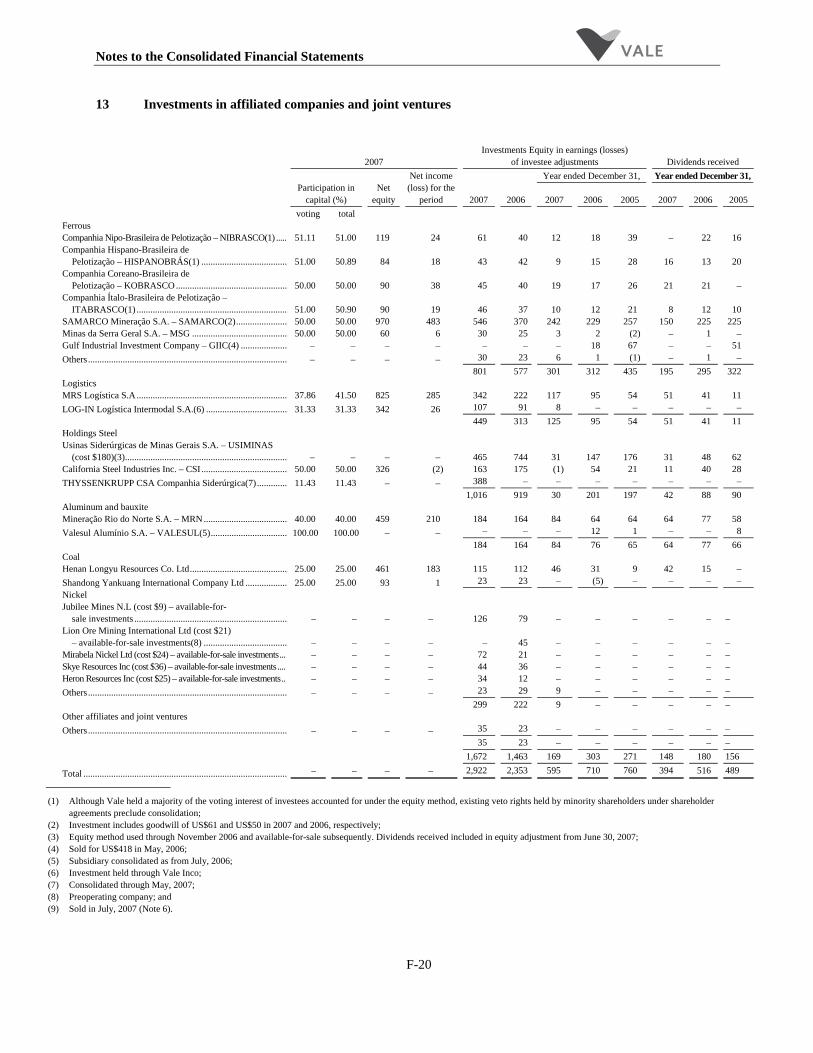
Notes to the Consolidated Financial Statements
F-20
13 Investments in affiliated companies and joint ventures
2007 Investments Equity in earnings (losses)
of investee adjustments Dividends received Year ended December 31, Year ended December 31,
Participation in capital (%)
Net equity
Net income (loss) for the
period 2007 2006 2007 2006 2005 2007 2006 2005 voting total Ferrous Companhia Nipo-Brasileira de Pelotização – NIBRASCO(1) ..... 51.11 51.00 119 24 61 40 12 18 39 – 22 16 Companhia Hispano-Brasileira de
Pelotização – HISPANOBRÁS(1) ..................................... 51.00 50.89 84 18 43 42 9 15 28 16 13 20 Companhia Coreano-Brasileira de
Pelotização – KOBRASCO................................................ 50.00 50.00 90 38 45 40 19 17 26 21 21 – Companhia Ítalo-Brasileira de Pelotização –
ITABRASCO(1) ................................................................. 51.00 50.90 90 19 46 37 10 12 21 8 12 10 SAMARCO Mineração S.A. – SAMARCO(2)...................... 50.00 50.00 970 483 546 370 242 229 257 150 225 225 Minas da Serra Geral S.A. – MSG ......................................... 50.00 50.00 60 6 30 25 3 2 (2) – 1 – Gulf Industrial Investment Company – GIIC(4) .................... – – – – – – – 18 67 – – 51 Others...................................................................................... – – – – 30 23 6 1 (1) – 1 – 801 577 301 312 435 195 295 322 Logistics MRS Logística S.A................................................................. 37.86 41.50 825 285 342 222 117 95 54 51 41 11 LOG-IN Logística Intermodal S.A.(6) ................................... 31.33 31.33 342 26 107 91 8 – – – – – 449 313 125 95 54 51 41 11 Holdings Steel Usinas Siderúrgicas de Minas Gerais S.A. – USIMINAS
(cost $180)(3)...................................................................... – – – – 465 744 31 147 176 31 48 62 California Steel Industries Inc. – CSI ..................................... 50.00 50.00 326 (2) 163 175 (1) 54 21 11 40 28 THYSSENKRUPP CSA Companhia Siderúrgica(7)............. 11.43 11.43 – – 388 – – – – – – – 1,016 919 30 201 197 42 88 90 Aluminum and bauxite Mineração Rio do Norte S.A. – MRN.................................... 40.00 40.00 459 210 184 164 84 64 64 64 77 58 Valesul Alumínio S.A. – VALESUL(5)................................. 100.00 100.00 – – – – – 12 1 – – 8 184 164 84 76 65 64 77 66 Coal Henan Longyu Resources Co. Ltd.......................................... 25.00 25.00 461 183 115 112 46 31 9 42 15 – Shandong Yankuang International Company Ltd .................. 25.00 25.00 93 1 23 23 – (5) – – – – Nickel Jubilee Mines N.L (cost $9) – available-for-
sale investments .................................................................. – – – – 126 79 – – – – – – Lion Ore Mining International Ltd (cost $21)
– available-for-sale investments(8) .................................... – – – – – 45 – – – – – – Mirabela Nickel Ltd (cost $24) – available-for-sale investments... – – – – 72 21 – – – – – – Skye Resources Inc (cost $36) – available-for-sale investments.... – – – – 44 36 – – – – – – Heron Resources Inc (cost $25) – available-for-sale investments.. – – – – 34 12 – – – – – – Others...................................................................................... – – – – 23 29 9 – – – – – 299 222 9 – – – – – Other affiliates and joint ventures Others...................................................................................... – – – – 35 23 – – – – – – 35 23 – – – – – – 1,672 1,463 169 303 271 148 180 156 Total ........................................................................................ – – – – 2,922 2,353 595 710 760 394 516 489
(1) Although Vale held a majority of the voting interest of investees accounted for under the equity method, existing veto rights held by minority shareholders under shareholder agreements preclude consolidation;
(2) Investment includes goodwill of US$61 and US$50 in 2007 and 2006, respectively; (3) Equity method used through November 2006 and available-for-sale subsequently. Dividends received included in equity adjustment from June 30, 2007; (4) Sold for US$418 in May, 2006; (5) Subsidiary consolidated as from July, 2006; (6) Investment held through Vale Inco; (7) Consolidated through May, 2007; (8) Preoperating company; and (9) Sold in July, 2007 (Note 6).

Notes to the Consolidated Financial Statements
F-21
14 Short-term debt
Our short-term borrowings are mainly from commercial banks and relate to export financing denominated in United States Dollars. Average annual interest rates on short-term borrowings were 5.5%, 5.5% and 4.2% at December 31, 2007 and 2006 and 2005, respectively.
15 Long-term debt
As of December 31, Current liabilities Long-term liabilities 2007 2006 2007 2006 Foreign debt Loans and financing denominated in the following currencies: United States dollars ....................................................................... 212 192 5,927 10,483 Others ............................................................................................. 64 4 214 152 Fixed Rate Notes – US$ denominated ............................................ – 112 6,680 6,785 Debt securities – export sales (*) – US$ denominated.................... 53 86 205 259 Perpetual notes................................................................................ – – 87 86 Accrued charges.............................................................................. 282 139 – – 611 533 13,113 17,765 Local debt ....................................................................................... Denominated in Long-Term Interest Rate – TJLP/CDI .................. 586 16 1,148 511 Denominated in General Price Index-Market (IGPM).................... 1 20 1 1 Basket of currencies........................................................................ 2 2 6 7 Non-convertible debentures ............................................................ – – 3,340 2,774 Indexed by U.S. dollars................................................................... – 107 – 64 Accrued charges.............................................................................. 49 33 – – 638 178 4,495 3,357 Total................................................................................................ 1,249 711 17,608 21,122
(*) Debt securities secured by future receivables arising from export sales. The long-term portion at December 31, 2007 falls due as follows: The long-term portion at December 31, 2007 falls due as follows:
2009 ................................................................................................................................................................. 321 2010 ................................................................................................................................................................. 2,384 2011 ................................................................................................................................................................. 2,780 2012 ................................................................................................................................................................. 1,083 2013 and thereafter .......................................................................................................................................... 10,718 No due date (Perpetual notes and non-convertible debentures) ....................................................................... 322
17,608 At December 31, 2007 annual interest rates on long-term debt were as follows:
3.1% to 5% ...................................................................................................................................................... 618 5.1% to 7% ...................................................................................................................................................... 11,316 7.1% to 9% ...................................................................................................................................................... 2,436 9.1% to 11% .................................................................................................................................................... 119 Over 11% (*) ................................................................................................................................................... 4,281 Variable (Perpetual notes)................................................................................................................................ 87
18,857
(*) Includes non-convertible debentures and other Brazilian-reais denominated debt that bear interest at CDI (Brazilian interbank certificate of deposit) rate plus spread. For these operations we have entered into derivative transactions to hedge the exposure we hold on our floating rate debt denominated in reais. The outstanding amount for these transactions is US$4,234 and the average cost of such debt after the hedge transactions is 5.7%.

Notes to the Consolidated Financial Statements
F-22
The indices applied to debt and respective percentage variations in each year were as follows (unaudited):
2007 2006 2005 (%) TJLP – Long-Term Interest Rate (effective rate)...................................................... 6.4 7.9 9.8 IGP-M – General Price Index – Market .................................................................... 7.8 3.8 1.2 Devaluation of United States Dollar against Real..................................................... (17.2) (8.7) (11.8)
Pursuant to the acquisition of Vale Inco we executed various financial operations to repay the initial
US$14.6 billion bridge loan, used to finance the acquisition, as follows:
• On November 16, 2006, we issued US$3.75 billion 10-year and 30-year notes. The US$1.25 billion notes due in January 2017 bear a coupon rate of 6.25% per year, payable semi-annually, and were priced with a yield to maturity of 6.346% per year. The US$2.50 billion notes due in November 2036 bear a coupon rate of 6.875% per year, payable semi-annually, and were priced with a yield to maturity of 6.997% per year
• We issued on December 20, 2006 in the Brazilian market of non-convertible debentures (debentures) in Reais in an amount equivalent to US$2.6 billion, in two series, with four and seven-year maturities. The first series, due on November 20, 2010, US$700 million, will be remunerated at 101.75% of the accumulated variation of the Brazilian CDI (interbank certificate of deposit) interest rate, payable semi-annually. The second series, due on November 20, 2013, US$1.9 billion, will be remunerated at the Brazilian CDI interest rate plus 0.25% per year, also payable semi-annually. These debentures can be traded in the secondary market, through the Sistema Nacional de Debêntures (SND).
• On January 23, 2007, we entered into a pre-export finance transaction of US$6.0 billion, with a syndicate composed by 30 banks from different countries. The transaction includes a US$5.0 billion tranche, five-year maturity, at Libor plus 0.625% per year, and a US$1.0 billion tranche, seven-year maturity, at Libor plus 0.75% per year. Due to our cash availability, US$2.1 billion of this deal was prepaid during 2007.
• During 2007 we settled the balance of the bridge loan with cash, totaling US$2.25 billion.
• In addition to the prepayment of both the bridge and the pre-export financing transaction, we prepaid US$ 380 million of our debt during 2007. The total debt so prepaid, as part of our liability management initiatives, was US$ 4.73 billion.
On December 31, 2007 the US Dollar denominated Fixed Rate Notes of US$6,680 (2006 – US$6,897) and other debt of US$11,511 (2006 – US$14,017) are unsecured. The export securitization of US$258 (2006 – US$345) is debt securities secured by future receivables arising from certain export sales of our subsidiary CVRD Overseas Ltd. Loans from international lenders of US$82 (2006 – US$106) are guaranteed by Brazilian Federal Government, to which we have given counter guarantees in the same amount. The remaining long-term debt of US$326 (2006 – US$458) is secured mainly by receivables of our subsidiaries.
Some of our long-term debt instruments contain financial covenants. Our principal covenants require us to maintain certain ratios, such as debt to EBITDA and interest coverage. We were in full compliance with our financial covenants as of December 31, 2007.
We have revolving credit lines of US$1.9 billion.
Notes to the Consolidated Financial Statements
F-23
16 Stockholders’ equity
Each holder of common and preferred class A stock is entitled to one vote for each share on all matters that come before a stockholders’ meeting, except for the election of the Board of Directors, which is restricted to the holders of common stock. The Brazilian Government holds twelve preferred special shares which confer to it permanent veto rights over certain matters.
In September 2007, a stock split was effected and each existing, common and preferred, share was split into two shares. After the split our capital comprises 4,919,314,116 shares, of which 1,919,516,400 are class “A” preferred shares and 2,999,797,716 are common shares, including twelve special class shares without par value (“Golden Shares”). The share/ADR proportion was maintained at 1/1; therefore, each common and preferred share, continued to be represented by one ADR supported by one common share (NYSE: RIO) or by one ADR supported by one class “A” preferred share (NYSE: RIOPR) respectively. All numbers of share and per share amounts included herein reflect retroactive application of the stock split. The Notes due 2010, series RIO and RIO P, mandatorily convertible into Vale ADRs will have their conversion rates adjusted to reflect the share split.
In June 2007, we issued US$1,880 Mandatorily Convertible Notes due June 15, 2010 for total proceeds of US$1,869 net of commissions. The Notes bear interest at 5.50% per year payable quarterly and additional interest which will be payable based on the net amount of cash distribution paid to ADS holders. The US$1,296 Notes are mandatorily convertible into an aggregate maximum of 56,582,040 common shares and the US$584 Notes are mandatorily convertible into an aggregate maximum of 30,295,456 preferred class A shares. On the maturity date (whether at stated maturity or upon acceleration following an event of default), the Series RIO Notes will automatically convert into ADSs, each ADS representing one common share of Vale, and the Series RIO P Notes will automatically convert into ADSs, each ADS representing one preferred class A share of Vale. We currently hold the shares to be issued on conversion in treasury stock. The Notes are not repayable in cash. Holders of notes will have no voting rights. We will pay to the holders of our Series RIO Notes or RIO P Notes additional interest in the event that Vale makes cash distributions to all holders of RIO ADSs or RIO P ADSs, respectively. On 2007, the amount of additional interest totaled US$15. We determined, using a statistical model, that the potential variability in the number of shares to be converted is not a predominant feature of this hybrid financial instrument and thus classified it as an equity instrument within our stockholders’ equity. Other than during the cash acquisition conversion period, holders of the notes have the right to convert their notes, in whole or in part, at any time prior to maturity in the case of the Series RIO Notes, into RIO ADSs at the minimum conversion rate of 0.8664 RIO ADSs per Series RIO Note, and in the case of Series RIO P Notes, into RIO P ADSs at the minimum conversion rate of 1.0283 RIO P ADSs per Series RIO P Note.
Note Twenty Day Market Value Conversion Rate
Rio P Less than or equal to US$38.59 1.2957 Between US$38.59 and US$48.62 US$50.00 divided by the twenty day market value Equal to or greater than US$48.62 1.0283
Rio Less than or equal to US$45.80 1.0917 Between US$45.80 and US$57.71 US$50.00 divided by the twenty day market value Equal to or greater than US$57.71 0.8664
On June 21, 2006 the Board of Directors approved a buy-back program of our preferred shares, in effect during
180 days. Under this program, we had acquired 30,299,200 shares held in treasury at an average weighted unit cost of US$9.94 (minimum cost of US$9.45 and maximum of US$10.37).
In October 2007, we paid US$1,050 to stockholders. The distribution was made in the form of interest on stockholders’ equity and dividends. In April 2007, we paid US$825 to stockholders. The distribution was made in the form of interest attributable to stockholders’ equity and dividends.
In April 2007, at an Extraordinary Shareholders’ Meeting the paid-up capital was increased by US$4,187 through transfer of reserves, without issuance of shares, to US$12,695.
Both common and preferred stockholders are entitled to receive a mandatory minimum dividend of 25% of annual adjusted net income based on the statutory accounting records, upon approval at the annual stockholders’ meeting. In the case of preferred stockholders, this dividend cannot be less than 6% of the preferred capital as stated in the statutory accounting records or, if greater, 3% of the statutory book equity value per share. For the year ended December 31, 2007, this annual
Notes to the Consolidated Financial Statements
F-24
minimum dividend corresponded to US$2,691 of which US$8 was paid in October 2007 and therefore we accrued the remaining value of US$2,683 with a direct charge to stockholders’ equity. For each of the years 2006 and 2005 we distributed dividends to preferred stockholders in excess of this limit. Interest attributed to stockholders equity as from January 1, 1996 is considered part of the minimum dividend.
Brazilian law permits the payment of cash dividends only from retained earnings as stated in the statutory accounting records and such payments are made in Reais. In addition, per the statutory books record, undistributed retained earnings at December 31, 2007 includes US$13,954, related to the unrealized income and expansion reserves, which could be freely transferred to retained earnings and paid as dividends, if approved by the stockholders.
No withholding tax is payable on distribution of profits earned except for distributions in the form of interest attributed to stockholders (Note 3 (l)).
In December 2007, significant changes were made to Brazilian Corporate Law to permit Brazil to converge with International Financial Reporting Standards (IFRS). Such changes will be effective for the fiscal year ended December 31, 2008. Future impacts in the local income statement could include alteration in the form of calculating and amortizing goodwill on business combinations, the recognition of exchange variations in foreign subsidiaries, joint ventures and affiliates and related tax effects, among others. Detailed regulation of the impact changes and transition requirements is not yet available and will be evaluated once available.
Brazilian laws and our by-laws require that certain appropriations be made from retained earnings to reserve accounts on an annual basis, all determined in accordance with amounts stated in the statutory accounting records, as detailed below:
Year ended December 31, 2007 2006 2005 Undistributed retained earnings
Unrealized income reserve Beginning of the period............................................................................................... 57 101 130 Transfer (to) from retained earnings .......................................................................... 16 (44) (29)
End of the period......................................................................................................... 73 57 101 Expansion reserve......................................................................................................... Beginning of the period............................................................................................... 8,485 3,621 3,091 Transfer to capital stock ............................................................................................ (3,776) – (2,036) Transfer from retained earnings................................................................................. 9,172 4,864 2,566
End of the period......................................................................................................... 13,881 8,485 3,621 Legal reserve................................................................................................................. Beginning of the period............................................................................................... 970 599 529 Transfer to capital stock ............................................................................................ (370) – (209) Transfer from retained earnings................................................................................. 710 371 279
End of the period......................................................................................................... 1,310 970 599 Fiscal incentive depletion reserve ................................................................................. Beginning of the period............................................................................................... – – 378 Transfer to capital stock ............................................................................................ – – (398) Transfer from retained earnings................................................................................. – – 20
End of the period......................................................................................................... – – - Fiscal incentive investment reserve .............................................................................. Beginning of the period............................................................................................... 43 36 15 Transfer to capital stock ............................................................................................ (41) – (16) Transfer from retained earnings................................................................................. 51 7 37
End of the period......................................................................................................... 53 43 36 Total undistributed retained earnings ............................................................................... 15,317 9,555 4,357
The purpose and basis of appropriation to such reserves is described below:
• Unrealized income reserve – this represents principally our share of the earnings of affiliates and joint ventures, not yet received in the form of cash dividends.

Notes to the Consolidated Financial Statements
F-25
• Expansion reserve – this is a general reserve for expansion of our activities.
• Legal reserve – this reserve is a requirement for all Brazilian corporations and represents the appropriation of 5% of annual net income up to a limit of 20% of capital stock all determined under Brazilian GAAP.
• Fiscal incentive depletion reserve – this represents an additional amount relative to mineral reserve depletion equivalent to 20% of the sales price of mining production, which is deductible for tax purposes providing an equivalent amount is transferred from retained earnings to the reserve account. This fiscal incentive expired in 1996.
• Fiscal incentive investment reserve – this reserve results from an option to designate a portion of income tax otherwise payable for investment in government approved projects and is recorded in the year following that in which the taxable income was earned. As from 2000, this reserve basically contemplates income tax incentives (Note 8).
Basic and diluted earnings per share
Basic and diluted earnings per share amounts have been calculated as follows:
Year ended December 31, 2007 2006 2005
Net income for the period ............................................................................. 11,825 6,528 4,841 Interest attributed to preferred convertible notes .......................................... (16) – – Interest attributed to common convertible notes ........................................... (37) – – Net income for the period adjusted ............................................................... 11,772 6,528 4,841 Basic and diluted earnings per share............................................................. Income available to preferred stockholders .................................................. 4,552 2,568 1,748 Income available to common stockholders ................................................... 7,092 3,960 3,093 Income available to convertible notes linked to preferred shares.................. 45 – Income available to convertible notes linked to common shares .................. 84 – Weighted average number of shares outstanding (thousands of shares) – preferred shares .................................................... 1,889,171 1,908,852 1,662,864 Weighted average number of shares outstanding (thousands of shares) – common shares..................................................... 2,943,216 2,943,216 2,943,216 Treasury preferred shares linked to mandatorily convertible notes............... 18,478 – Treasury common shares linked to mandatorily convertible notes ............... 34,510 – Total.............................................................................................................. 4,885,375 4,852,068 4,606,080 Earnings per preferred share ......................................................................... 2.41 1.35 1.05 Earnings per common share.......................................................................... 2.41 1.35 1.05 Earnings per convertible notes linked to preferred share(*).......................... 3.30 – – Earnings per convertible notes linked to common share(*) .......................... 3.51 – –
(*) Basic earnings per share only as dilution assumes conversion.
Notes to the Consolidated Financial Statements
F-26
Were the conversion of the convertible notes to be considered in the calculation of diluted earnings per share they would generate a minor antidilutive effect in the year as shown below:
Year ended December 31, 2007 2006 2005
Income available to preferred stockholders ................................................................. 4,613 – – Income available to common stockholders .................................................................. 7,212 – – Weighted average number of shares outstanding (thousands of shares) – preferred shares ................................................................... 1,907,649 – – Weighted average number of shares outstanding (thousands of shares) – common shares.................................................................... 2,977,726 – – Earnings per preferred share ........................................................................................ 2.42 – – Earnings per common share......................................................................................... 2.42 – – 17 Other Cumulative Comprehensive Income (Deficit)
Year ended December 31, 2007 2006 2005 Comprehensive income is comprised as follows:
Net income.............................................................................................................. 11,825 6,528 4,841 Cumulative translation adjustments ........................................................................ 2,968 1,228 1,013 Unrealized gain (loss) on available-for-sale securities ............................................ (60) 144 32 Surplus (deficit) accrued pension plan .................................................................... (278) (107) – Cash flow hedge...................................................................................................... 29 – –
Total comprehensive income ....................................................................................... 14,484 7,793 5,886 Tax effect on other comprehensive income (expense) allocated to each component Unrealized gain on available-for-sale securities
Gross balance as of the period end.......................................................................... 271 395 127 Tax (expense) benefit.............................................................................................. (60) (124) – Net balance as of the period end ............................................................................. 211 271 127
Surplus (deficit) accrued pension plan Gross balance as of the period end.......................................................................... 134 540 – Tax (expense) benefit.............................................................................................. (59) (187) – Net balance as of the period end ............................................................................. 75 353 –
18 Pension plans
Since 1973 we have sponsored a supplementary social security plan with characteristics of defined benefit plan (the “Old Plan”) covering substantially all Brazilian employees, with benefits calculated based on years of service, age, contribution salary and supplementary social security benefits. This plan is administered by Fundação Vale do Rio Doce de Seguridade Social – VALIA and was funded by monthly contributions made by us and our employees, calculated based on periodic actuarial appraisals.
In May 2000, we implemented a new supplementary social security plan with characteristics of variable contribution, which complements the earnings of programmed retirements and benefits from risks (death, physical invalidity, and sickness benefit). At that time we provided our Brazilian active employees the option to migrate to the “New Plan” (a Benefit Mix Plan – Vale Mais) which was taken up by over 98% of our active employees. The Old Plan will continue in existence, covering almost exclusively retired participants and their beneficiaries.
Additionally we provide supplementary payments to a specific group of former Brazilian employees, in addition to the regular benefits from Valia, through the “Abono Complementação”, which represents a postretirement health care, odontological and pharmaceutical benefit to this group of participants.
Upon the acquisition of Inco, we assumed benefits through defined benefit pension plans that cover essentially all its employees and post retirement benefits other than pensions that also provide certain health care and life insurance benefits for retired employees.

Notes to the Consolidated Financial Statements
F-27
The following information details the status of the defined benefit elements of all plans in accordance with SFAS 132 – “Employers’ Disclosure about Pensions and Other Post retirement Benefits” and SFAS 158 – “Employers’ Accounting for Defined Benefit Pension and Other Postretirement Plans”, as amended.
(a) Change in benefit obligation
As of December 31, 2007 2006
Overfunded pension plans
Underfunded pension plans
Underfunded other
benefits
Overfunded pension plans
Underfunded pension plans
Underfunded other
benefits
Benefit obligation at beginning of year .................. 2,531 3,743 1,287 1,783 250 78
Liability recognized upon consolidation of Inco ............ – 100 213 – 3,619 1,225
Service cost.............................. 9 61 20 5 14 4 Interest cost.............................. 306 229 78 246 79 25 Plan amendment....................... – 4 – – (76) – Assumptions changes............... – – – 465 52 13 Benefits paid ............................ (301) (279) (63) (173) (85) (22) Effect of exchange
rate changes .......................... 526 607 215 175 (108) (41) Actuarial loss (gain)................. 107 (29) (79) 30 (2) 5 Benefit obligation at
end of year ............................ 3,178 4,436 1,671 2,531 3,743 1,287 We use a measurement date of December 31 for our pension and post retirement benefit plans.
(b) Change in plan assets
As of December 31, 2007 2006
Overfunded pension plans
Underfunded pension plans
Underfunded other
benefits
Overfunded pension plans
Underfunded pension plans
Underfunded other
benefits
Fair value of plan assets at beginning of year .................. 3,508 3,078 4 2,781 63 –
Asset recognized upon consolidation of Inco ............ – – – – 2,924 4
Actual return on plan assets ..... 250 85 1 607 202 – Employer contributions............ 33 372 67 25 84 22 Benefits paid ............................ (301) (279) (63) (173) (85) (22) Effect of exchange
rate changes .......................... 697 506 1 268 (110) – Fair value of plan assets
at end of year ........................ 4,187 3,762 10 3,508 3,078 4

Notes to the Consolidated Financial Statements
F-28
Plan assets at December 31, 2007 include US$693 and US$73 of portfolio investments in our own shares (US$312 and US$46 at December 31, 2006) and debentures, respectively, and US$48 and US$0 of shares of related parties (US$36 and US$7 at December 31, 2006) and debentures, as well. They also include US$1,116 of Federal Government Securities (US$607 at December 31, 2006).
(c) Funded Status and Financial Position
As of December 31, 2007 2006
Overfunded
pension plans Underfunded pension plans
Underfunded other benefits
Overfunded pension plans
Underfunded pension plans
Underfunded other benefits
Other assets................... 1,009 – – 977 – – Current liabilities .......... – 54 77 – 42 65 Long-term liabilities ..... – 620 1,584 – 623 1,218
Funded status ................ 1,009 674 1,661 977 665 1,283
(d) Assumptions used in each year (expressed in nominal terms)
Brazil 2007 2006
Overfunded pension plans
Underfunded pension plans
Underfunded other benefits
Overfunded pension plans
Underfunded pension plans
Underfunded other benefits
Discount rate ...................... 10.24% p.a. 10.24% p.a. 10.24% p.a. 11.30% p.a. 11.30% p.a. 11.30% p.a. Expected return
on plan assets .................. 12.78% p.a. 11.70% p.a. – 14.98% p.a. 14.98% p.a. – Rate of compensation
increase – up to 47 years . 7.12% p.a. – – 8.15% p.a. – – Rate of compensation
increase – over 47 years .. 4.00% p.a. – – 5.00% p.a. – – Inflation.............................. 4.00% p.a. 4.00% p.a. 4.00% p.a. 5.00% p.a. 5.00% p.a. 5.00% p.a. Health care cost trend rate .. – – 7.64% p.a. – – 8.67% p.a.
Foreign 2007 2006
Overfunded pension plans
Underfunded pension plans
Underfunded other benefits
Overfunded pension plans
Underfunded pension plans
Underfunded other benefits
Discount rate ...................... – 5.21% p.a. 5.55% p.a. 5.00% p.a. – 5.00% p.a. Expected return on
plan assets ....................... – 7.18% p.a. 7.50% p.a. 7.50% p.a. – 7.50% p.a. Rate of compensation
increase – up to 47 years . – 4.01% p.a. 3.58% p.a. 3.00% p.a. – 3.00% p.a. Rate of compensation
increase – over 47 years .. – 4.01% p.a. 3.58% p.a. 3.00% p.a. – 3.00% p.a. Inflation.............................. – 2.00% p.a. 2.00% p.a. 1.80% p.a. – 1.80% p.a. Health care cost trend rate .. – – 6.35% p.a. – – 5.05% p.a.

Notes to the Consolidated Financial Statements
F-29
(e) Investment targets and composition of plan assets
• Overfunded pension plans
The fair value of the Brazil overfunded pension plan assets is US$4,187 and US$3,508 at the end of 2007 and 2006, respectively. There are no foreign overfunded pension plans assets at the period end. The asset allocation for these plans at the end of 2007 and 2006, and the target allocation for 2008, by asset category, follows:
Brazil Percentage of plan assets at December 31,
Target allocation for 2008 (Unaudited) 2007 2006
Equity securities.................................................... 27% 29% 30% Real estate............................................................. 6% 4% 5% Loans .................................................................... 6% 4% 4% Fixed Income ........................................................ 61% 63% 61%
Total...................................................................... 100% 100% 100% • Underfunded pension plans
The fair value of the underfunded pension plan assets is US$146 and US$91 at the end of 2007 and 2006, respectively, for Brazilian plans and US$3,616 and US$2,987 at the end of 2007 and 2006, respectively, for foreign plans. The asset allocation for these plans at the end of 2007 (Brazil and foreign) and 2006 (Brazil and foreign), and the target allocation for 2008, by asset category, follows:
Brazil Percentage of plan assets at December 31, Target allocation for
2008 (Unaudited) 2007 2006
Equity securities.................................................... 25% – 8% Real estate............................................................. – – 1% Loans .................................................................... 9% 5% 1% Fixed Income ........................................................ 66% 95% 90%
Total...................................................................... 100% 100% 100%
Foreign Percentage of plan assets at December 31, Target allocation for
2008 2007 2006
Equity securities.................................................... 61% 61% 61% Fixed Income ........................................................ 39% 39% 39%
Total...................................................................... 100% 100% 100% The fixed income asset allocation target for the Brazilian plans was established in order to surpass the benefit
obligation and to be used for the payment of short-term plans. The proposal for 2008 is to increase the investments in inflation-indexed funds.
The target for equity securities of these plans reflects the expected appreciation of the Brazilian stock markets as well as the volatility of the market and the decrease of the Brazilian interest rates.

Notes to the Consolidated Financial Statements
F-30
The asset allocation policy for the foreign plans of 39% fixed income and 61% equity securities, is maintained fairly close to the policy mix at most times by the use of a rebalancing policy.
• Underfunded other benefits
The fair value of the foreign underfunded other benefit assets is US$10 and US$4 at the end of 2007 and 2006, respectively. There are no Brazilian underfunded other benefit assets in our postretirement benefit other than pensions at the period end.
The asset allocation for these benefits at the end of 2007 and target allocation for 2008, by asset category, follows:
Foreign Percentage of plan assets at December 31,
Target allocation for 2008 (unaudited) 2007 2006
Equity securities.................................................... 61% 61% 61% Fixed Income ........................................................ 39% 39% 39%
Total...................................................................... 100% 100% 100% The asset allocation policy is the same for the foreing underfunded pension plan.
(f) Pension costs
As of December 31, 2007 2006
Overfunded
pension plans Underfunded pension plans
Underfunded other benefits
Overfunded pension plans
Underfunded pension plans
Underfunded other benefits
Service cost benefits earned during the period .................. 9 61 20 5 14 4 Interest cost on projected benefit obligation .................. 306 229 78 246 79 25 Expected return on assets.................... (570) (247) (4) (391) (63) – Amortization of initial transitory obligation.. 14 – – 12 – – Net deferral .................. (17) – – (28) – – Net periodic pension cost............................ (258) 43 94 (156) 30 29
Notes to the Consolidated Financial Statements
F-31
(g) Expected contributions and benefits
Employer contributions expected for 2008 are US$324.
The benefit payments, which reflect future service, as appropriate, are expected to be made as follows (unaudited):
2007
Overfunded pension plans
Underfunded pension plans
Underfunded other
benefits Total
2008 ........................................................................................ 230 319 79 628 2009 ........................................................................................ 233 323 84 640 2010 ........................................................................................ 235 320 88 643 2011 ........................................................................................ 237 316 93 646 2012 ........................................................................................ 238 312 98 648 2013 and thereafter ................................................................. 1,201 1,482 503 3,186
(h) Accumulated benefit obligation
2007 2006
Overfunded
pension plans Underfunded pension plans
Underfunded other benefits
Overfunded pension plans
Underfunded pension plans
Underfunded other benefits
Accumulated benefit obligation................ 3,166 4,293 1,671 2,524 3,680 1,287
Projected benefit obligation................ 3,178 4,436 1,671 2,531 3,743 1,287
Fair value of plan assets............... (4,187) (3,762) (10) (3,508) (3,078) (4)
(i) Impact of 1% variation in assumed health care cost trend rate
1% increase 1% decrease 2007 2006 2007 2006
Accumulated postretirement benefit obligation (APBO) .................................. 261 178 (201) (145) Interest and service costs .................................................................................. 15 15 (12) (12)
(j) Other Cumulative Comprehensive Income (Deficit)
1% increase 1% decrease 2007 2006 2007 2006
Accumulated postretirement benefit obligation (APBO) .................................. 261 178 (201) (145) Interest and service costs .................................................................................. 15 15 (12) (12)

Notes to the Consolidated Financial Statements
F-32
(l) Change in Other Cumulative Comprehensive Income (Deficit)
As of December 31, 2007 2006
Overfunded
pension plans Underfunded pension plans
Underfunded other benefits
Overfunded pension plans
Underfunded pension plans
Underfunded other benefits
Net transition obligation/(asset) not yet recognized in NPPC at beginning of period .... (38) – – (46) – –
Net actuarial loss/(gain) not yet recognized in NPPC at beginning of period........ (491) (33) (11) 736 10 (5)
Deferred income tax at beginning of period........ (154) 11 4 (234) (3) 2
Effect of initial recognition of cumulative comprehensive income (deficit).............. 299 (22) (7) 456 7 (3)
Change in the period ......... Amortization of
net transition obligation/(asset)............ 14 – – 12 – –
Amortization of net actuarial loss/(gain)........ (17) – – (28) – –
Total net actuarial loss/(gain) arising during period.................. (480) (1) 108 (286) (44) 124
Effect of exchange rate changes ................... 94 (7) (2) 66 1 –
Deferred income tax .......... 132 3 (39) 80 14 (46) Total recognized in
other cumulative comprehensive income (deficit).............. 42 (27) 60 300 (22) 75
(m) Net periodic pension cost for the next year
As of December 31, 2008
Overfunded
pension plans Underfunded pension plans
Underfunded other benefits
Service cost................................................................................... 12 64 24 Interest cost................................................................................... 314 260 97 Expected return on plan assets ...................................................... (523) (268) (4) Net transition obligation / (asset) amortization ............................. 15 – – Net actuarial loss / (gain) amortization ......................................... (6) 2 –
(188) 58 117
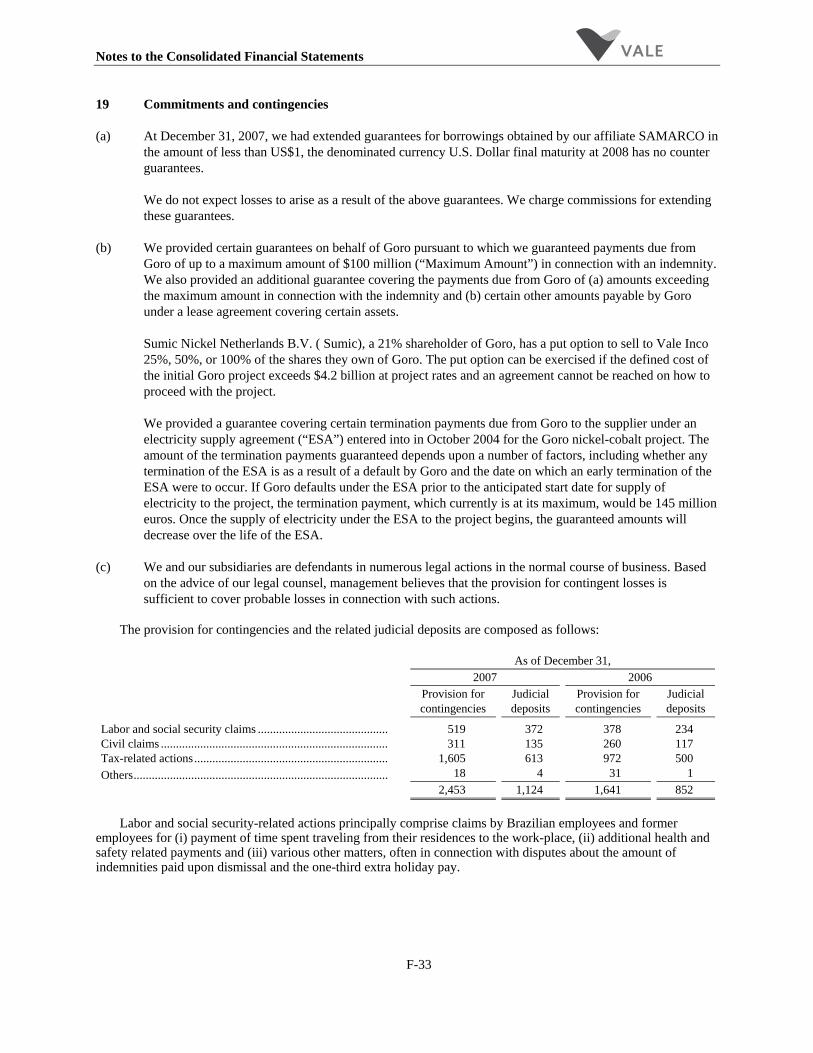
Notes to the Consolidated Financial Statements
F-33
19 Commitments and contingencies
(a) At December 31, 2007, we had extended guarantees for borrowings obtained by our affiliate SAMARCO in the amount of less than US$1, the denominated currency U.S. Dollar final maturity at 2008 has no counter guarantees.
We do not expect losses to arise as a result of the above guarantees. We charge commissions for extending these guarantees.
(b) We provided certain guarantees on behalf of Goro pursuant to which we guaranteed payments due from Goro of up to a maximum amount of $100 million (“Maximum Amount”) in connection with an indemnity. We also provided an additional guarantee covering the payments due from Goro of (a) amounts exceeding the maximum amount in connection with the indemnity and (b) certain other amounts payable by Goro under a lease agreement covering certain assets.
Sumic Nickel Netherlands B.V. ( Sumic), a 21% shareholder of Goro, has a put option to sell to Vale Inco 25%, 50%, or 100% of the shares they own of Goro. The put option can be exercised if the defined cost of the initial Goro project exceeds $4.2 billion at project rates and an agreement cannot be reached on how to proceed with the project.
We provided a guarantee covering certain termination payments due from Goro to the supplier under an electricity supply agreement (“ESA”) entered into in October 2004 for the Goro nickel-cobalt project. The amount of the termination payments guaranteed depends upon a number of factors, including whether any termination of the ESA is as a result of a default by Goro and the date on which an early termination of the ESA were to occur. If Goro defaults under the ESA prior to the anticipated start date for supply of electricity to the project, the termination payment, which currently is at its maximum, would be 145 million euros. Once the supply of electricity under the ESA to the project begins, the guaranteed amounts will decrease over the life of the ESA.
(c) We and our subsidiaries are defendants in numerous legal actions in the normal course of business. Based on the advice of our legal counsel, management believes that the provision for contingent losses is sufficient to cover probable losses in connection with such actions.
The provision for contingencies and the related judicial deposits are composed as follows:
As of December 31, 2007 2006
Provision for contingencies
Judicial deposits
Provision for contingencies
Judicial deposits
Labor and social security claims ........................................... 519 372 378 234 Civil claims ........................................................................... 311 135 260 117 Tax-related actions................................................................ 1,605 613 972 500 Others.................................................................................... 18 4 31 1
2,453 1,124 1,641 852 Labor and social security-related actions principally comprise claims by Brazilian employees and former
employees for (i) payment of time spent traveling from their residences to the work-place, (ii) additional health and safety related payments and (iii) various other matters, often in connection with disputes about the amount of indemnities paid upon dismissal and the one-third extra holiday pay.

Notes to the Consolidated Financial Statements
F-34
Civil – actions principally related to claims made against us by contractors in Brazil in connection with losses alleged to have been incurred by them as a result of various past government economic stabilization plans during which full indexation of contracts for inflation was not permitted as well as for accidents and land appropriations.
Tax – tax-related actions principally comprise our challenges of certain revenue taxes and value added taxes positions and uncertain tax positions.
We continue to vigorously pursue our interests in all the above actions but recognize that we probably will incur some losses in the final instance, for which we have made provisions.
Our judicial deposits are made as required by the courts for us to be able to enter or continue a legal action. When judgment is favorable to us, we receive the deposits back; when unfavorable, the deposits are delivered to the prevailing party.
Contingencies settled in 2007, 2006 and 2005 aggregated US$331, US$424 and US$114, respectively, and additional provisions aggregated US$364, US$439 and US$141, respectively, classified in other operating expenses.
In addition to the contingencies for which we have made provisions we are defending claims where in our opinion, and based on the advice of our legal counsel, the likelihood of loss is possible but not probable, in the total of US$2,381 at December 31, 2007 and for which no provision has been made.
(d) We are committed under a take-or-pay agreement to purchase approximately 16,450 thousand metric tons of bauxite from Mineração Rio do Norte S.A. – MRN at a formula price, calculated based on the current London Metal Exchange (LME) quotation for aluminum. Based on a market price of US$31.60 per metric ton as of December 31, 2007, this arrangement represents the following total commitment per metric ton as of December 31, 2007, this arrangement represents the following total commitment:
2008 .............................................................................................................................................................. 269 2009 .............................................................................................................................................................. 251
520
(e) At the time of our privatization in 1997, we issued shareholder revenue interests known in Brazil as “debentures” to our then-existing shareholders, including the Brazilian Government. The terms of the “debentures”, were set to ensure that our pre-privatization shareholders, including the Brazilian Government, would participate alongside us in potential future financial benefits that we are able to derive from exploiting our mineral resources.
In preparation for the issuance of the debentures, we issued series B preferred shares on a one-for-one basis to all holders of our common shares and series A preferred shares. We then exchanged all of the series B shares for the debentures at par value. The debentures are not redeemable or convertible, and do not trade on a stapled basis or otherwise with our common or preferred shares. During 2002 we registered the debentures with the Brazilian Securities Commissions (CVM) in order to permit trading.
Under the terms of the debentures, holders will have the right to receive semi-annual payments equal to an agreed percentage of our net revenues (revenues less value added tax) from certain identified mineral resources that we owned as of May 1997, to the extent that we exceed defined threshold production volumes of these resources, and from the sale of mineral rights that we owned as of May 1997. Our obligation to make payments to the holders will cease when the relevant mineral resources are exhausted at which time we are required to repay the original par value plus accrued interest. Based on current production levels, and estimates for new projects, we began payments relating to copper resources in 2004 and expect to start payments relating to iron ore resources from approximately 2020 for our Northern System and 2030 for our Southern System in Brazil, and payments related to other mineral resources at the end of the current decade.
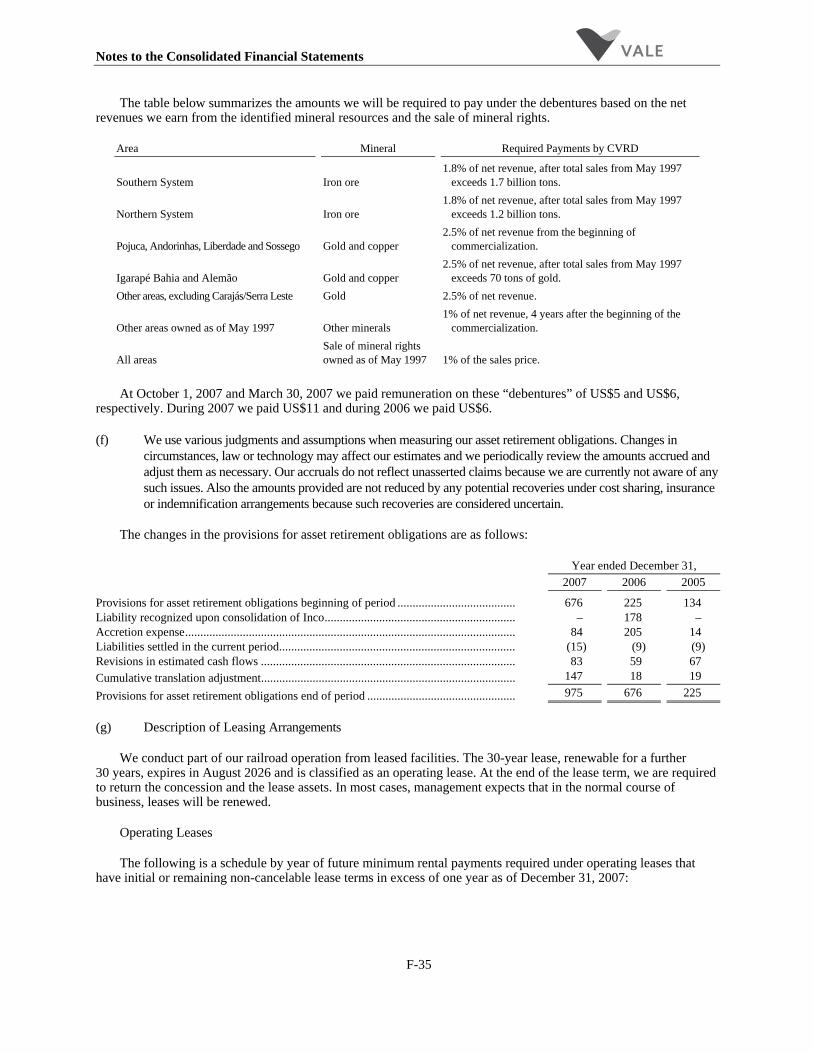
Notes to the Consolidated Financial Statements
F-35
The table below summarizes the amounts we will be required to pay under the debentures based on the net revenues we earn from the identified mineral resources and the sale of mineral rights.
Area Mineral Required Payments by CVRD
Southern System Iron ore 1.8% of net revenue, after total sales from May 1997 exceeds 1.7 billion tons.
Northern System Iron ore 1.8% of net revenue, after total sales from May 1997 exceeds 1.2 billion tons.
Pojuca, Andorinhas, Liberdade and Sossego Gold and copper 2.5% of net revenue from the beginning of commercialization.
Igarapé Bahia and Alemão Gold and copper 2.5% of net revenue, after total sales from May 1997 exceeds 70 tons of gold.
Other areas, excluding Carajás/Serra Leste Gold 2.5% of net revenue.
Other areas owned as of May 1997 Other minerals 1% of net revenue, 4 years after the beginning of the commercialization.
All areas Sale of mineral rights owned as of May 1997 1% of the sales price.
At October 1, 2007 and March 30, 2007 we paid remuneration on these “debentures” of US$5 and US$6,
respectively. During 2007 we paid US$11 and during 2006 we paid US$6.
(f) We use various judgments and assumptions when measuring our asset retirement obligations. Changes in circumstances, law or technology may affect our estimates and we periodically review the amounts accrued and adjust them as necessary. Our accruals do not reflect unasserted claims because we are currently not aware of any such issues. Also the amounts provided are not reduced by any potential recoveries under cost sharing, insurance or indemnification arrangements because such recoveries are considered uncertain.
The changes in the provisions for asset retirement obligations are as follows:
Year ended December 31, 2007 2006 2005
Provisions for asset retirement obligations beginning of period ....................................... 676 225 134 Liability recognized upon consolidation of Inco............................................................... – 178 – Accretion expense............................................................................................................. 84 205 14 Liabilities settled in the current period.............................................................................. (15) (9) (9) Revisions in estimated cash flows .................................................................................... 83 59 67 Cumulative translation adjustment.................................................................................... 147 18 19
Provisions for asset retirement obligations end of period ................................................. 975 676 225
(g) Description of Leasing Arrangements
We conduct part of our railroad operation from leased facilities. The 30-year lease, renewable for a further 30 years, expires in August 2026 and is classified as an operating lease. At the end of the lease term, we are required to return the concession and the lease assets. In most cases, management expects that in the normal course of business, leases will be renewed.
Operating Leases
The following is a schedule by year of future minimum rental payments required under operating leases that have initial or remaining non-cancelable lease terms in excess of one year as of December 31, 2007:

Notes to the Consolidated Financial Statements
F-36
Year ending December 31:
2008 .............................................................................................................................................................. 62 2009 .............................................................................................................................................................. 62 2010 .............................................................................................................................................................. 62 2011 .............................................................................................................................................................. 62 2012 thereafter .............................................................................................................................................. 888
Total minimum payments required ............................................................................................................... 1,136 The total expenses of operating leases in 2007, 2006 and 2005 was US$62, US$48 and US$42, respectively.
20 Segment and geographical information
We adopt SFAS 131 “Disclosures about Segments of an Enterprise and Related Information” with respect to the information we present about our operating segments. SFAS 131 introduced a “management approach” concept for reporting segment information, whereby such information is required to be reported on the basis that the chief decision-maker uses internally for evaluating segment performance and deciding how to allocate resources to segments. We analyze our segment information on aggregated and disaggregated basis as follows:
Ferrous products – comprises iron ore mining and pellet production, as well as our Brazilian Northern and Southern transportation systems, including railroads, ports and terminals, as they pertain to mining operations. Manganese mining and ferroalloys are also included in this segment.
Non-ferrous – comprises the production of non-ferrous minerals, including nickel (co-products and by-products), potash, kaolin and copper.
Logistics – comprises our transportation systems as they pertain to the operation of our ships, ports and railroads for third-party cargos.
Holdings – divided into the following sub-groups:
• Aluminum – comprises aluminum trading activities, alumina refining and aluminum metal smelting and investments in joint ventures and affiliates engaged in bauxite mining.
• Others – comprises our investments in joint ventures and affiliates engaged in other businesses.
Information presented to senior management with respect to the performance of each segment is generally derived directly from the accounting records maintained in accordance with accounting practices adopted in Brazil together with certain minor inter-segment allocations.
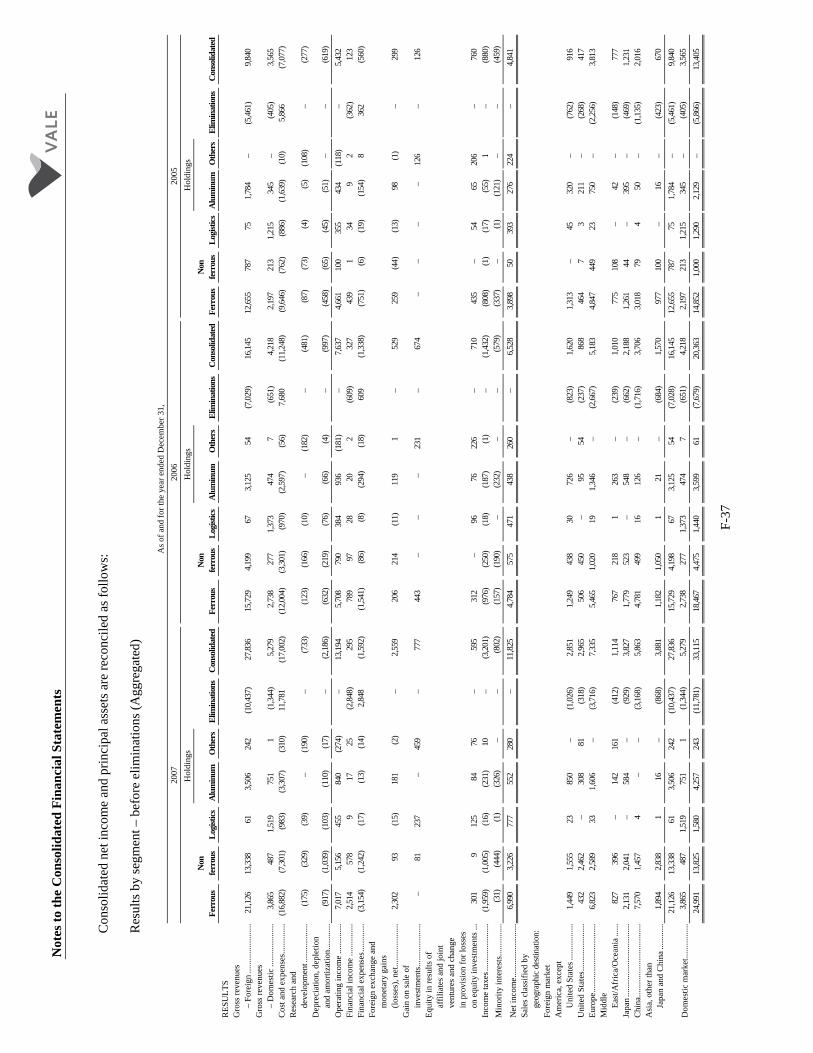
Not
es to
the
Con
solid
ated
Fin
anci
al S
tate
men
ts
F-
37
Con
solid
ated
net
inco
me
and
prin
cipa
l ass
ets a
re re
conc
iled
as fo
llow
s:
Res
ults
by
segm
ent –
bef
ore
elim
inat
ions
(Agg
rega
ted)
A
s of a
nd fo
r the
yea
r end
ed D
ecem
ber 3
1,
20
07
2006
20
05
Hol
ding
s
Hol
ding
s
Hol
ding
s
Fe
rrou
s N
on
ferr
ous
Logi
stics
A
lum
inum
O
ther
s El
imin
atio
ns
Con
solid
ated
Fe
rrou
s N
on
ferr
ous
Logi
stics
A
lum
inum
O
ther
s El
imin
atio
ns
Con
solid
ated
Fe
rrou
s N
on
ferr
ous
Logi
stics
Alu
min
umO
ther
sEl
imin
atio
ns
Con
solid
ated
R
ESU
LTS
G
ross
reve
nues
–
Fore
ign
......
......
......
.....
21,1
26
13,3
38
61
3,50
6 24
2 (1
0,43
7)
27,8
36
15,7
29
4,19
9 67
3,
125
54
(7,0
29)
16,1
45
12,6
55
787
75
1,78
4 –
(5,4
61)
9,84
0 G
ross
reve
nues
–
Dom
estic
......
......
......
..3,
865
487
1,51
9 75
1 1
(1,3
44)
5,27
9 2,
738
277
1,37
3 47
4 7
(651
) 4,
218
2,19
7 21
3 1,
215
345
– (4
05)
3,56
5 C
ost a
nd e
xpen
ses..
......
......
(16,
882)
(7
,301
) (9
83)
(3,3
07)
(310
) 11
,781
(1
7,00
2)
(12,
004)
(3
,301
) (9
70)
(2,5
97)
(56)
7,
680
(11,
248)
(9
,646
) (7
62)
(886
) (1
,639
) (1
0)
5,86
6 (7
,077
) R
esea
rch
and
deve
lopm
ent..
......
......
....
(175
) (3
29)
(39)
–
(190
) –
(733
) (1
23)
(166
) (1
0)
– (1
82)
– (4
81)
(87)
(7
3)
(4)
(5)
(108
) –
(277
) D
epre
ciat
ion,
dep
letio
n an
d am
ortiz
atio
n....
......
..(9
17)
(1,0
39)
(103
) (1
10)
(17)
–
(2,1
86)
(632
) (2
19)
(76)
(6
6)
(4)
– (9
97)
(458
) (6
5)
(45)
(5
1)
– –
(619
) O
pera
ting
inco
me.
......
......
.7,
017
5,15
6 45
5 84
0 (2
74)
– 13
,194
5,
708
790
384
936
(181
) –
7,63
7 4,
661
100
355
434
(118
) –
5,43
2 Fi
nanc
ial i
ncom
e...
......
..... .
2,51
4 57
8 9
17
25
(2,8
48)
295
789
97
28
20
2 (6
09)
327
439
1 34
9
2 (3
62)
123
Fina
ncia
l exp
ense
s....
......
.. .(3
,154
) (1
,242
) (1
7)
(13)
(1
4)
2,84
8 (1
,592
) (1
,541
) (8
6)
(8)
(294
) (1
8)
609
(1,3
38)
(751
) (6
) (1
9)
(154
) 8
362
(560
) Fo
reig
n ex
chan
ge a
nd
mon
etar
y ga
ins
(loss
es),
net..
......
......
......
2,30
2 93
(1
5)
181
(2)
– 2,
559
206
214
(11)
11
9 1
– 52
9 25
9 (4
4)
(13)
98
(1
) –
299
Gai
n on
sale
of
inve
stm
ents
......
......
......
. .–
81
237
– 45
9 –
777
443
– –
– 23
1 –
674
– –
– –
126
– 12
6 Eq
uity
in re
sults
of
affil
iate
s and
join
t ve
ntur
es a
nd c
hang
e in
pro
visi
on fo
r los
ses
on e
quity
inve
stm
ents
...30
1 9
125
84
76
– 59
5 31
2 –
96
76
226
– 71
0 43
5 –
54
65
206
– 76
0 In
com
e ta
xes.
......
......
......
...(1
,959
) (1
,005
) (1
6)
(231
) 10
–
(3,2
01)
(976
) (2
50)
(18)
(1
87)
(1)
– (1
,432
) (8
08)
(1)
(17)
(5
5)
1 –
(880
) M
inor
ity in
tere
sts..
......
......
.(3
1)
(444
) (1
) (3
26)
– –
(802
) (1
57)
(190
) –
(232
) –
– (5
79)
(337
) –
(1)
(121
) –
– (4
59)
Net
inco
me.
......
......
......
......
6,99
0 3,
226
777
552
280
– 11
,825
4,
784
575
471
438
260
– 6,
528
3,89
8 50
39
3 27
6 22
4 –
4,84
1
Sale
s cla
ssifi
ed b
y ge
ogra
phic
des
tinat
ion:
Fore
ign
mar
ket
A
mer
ica,
exc
ept
Uni
ted
Stat
es...
......
......
..1,
449
1,55
5 23
85
0 –
(1,0
26)
2,85
1 1,
249
438
30
726
– (8
23)
1,62
0 1,
313
– 45
32
0 –
(762
) 91
6 U
nite
d St
ates
......
......
......
....
432
2,46
2 –
308
81
(318
) 2,
965
506
450
– 95
54
(2
37)
868
464
7 3
211
– (2
68)
417
Euro
pe...
......
......
......
......
.... .
6,82
3 2,
589
33
1,60
6 –
(3,7
16)
7,33
5 5,
465
1,02
0 19
1,
346
– (2
,667
) 5,
183
4,84
7 44
9 23
75
0 –
(2,2
56)
3,81
3 M
iddl
e Ea
st/A
fric
a/O
cean
ia...
.. .82
7 39
6 –
142
161
(412
) 1,
114
767
218
1 26
3 –
(239
) 1,
010
775
108
– 42
–
(148
) 77
7
Japa
n....
......
......
......
......
..... .
2,13
1 2,
041
– 58
4 –
(929
) 3,
827
1,77
9 52
3 –
548
– (6
62)
2,18
8 1,
261
44
– 39
5 –
(469
) 1,
231
Chi
na...
......
......
......
......
......
.7,
570
1,45
7 4
– –
(3,1
68)
5,86
3 4,
781
499
16
126
– (1
,716
) 3,
706
3,01
8 79
4
50
– (1
,135
) 2,
016
Asi
a, o
ther
than
Ja
pan
and
Chi
na...
......
.. .1,
894
2,83
8 1
16
– (8
68)
3,88
1 1,
182
1,05
0 1
21
– (6
84)
1,57
0 97
7 10
0 –
16
– (4
23)
670
21
,126
13
,338
61
3,
506
242
(10,
437)
27
,836
15
,729
4,
198
67
3,12
5 54
(7
,028
) 16
,145
12
,655
78
7 75
1,
784
– (5
,461
) 9,
840
Dom
estic
mar
ket..
......
......
. .3,
865
487
1,51
9 75
1 1
(1,3
44)
5,27
9 2,
738
277
1,37
3 47
4 7
(651
) 4,
218
2,19
7 21
3 1,
215
345
– (4
05)
3,56
5
24
,991
13
,825
1,
580
4,25
7 24
3 (1
1,78
1)
33,1
15
18,4
67
4,47
5 1,
440
3,59
9 61
(7
,679
) 20
,363
14
,852
1,
000
1,29
0 2,
129
– (5
,866
) 13
,405
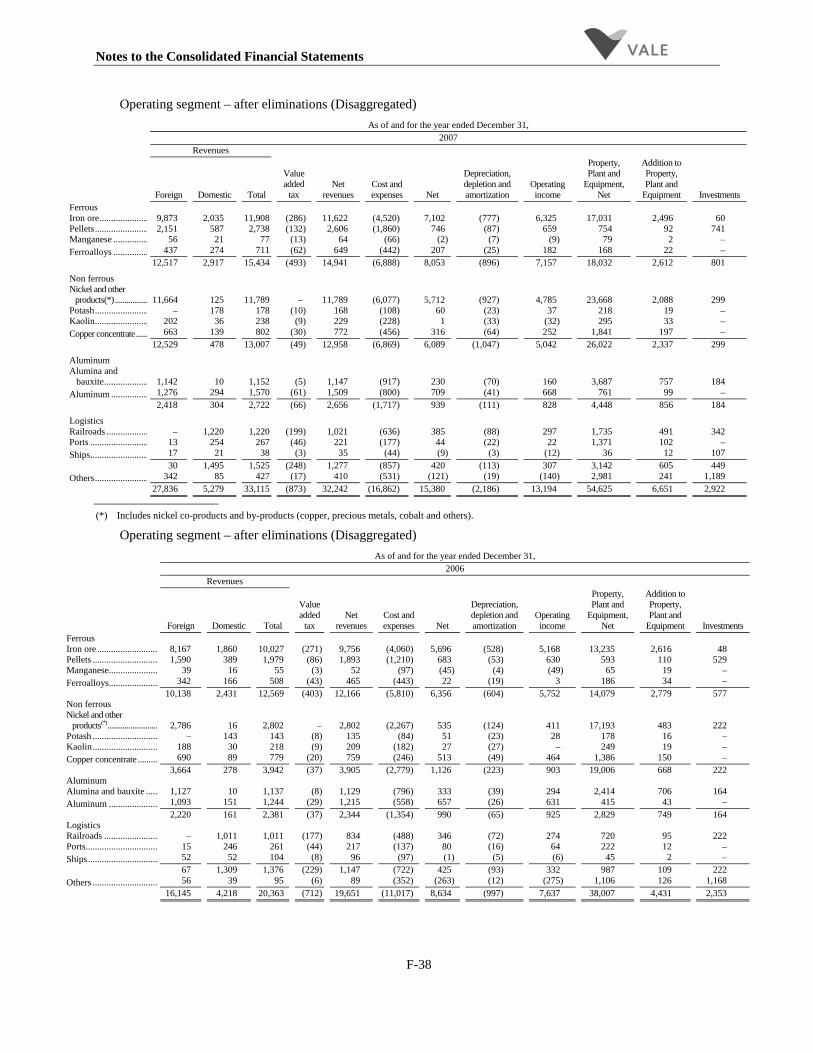
Notes to the Consolidated Financial Statements
F-38
Operating segment – after eliminations (Disaggregated) As of and for the year ended December 31, 2007 Revenues
Foreign Domestic Total
Value added
tax Net
revenues Cost and expenses Net
Depreciation, depletion and amortization
Operating income
Property, Plant and
Equipment, Net
Addition to Property, Plant and
Equipment Investments Ferrous Iron ore..................... 9,873 2,035 11,908 (286) 11,622 (4,520) 7,102 (777) 6,325 17,031 2,496 60 Pellets....................... 2,151 587 2,738 (132) 2,606 (1,860) 746 (87) 659 754 92 741 Manganese ............... 56 21 77 (13) 64 (66) (2) (7) (9) 79 2 – Ferroalloys ............... 437 274 711 (62) 649 (442) 207 (25) 182 168 22 – 12,517 2,917 15,434 (493) 14,941 (6,888) 8,053 (896) 7,157 18,032 2,612 801
Non ferrous Nickel and other products(*)................. 11,664 125 11,789 – 11,789 (6,077) 5,712 (927) 4,785 23,668 2,088 299 Potash....................... – 178 178 (10) 168 (108) 60 (23) 37 218 19 – Kaolin....................... 202 36 238 (9) 229 (228) 1 (33) (32) 295 33 – Copper concentrate...... 663 139 802 (30) 772 (456) 316 (64) 252 1,841 197 – 12,529 478 13,007 (49) 12,958 (6,869) 6,089 (1,047) 5,042 26,022 2,337 299
Aluminum Alumina and bauxite................... 1,142 10 1,152 (5) 1,147 (917) 230 (70) 160 3,687 757 184 Aluminum ................ 1,276 294 1,570 (61) 1,509 (800) 709 (41) 668 761 99 – 2,418 304 2,722 (66) 2,656 (1,717) 939 (111) 828 4,448 856 184
Logistics Railroads .................. – 1,220 1,220 (199) 1,021 (636) 385 (88) 297 1,735 491 342 Ports ......................... 13 254 267 (46) 221 (177) 44 (22) 22 1,371 102 – Ships......................... 17 21 38 (3) 35 (44) (9) (3) (12) 36 12 107 30 1,495 1,525 (248) 1,277 (857) 420 (113) 307 3,142 605 449 Others....................... 342 85 427 (17) 410 (531) (121) (19) (140) 2,981 241 1,189
27,836 5,279 33,115 (873) 32,242 (16,862) 15,380 (2,186) 13,194 54,625 6,651 2,922
(*) Includes nickel co-products and by-products (copper, precious metals, cobalt and others).
Operating segment – after eliminations (Disaggregated) As of and for the year ended December 31, 2006 Revenues Foreign Domestic Total
Value added
tax Net
revenues Cost and expenses Net
Depreciation, depletion and amortization
Operating income
Property, Plant and
Equipment, Net
Addition to Property, Plant and
Equipment Investments Ferrous Iron ore .......................... 8,167 1,860 10,027 (271) 9,756 (4,060) 5,696 (528) 5,168 13,235 2,616 48 Pellets ............................ 1,590 389 1,979 (86) 1,893 (1,210) 683 (53) 630 593 110 529 Manganese..................... 39 16 55 (3) 52 (97) (45) (4) (49) 65 19 – Ferroalloys..................... 342 166 508 (43) 465 (443) 22 (19) 3 186 34 – 10,138 2,431 12,569 (403) 12,166 (5,810) 6,356 (604) 5,752 14,079 2,779 577 Non ferrous Nickel and other products(*).......................... 2,786 16 2,802 – 2,802 (2,267) 535 (124) 411 17,193 483 222 Potash ............................ – 143 143 (8) 135 (84) 51 (23) 28 178 16 – Kaolin............................ 188 30 218 (9) 209 (182) 27 (27) – 249 19 – Copper concentrate ......... 690 89 779 (20) 759 (246) 513 (49) 464 1,386 150 – 3,664 278 3,942 (37) 3,905 (2,779) 1,126 (223) 903 19,006 668 222 Aluminum Alumina and bauxite ..... 1,127 10 1,137 (8) 1,129 (796) 333 (39) 294 2,414 706 164 Aluminum ..................... 1,093 151 1,244 (29) 1,215 (558) 657 (26) 631 415 43 – 2,220 161 2,381 (37) 2,344 (1,354) 990 (65) 925 2,829 749 164 Logistics Railroads ....................... – 1,011 1,011 (177) 834 (488) 346 (72) 274 720 95 222 Ports............................... 15 246 261 (44) 217 (137) 80 (16) 64 222 12 – Ships.............................. 52 52 104 (8) 96 (97) (1) (5) (6) 45 2 – 67 1,309 1,376 (229) 1,147 (722) 425 (93) 332 987 109 222 Others ............................ 56 39 95 (6) 89 (352) (263) (12) (275) 1,106 126 1,168
16,145 4,218 20,363 (712) 19,651 (11,017) 8,634 (997) 7,637 38,007 4,431 2,353
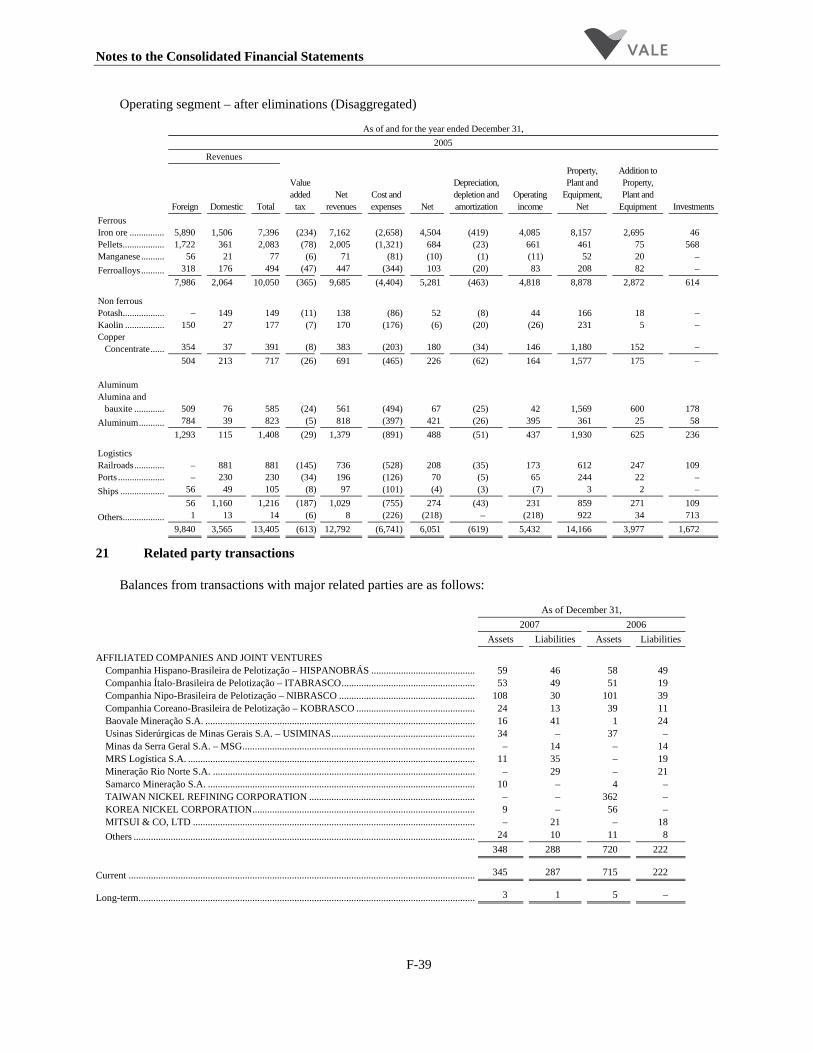
Notes to the Consolidated Financial Statements
F-39
Operating segment – after eliminations (Disaggregated)
As of and for the year ended December 31,
2005
Revenues
Foreign Domestic Total
Value added
tax Net
revenues Cost and expenses Net
Depreciation, depletion and amortization
Operating income
Property, Plant and
Equipment, Net
Addition to Property, Plant and
Equipment Investments Ferrous Iron ore ............... 5,890 1,506 7,396 (234) 7,162 (2,658) 4,504 (419) 4,085 8,157 2,695 46 Pellets.................. 1,722 361 2,083 (78) 2,005 (1,321) 684 (23) 661 461 75 568 Manganese .......... 56 21 77 (6) 71 (81) (10) (1) (11) 52 20 – Ferroalloys .......... 318 176 494 (47) 447 (344) 103 (20) 83 208 82 – 7,986 2,064 10,050 (365) 9,685 (4,404) 5,281 (463) 4,818 8,878 2,872 614
Non ferrous Potash.................. – 149 149 (11) 138 (86) 52 (8) 44 166 18 – Kaolin ................. 150 27 177 (7) 170 (176) (6) (20) (26) 231 5 – Copper Concentrate...... 354 37 391 (8) 383 (203) 180 (34) 146 1,180 152 – 504 213 717 (26) 691 (465) 226 (62) 164 1,577 175 – Aluminum Alumina and bauxite ............. 509 76 585 (24) 561 (494) 67 (25) 42 1,569 600 178 Aluminum........... 784 39 823 (5) 818 (397) 421 (26) 395 361 25 58 1,293 115 1,408 (29) 1,379 (891) 488 (51) 437 1,930 625 236
Logistics Railroads............. – 881 881 (145) 736 (528) 208 (35) 173 612 247 109 Ports .................... – 230 230 (34) 196 (126) 70 (5) 65 244 22 – Ships ................... 56 49 105 (8) 97 (101) (4) (3) (7) 3 2 – 56 1,160 1,216 (187) 1,029 (755) 274 (43) 231 859 271 109 Others.................. 1 13 14 (6) 8 (226) (218) – (218) 922 34 713
9,840 3,565 13,405 (613) 12,792 (6,741) 6,051 (619) 5,432 14,166 3,977 1,672
21 Related party transactions
Balances from transactions with major related parties are as follows:
As of December 31,
2007 2006
Assets Liabilities Assets Liabilities
AFFILIATED COMPANIES AND JOINT VENTURES Companhia Hispano-Brasileira de Pelotização – HISPANOBRÁS .......................................... 59 46 58 49 Companhia Ítalo-Brasileira de Pelotização – ITABRASCO...................................................... 53 49 51 19 Companhia Nipo-Brasileira de Pelotização – NIBRASCO ....................................................... 108 30 101 39 Companhia Coreano-Brasileira de Pelotização – KOBRASCO ................................................ 24 13 39 11 Baovale Mineração S.A. ............................................................................................................. 16 41 1 24 Usinas Siderúrgicas de Minas Gerais S.A. – USIMINAS.......................................................... 34 – 37 – Minas da Serra Geral S.A. – MSG.............................................................................................. – 14 – 14 MRS Logística S.A. .................................................................................................................... 11 35 – 19 Mineração Rio Norte S.A. .......................................................................................................... – 29 – 21 Samarco Mineração S.A. ............................................................................................................ 10 – 4 – TAIWAN NICKEL REFINING CORPORATION ................................................................... – – 362 – KOREA NICKEL CORPORATION.......................................................................................... 9 – 56 – MITSUI & CO, LTD .................................................................................................................. – 21 – 18 Others .......................................................................................................................................... 24 10 11 8
348 288 720 222
Current ............................................................................................................................................ 345 287 715 222
Long-term........................................................................................................................................ 3 1 5 –
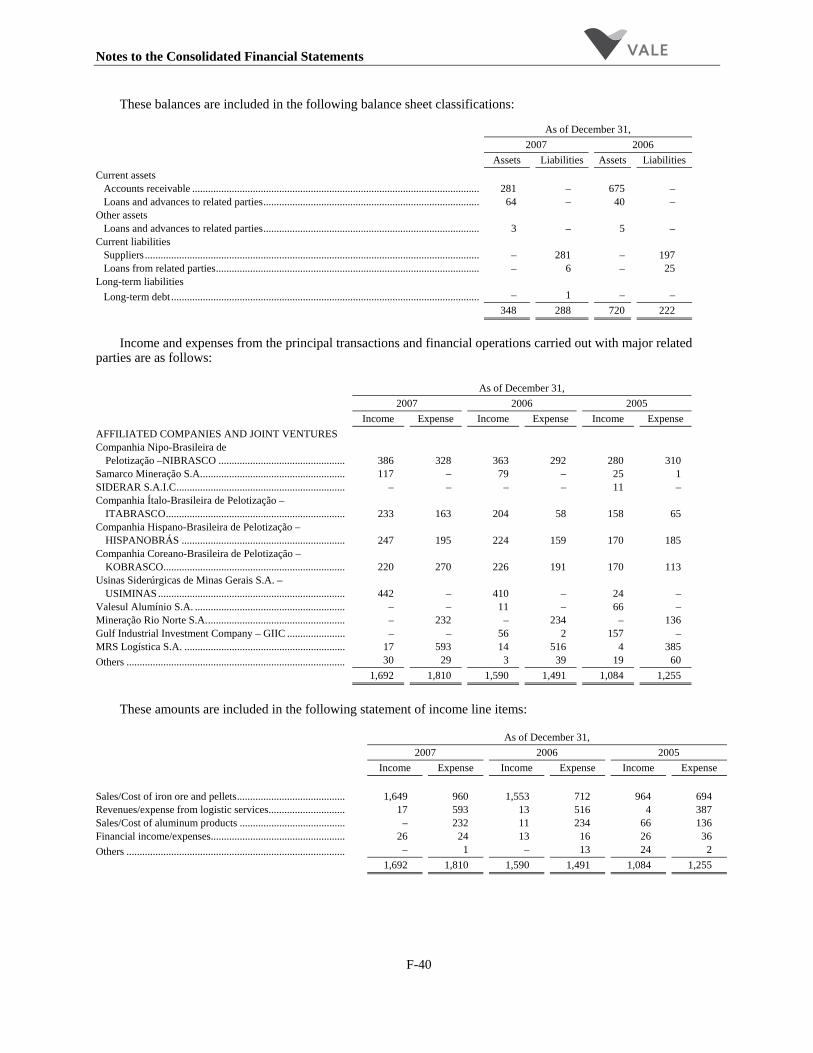
Notes to the Consolidated Financial Statements
F-40
These balances are included in the following balance sheet classifications:
As of December 31, 2007 2006 Assets Liabilities Assets Liabilities
Current assets Accounts receivable .............................................................................................................. 281 – 675 – Loans and advances to related parties................................................................................... 64 – 40 – Other assets Loans and advances to related parties................................................................................... 3 – 5 – Current liabilities Suppliers................................................................................................................................ – 281 – 197 Loans from related parties..................................................................................................... – 6 – 25 Long-term liabilities Long-term debt ...................................................................................................................... – 1 – –
348 288 720 222
Income and expenses from the principal transactions and financial operations carried out with major related
parties are as follows:
As of December 31, 2007 2006 2005 Income Expense Income Expense Income Expense AFFILIATED COMPANIES AND JOINT VENTURES Companhia Nipo-Brasileira de
Pelotização –NIBRASCO ................................................ 386 328 363 292 280 310 Samarco Mineração S.A....................................................... 117 – 79 – 25 1 SIDERAR S.A.I.C................................................................ – – – – 11 – Companhia Ítalo-Brasileira de Pelotização –
ITABRASCO.................................................................... 233 163 204 58 158 65 Companhia Hispano-Brasileira de Pelotização –
HISPANOBRÁS .............................................................. 247 195 224 159 170 185 Companhia Coreano-Brasileira de Pelotização –
KOBRASCO..................................................................... 220 270 226 191 170 113 Usinas Siderúrgicas de Minas Gerais S.A. –
USIMINAS....................................................................... 442 – 410 – 24 – Valesul Alumínio S.A. ......................................................... – – 11 – 66 – Mineração Rio Norte S.A..................................................... – 232 – 234 – 136 Gulf Industrial Investment Company – GIIC ...................... – – 56 2 157 – MRS Logística S.A. ............................................................. 17 593 14 516 4 385 Others ................................................................................... 30 29 3 39 19 60
1,692 1,810 1,590 1,491 1,084 1,255
These amounts are included in the following statement of income line items:
As of December 31, 2007 2006 2005 Income Expense Income Expense Income Expense Sales/Cost of iron ore and pellets......................................... 1,649 960 1,553 712 964 694 Revenues/expense from logistic services............................. 17 593 13 516 4 387 Sales/Cost of aluminum products ........................................ – 232 11 234 66 136 Financial income/expenses................................................... 26 24 13 16 26 36 Others ................................................................................... – 1 – 13 24 2
1,692 1,810 1,590 1,491 1,084 1,255

Notes to the Consolidated Financial Statements
F-41
Additionally the Company has with Mitsui & Co, Ltd, Bradesco, Banco Nacional de Desenvolvimento Social and BNDES Participações S.A in the amounts of US$13, US$3,142, US$236 and US$376, related to loans instrument with interests at market condition, whose major maturity is November of 2013. These values are recorded in loans and financings disclosed in Note 15.
The Company still has operations cash equivalents with Bradesco in the amount of US$18 in 2007.
22 Fair value of financial instruments
The carrying amount of our current financial instruments generally approximates fair market value because of the short-term maturity or frequent repricing of these instruments.
The market value of our listed long-term investments, where available, is disclosed in Note 13.
Based on borrowing rates currently available to us for bank loans with similar terms and average maturities, the fair market value of long-term debt (current portion not included) at December 31, 2007 and 2006 is estimated as follows:
As of December 31, 2007 2006
Fair market value ........................................................................................................... 17,942 21,746 Carrying value ............................................................................................................... 17,608 21,122
Fair market value estimates are made at a specific point in time, based on relevant market information and
information about the financial instruments. Changes in assumptions could significantly affect the estimates.
23 Derivative financial instruments
The main market risks we face are interest rate risk, exchange rate risk and commodity price risk. We manage some of these risks through the use of derivative instruments. Our risk management activities follow the risk management policy, which requires diversification of transactions and counter-parties. We monitor and evaluate our overall position regularly in order to evaluate financial results and impact on our cash flow. We also periodically review the credit limits and credit worthiness of our hedging counter-parties.
Risk Management Policy
We consider the effective management of risk a key objective to support our growth strategy and financial flexibility. In furtherance of this objective, the Board of Directors has established an enterprise risk management policy and a risk management committee. Under the policy, we measure, monitor, and manage risk at the portfolio level, using a single framework, and consider the natural diversification of our portfolio. We hedge our market risk only when considered necessary to support our corporate strategy or to maintain our target level of financial flexibility.
The risk management committee assists our Executive Directors in overseeing and reviewing information regarding our enterprise risk management and framework, including the significant policies, procedures and practices employed to manage risk. Our enterprise risk management policy is designed to promote an effective risk management system and to ensure that enterprise-level risks are reported at least quarterly to the risk management committee.

Notes to the Consolidated Financial Statements
F-42
We address some of the risks through the use of derivative instruments. Our risk management activities follow the risk management policy, which generally prohibits speculative trading and short selling and requires diversification of transactions and counter-parties.
We monitor and evaluate our overall position regularly in order to evaluate financial results and impact on our cash flow. We also periodically review the credit limits and creditworthiness of our hedging counter-parties.
Under SFAS 133 “Accounting for Derivative Financial Instruments and Hedging Activities,” as amended by SFAS 137 and SFAS 138, we recognize all derivatives on our balance sheet at fair value, and the gain or loss in fair value is included in current earnings, unless designated as a cash flow hedge.
Interest rate risk
We are exposed to interest rate risk on our outstanding borrowings. Our floating rate debt consists principally of U.S. Dollar borrowings related to trade finance and loans from commercial banks and multilateral organizations and Real-denominated borrowings related to the debentures and the property and services acquisition financing issued in the Brazilian market. In general, our foreign currency floating rate debt is principally subject to changes in the London Interbank Offered Rate (USD LIBOR). Consequently, fluctuations in the USD LIBOR may adversely impact our cash flows. To mitigate the effects of interest rate volatility we make use of natural hedges derived from the correlation between U.S. Dollar floating interest rates and metals prices. When natural hedges are not present, we may opt to realize the same effect with the aid of financial instruments. Our floating rate debt denominated in Reais is mainly subject to changes in the CDI and TJLP.
We have entered into interest rate derivative transactions primarily to hedge the exposure we have on our Brazilian Reais floating rate debt. Our interest rate derivatives portfolio consists of interest rate swaps to convert Reais floating rate exposures to U.S. Dollar fixed rate exposures.
Currency risk
We are exposed to exchange rate risk associated with the denomination of our debt in currencies other than the Brazilian Real. On the other hand, a substantial proportion of our revenues are denominated in, or automatically indexed to, the U.S. Dollar. This provides a natural hedge against any changes in the Brazilian Real against the U.S. Dollar. For instance, when a devaluation of the Brazilian Real occurs, the immediate negative impact on our non-Brazilian Real-denominated debt is offset over time by the positive effect of devaluation on future cash flows. In light of this framework, we generally do not use derivative instruments to manage the currency exposure on our long-term Dollar-denominated debt. However, we may occasionally use derivatives to minimize the effects of the volatility of the exchange rates between Reais and U.S. Dollars in the cash flow.
Our cash flows are also exposed to the volatility of other currencies against the U.S. Dollar. While prices for most of our products are primarily in U.S. Dollars, a substantial portion of our costs, expenses and investments are in currencies other than the U.S. Dollar, in particular the Brazilian Real and the Canadian Dollar. In projects developed outside Brazil and Canada, we are also exposed to other currencies, such as the Euro, Australian Dollar and the Yuan.
We have other exposures associated with our outstanding debt portfolio. We have a Euro exposure associated with a credit line extended by KFW (Kreditanstalt Für Wiederaufbau). To mitigate the foreign currency risk, we have entered into currency forwards.
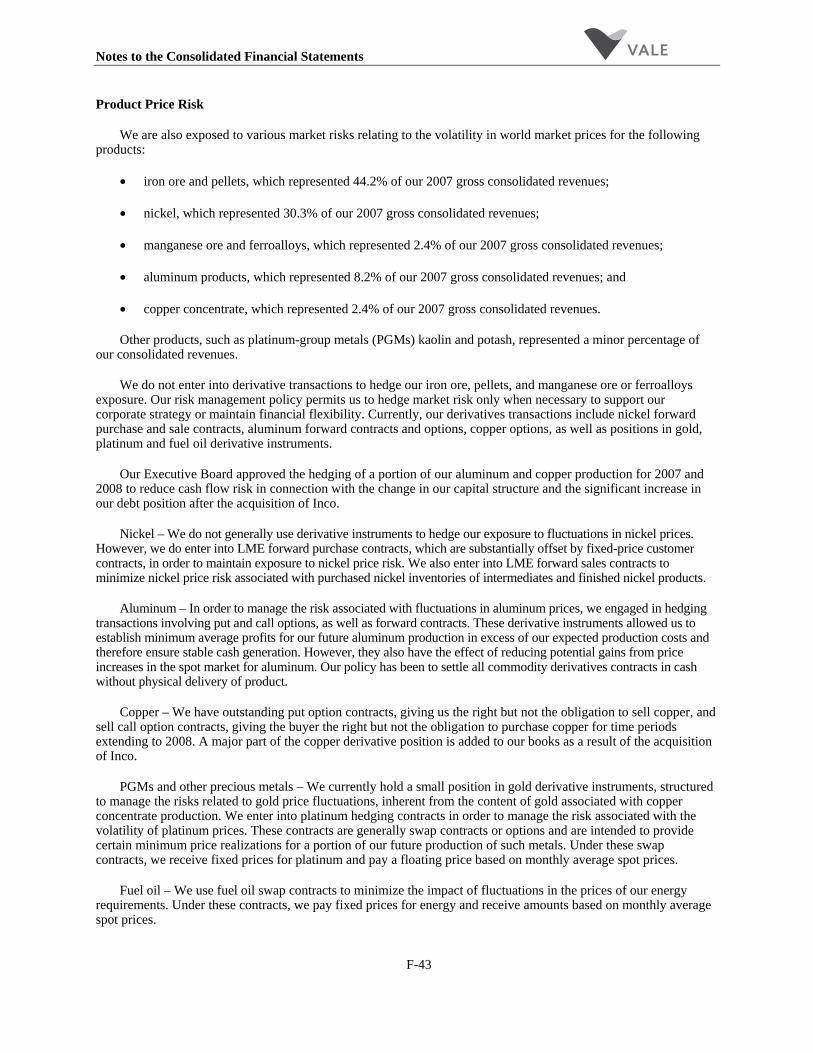
Notes to the Consolidated Financial Statements
F-43
Product Price Risk
We are also exposed to various market risks relating to the volatility in world market prices for the following products:
• iron ore and pellets, which represented 44.2% of our 2007 gross consolidated revenues;
• nickel, which represented 30.3% of our 2007 gross consolidated revenues;
• manganese ore and ferroalloys, which represented 2.4% of our 2007 gross consolidated revenues;
• aluminum products, which represented 8.2% of our 2007 gross consolidated revenues; and
• copper concentrate, which represented 2.4% of our 2007 gross consolidated revenues.
Other products, such as platinum-group metals (PGMs) kaolin and potash, represented a minor percentage of our consolidated revenues.
We do not enter into derivative transactions to hedge our iron ore, pellets, and manganese ore or ferroalloys exposure. Our risk management policy permits us to hedge market risk only when necessary to support our corporate strategy or maintain financial flexibility. Currently, our derivatives transactions include nickel forward purchase and sale contracts, aluminum forward contracts and options, copper options, as well as positions in gold, platinum and fuel oil derivative instruments.
Our Executive Board approved the hedging of a portion of our aluminum and copper production for 2007 and 2008 to reduce cash flow risk in connection with the change in our capital structure and the significant increase in our debt position after the acquisition of Inco.
Nickel – We do not generally use derivative instruments to hedge our exposure to fluctuations in nickel prices. However, we do enter into LME forward purchase contracts, which are substantially offset by fixed-price customer contracts, in order to maintain exposure to nickel price risk. We also enter into LME forward sales contracts to minimize nickel price risk associated with purchased nickel inventories of intermediates and finished nickel products.
Aluminum – In order to manage the risk associated with fluctuations in aluminum prices, we engaged in hedging transactions involving put and call options, as well as forward contracts. These derivative instruments allowed us to establish minimum average profits for our future aluminum production in excess of our expected production costs and therefore ensure stable cash generation. However, they also have the effect of reducing potential gains from price increases in the spot market for aluminum. Our policy has been to settle all commodity derivatives contracts in cash without physical delivery of product.
Copper – We have outstanding put option contracts, giving us the right but not the obligation to sell copper, and sell call option contracts, giving the buyer the right but not the obligation to purchase copper for time periods extending to 2008. A major part of the copper derivative position is added to our books as a result of the acquisition of Inco.
PGMs and other precious metals – We currently hold a small position in gold derivative instruments, structured to manage the risks related to gold price fluctuations, inherent from the content of gold associated with copper concentrate production. We enter into platinum hedging contracts in order to manage the risk associated with the volatility of platinum prices. These contracts are generally swap contracts or options and are intended to provide certain minimum price realizations for a portion of our future production of such metals. Under these swap contracts, we receive fixed prices for platinum and pay a floating price based on monthly average spot prices.
Fuel oil – We use fuel oil swap contracts to minimize the impact of fluctuations in the prices of our energy requirements. Under these contracts, we pay fixed prices for energy and receive amounts based on monthly average spot prices.

Notes to the Consolidated Financial Statements
F-44
There is an embedded derivative related to energy in our subsidiary Albras on which we have an unrealized gain of US$17 million as of December 31, 2007 and US$76 million as of December 31, 2006.
The asset (liability) balances and the change in fair value of derivative financial instruments are as follows:
Interest rates
(LIBOR) Currencies Gold
Products of aluminum
area Copper Nickel Platinum Total
Unrealized gains (losses) at January 1, 2007 ................ 6 (16) (53) (318) (298) 16 (20) (683)
Financial settlement ................ (6) (284) 33 112 240 (38) 13 70 Unrealized gains (losses) in the
year ...................................... (6) 860 (7) 153 (129) 63 (17) 917 Effect of exchange rate changes
............................................. 1 71 (9) (45) (1) 1 – 18 Unrealized gains (losses)
at December 31, 2007 .......... (5) 631 (36) (98) (188) 42 (24) 322 Unrealized gains (losses)
at January 1, 2006 ................ (4) 1 (46) (210) – – – (259) Gain (Loss) recognized upon
consolidation of Inco............ 4 9 – – (364) 62 (22) (311) Financial settlement ................ 2 (6) 19 102 – (87) – 30 Unrealized gains (losses) in the
year ...................................... 4 (19) (23) (187) 65 42 2 (116) Effect of exchange rate changes
............................................. – – (4) (23) – – – (27) Unrealized gains (losses)
at December 31, 2006 .......... 6 (15) (54) (318) (299) 17 (20) (683) Unrealized gains (losses)
at January 1, 2005 ................ (17) 4 (37) (182) – – – (232) Financial settlement ................ 9 (1) 11 70 – – – 89 Unrealized gains (losses) in the
year ...................................... 6 (2) (17) (88) (101) Effect of exchange rate changes
............................................. (2) – (3) (10) – – – (15) Unrealized gains (losses)
at December 31, 2005 .......... (4) 1 (46) (210) – – – (259) Unrealized gains (losses) in the period are included in our income statement under the caption of Financial
expenses and Foreign exchange and monetary gains (losses), net.
Final maturity dates for the above instruments are as follows:
Gold ........................................................................................................................................................... December 2008 Interest rates(LIBOR) ................................................................................................................................ December 2011 Currencies.................................................................................................................................................. December 2011 Products of the aluminum area .................................................................................................................. December 2008 Copper concentrate .................................................................................................................................... December 2008 Nickel ........................................................................................................................................................ December 2009 Platinum..................................................................................................................................................... December 2008

Notes to the Consolidated Financial Statements
F-45
Under U.S. GAAP, all derivatives, whether designated in hedging relationships or not, are required to be recorded in the balance sheet at fair value. A derivative must be designated in a hedging relationship in order to qualify for hedge accounting. These standards include a determination of what portions of hedges are deemed to be effective versus ineffective. In general, a hedging relationship is effective when a change in the fair value of the derivative is offset by an equal and opposite change in the fair value of the underlying hedged item. In accordance with these standards, effectiveness tests are performed in order to assess effectiveness and quantify ineffectiveness for all designated hedges. At December 31, 2007, we had outstanding cash flow hedges. A cash flow hedge is a hedge of the exposure to variability in expected future cash flows that is attributable to a particular risk such as a forecasted purchase or sale. If a derivative is designated as a cash flow hedge, the effective portions of the changes in the fair value of the derivative are recorded in other comprehensive income and are recognized in earnings when the hedged item affects earnings. Ineffective portions of changes in the fair value of the derivatives designated as hedges are recognized in earnings. Under U.S. GAAP, if a portion of a derivative contract is excluded for purposes of effectiveness testing, such as time value, the value of such excluded portion is included in earnings. At December 31, 2007, unrealized net gains in respect of derivative instruments which were not qualified for hedge accounting under United States GAAP amounted to US$869.
Over-the-counter (OTC) forward and zero-cost collar aluminum contracts are used to smooth the effect of fluctuations in the price of aluminum with respect to forecasted sales of aluminum and alumina. These contracts have been designated as a hedge to our exposure to variability in future cash flows associated with our aluminum and alumina sales. There was no hedge ineffectiveness regarding these contracts since the inception of our cash flow hedge accounting program. At December 31, 2007, US$29 of deferred net gains on derivative instruments were recorded in other comprehensive income. The maximum term over which cash flows are hedged is 24 months.
F-46
Board of Directors, Fiscal Council, Advisory committees and Executive Officers
Board of Directors Sérgio Ricardo Silva Rosa Chairman Mário da Silveira Teixeira Júnior Vice-President Luciano Galvão Coutinho Francisco Augusto da Costa e Silva Hiroshi Tada João Batista Cavaglieri Jorge Luiz Pacheco José Ricardo Sasseron Oscar Augusto de Camargo Filho Renato da Cruz Gomes Sandro Kohler Marcondes Advisory Committees of the Board of Directors Controlling Committee Antonio José Figueiredo Ferreira Luiz Carlos de Freitas Paulo Roberto Ferreira de Medeiros Executive Development Committee João Moisés de Oliveira José Ricardo Sasseron Oscar Augusto de Camargo Filho Strategic Committee Roger Agnelli Gabriel Stoliar Luciano Siani Pires Mário da Silveira Teixeira Júnior Oscar Augusto de Camargo Filho Sérgio Ricardo Silva Rosa Finance Committee Fabio de Oliveira Barbosa Ivan Luiz Modesto Schara Luiz Maurício Leuzinger Wanderlei Viçoso Fagundes Governance and Sustainability Committee Jorge Luiz Pacheco Ricardo Simonsen Renato da Cruz Gomes
Fiscal Council Marcelo Amaral Moraes Chairman Aníbal Moreira dos Santos Bernard Appy José Bernardo de Medeiros Neto Alternate Oswaldo Mário Pêgo de Amorim Azevedo Tarcísio José Massote de Godoy Marcos Coimbra Executive Officers Roger Agnelli Chief Executive Officer Carla Grasso Executive Officer for Human Resources and Corporate Services Eduardo de Salles Bartolomeo Executive Officer for Logistics Fabio de Oliveira Barbosa Chief Financial Officer and Investor Relations Gabriel Stoliar Executive Officer for Planning and Business Development José Carlos Martins Executive Officer for Ferrous Minerals José Lancaster Executive Officer for Copper, Coal and Aluminum Murilo de Oliveira Ferreira Executive Officer for Nickel and Basic Metals Commercialization Tito Botelho Martins Executive Officer for Corporate Affairs and Energy Demian Fiocca Executive Officer for Technology and Management Marcus Vinícius Dias Severini Chief Officer of Accounting and Control Department Vera Lúcia de Almeida Pereira Elias Chief Accountant CRC-RJ — 043059/O-8