delaware basin panther energy acquisition pay section across acreage with substantial upside. wpx...
TRANSCRIPT

January 12, 2017
Delaware Basin Panther Energy Acquisition

Expanding WPX’s World-Class Delaware Position
2
OVERVIEW► 18,000+ acres in core of Delaware
► 920 gross locations, including 150+ long lateral locations
► Significant current production of ~6,500 Boe/d (55% oil)
► Maintain Panther’s current 2 rig program
► Acreage cost excluding existing production ~$28.5K per acre
► Valuation primarily supported on 3 zones with upside in 5
additional zones
N E W M E X I C O
T E X A S
CULBERSON
LEA
EDDY
WARD
REEVES
LOVING
PECOS
WINKLER
WPX OPERATED ACREAGE
ACQUIRED ACREAGE
SELF-FUNDING DEVELOPMENT2 rig program funded with operating cashflows
DEEP INVENTORY OF CORE DELAWAREResource supports sustained growth
HIGH QUALITY ROCKMultiple stacked pay intervals with significant upside
ACCRETIVE TO CASHFLOWS AND NAVAccretive to shareholders 2017 and beyond
BENEFITS
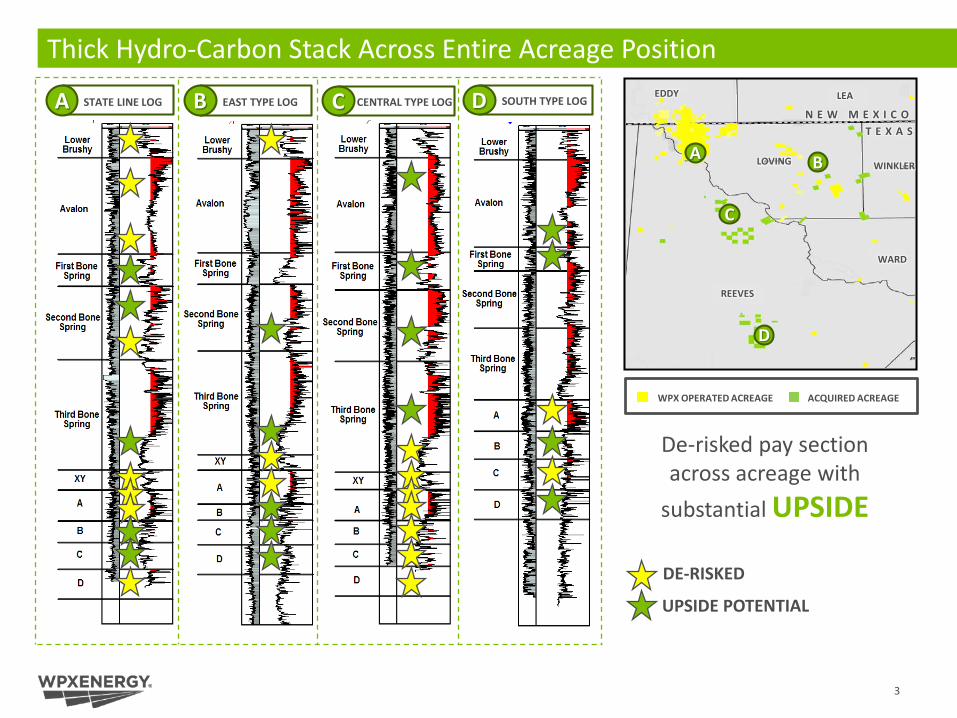
Thick Hydro-Carbon Stack Across Entire Acreage Position
A STATE LINE LOG B EAST TYPE LOG C CENTRAL TYPE LOG D SOUTH TYPE LOGN E W M E X I C O
T E X A S
WARD
LEAEDDY
REEVES
LOVING WINKLERA B
C
D
DE-RISKED
UPSIDE POTENTIAL
De-risked pay section across acreage with
substantial UPSIDE
WPX OPERATED ACREAGE ACQUIRED ACREAGE
3

Strong Acreage Position in Core of Delaware Basin at Attractive Price
Source: Company filings, RS Energy Group, PLS, and 1Derrick. Selected transactions in 2H 2016. Excludes EOG/Yates. Note: 3Q values exclude PDP value of $35,000 Boe/d and 4Q values exclude PDP value of $40,000 Boe/d. (1) Adjusted $/acre excludes $235MM for EOR assets and $100mm for SWD infrastructure. (2) Excludes $18.4mm for gas gathering infrastructure and SWD wells/facilities. (3) Adjusted $/acre excludes $12.5mm for SWD infrastructure. (4) Purchase price adjusted for production at $40,000 Boe/d and mineral interest and midstream assets of ~$200 million. (5) Purchase price adjusted for production at $40,000 Boe/d.
RSPP/Silver Hill – 10/2016
Purchase price: $2,544mm
Production, net: 15,000 boe/d (69% oil)
Acreage: 41,000
Adj. $/acre: $47,415
Callon/Ameredev– 12/2016
Purchase price: $615mm
Production, net: 1,945 boe/d (71% oil)
Acreage: 16,098
Adj. $/acre: $32,228
(2)
Diamondback/Private operator – 7/2016
Purchase price: $560mm
Production, net: 1,000 boe/d (89% oil)
Acreage: 19,180
Adj. $/acre: $26,721
(3)
Attractive acquisition price of ~$28,500(5) per undeveloped net acre compares favorably to recent Southern Delaware Basin acquisitions
Diamondback/Brigham – 12/2016
Purchase price: $2,428mm
Production, net: 9,482 boe/d (77% oil)
Acreage: 76,319
Adj. $/acre: $24,224
(4)
Selected Southern Delaware Basin Transactions in 2H 2016
Lea
Winkler
Oxy/J Cleo – 10/2016
Purchase price: $2,000mm
Production, net: 7,000 boe/d (72% oil)
Acreage: 35,000
Adj. $/acre: $39,571
(1)
PDC/Kimmeridge – 8/2016
Purchase price: $1,500 mm
Production, net: 7,000 boe/d (42% oil)
Acreage: 57,000
Adj. $/acre: $22,018
Silver Run/Centennial – 7/2016
Purchase price: $1,735 mm
Production, net: 7,212 boe/d (82% oil)
Acreage: 42,500
Adj. $/acre: $34,884
Centennial/Silverback – 11/2016
Purchase price: $855mm
Production, net: 3,500 boe/d
Acreage: 35,000
Adj. $/acre: $20,429
WPX ACREAGEACQUIRED ACREAGE
LOVING
LEAEDDY
REEVES
CULBERSON
WINKLER
WARD
PECOS
ANDREWS
4

Multi-Zone Potential Across Newly Acquired Acreage
Source: IHS Enerdeq, Performance Evaluator, investor presentations, and company materials.Note: Wells sourced from Enerdeq represent month 2 production data, shown using a 6:1 gas to oil conversion ratio. (*) 3-stream well results sourced from investor presentations.1 Post-clean up
5
Wolfcamp AWolfcamp BWolfcamp CWolfcamp D
2nd Bonespring Sand3rd Bonespring SandBrushy CanyonWPX acreageAcquired acreage
LOVING
LEAEDDY
REEVES
WINKLER
WARD
PECOS
Cabinet State 55-2Unit 1HCimarexIP30: 1,907 Boe/d (65% oil)6 Mo Cum: 239 MboeLL: 4,400’/ Lbs/ft: 1,670
State Apache 57-1114HResoluteIP30: 1,651 Boe/d (65% oil)6 Mo Cum: 182 MboeLL: 5,146’/ Lbs/ft: 1,574
Harrison 29-28 1HAPCIP30: 1,682 Boe/d (80% oil)6 Mo Cum: 167 MboeLL: 4,423’/ Lbs/ft: 1,311
University BLK 21 1803HXTOIP30: 1,112 Boe/d (84% oil)6 Mo Cum: 103 MboeLL: 4,074’/ Lbs/ft: 783
Maisie State 10 1HPantherIP30: 1,395 Boe/d (51% oil)6 Mo Cum: 145 MboeLL: 4,533’/ Lbs/ft: 1,930
University B201 W201PA*MewbourneIP30: 850 Boe/d (n/a % oil)6 Mo Cum: 122 MboeLL: 4,391’/ Lbs/ft: 2,355
Astro State 12 1H1
PantherIP30: 877 Boe/d (79% oil)6 Mo Cum: 94 MboeLL: 5,315’/ Lbs/ft: 1,608
Red Crest 3H*CentennialIP30: 938 Boe/d (n/a % oil)6 Mo Cum: 55 MboeLL: 4,483’/ Lbs/ft: 1,296
CH Knight 1HCentennialIP30: 695 Boe/d (76% oil)6 Mo Cum: 71 MboeLL: 4,106’/ Lbs/ft: 1,236
Wrigley 187 4HOXYIP30: 754 Boe/d (86% oil)6 Mo Cum: 86 MboeLL: 4,536’/ Lbs/ft: 1,277
White Dorothy 82-TTT-B33WF-123HMatadorIP30: 738 Boe/d (62% oil)6 Mo Cum: 101 MboeLL: 4,840’/ Lbs/ft: 1,979
Roja Arena Federal Unit 16HDevonIP30: 879 Boe/d (85% oil)6 Mo Cum: N/ALL: 6,439’/ Lbs/ft: N/A
State Apache 57 211HEOGIP30: 2,143 Boe/d (64% oil)6 Mo Cum: 202 MboeLL: 9,881’/ Lbs/ft: 2,076
Falcon State Unit P225HApacheIP30: 1,864 Boe/d (64% oil)6 Mo Cum: 193 MboeLL: 4,645’/ Lbs/ft: 2,548
Blue Jay Unit P103HApacheIP30: 2,781 Boe/d (69% oil)6 Mo Cum: 374 MboeLL: 4,793’/ Lbs/ft: 1,519
Colley State 22 1HClayton WilliamsIP30: 1,645 Boe/d (79% oil)6 Mo Cum: N/ALL: n/a/ Lbs/ft: n/a
State Street 20-29A Unit 1HEOGIP30: 2,285 Boe/d (58% oil)6 Mo Cum: 222 MboeLL: 7,392’/ Lbs/ft: 1,872 Williams 4-53 2HCentennialIP30: 1,465 Boe/d (42% oil)6 Mo Cum: 163 MboeLL: 4,434’/ Lbs/ft: 2,514
North Mitre Unit 2101HResoluteIP30: 2,275 Boe/d (68% oil)6 Mo Cum: 344 MboeLL: 9,676’/ Lbs/ft: 1,515
State Apache 57 210H EOGIP30: 1,892 Boe/d (65% oil)6 Mo Cum: 189 MboeLL: 9,769’/ Lbs/ft: 2,111
Man O War 5-8 4HAManti TarkaIP30: 1,080 Boe/d (81% oil)6 Mo Cum: 185 MboeLL: 9,684’/ Lbs/ft: 1,973
Layden 1H *CentennialIP30: 1,025 Boe/d (n/a % oil)6 Mo Cum: 68 MboeLL: 4,222’/ Lbs/ft: 1,132
South Elephant Wolfcamp Unit 1004HResoluteIP30: 2,356 Boe/d (71% oil)6 Mo Cum: 241 MboeLL: 9,139’/ Lbs/ft: 1,563
Peck State 258-6HOXYIP30: 1,200 Boe/d (86% oil)6 Mo Cum: 215 MboeLL: 4,294’/ Lbs/ft: 1,066
Armstrong 149 3H*PrimexxIP30: 823 Boe/d (n/a % oil)6 Mo Cum: 60 MboeLL: 4,296’/ Lbs/ft: 1,163
Falcon State Unit S262HApacheIP30: 1,062 Boe/d (68% oil)6 Mo Cum: 132 MboeLL: 5,614’/ Lbs/ft: 1,228
Copperhead 23-1HMDCIP30: 376 Boe/d (53% oil)6 Mo Cum: 147 MboeLL: 7,196’ Lbs/ft: 78

Asset Quality Supports Robust Development Plan
1 MILE 1 ½ MILE 2 MILE
D&C ($MM) $5.6 $6.75 $7.9
EUR (Mboe) 1,100 1,600 2,100
Oil IP (Bbl/day) 645 824 1,060
Oil Decline (%/yr) 71% 71% 71%
B factor 1.5 1.5 1.5
IRR2 55% 70% 95%
► Maintain Panther’s 2 rig program
► 150+ extended lateral locations
► Utilize “State of the Art” completion design
► Infrastructure in place to support growth
► Capital program funded with CFFO
DEVELOPMENT PLAN
WPX PANTHER PRO FORMA
Net Acreage ~102,000 18,100 120,000+
Rigs 5 2 7
Gross Drillable Locations 5,500+ 920 6,420+
2017 First Sales 70-80 15-203 85-100
Net ResourcePotential
(BBOE)2.4+ 0.5+ 2.9+
WOLFCAMP A & X/Y
Product Mix
Oil % 55%
Gas % 25%
NGL % 20%
Average WI 71%
Average NRI 53%
6
WOLFCAMP X/Y-UPPER/LOWER A1
1Management estimates based on information provided by seller and public data from off-set operators2 IRR assumes strip pricing as of January 4, 2017 3 Estimated first sales from April 1, 2017 through Dec 31, 2017

Increasing Core Inventory and Enhancing Shareholder Value
7
VALUE-DRIVEN
STRONG ASSETS
SHAREHOLDER VALUE
FINANCIAL STRENGTH
Added ~32,000 net acres in the core of the Delaware for ~$18,600 per acre since RKI acquisition1
Large core Delaware acreage position with significant upside
Expected to be accretive on cashflow and NAV basis
Accelerates deleveraging goal and expands margins
1Includes Panther acquisition and other bolt-on acquisitions made since July 2015

Appendix

Production FY17 Pro Forma
Oil Mbbl/d 49.0 – 53.0 52.0 – 56.0Natural Gas MMcf/d 210 – 220 220 – 230NGL Mbbl/d 12.5 – 17.5 14.0 – 19.0Total MBOE/d 97 – 107 102 – 113
Expenses FY17 Pro Forma
$ per BOELOE $4.75 – $5.25 $4.75 – $5.25GP&T 2.00 – 2.50 2.00 – 2.50
Production Tax 2.25 – 2.75 2.25 – 2.75
Cash Operating $9.00 – $10.50 $9.00 – $10.50
DD&A 20.00 – 21.00 20.00 – 21.00
$ in MillionsG&A – Cash $110 – $120 $110 – $120G&A – Non Cash 30 – 40 30 – 40Exploration 30 – 40 30 – 40 Interest Expense 185 – 195 185 – 195
2017 Pro Forma Full-Year Guidance
Tax Rate FY17 Pro Forma
Tax Provision 33% – 37% 33% – 37%
Net Realized Price5 FY17 Pro Forma
NGL – % of WTI 23% – 28% 23% – 28%
Cap Ex ($ in Millions) FY17 Pro Forma
Delaware $410 – 430 $480 – 5101
Williston 240 – 260 240 – 260San Juan 150 – 170 150 – 170Total D&C Capital2 $800 – $860 $870 – $940Delaware Infrastructure 35 – 45 35 – 45Total3 $835 – $905 $905 – $985
1 Includes 15-20 first sales from Panther acquisition (April 1-December 31, 2017)2 Includes non-operated wells and wells which include additional science work.3 Excludes any acquisition capital.4 Average price differentials ranges for oil and natural gas exclude hedges, but include basis differential and revenue adjustments.5 Percentage of realized price ranges for NGLs excludes hedges, but includes basis differential and revenue adjustments.
Avg. Price Differentials4 FY17 Pro Forma
Oil – WTI per barrel ($6.00) – ($7.00) ($6.00) – ($7.00)NYMEX – Nat. Gas (Mcf) ($0.60) – ($0.80) ($0.60) – ($0.80)
9
Pro Forma assumes 9 month impact of Panther

WPX Hedges
2017 2018 2019Volume/Day Average Price Volume/Day Average Price Volume/Day Average Price
1 In connection with several natural gas and crude oil swaps, we entered into swaptions with the swap counterparties granting the counterparty the right, but not the obligation, to enter into an underlying swap with us in the future. Crude oil swaptions for 2017 total 1,764 bbl/d at a weighted average strike price of $44.61. Natural Gas Swaptions for 2018 total 20,000 mmbtu/d at a weighted average strike price of $3.33.
10
Natural Gas (MMBtu)
Fixed Price Swaps1 170,000 $3.02 125,000 $2.95 - -
Fixed Price Calls 16,301 $4.50 16,301 $4.75 - -
Natural Gas Basis (MMBtu)
San Juan Basis Swaps 97,500 ($0.18) 20,000 ($0.30) - -
Permian Basis Swaps 72,500 ($0.20) 42,500 ($0.28) 5,000 ($0.32)
West Texas Basis Swaps - - 62,500 ($0.16) 80,000 ($0.19)
Crude Oil (bbl)
Fixed Price Swaps¹ 39,554 $50.93 30,000 $54.61 - -
Fixed Price Calls 4,500 $56.47 13,000 $58.89 - -
Crude Oil Basis (bbl)
Midland Basis Swaps 12,778 ($0.52) 13,000 ($0.94) 7,000 ($1.00)
Updated: January 10, 2017

WPX’s Opportunity in the Delaware Grows Significantly
Formation GrossLocations
GrossLocations
GrossLocations
GrossLocations
Assumed Spacing per DSU
Delaware Vertical Bell Canyon
Delaware Vertical Cherry Canyon 170 170 40
Delaware Vertical Brushy Canyon 1,380 8 1,388 20
Delaware Horizontal 105 105 160Upper Avalon 405 405 107Lower Avalon 405 405 107
1st Bone Spring 540 540 1602nd Bone Spring 645 645 1603rd Bone Spring 220 32 8 260 160Wolfcamp X/Y 285 70 11 366 160
Upper/Lower Wolfcamp A 685 287 54 1026 80-107Wolfcamp B 97 30 127 80-160Wolfcamp C 200 176 34 410 80-160Wolfcamp D 470 94 20 584 80-160
Total 5,500+ 764 157 6,420+
WPXPANTHER
ACQUISITION( 11/2 & 2 MILE)
PRO FORMAPANTHER
ACQUISITION(1 MILE)
11

Reserves DisclaimerThe SEC requires oil and gas companies, in filings made with the SEC, to disclose proved reserves, which are those quantities of oil and gas, which, by analysis of geoscience and engineering data, can be estimated with reasonable certainty to be economically producible – from a given date forward, from known reservoirs, under existing economic conditions, operating methods, and governmental regulations. The SEC permits the optional disclosure of probable and possible reserves. We have elected to use in this presentation “probable” reserves and “possible” reserves, excluding their valuation. The SEC defines “probable” reserves as “those additional reserves that are less certain to be recovered than proved reserves but which, together with proved reserves, are as likely as not to be recovered.” The SEC defines “possible” reserves as “those additional reserves that are less certain to be recovered than probable reserves.” The Company has applied these definitions in estimating probable and possible reserves. Statements of reserves are only estimates and may not correspond to the ultimate quantities of oil and gas recovered. Any reserve estimates provided in this presentation that are not specifically designated as being estimates of proved reserves may include estimated reserves not necessarily calculated in accordance with, or contemplated by, the SEC’s reserves reporting guidelines. Investors are urged to consider closely the disclosure regarding our business that may be accessed through the SEC’s website at www.sec.gov.
The SEC’s rules prohibit us from filing resource estimates. Our resource estimations include estimates of hydrocarbon quantities for (i) new areas for which we do not have sufficient information to date to classify as proved, probable or even possible reserves, (ii) other areas to take into account the low level of certainty of recovery of the resources and (iii) uneconomic proved, probable or possible reserves. Resource estimates do not take into account the certainty of resource recovery and are therefore not indicative of the expected future recovery and should not be relied upon. Resource estimates might never be recovered and are contingent on exploration success, technical improvements in drilling access, commerciality and other factors.
12

DisclaimerThe information contained in this summary has been prepared to assist you in making your own evaluation of the Company and does not purport to contain all of the information you may consider important in deciding whether to invest in shares of the Company’s common stock. In all cases, it is your obligation to conduct your own due diligence. All information contained herein, including any estimates or projections, is based upon information provided by the Company. Any estimates or projections with respect to future performance have been provided to assist you in your evaluation but should not be relied upon as an accurate representation of future results. No persons have been authorized to make any representations other than those contained in this summary, and if given or made, such representations should not be considered as authorized.
Certain statements, estimates and financial information contained in this summary constitute forward-looking statements or information. Such forward-looking statements or information involve known and unknown risks and uncertainties that could cause actual events or results to differ materially from the results implied or expressed in such forward-looking statements or information. While presented with numerical specificity, certain forward-looking statements or information are based (1) upon assumptions that are inherently subject to significant business, economic, regulatory, environmental, seasonal, competitive uncertainties, contingencies and risks including, without limitation, the ability to obtain debt and equity financings, capital costs, construction costs, well production performance, operating costs, commodity pricing, differentials, royalty structures, field upgrading technology, and other known and unknown risks, all of which are difficult to predict and many of which are beyond the Company's control, and (2) upon assumptions with respect to future business decisions that are subject to change.
There can be no assurance that the results implied or expressed in such forward-looking statements or information or the underlying assumptions will be realized and that actual results of operations or future events will not be materially different from the results implied or expressed in such forward-looking statements or information. Under no circumstances should the inclusion of the forward-looking statements or information be regarded as a representation, undertaking, warranty or prediction by the Company or any other person with respect to the accuracy thereof or the accuracy of the underlying assumptions, or that the Company will achieve or is likely to achieve any particular results. The forward-looking statements or information are made as of the date hereof and the Company disclaims any intent or obligation to update publicly or to revise any of the forward-looking statements or information, whether as a result of new information, future events or otherwise. Recipients are cautioned that forward-looking statements or information are not guarantees of futureperformance and, accordingly, recipients are expressly cautioned not to put undue reliance on forward-looking statements or information due to the inherent uncertainty therein.
13