distributed denial of service (ddos) - sc magazine denial of service (ddos) threat report q4 2016...
TRANSCRIPT

Distributed Denial of Service (DDoS)Threat ReportQ4 2016
Threat ReportGlobal Leader in DDoS Mitigation
nexusguard.com456 Montgomery Street, Suite 800 San Francisco, CA 94104 USA | +1 415 299 8550

2
Content
Key Observations . . . . . . . . . . . . . . . . . . . 3
Overview . . . . . . . . . . . . . . . . . . . 3
Methodology . . . . . . . . . . . . . . . . . . . 4
Conclusion . . . . . . . . . . . . . . . . . . . 16
Network Layer Attacks . . . . . . . . . . . . . . . . . . . 5
200Gbps Attacks Become Commonplace . . . . . . . . . . . . 6
DDoS Botnet Activity . . . . . . . . . . . . . . . . . . . 9
Top Attacking Countries . . . . . . . . . . . . . . . . . . . 9
Top Attacking Methods . . . . . . . . . . . . . . . . . . . 10
An Increase in DNS attack . . . . . . . . . . . . . . . . . . . 11
IoT Botnet Activities & Distribution . . . . . . . . . . . . . . . 14
Application Layer Attacks & Web Application Firewall (WAF) Alerts . 8Attack Duration . . . . . . . . . . . . . . . . . . . 8
Attack Complexity . . . . . . . . . . . . . . . . . . . 8
nexusguard.com
3
Key Observations
Overview
• 200+Gbps-sized attacks became commonplace late in Q4
• The number of attacks in December increased by 152+%, while attacks in November
climbed more than 50% over October
• In the financial sector, WAF alerts surged 2.86X from November to December
• 17,872,563 DNS attacks leveraging cpsc.gov has been recorded
• Mirai started the outbreak of IoT botnets; Nexusguard observed 426,770 IoT bots since
botnet monitoring commenced in October
2016 was a challenging year. Attack traffic reaching 1Tbps was often heralded in catchy
headlines. IoT devices became a major new source of botnets, which brought about an
alarming number of new cyber-threats. Emerging vulnerabilities are constantly being
uncovered in both IoT devices already deployed and new ones coming to market, thus surely
presaging a growing number of future botnet infections.
Data gathered by Nexusguard in Q4 shows that botnets were being steadily upgraded and
becoming strong enough to not only generate 200+Gbps-sized attacks, but also to increase
attack frequency by more than 152%. Blended attacks consisting of DDoS and hacking
activities were predominantly aimed at financial and government sectors.
We anticipate that Q1 2017 will be even more challenging than the final quarter of 2016.
Novel attack types are sure to be invented and become widespread worldwide. Downplaying
new threats should be avoided, as such an attitude may result in unprecedented damage.
nexusguard.com

4
Methodology
As the global leader in Distributed Denial of Service (DDoS) mitigation, Nexusguard
observes and collects real-time data on threats facing enterprise and service-provider
networks worldwide. Data is gathered via botnet scanning, Honeypots, ISPs, and traffic
moving between attackers and their targets. The comprehensive data and analysis
conducted by Nexusguard and our research partner, attackscape.com, provide a thorough
view of DDoS threats.
Attacks and hacking activities exert a sizeable impact on cybersecurity. Our research
partner Attackscape (https://www.attackscape.com/) measures vulnerabilities and analyzes
attack trends worldwide to provide a comprehensive view of all such activities.
Because of the comprehensive, global nature of our data sets and observations, Nexusguard
is able to measure and evaluate DDoS events in a manner that is not biased by any single
set of customers or industries. Many zero-day threats are first seen on our global research
network. These threats, among others, are summarized in our quarterly reports.
nexusguard.com

5
Network Layer Attacks
In Q4, there were 10,042 network layer attacks. TCP (consisting of TCP RST, TCP Fragmentation, TCP SYN, TCP
Invalid, and TCP ACK) constituted 45.6% of network layer attacks, making TCP the most common vector. UDP and
UDP Fragmentation attacks accounted for, respectively, 8.22% and 3.36% of the total. In addition, DNS Amplification
and DNS Flood accounted for 2.84% and 1.61%. The number of multi-vector attacks increased from 445 in September
to 814 in November, before gradually falling to 602 in December.
Figure 1. Distribution of DDoS Attack Vectors
nexusguard.com

6
200Gbps Attacks Become Commonplace
A large spike in a network layer attack hit in late November. The massive attack of nearly 200Gbps was observed
between 19:54h 16 November and 00:55h 17 November in 2016, before descending to an average level of 20Gbps.
Figure 2. A Spike in November
The vectors of this attack pattern were larger than other network layer attacks in November and December. The
amount of attacks in October and November was about the same; however, December over November skyrocketed by
152.09%. DNS attacks grew by 50.61%, November over October. In Q4, the longest network layer attack (30 December)
lasted for 19 hours and 30 minutes.
nexusguard.com

- + -
7
The vectors of this attack pattern were larger than other network layer attacks in November and December. The
amount of attacks in October and November was about the same; however, December over November skyrocketed by
152.09%. DNS attacks grew by 50.61%, November over October. In Q4, the longest network layer attack (30 December)
lasted for 19 hours and 30 minutes.
Time Major Events
June Approximately 213,000 IoT devices found to be infected
August Source code of Mirai IoT botnet released
October Some 493,000 devices infected by Mirai botnets; DynDNS raided by Mirai
Nexusguard recorded 100% increase in DNS attacks
November Nexusguard recorded 200+Gbps attack; 4+ vectors appears as a common pattern
December Nexusguard recorded a volumetric attack increase of 152.09%
Nexusguard recorded an attack lasting 19 hours and 30 minutes
Table 1. Major Events in 2016
The rise in the number and size of attacks in Q4 was concurrent with the outbreak of the Mirai botnet. Since the
release of its source code in August, the number of IoT botnets grew from 213,000 to 493,000 in October, so new
vulnerabilities were sure to be exploited. Attacks exceeding 200Gbps constituted the majority of multi-vector attacks,
while the total number of attacks reached its pinnacle in December. In October, botnets also launched single-vector
attacks on DNS. Attacks caused by DNS Flood and its amplification doubled between September and October. The
unexpected surge coincided with a huge DynDNS attack due to Mirai. The reported sources of DynDNS attacks in
China, Hong Kong, and USA were the attacked countries themselves.
To conclude: Even though traffic typically originated from spoofed sources, it was not difficult to confirm whether or
not the attacks were generated via IoT devices. The emergence of 4+ vector attacks with 200Gbps was concurrent
with the rise in the number of botnet-infected IoT devices.
nexusguard.com

8
Application Layer Attacks & Web Application Firewall (WAF) Alerts
In Q4, 89.9 kreq/s was the peak size. Application attacks dropped 9.47% from October to November, and 71.19% from
November to December, while WAF alerts jumped by 184% from November to December. Thus, application layer attacks
occurred at a frequency completely opposite of what might be expected given the extreme uptick in WAF alerts. (Attacks
on government and financial sectors slumped 48% and 90.9% respectively, November to December, while both sectors saw a
significant rise in WAF alerts in December.)
Attack DurationIn Q4, 76.26% of application layer attacks lasted less than 30 minutes. 7.55% and 6.29% lasted 30 to 60 minutes and 1 to 3 hours,
respectively. The number of attacks decreased corresponding to their duration — from 3 hours to 48 hours, as shown below.
Figure 3. Duration of Application Layer Attacks
Attack Complexity
Application and volumetric DDoS attacks were prominent in Q4. Attackers launched blended attacks to overload
targeted monitoring, detection, and logging systems. Overloaded systems impeded the identification of hacking
activities, resulting in the failure to take immediate action to stop attacks. In-house support teams were unable to
analyze incidents in a timely fashion, recommend solutions or suggest how such attacks should be handled in future.
nexusguard.com
9
DDoS Botnet Activity
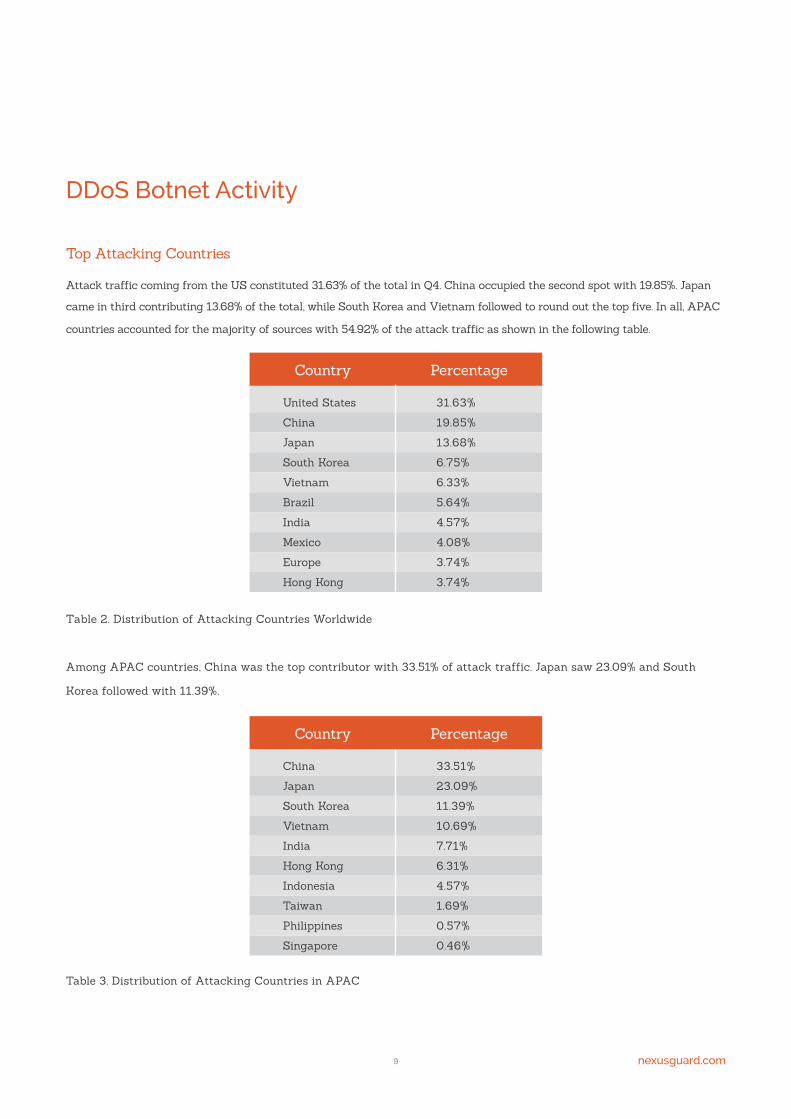
Top Attacking Countries
Attack traffic coming from the US constituted 31.63% of the total in Q4. China occupied the second spot with 19.85%. Japan
came in third contributing 13.68% of the total, while South Korea and Vietnam followed to round out the top five. In all, APAC
countries accounted for the majority of sources with 54.92% of the attack traffic as shown in the following table.
Table 2. Distribution of Attacking Countries Worldwide
Among APAC countries, China was the top contributor with 33.51% of attack traffic. Japan saw 23.09% and South
Korea followed with 11.39%.
Table 3. Distribution of Attacking Countries in APAC
Country Percentage
United States
China
Japan
South Korea
Vietnam
Brazil
India
Mexico
Europe
Hong Kong
31.63%
19.85%
13.68%
6.75%
6.33%
5.64%
4.57%
4.08%
3.74%
3.74%
nexusguard.com
Country Percentage
China
Japan
South Korea
Vietnam
India
Hong Kong
Indonesia
Taiwan
Philippines
Singapore
33.51%
23.09%
11.39%
10.69%
7.71%
6.31%
4.57%
1.69%
0.57%
0.46%
10
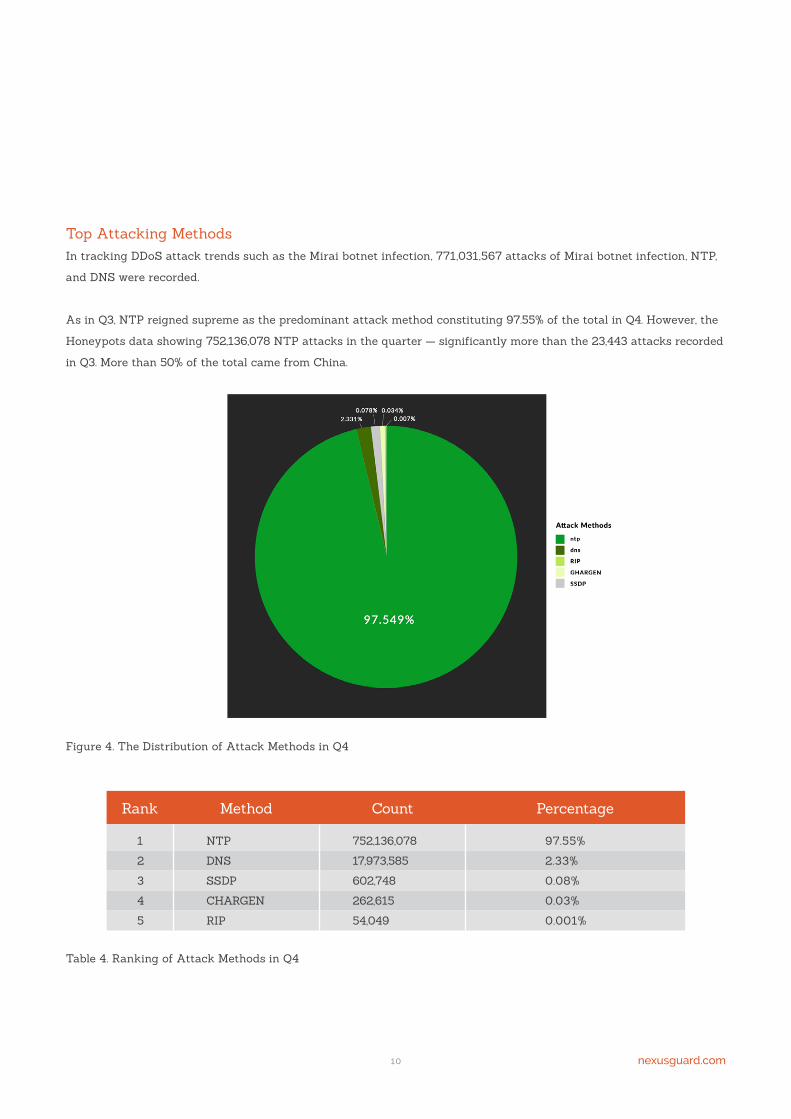
Top Attacking Methods
In tracking DDoS attack trends such as the Mirai botnet infection, 771,031,567 attacks of Mirai botnet infection, NTP,
and DNS were recorded.
As in Q3, NTP reigned supreme as the predominant attack method constituting 97.55% of the total in Q4. However, the
Honeypots data showing 752,136,078 NTP attacks in the quarter — significantly more than the 23,443 attacks recorded
in Q3. More than 50% of the total came from China.
Figure 4. The Distribution of Attack Methods in Q4
Rank Percentage
1
2
3
4
5
97.55%
2.33%
0.08%
0.03%
0.001%
Method Count
NTP
DNS
SSDP
CHARGEN
RIP
752,136,078
17,973,585
602,748
262,615
54,049
Table 4. Ranking of Attack Methods in Q4
nexusguard.com
11
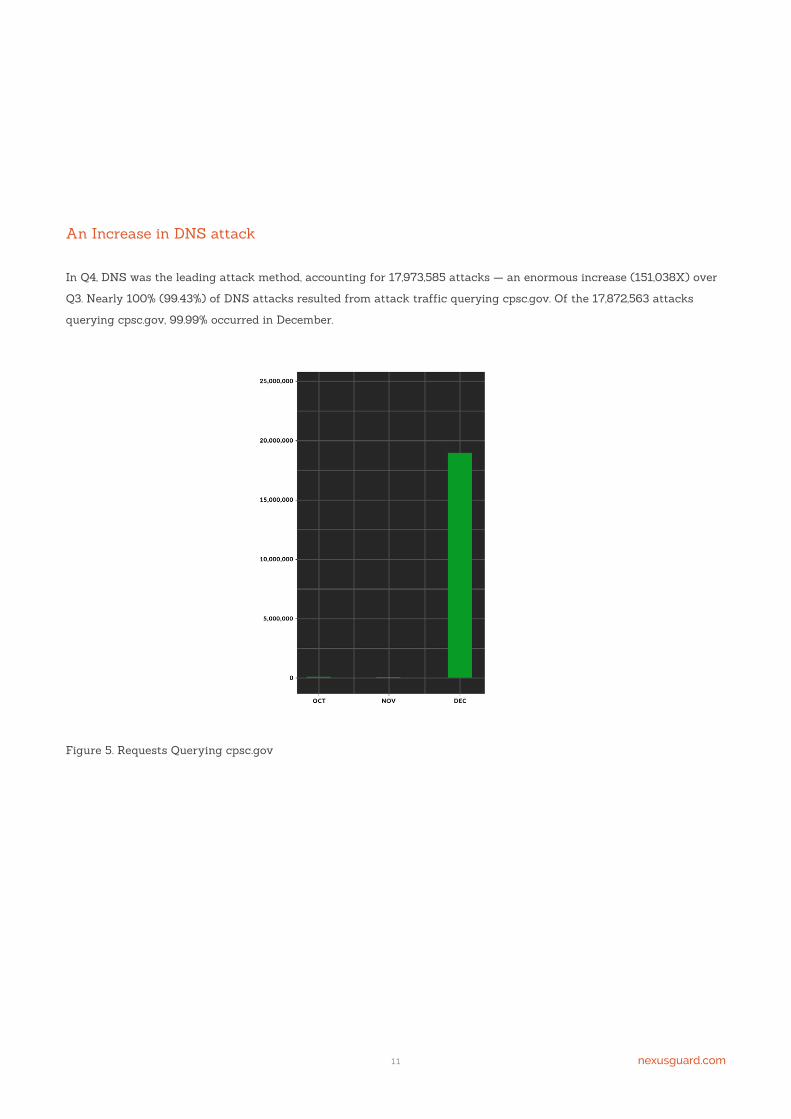
An Increase in DNS attack
In Q4, DNS was the leading attack method, accounting for 17,973,585 attacks — an enormous increase (151,038X) over
Q3. Nearly 100% (99.43%) of DNS attacks resulted from attack traffic querying cpsc.gov. Of the 17,872,563 attacks
querying cpsc.gov, 99.99% occurred in December.
Figure 5. Requests Querying cpsc.gov
nexusguard.com

12
Mechanisms of DNS Amplification Attacks & Data Collection
Figure 6. Data Collection Flow of Honeypot
Discussion: Attackers commanded botnets to launch attacks on ubiquitous public and open DNS servers as well as on
our Honeypot. The DNS servers forwarded attack traffic to targets, whereas Nexusguard recorded the attack data and
dropped the traffic. DNS serves as a large source of amplification attacks because:
1. DNS queries are typically transmitted over UDP so they can be sent from spoofed sources.
2. Responses to queries are significantly larger than the queries themselves.
DNS attackers sent “dig ANY cps.gov @<Open DNS server IP>” as a 64-byte query. DNS servers replied with a 512-byte
response, enabling an amplification of at least 8X. (UDP makes a 512-byte response only if flagged by EDNS0 clients in
the request.)
Attack command DNS request queryingcspc.gov with attack target
source IP addressAttackers Botnet Honeypot
Attack Target
Dropped Attack Traffic
Open DNSServers
Forwarded attack traffic to target
DNS request queryingcspc.gov with attack target
source IP address
nexusguard.com

13
Countries Targeted by DNS Attacks
With 44.16% of the total, China was the main target of cpsc.gov-queried DNS attacks. The US followed China with
35.47%, while the UK was third with 6.77% of the total.
Figure 7. DNS Attack Events by Country
DNS attacks doubled between September and December, and Nexusguard research gathered 10,000X more attack
data over the same period. (Because of different counting mechanisms, the research records attacks based on
continuous attack traffic.)
nexusguard.com

14
IoT Botnet Activities & DistributionIn Q4, according to attackscape.com, a total of 426,770 vulnerable devices. Based on the mechanism of the Mirai
infection, the scanning found 116,065 IoT botnets in China, the predominant country. In the US, ranked number two,
41,291 IoT botnets were recorded. Brazil, Italy, and Croatia rounded out the top five.
Figure 8. Distribution of IoT Botnets in Top 30 Countries
nexusguard.com

15
APAC countries, including China, South Korea, India, Taiwan, Vietnam, Indonesia, Hong Kong, Japan, Philippines, and
Pakistan accounted for nearly half — 46.50% — of IoT botnets in the top 30 countries.
Table 5. Ranking and Distribution of Countries and Counts of Attacks in Q4
Rank
1
2
3
4
5
6
7
8
9
10
Country No. of Bots
China
US
Hong Kong
Belgium
Japan
South Korea
Russian Federation
Australia
United Kingdom
Germany
320,450,932
90,618,958
69,028,489
46,247,556
26,174,986
19,256,129
18,017,461
14,129,683
13,859,452
9,986,457
Among APAC countries, China took first place followed by South Korea, India, Taiwan, and Vietnam.
Table 6. Distribution and Counts of APAC Countries in Attacks in Q4
Rank
1
2
3
4
5
6
7
8
9
10
Country No. of Bots
China
South Korea
India
Taiwan
Vietnam
Indonesia
Hong Kong
Japan
Philippines
Pakistan
116065
12432
12110
7646
7197
6028
3878
3855
3191
2887
nexusguard.com

16
Conclusion
Volumetric attacks occurred frequently in 2016, rocketing to an extremely high level. Incidents in Q4 show that
recently developed botnets are capable of generating huge, 1Tbps traffic flows with simple attack patterns. IoT devices
were proven powerful enough to generate complex attacks that pose substantial threats to cybersecurity now and in
the future. The sheer volume of IoT devices provides a large quantity of actual IP addresses available for generating
advanced attacks such as application attacks and slow flooding, to name just a few. IoT botnets will continue to pose a
major cybersecurity challenge in 2017.
nexusguard.com

Global Leader in DDoS Mitigation
nexusguard.com456 Montgomery Street, Suite 800 San Francisco, CA 94104 USA | +1 415 299 8550
20170207-EN-A4