evaluation of tehe interaction between … to thickness ratio (s/b) for transverse ribs is inversely...
TRANSCRIPT

GeoAmericas 2016, 3rd Pan-American Conference on Geosynthetics
EVALUATION OF TEHE INTERACTION BETWEEN DREDGED
MATERIALS AND GEOSTHETIC REINFORCEMENTS
J.R. Kondo, G.H. Roodi, and J.G. Zornberg,The University of Texas, Austin, Texas, USA
ABSTRACT
With the ever increasing use of geosynthetic reinforced mechanically stabilized earth (MSE) walls and the
need for alternative backfills, the study of the interaction between backfill materials and geosynthetic
reinforcements has become increasingly relevant. Alternative backfill materials have been continuously
considered including the use of industrial byproducts. The idea that byproduct materials could be a
suitable fill for these MSE walls may spark new opportunities. One such opportunity is the use of dredged
materials as backfill for reinforced soil structures, which would not only contribute to lower construction
costs, but would also benefit local confined disposal facilities looking to reduce their already overflowing
dredged material accumulation. This paper studies the use of dredged materials as backfill for reinforced
structures by evaluating their pullout resistance with uniaxial geogrids. A series of laboratory pullout tests
were conducted using two types of uniaxial geogrids embedded in three different soil types (a uniform
sand used as control and two different dredged materials). The laboratory results were used to examine
the effect on the coefficient of interaction of the various parameters governing the pullout resistance. The
results of this study indicate that: (1) the presence of adhesion to characterize the soil-reinforcement
interface shear strength has significant impact on the magnitude and trend of the coefficient of interaction
with increasing normal stress, (2) the reinforcement length of the geogrid has only minor impact on the
coefficient of interaction (provided that boundary effects are minimized during testing), (3) the dredged
materials, tested wet of optimum, showed a response consistent with an undrained behavior, leading to
pullout resistance values that were significantly lower than those of the control sand, and (4) the geogrid
spacing to thickness ratio (S/B) for transverse ribs is inversely proportional to the coefficient of interaction
and overall pullout force.
1. INTRODUCTION
Earth retaining structures are often key components in infrastructure design projects. While conventional
retaining wall systems have been used for many years, new concepts continue to emerge with the
objective of improving efficiency, performance, cost, or the ability to accommodate space constraints.
Mechanically Stabilized Earth (MSE) walls are internally stabilized fill walls that rely on geogrids or other
Page 1187
EVALUATION OF THE INTERACTION BETWEEN DREDGEDMATERIALS AND GEOSYNTHETIC REINFORCEMENTS
Kondo, J.R., Roodi, G.H., and Zornberg, J.G. (2016). “Evaluation of the Interaction between Dredged Materials and Geosynthetic Reinforcements.” Proceedings of the 3rd Pan-American Conference on Geosynthetics, Miami, Florida, 10-13 April, Vol. 2, pp. 1187-1202.

GeoAmericas 2016, 3rd Pan-American Conference on Geosynthetics
types of reinforcement to provide strength across failure planes that may otherwise develop through the
reinforced fill. Pullout failure is one of the failure mechanisms associated with internally stabilized walls.
Interaction between soil and reinforcements plays the key role in this type of failure. Laboratory pullout
test has been one of the most widely used techniques to characterize soil-reinforcement interaction.
Suitability of a reinforcement to provide sufficient interaction with a backfill soil can be adequately studied
using pullout tests.
This paper reports on the results obtained from conducting large pullout tests with two types of uniaxial
geogrids embedded in three different soil types: a standard uniform sand and two different dredged
materials. The interaction between the dredged materials and geosynthetic reinforcements was studied
by analyzing pullout force-pullout displacement curves and the corresponding coefficients of interaction.
The standard uniform sand was used with the same geosynthetic reinforcements to provide a baseline for
comparison against the performance of the dredged materials.
2. EXPERIMENTAL PROGRAM
2.1 Fill Materials
Monterey No. 30 Sand was used as the base line fill material in the pullout experimental program. This
soil is classified as SP (poorly-graded sand) according to the Unified Soil Classification System (USCS).
The medium particle size of this soil, D50
and the dry density of 1.59 g/cm3. For control purposes, the moisture content was kept constant at
1.5% for all tests with the sand.
Fig. 1. Grain Size Distribution Curve for Monterey Sand
Page 1188
GeoAmericas 2016, 3rd Pan-American Conference on Geosynthetics
The dredged materials tested in this study were obtained from two locations including Baltimore,
Maryland (MPA-DM) and Fort Mifflin, Philadelphia, Pennsylvania (PHIL-DM). A series of laboratory tests
were performed by Drexel University to evaluate the basic physical properties of the dredged materials
including as-received moisture content, specific gravity (Gs), loss on ignition (LOI), grain-size distribution,
and Atterberg limits (Grubb et al., 2006). The soils were then classified as an OH soil according to the
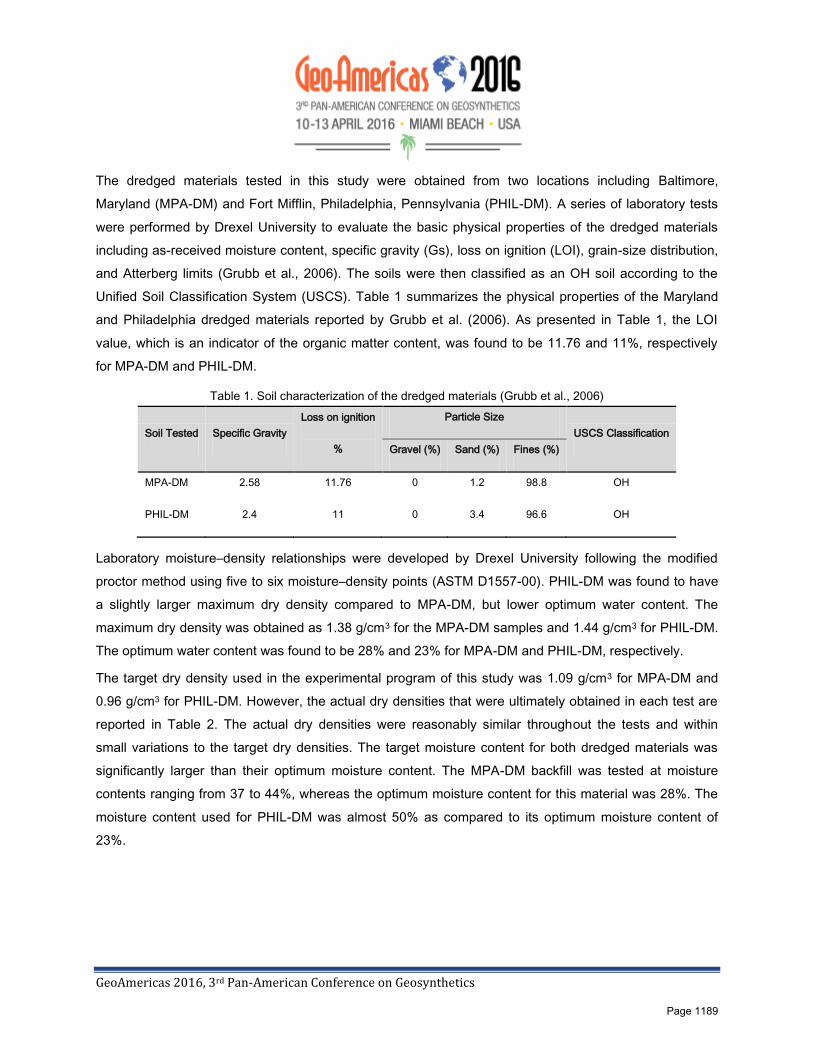
Unified Soil Classification System (USCS). Table 1 summarizes the physical properties of the Maryland
and Philadelphia dredged materials reported by Grubb et al. (2006). As presented in Table 1, the LOI
value, which is an indicator of the organic matter content, was found to be 11.76 and 11%, respectively
for MPA-DM and PHIL-DM.
Table 1. Soil characterization of the dredged materials (Grubb et al., 2006)
Soil Tested Specific Gravity
Loss on ignition
%
Particle Size
USCS Classification
Gravel (%) Sand (%) Fines (%)
MPA-DM 2.58 11.76 0 1.2 98.8 OH
PHIL-DM 2.4 11 0 3.4 96.6 OH
Laboratory moisture–density relationships were developed by Drexel University following the modified
proctor method using five to six moisture–density points (ASTM D1557-00). PHIL-DM was found to have
a slightly larger maximum dry density compared to MPA-DM, but lower optimum water content. The
maximum dry density was obtained as 1.38 g/cm3 for the MPA-DM samples and 1.44 g/cm3 for PHIL-DM.
The optimum water content was found to be 28% and 23% for MPA-DM and PHIL-DM, respectively.
The target dry density used in the experimental program of this study was 1.09 g/cm3 for MPA-DM and
0.96 g/cm3 for PHIL-DM. However, the actual dry densities that were ultimately obtained in each test are
reported in Table 2. The actual dry densities were reasonably similar throughout the tests and within
small variations to the target dry densities. The target moisture content for both dredged materials was
significantly larger than their optimum moisture content. The MPA-DM backfill was tested at moisture
contents ranging from 37 to 44%, whereas the optimum moisture content for this material was 28%. The
moisture content used for PHIL-DM was almost 50% as compared to its optimum moisture content of
23%.
Page 1189

GeoAmericas 2016, 3rd Pan-American Conference on Geosynthetics
Table 2. Characteristic of pullout tests conducted with dredged materials
Soil Type Test # Geogrid Type Normal Stress
(kPa)
Dry Density
(g/cm3)
Moisture Content
(%)
MPA-DM
97 GG1 28 1.09 38
49 GG1 42 1.14 44
48 GG1 56 1.06 40
50 GG2 28 1.07 38
95 GG2 42 1.11 37
96 GG2 56 1.09 40
PHIL-DM
56 GG1 28 0.96 51
57 GG1 42 0.96 50
58 GG1 56 0.96 50
59 GG2 28 0.96 50
60 GG2 42 0.96 50
61 GG2 56 0.96 50
As illustrated in Table 3, direct shear tests were performed on the dredged materials to characterize their
shear strengths parameters at the moisture and density conditions used in the pullout testing program.
The direct shear tests were conducted at three normal stresses of 28, 42, 56 kPa, which was consistent
with the confinement pressures used in the pullout tests. The direct shear test results show a typical
undrained shear strength behavior of a cohesive soil. The friction angles of the dredged materials were
found to be less than the friction angle for the Monterey Sand, and significant cohesive components were
found to contribute to MPA-DM and PHIL-DM shear strengths.
Page 1190

GeoAmericas 2016, 3rd Pan-American Conference on Geosynthetics
Table 3. Undrained Shear Strength of the dredged materials
Soil Normal Stress (kPa) Shear Stress (kPa) Cohesion
(kPa) Friction Angle
PHIL-DM
28 33.8
21.5 26 42 43.1
56 46.9
MPA-DM
28 51.7
36.9 28 42 57.9
56 66.2
2.2 Geogrid Properties
Two commercially available uniaxial geogrids, which will be referred to as GG1 and GG2, were used for
the pullout testing program. Specifications of the geogrids are presented in Table 4. Both geogrids are
manufactured from high-density polyethylene polymers with GG1 having smaller thickness for transverse
and longitudinal ribs. Spacing to thickness ratio (S/B) for transverse ribs has been proved to be a key
factor in pullout resistance. Since the transverse rib spacing was found to be approximately equal in both
geogrids, GG2, with larger thickness for transverse ribs, has a smaller spacing to thickness ratio (S/B).
Geogrid specimens for both GG1 and GG2 were 0.3 meters in width (12 junctions wide) for all testing in
dredged material. The embedment length was 0.9 meters (3 ribs inside box) and only varied for tests
evaluating reinforcement lengths.
Page 1191
GeoAmericas 2016, 3rd Pan-American Conference on Geosynthetics
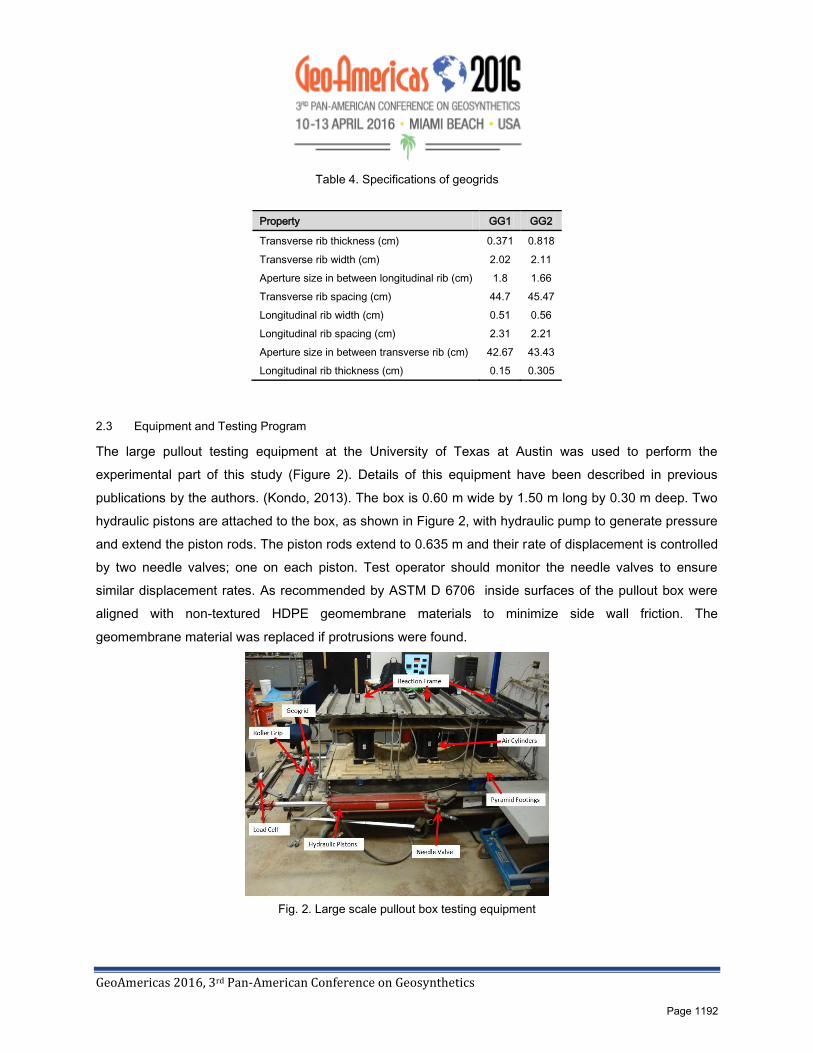
Table 4. Specifications of geogrids
Property GG1 GG2
Transverse rib thickness (cm) 0.371 0.818
Transverse rib width (cm) 2.02 2.11
Aperture size in between longitudinal rib (cm) 1.8 1.66
Transverse rib spacing (cm) 44.7 45.47
Longitudinal rib width (cm) 0.51 0.56
Longitudinal rib spacing (cm) 2.31 2.21
Aperture size in between transverse rib (cm) 42.67 43.43
Longitudinal rib thickness (cm) 0.15 0.305
2.3 Equipment and Testing Program
The large pullout testing equipment at the University of Texas at Austin was used to perform the
experimental part of this study (Figure 2). Details of this equipment have been described in previous
publications by the authors. (Kondo, 2013). The box is 0.60 m wide by 1.50 m long by 0.30 m deep. Two
hydraulic pistons are attached to the box, as shown in Figure 2, with hydraulic pump to generate pressure
and extend the piston rods. The piston rods extend to 0.635 m and their rate of displacement is controlled
by two needle valves; one on each piston. Test operator should monitor the needle valves to ensure
similar displacement rates. As recommended by ASTM D 6706 inside surfaces of the pullout box were
aligned with non-textured HDPE geomembrane materials to minimize side wall friction. The
geomembrane material was replaced if protrusions were found.
Fig. 2. Large scale pullout box testing equipment
Page 1192
GeoAmericas 2016, 3rd Pan-American Conference on Geosynthetics
A total of 36 pullout tests were conducted with changing certain parameters to evaluate their impact on
the test results. The three soil types, (Monterey No. 30 Sand, MPA-DM, and PHIL-DM) were tested with
the two types of geogrids (GG1 and GG2) at three normal stresses of 28, 42, and 56 kPa. Additional
tests were also conducted with GG1 in which the embedment length of geosynthetics varied from 0.50 to
1.40 meters to evaluate the impact of the geogrid embedment length. The results of the experimental
program are discussed next.
3. RESULTS AND DISCUSSION
A great body of research has explored the interaction of conventional granular and fine soils with
geosynthetic reinforcements. This section summarizes the general results observed in the previous
studies for two main types of soils, including Sands and Clays, followed by the experimental results
obtained in this study. The discussion involves the impact of normal pressure on ultimate pullout force,
change in the coefficient of interaction with change in the normal pressure, the effect of reinforcement
length on the ultimate pullout resistance and coefficient of interaction, and the effect of transverse ribs
properties (spacing and thickness) on the ultimate pullout resistance and the coefficient of interaction.
Adequacy of the dredge materials to be used as alternative to the conventional backfill soils can be
evaluated by analyzing the experimental data obtained in this study as compared to the previously
observed performance for conventional backfills. Additional assessments have been conducted by
comparing the pullout performance of the dredged materials with that of the control material, i.e. Monterey
Sand.
3.1 Effect of Normal Pressure
3.1.1 Review of previous trends
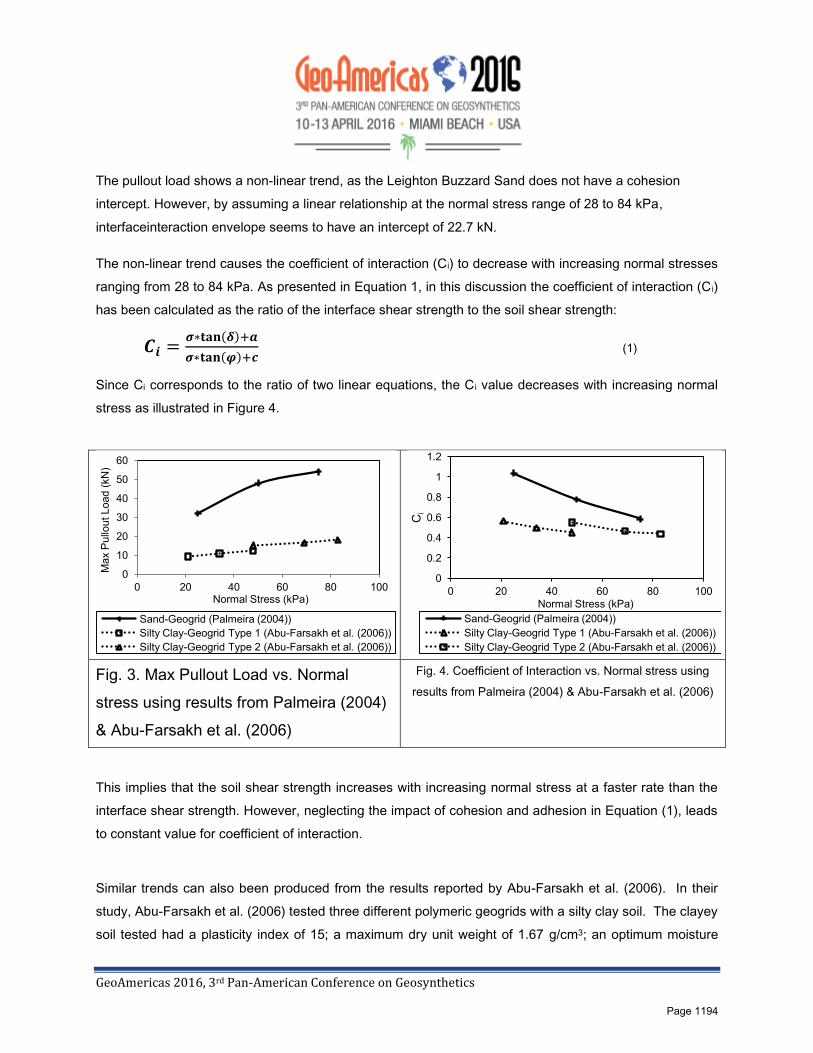
Palmeira (2004) reported the results of pullout tests with varying normal stresses. The tests used a
L B S 4/2 °
This friction angle was obtained at the stress level of 25 kPa in the direct shear test. The results are
shown in Figure 3.
Page 1193
GeoAmericas 2016, 3rd Pan-American Conference on Geosynthetics
The pullout load shows a non-linear trend, as the Leighton Buzzard Sand does not have a cohesion
intercept. However, by assuming a linear relationship at the normal stress range of 28 to 84 kPa,
interfaceinteraction envelope seems to have an intercept of 22.7 kN.
The non-linear trend causes the coefficient of interaction (Ci) to decrease with increasing normal stresses
ranging from 28 to 84 kPa. As presented in Equation 1, in this discussion the coefficient of interaction (C i)
has been calculated as the ratio of the interface shear strength to the soil shear strength:
(1)
Since Ci corresponds to the ratio of two linear equations, the C i value decreases with increasing normal
stress as illustrated in Figure 4.
Fig. 3. Max Pullout Load vs. Normal
stress using results from Palmeira (2004)
& Abu-Farsakh et al. (2006)
Fig. 4. Coefficient of Interaction vs. Normal stress using
results from Palmeira (2004) & Abu-Farsakh et al. (2006)
This implies that the soil shear strength increases with increasing normal stress at a faster rate than the
interface shear strength. However, neglecting the impact of cohesion and adhesion in Equation (1), leads
to constant value for coefficient of interaction.
Similar trends can also been produced from the results reported by Abu-Farsakh et al. (2006). In their
study, Abu-Farsakh et al. (2006) tested three different polymeric geogrids with a silty clay soil. The clayey
soil tested had a plasticity index of 15; a maximum dry unit weight of 1.67 g/cm3; an optimum moisture
0
10
20
30
40
50
60
0 20 40 60 80 100
Max
Pul
lout
Loa
d (k
N)
Normal Stress (kPa)
Sand-Geogrid (Palmeira (2004)) Silty Clay-Geogrid Type 1 (Abu-Farsakh et al. (2006)) Silty Clay-Geogrid Type 2 (Abu-Farsakh et al. (2006))
0
0.2
0.4
0.6
0.8
1
1.2
0 20 40 60 80 100
Ci
Normal Stress (kPa) Sand-Geogrid (Palmeira (2004)) Silty Clay-Geogrid Type 1 (Abu-Farsakh et al. (2006)) Silty Clay-Geogrid Type 2 (Abu-Farsakh et al. (2006))
Page 1194

GeoAmericas 2016, 3rd Pan-American Conference on Geosynthetics
content of 18.5%; an angle of internal friction of 24 degree; and a cohesion intercept of 14.4 kPa. The
ultimate pullout resistance obtained in their study for two of the geogrids is presented in Figure 3. The
coefficient of interaction calculated using the data reported by Abu-Faskah et al. (2006) is presented in
Figure 4. The results show a similar decreasing trend with Ci due to the adhesion in the interface shear
strength.
3.1.2 Results of this study
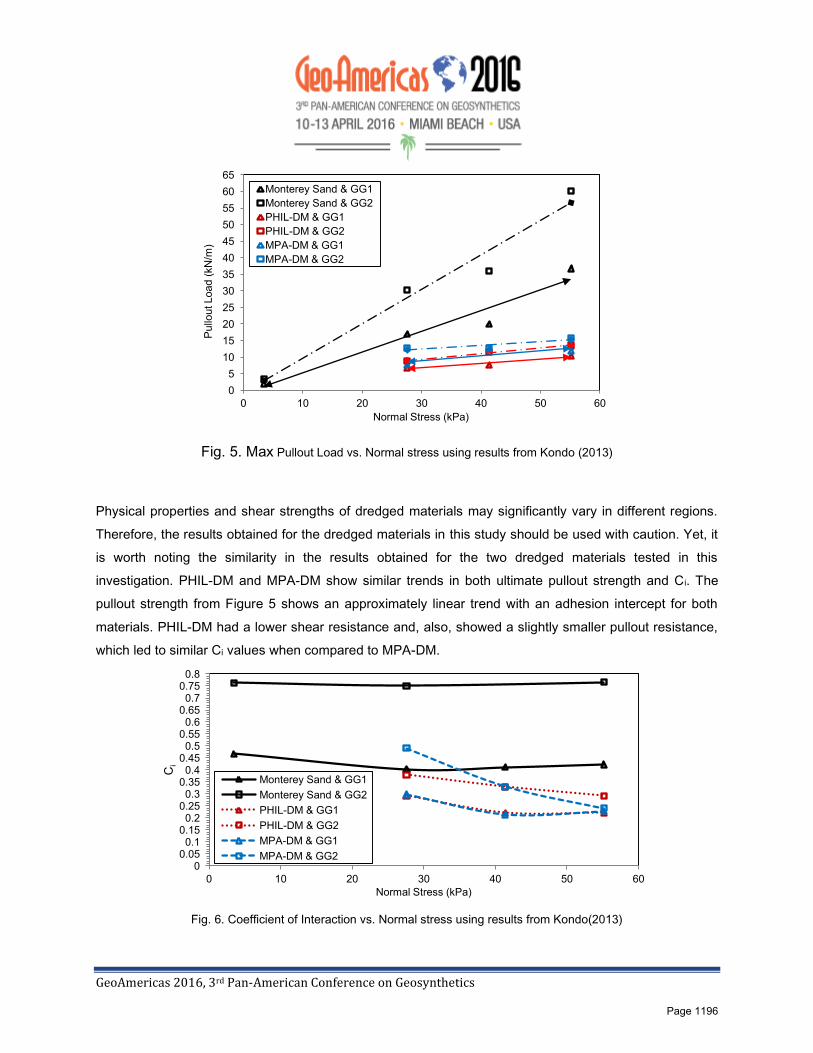
The ultimate pullout strengths for all combinations of fill materials and the geosynthetic reinforcements in
this study are presented in Figure 5. While for Monterey sand the max pullout force defines a linear
relationship with normal stress with zero adhesion, both dredged materials show linear relationships with
normal pressures ranging from 28 to 56 kPa with considerable adhesion intercept in the various sets of
tests. Since no tests were conducted with normal stresses below 28 kPa, the linear trend can only be
assumed.
The pullout results obtained from the tests with dredged materials show an increase in the ultimate pullout
resistance of approximately 6 kN/m for a normal stress window of 28 to 56 kPa, specimen width of 0.3
meters, and an embedment length of 0.9 meters. This increase is approximately the same when using
different geogrids (GG1 and GG2) and different dredged materials (MPA-DM and PHIL-DM). However,
Monterey Sand showed an ultimate pullout increase that was an order of magnitude higher than the
dredged materials. The increase in the pullout resistance in Monterey Sand is consistent with drained
behavior. The dredged materials seem to show a response that is more consistent with an undrained
behavior in that the pullout resistance is relatively constant, at least when compared to the Monterey
Sand. This is particularly relevant because both dredged materials have moisture contents considerably
in excess of the optimum values. The undrained condition would probably develop additional pore water
pressure in the dredged materials.
Page 1195
GeoAmericas 2016, 3rd Pan-American Conference on Geosynthetics
Fig. 5. Max Pullout Load vs. Normal stress using results from Kondo (2013)
Physical properties and shear strengths of dredged materials may significantly vary in different regions.
Therefore, the results obtained for the dredged materials in this study should be used with caution. Yet, it
is worth noting the similarity in the results obtained for the two dredged materials tested in this
investigation. PHIL-DM and MPA-DM show similar trends in both ultimate pullout strength and Ci. The
pullout strength from Figure 5 shows an approximately linear trend with an adhesion intercept for both
materials. PHIL-DM had a lower shear resistance and, also, showed a slightly smaller pullout resistance,
which led to similar Ci values when compared to MPA-DM.
Fig. 6. Coefficient of Interaction vs. Normal stress using results from Kondo(2013)
0 5
10 15 20 25 30 35 40 45 50 55 60 65
0 10 20 30 40 50 60
Pul
lout
Loa
d (k
N/m
)
Normal Stress (kPa)
Monterey Sand & GG1 Monterey Sand & GG2 PHIL-DM & GG1 PHIL-DM & GG2 MPA-DM & GG1 MPA-DM & GG2
0 0.05 0.1
0.15 0.2
0.25 0.3
0.35 0.4
0.45 0.5
0.55 0.6
0.65 0.7
0.75 0.8
0 10 20 30 40 50 60
Ci
Normal Stress (kPa)
Monterey Sand & GG1 Monterey Sand & GG2 PHIL-DM & GG1 PHIL-DM & GG2 MPA-DM & GG1 MPA-DM & GG2
Page 1196

GeoAmericas 2016, 3rd Pan-American Conference on Geosynthetics
Frictional angles and adhesion intercepts obtained from linear regression between 28 to 56 kPa normal
stresses in Figure 5 were used to calculate the coefficient of interactions presented in Figure 6. Due to
the presence of adhesion, it was found that the Ci values decrease with increasing normal stress.
However, the pullout curves for Monterey sand were found to be linear passing through the origin. This
indicates zero adhesion for this fill material that leads to an almost constant coefficient of interaction
(Figure 6).
Evaluation of the curves presented in Figures 5 and 6 indicates that the impact from using a stronger
geogrid is more pronounced in the sandy soil than in the dredged materials. Pullout resistance and
coefficient of interaction of Monterey sand were found to be significantly larger with GG2 than with GG1.
When GG2 were used in dredged materials, PHIL-DM showed slightly larger change in pullout resistance
as compared to the change in MPA-DM. When compared to GG1, GG2 significantly increased Ci values
of the dredged materials, particularly in smaller normal stresses (Figure 6).
In general, compared to the dredged materials, Monterey sand exhibited significantly larger coefficient of
interaction with both geogrids. While the coefficient of interaction of Monterey sand with GG1 was found
to be almost 0.45, this coefficient was found to vary from 0.2 to 0.3 for both dredged materials. The
coefficient of interaction rose to 0.75 when GG2 was used with Monterey sand, whereas this coefficient
varies from 0.23 to 0.50 for the dredged materials.
3.2 Effect of Length
3.2.1 Previous trends observed
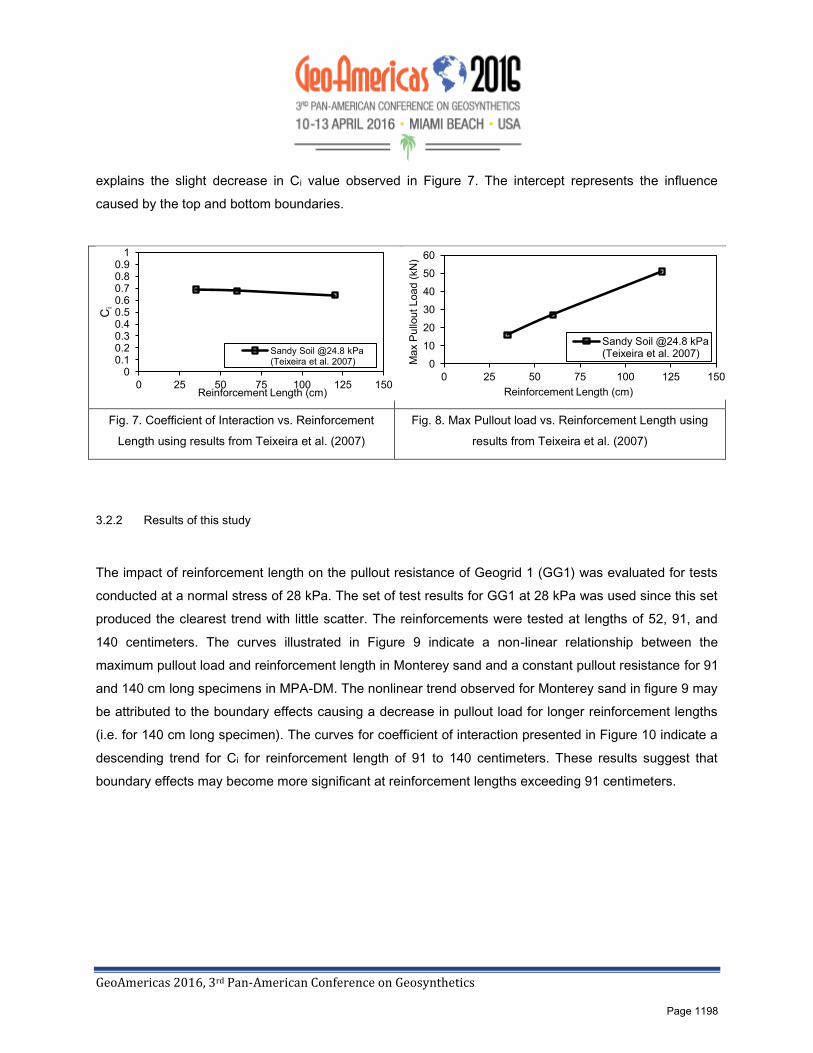
Teixeira et al. (2007) conducted tests with varying reinforcement lengths using a large pullout box. The
results agree with Palmeira and Milligan (1989) in that the coefficient of interaction shows only a minor
decreasing trend with increasing reinforcement length. The results are shown in Figure 7.
The figure shows that as the reinforcement length increases, the Ci value remains reasonably constant.
This can also be studied from the ultimate pullout resistance versus reinforcement length. As illustrated in
Figure 8, since the relationship between ultimate pullout resistance and reinforcement length is linear with
zero intercept, Ci will be constant. However, the line in Figure 8 appears to have a small intercept, which
Page 1197
GeoAmericas 2016, 3rd Pan-American Conference on Geosynthetics
explains the slight decrease in Ci value observed in Figure 7. The intercept represents the influence
caused by the top and bottom boundaries.
Fig. 7. Coefficient of Interaction vs. Reinforcement
Length using results from Teixeira et al. (2007)
Fig. 8. Max Pullout load vs. Reinforcement Length using
results from Teixeira et al. (2007)
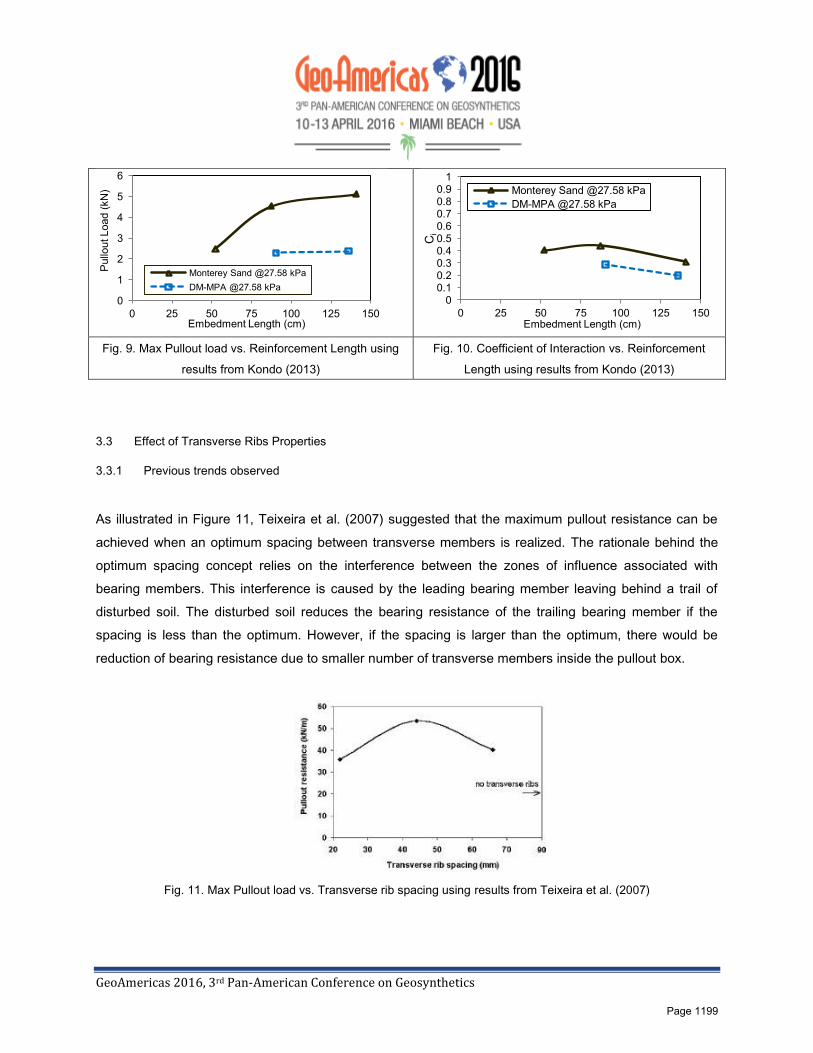
3.2.2 Results of this study
The impact of reinforcement length on the pullout resistance of Geogrid 1 (GG1) was evaluated for tests
conducted at a normal stress of 28 kPa. The set of test results for GG1 at 28 kPa was used since this set
produced the clearest trend with little scatter. The reinforcements were tested at lengths of 52, 91, and
140 centimeters. The curves illustrated in Figure 9 indicate a non-linear relationship between the
maximum pullout load and reinforcement length in Monterey sand and a constant pullout resistance for 91
and 140 cm long specimens in MPA-DM. The nonlinear trend observed for Monterey sand in figure 9 may
be attributed to the boundary effects causing a decrease in pullout load for longer reinforcement lengths
(i.e. for 140 cm long specimen). The curves for coefficient of interaction presented in Figure 10 indicate a
descending trend for Ci for reinforcement length of 91 to 140 centimeters. These results suggest that
boundary effects may become more significant at reinforcement lengths exceeding 91 centimeters.
0 0.1 0.2 0.3 0.4 0.5 0.6 0.7 0.8 0.9
1
0 25 50 75 100 125 150
Ci
Reinforcement Length (cm)
Sandy Soil @24.8 kPa (Teixeira et al. 2007) 0
10
20
30
40
50
60
0 25 50 75 100 125 150
Max
Pul
lout
Loa
d (k
N)
Reinforcement Length (cm)
Sandy Soil @24.8 kPa (Teixeira et al. 2007)
Page 1198
GeoAmericas 2016, 3rd Pan-American Conference on Geosynthetics
Fig. 9. Max Pullout load vs. Reinforcement Length using
results from Kondo (2013)
Fig. 10. Coefficient of Interaction vs. Reinforcement
Length using results from Kondo (2013)
3.3 Effect of Transverse Ribs Properties
3.3.1 Previous trends observed
As illustrated in Figure 11, Teixeira et al. (2007) suggested that the maximum pullout resistance can be
achieved when an optimum spacing between transverse members is realized. The rationale behind the
optimum spacing concept relies on the interference between the zones of influence associated with
bearing members. This interference is caused by the leading bearing member leaving behind a trail of
disturbed soil. The disturbed soil reduces the bearing resistance of the trailing bearing member if the
spacing is less than the optimum. However, if the spacing is larger than the optimum, there would be
reduction of bearing resistance due to smaller number of transverse members inside the pullout box.
Fig. 11. Max Pullout load vs. Transverse rib spacing using results from Teixeira et al. (2007)
0
1
2
3
4
5
6
0 25 50 75 100 125 150
Pul
lout
Loa
d (k
N)
Embedment Length (cm)
Monterey Sand @27.58 kPa DM-MPA @27.58 kPa
0 0.1 0.2 0.3 0.4 0.5 0.6 0.7 0.8 0.9
1
0 25 50 75 100 125 150
Ci
Embedment Length (cm)
Monterey Sand @27.58 kPa DM-MPA @27.58 kPa
Page 1199
GeoAmericas 2016, 3rd Pan-American Conference on Geosynthetics
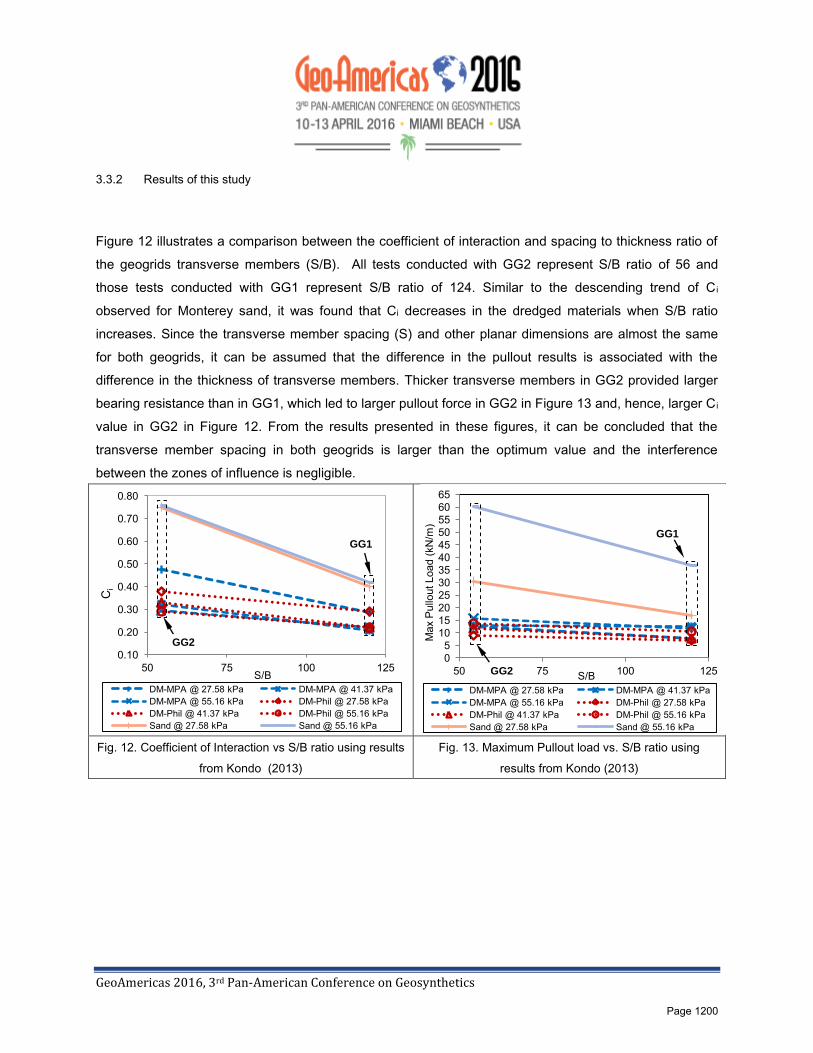
3.3.2 Results of this study
Figure 12 illustrates a comparison between the coefficient of interaction and spacing to thickness ratio of
the geogrids transverse members (S/B). All tests conducted with GG2 represent S/B ratio of 56 and
those tests conducted with GG1 represent S/B ratio of 124. Similar to the descending trend of C i
observed for Monterey sand, it was found that Ci decreases in the dredged materials when S/B ratio
increases. Since the transverse member spacing (S) and other planar dimensions are almost the same
for both geogrids, it can be assumed that the difference in the pullout results is associated with the
difference in the thickness of transverse members. Thicker transverse members in GG2 provided larger
bearing resistance than in GG1, which led to larger pullout force in GG2 in Figure 13 and, hence, larger C i
value in GG2 in Figure 12. From the results presented in these figures, it can be concluded that the
transverse member spacing in both geogrids is larger than the optimum value and the interference
between the zones of influence is negligible.
Fig. 12. Coefficient of Interaction vs S/B ratio using results
from Kondo (2013)
Fig. 13. Maximum Pullout load vs. S/B ratio using
results from Kondo (2013)
0.10
0.20
0.30
0.40
0.50
0.60
0.70
0.80
50 75 100 125
Ci
S/B DM-MPA @ 27.58 kPa DM-MPA @ 41.37 kPa DM-MPA @ 55.16 kPa DM-Phil @ 27.58 kPa DM-Phil @ 41.37 kPa DM-Phil @ 55.16 kPa Sand @ 27.58 kPa Sand @ 55.16 kPa
GG2
GG1
0 5
10 15 20 25 30 35 40 45 50 55 60 65
50 75 100 125
Max
Pul
lout
Loa
d (k
N/m
)
S/B DM-MPA @ 27.58 kPa DM-MPA @ 41.37 kPa DM-MPA @ 55.16 kPa DM-Phil @ 27.58 kPa DM-Phil @ 41.37 kPa DM-Phil @ 55.16 kPa Sand @ 27.58 kPa Sand @ 55.16 kPa
GG2
GG1
Page 1200

GeoAmericas 2016, 3rd Pan-American Conference on Geosynthetics
4. CONCLUSIONS
The results of laboratory pullout tests on two uniaxial geogrid reinforcements embedded in three backfill
materials were presented in this study. The geogrids were tested at different confining stresses, different
lengths, and with three different soils including two dredged materials (MPA-DM and PHIL-DM) and a
standard uniform sand (Monterey Sand). The dredged materials were compacted at similar densities and
moisture contents. The standard uniform sand was used with the same geosynthetic reinforcements to
provide a baseline for comparison purposes. The measured pullout resistances were used to calculate
the coefficient of interaction between soil and geogrid. Based on the obtained results in this study and the
pullout results obtained in other studies with conventional sandy or clayey backfills, the following
conclusions can be drawn:
The ultimate pullout resistance in the dredged materials was found to be three to four times lower
than in Monterey sand.
The coefficient of interaction between the uniaxial geogrids and the dredged materials was found
to vary from 0.23 to 0.50, which is slightly smaller than this value for clayey soils. The coefficient
of interaction was found to vary from 0.45 to 0.75 in Monterey sand.
The presence of adhesion component in the pullout resistance of the dredged materials resulted
in a decreasing trend in the coefficient of interaction with increasing normal stress.
It was found that the coefficient of interaction was not impacted by the reinforcement length. The
dredged materials tested wet of optimum produced a lower rate of increase in pullout resistance
with increasing normal stress as compared to Monterey Sand. This comparatively low rate of
change is consistent with undrained behavior in dredged materials.
The pullout resistance and the coefficient of interaction were found to be larger in the geogrid with
lower spacing to thickness ratio (S/B) for transverse ribs. It can be envisioned that thicker
transverse members in this geogrid provided larger bearing resistance, which led to larger pullout
force and, hence, larger Ci value.
ACKNOWLEDGEMENTS
The materials and resources to support this study were provided by CETCO, Phoenix Services, LLC,
Tensar Co., and USACE. Thank you to Dr. Grubb for his support on this project. His contributions helped
shape the background for this study.
Page 1201
GeoAmericas 2016, 3rd Pan-American Conference on Geosynthetics
REFERENCES
Abu-Farsak M Y A ’ I K (2 6) “C L
P G M S ” Journal of the Transportation Research Board,
No. 1975, 124 - 136.
AS M D (2 ) “S M atory compaction characteristics of soil using
” A S M W C k PA
G D D G P M W J C M I L Y (2 6) “L
of crushed glass- ” J. Geotech. Geoenviron. Eng., 132(5), 562-576.
K J K (2 ) “P E U x G E D M ” MSc.
Thesis, The University of Texas at Austin, Texas.
P E M (2 4) “B orce mobilization in pull- ” Geotextiles and
Geomembrens, 22(6), 481-509.
P E M & M G W E ( 9 9) “S -out tests of
” Geotechnique, 39(3), 511-524.
x S B B Z J (2 ) ”P R I L
G R ” J. Geotech. Geoenviron. Eng., 133(1), 37–50.
Page 1202