female violent crime arrest rates have increased 150 200 250 age arrests per 100,000 females female...
TRANSCRIPT

U.S. Department of Justice
Office of Justice Programs
Office of Juvenile Justice and Delinquency Prevention
DEP
ARTMENT OF JUSTICE
OF
FIC
E
OF JUST I CE PRO
GR
AM
S
BJA
N
I JOJJDP BJS
OV
C
10 15 20 25 30 35 40 45 500
50
100
150
200
250
Age
Arrests per 100,000 females
Female Violent Crime Arrest Rates Have Increased
1992
1983

Research and Program Development Divisiondevelops knowledge on national trends in juveniledelinquency; supports a program for data collectionand information sharing that incorporates elementsof statistical and systems development; identifieshow delinquency develops and the best methodsfor its prevention, intervention, and treatment; andanalyzes practices and trends in the juvenile justicesystem.
Training and Technical Assistance Division pro-vides juvenile justice training and technical assist-ance to Federal, State, and local governments; lawenforcement, judiciary, and corrections personnel;and private agencies, educational institutions, andcommunity organizations.
Special Emphasis Division provides discretionaryfunds to public and private agencies, organizations,and individuals to replicate tested approaches todelinquency prevention, treatment, and control insuch pertinent areas as chronic juvenile offenders,community-based sanctions, and the disproportionaterepresentation of minorities in the juvenile justicesystem.
State Relations and Assistance Division supportscollaborative efforts by States to carry out the man-dates of the JJDP Act by providing formula grantfunds to States; furnishing technical assistance toStates, local governments, and private agencies;and monitoring State compliance with the JJDP Act.
Information Dissemination Unit informs individualsand organizations of OJJDP initiatives; disseminatesinformation on juvenile justice, delinquency preven-tion, and missing children; and coordinates programplanning efforts within OJJDP. The unit’s activitiesinclude publishing research and statistical reports,bulletins, and other documents, as well as overseeingthe operations of the Juvenile Justice Clearinghouse.
Concentration of Federal Efforts Program pro-motes interagency cooperation and coordinationamong Federal agencies with responsibilities in thearea of juvenile justice. The program primarily carriesout this responsibility through the Coordinating Coun-cil on Juvenile Justice and Delinquency Prevention, anindependent body within the executive branch thatwas established by Congress through the JJDP Act.
Missing and Exploited Children’s Program seeks topromote effective policies and procedures for address-ing the problem of missing and exploited children.Established by the Missing Children’s Assistance Actof 1984, the program provides funds for a variety ofactivities to support and coordinate a network of re-sources such as the National Center for Missing andExploited Children; training and technical assistanceto a network of 47 State clearinghouses, nonprofitorganizations, law enforcement personnel, and attor-neys; and research and demonstration programs.
Office of Juvenile Justiceand Delinquency Prevention
The Office of Juvenile Justice and Delinquency Prevention (OJJDP) was established by the President and Con-gress through the Juvenile Justice and Delinquency Prevention (JJDP) Act of 1974, Public Law 93–415, asamended. Located within the Office of Justice Programs of the U.S. Department of Justice, OJJDP’s goal is toprovide national leadership in addressing the issues of juvenile delinquency and improving juvenile justice.
OJJDP sponsors a broad array of research, program, and training initiatives to improve the juvenile justicesystem as a whole, as well as to benefit individual youth-serving agencies. These initiatives are carried out byseven components within OJJDP, described below.
The mission of OJJDP is to provide national leadership, coordination, and resources to prevent juvenile victimizationand respond appropriately to juvenile delinquency. This is accomplished through developing and implementing pre-vention programs and a juvenile justice system that protects the public safety, holds juvenile offenders accountable,and provides treatment and rehabilitative services based on the needs of each individual juvenile.

Female Offenders in theJuvenile Justice System
Statistics Summary
June 1996
Eileen Poe-Yamagata, M.S.Jeffrey A. Butts, Ph.D.
Shay Bilchik, AdministratorOffice of Juvenile Justice and Delinquency Prevention

The Office of Juvenile Justice and Delinquency Prevention is a component of the Office of JusticePrograms, which also includes the Bureau of Justice Assistance, the Bureau of Justice Statistics, theNational Institute of Justice, and the Office for Victims of Crime.
This report was prepared by the National Center for Juvenile Justice, the research division of theNational Council of Juvenile and Family Court Judges, and was supported by cooperative agreementnumber 95–JN–FX–0008 from the Office of Juvenile Justice and Delinquency Prevention (OJJDP),U.S. Department of Justice.
Points of view or opinions expressed in this document are those of the authors and do not necessarilyrepresent the official position or policies of OJJDP or the U.S. Department of Justice.
Copyright 1996. National Center for Juvenile Justice, 710 Fifth Avenue, Pittsburgh, PA 15219–3000,412–227–6950.

iii
ForewordThe appropriate treatment of female offenders by the juvenile justice system is amatter of increasing interest to policymakers, practitioners, and the public. Theissue merits our attention and our concern.
Female Offenders in the Juvenile Justice System analyzes patterns in the arrest,judicial management, and correctional placement of female offenders. Citingdata from diverse sources, the study notes that females are entering the juvenilejustice system more frequently and at younger ages.
Although male juvenile offenders still account for most delinquent acts, therelative growth in juvenile arrests involving females was more than double thegrowth for males between 1989 and 1993. While juvenile arrests for violentcrimes increased 33 percent for males during that period, they increased 55percent for females. In fact, the ratio of male juvenile arrests to female juvenilearrests declined from eight to one in 1989 to six to one in 1993.
As the involvement of female offenders in delinquent behavior rises, we mustenhance our efforts to meet this challenge. Consideration of the changingprofile of female delinquency portrayed in this study is an excellent startingpoint.
Shay BilchikAdministratorOffice of Juvenile Justice and Delinquency Prevention

iv

v
AcknowledgmentsThis Statistics Summary was written by Eileen Poe-Yamagata and Jeffrey A.Butts of the National Center for Juvenile Justice (NCJJ). Other individuals atNCJJ assisted with preparation and review of the study, including NancyTierney, Melissa Sickmund, and Howard Snyder.
The analysis was supported by funds provided to the National Juvenile CourtData Archive by the Office of Juvenile Justice and Delinquency Prevention(OJJDP).
Joseph Moone served as OJJDP Program Manager for the project. Both OJJDPand NCJJ gratefully acknowledge the efforts of the many State and localagencies that contributed data to the archive. Their cooperation in fulfillingrequests for data and documentation made this work possible.

vi

vii
Table of ContentsForeword ......................................................................................................... iii
Acknowledgments ...................................................................................... v
Introduction ................................................................................................... 1
Arrests of Female Juvenile Offenders ................................................ 2
Arrest Trends ................................................................................................... 2
Juvenile Versus Adult Arrests ......................................................................... 4
Arrest Rates ..................................................................................................... 5
Arrest Rates by Age ........................................................................................ 8
Female Offenders in the Juvenile Court ............................................ 8
Delinquency Case Trends ............................................................................... 9
Court Processing ........................................................................................... 10
Offense Characteristics ................................................................................. 12
Probation Caseloads ...................................................................................... 12
Criminal Court Transfers .............................................................................. 13
Female Juvenile Offenders in Custody ............................................ 14
Short-Term Custody (Detention) .................................................................. 14
Long-Term Custody (Commitment) ............................................................. 16
State Variations ............................................................................................. 18
Conclusion .................................................................................................... 18
Related Reading ......................................................................................... 20
Methods .......................................................................................................... 21
Juvenile Arrests ............................................................................................. 21
Juvenile Delinquency Cases .......................................................................... 21
Juvenile Correctional Populations ................................................................. 22
Tables, Figures, and Data Tables
Tables
Table 1: Arrests of Persons Under 18 Years of Age, 1993 .......................... 3
Table 2: Female Proportion of Juvenile and Adult Arrests,1983, 1988, and 1993..................................................................... 4
Table 3: Delinquency Cases by Most Serious Offense andSex, 1993 ..................................................................................... 10
Table 4: Juvenile Court Processing of Delinquency Casesby Sex, 1993 ................................................................................ 11
Table 5: Offense Profile of Delinquency Cases at VariousStages of Court Processing by Sex, 1989 and 1993 .................... 12

viii
Table 6: Percent of Adjudicated Delinquency Cases Resultingin Formal Probation by Sex, 1989 and 1993 ............................... 13
Table 7: Percent Change in Adjudicated Delinquency CasesResulting in Formal Probation by Sex, 1989 and 1993 ............... 13
Table 8: Percent of Delinquency Cases Detained by Sex,1989 and 1993.............................................................................. 14
Table 9: Percent Change in Delinquency Cases InvolvingSecure Detention by Sex, 1989 and 1993 .................................... 15
Table 10: Offense Profile of Delinquency Cases InvolvingSecure Detention and Juveniles Detained in PublicFacilities by Sex, 1989 and 1993 ................................................. 15
Table 11: Percent of Adjudicated Delinquency Cases Resultingin Out-of-Home Placement by Sex, 1989 and 1993 ..................... 16
Table 12: Percent Change in Delinquency Cases Resultingin Out-of-Home Placement by Sex, 1989 and 1993 .................... 17
Table 13: Offense Profile of Adjudicated Delinquency CasesResulting in Out-of-Home Placement and JuvenilesCommitted to Public and Private Facilities by Sex,1989 and 1993.............................................................................. 17
Table 14: Juvenile Detention and Commitment Admissionsto Public Facilities by State, 1988–1992 ..................................... 19
Figures
Figure 1: Juvenile Proportion of Arrests by Sex, 1993 ................................. 5
Figure 2: Percent Change in Juvenile Arrest Rates by Sex,1983–1992 ..................................................................................... 6
Figure 3: Arrest Rates by Sex and Age, 1983 and 1992 ............................... 9
Figure 4: Juvenile Court Processing of Delinquency Casesby Sex, 1993 ................................................................................ 11
Data Tables
Data Table 1: Juvenile Arrest Rates by Sex, 1973–1992............................. 23
Data Table 2: Arrest Rates by Sex and Age, 1983 and 1992....................... 25

1
n 1993, U.S.law enforcementagencies made anestimated 570,100arrests involvingfemales under theage of 18.
IIntroductionOne of the few indisputable facts in the study of juvenile crime is that youngfemales are far less likely than males to violate the law and become involved inthe juvenile justice system. In recent years, however, many people have cometo believe that the problem of female delinquency is growing faster than theproblem of male delinquency. This belief in the disproportionate growth offemale juvenile crime is often embraced by the public, the news media, electedofficials, and juvenile justice practitioners. Has there, in fact, been a disparateincrease in crime among juvenile females?
In response to these concerns, this study explores several questions: How manyfemales are arrested and processed by the juvenile justice system each year?How does this number compare with that for males? Has the rate and severityof female delinquency changed in recent years? What happens to female juve-nile offenders once they are referred to the juvenile court? Are young femaleshandled differently than males, and has the population of females in out-of-home placement changed? These questions are answered using data from theFederal Bureau of Investigation’s (FBI’s) Uniform Crime Reporting (UCR)Program; the National Juvenile Court Data Archive; and the biannual Census ofPublic Juvenile Detention, Correctional, and Shelter Facilities, more commonlyknown as the Children in Custody (CIC) census.
Data from the study indicate the following:
■ In 1993, U.S. law enforcement agencies made an estimated 570,100 arrestsinvolving females under the age of 18.
■ Between 1989 and 1993, the number of arrests involving female juvenilesincreased by 23% compared with an 11% increase in arrests of malejuveniles.
■ The female proportion of all juvenile arrests grew from 21% to 24%between 1983 and 1993.
■ Females were responsible for 17% of the growth in juvenile arrests forViolent Crime Index offenses between 1989 and 1993.
■ Juvenile courts in the United States handled an estimated 1,489,700delinquency cases in 1993, 20% of which involved females.
■ Between 1989 and 1993, the number of juvenile court cases involvingfemales charged with delinquency offenses increased by 31%, while thenumber of cases involving males increased by 21%.
■ Delinquency cases involving females were less likely than those involvingmales to be processed formally, more likely to receive probation as themost restrictive disposition, and less likely to result in detention or out-of-home placement.
■ Between 1989 and 1993, juveniles charged with person offenses increasedas a proportion of the female custody population, growing from 16% to29% of detained females and from 23% to 31% of committed femaleoffenders.

2
Juvenile arrests forViolent Crime Indexoffenses increased by55% for females.
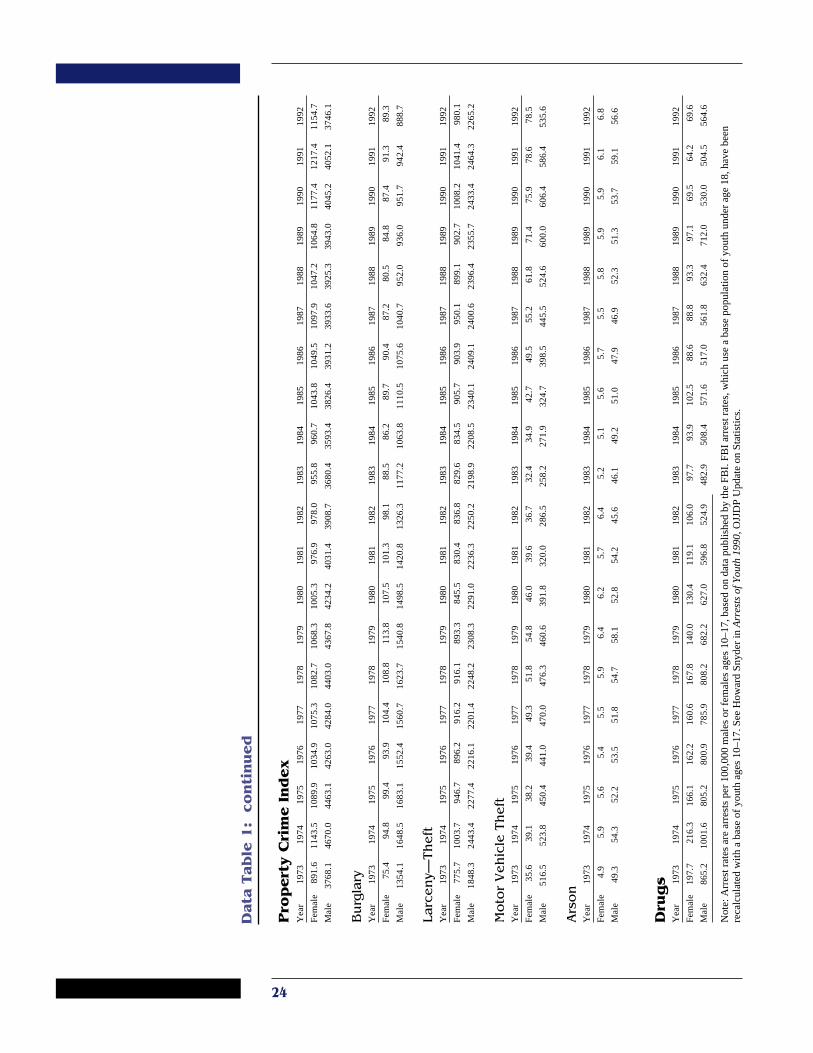
Arrests of Female Juvenile OffendersUnited States law enforcement agencies made an estimated 2.4 million arrestsof persons under the age of 18 in 1993 (table 1). Nearly one-fourth (24%) ofthose arrests involved females. The relative involvement of females varied byoffense. Among Violent Crime Index offenses, females were responsible for 6%of juvenile arrests for murder and nonnegligent manslaughter, 2% for forciblerape, 9% for robbery, and 18% for aggravated assault.1 Among Property CrimeIndex offenses, females were involved in 10% of arrests for burglary, 31% forlarceny-theft, 14% for motor vehicle theft, and 12% for arson. The female pro-portion of juvenile arrests for non-Index offenses varied substantially. Femalesaccounted for 4% of juvenile arrests for gambling, 8% for weapons offenses,and 9% for sex offenses but were responsible for 57% of youth arrests forrunning away from home and 55% for prostitution. Other offenses with highproportions of female arrests included forgery and counterfeiting (35%), em-bezzlement (41%), and offenses against family and children (36%).
Arrest TrendsBetween 1989 and 1993, the relative growth in juvenile arrests involving fe-males was more than double the growth for males (23% versus 11%). Juvenilearrests for Violent Crime Index offenses increased by 55% for females versus33% for males. As a result, the ratio of male arrests to female arrests for ViolentCrime Index offenses declined from 8:1 in 1989 to 6:1 in 1993. Overall, femaleswere responsible for 17% of the growth in the number of juvenile arrests forViolent Crime Index offenses between 1989 and 1993.
Because relatively few juveniles are arrested for murder and rape, changes inarrests for Violent Crime Index offenses are controlled by changes in the num-ber of arrests for aggravated assault and robbery. More specifically, the dispar-ate growth in female arrests for Violent Crime Index offenses is the result of thelarge increase in the number of aggravated assault arrests for females. Growthin female arrests for aggravated assault was almost double the growth for males,while the growth in robbery arrests for females was only slightly greater thanthe growth for males.
Arrests for Property Crime Index offenses involving females increased substan-tially between 1989 and 1993, while the number of male arrests for PropertyCrime Index offenses declined. Overall, female arrests for Property Crime In-dex offenses increased by 22% between 1989 and 1993, although male arrestsdeclined by 3%.
For juveniles, female arrests increased more than male arrests in most of thenon-Index offense categories. For example, arrests for simple assault and weap-ons violations increased substantially more among females than males between1989 and 1993. Similar patterns were found in arrests for disorderly conductand vagrancy. However, increases in the number of male arrests outpaced the
1. Although this section uses the term “juvenile” to mean all persons under the age of 18, States vary in theirlegal definitions of juvenile status.

3
growth in female arrests in cases of fraud, gambling, drug abuse violations, andoffenses against family and children.
Table 1: Arrests of Persons Under 18 Years of Age, 1993
Estimated Juvenile Arrestsa Percent ChangePercent 1989–1993
Most Serious Offense Total Female Female Female Male
Total 2,388,800 570,100 24% 23% 11%
Crime Index Totalb 836,100 189,300 23 24 3
Violent Crime Index 138,600 18,800 14 55 33Murder/nonnegligent manslaughter 3,800 200 6 35 45Forcible rape 6,300 100 2 -10 10Robbery 49,000 4,400 9 43 37Aggravated assault 79,500 14,100 18 62 33
Property Crime Index 697,600 170,500 24 22 -3Burglary 138,100 13,300 10 16 -6Larceny-theft 462,400 144,200 31 21 -1Motor vehicle theft 87,400 11,800 14 28 -8Arson 9,600 1,200 12 53 21
Non-Index Offense 1,552,700 380,800 25 22 16Simple assault 185,300 48,100 26 64 38Forgery and counterfeiting 7,800 2,700 35 14 -1Fraud 19,800 5,300 27 34 51Embezzlement 700 300 41 -37 -38
Stolen property offense 42,700 4,700 11 22 -3Vandalism 142,700 13,700 10 33 23Weapons offense; possession, etc. 61,200 4,900 8 100 64Prostitution/commercialized vice 1,100 600 55 -33 -12
Sex offense (excluding rape, prostitution) 19,500 1,700 9 51 20Drug abuse violation 108,500 12,000 11 -2 3Gambling 1,300 100 4 47 70Offense against family/children 4,800 1,700 36 62 75
Driving under the influence 13,300 1,900 14 -31 -33Liquor laws 113,500 32,300 28 -18 -21Drunkenness 16,700 2,700 16 -25 -22Disorderly conduct 145,100 33,200 23 41 23
Vagrancy 3,700 600 17 59 37All other offenses (except traffic) 384,300 82,700 22 23 21Curfew and loitering law violation 100,200 28,200 28 48 29Runaway 180,500 103,300 57 16 10
a The FBI does not calculate national estimates for arrests involving persons under the age of 18. Theestimates presented in this table were developed by applying the proportion of arrests for persons under theage of 18 within each offense category in the Uniform Crime Reporting sample to the Uniform CrimeReporting’s national estimates of total arrests in each offense category. This method was demonstrated in“Arrests of Youth 1990” by Howard Snyder, OJJDP Update on Statistics.
b Includes Violent Crime Index and Property Crime Index offenses.
Data Source: Federal Bureau of Investigation. Crime in the United States 1993
Detail may not add to totals due to rounding. Percentages are calculated on unrounded numbers.

4
Juvenile Versus Adult ArrestsAlthough females were responsible for a greater proportion of juvenile (24%)than adult (19%) arrests in 1993, the female proportion of arrests for most Indexoffenses was comparable between juveniles and adults (table 2). However, therewere variations across offense categories. The female proportion of juvenilearrests was larger than the female proportion of adult arrests for aggravatedassault and motor vehicle theft. By contrast, females were responsible for asmaller proportion of juvenile than adult arrests for murder and arson.
Nonetheless, the female proportion of arrests among both juveniles and adultsincreased between 1983 and 1993. Although slight variations existed amongoffenses, changes in the female proportions of juvenile and adult arrests weresimilar for Violent Crime Index and Property Crime Index offenses.
Variations also occurred across offense categories in the overall proportion offemale and male arrests that involved juveniles. In 1993, 21% of all femalearrests involved youth under the age of 18 compared with 16% of male arrests(figure 1). Juveniles were responsible for 19% of female arrests and 18% ofmale arrests for Violent Crime Index offenses in 1993. The youth proportion offemale arrests for Property Crime Index offenses was slightly lower than thecorresponding proportion for males (31% versus 34%).
Table 2: Female Proportion of Juvenile and Adult Arrests,1983, 1988, and 1993
Female Proportion of Female Proportion ofArrests of Persons Under Age 18Arrests of Persons Age 18 or Older
Most Serious Offense 1983 1988 1993 1983 1988 1993
All Arrests* 21% 22% 24% 16% 17% 19%
Violent Crime Index 11 11 13 11 11 13Murder/nonnegligent
manslaughter 11 7 6 14 13 10Forcible rape 1 2 2 0 1 1Robbery 7 7 9 8 9 9Aggravated assault 16 15 18 13 13 15
Property Crime Index 20 20 24 24 26 27Burglary 7 7 10 7 9 10Larceny-theft 27 26 31 31 32 33Motor vehicle theft 11 10 14 8 10 10Arson 10 10 12 14 16 17
Weapons offense 6 7 8 8 8 8
Drug abuse offense 16 12 11 14 16 17
* Includes offenses not detailed below.
Data Sources: Federal Bureau of Investigation. Crime in the United States 1983, Crime in the United States1988, and Crime in the United States 1993.
Juveniles wereresponsible for 19%of female arrests forviolent crimes.

5
Figure 1: Juvenile Proportion of Arrests by Sex, 1993
Female
Male
60%
Total
ViolentCrime Index
Murder
Forciblerape
Robbery
Aggravatedassault
PropertyCrime Index
Burglary
Larceny-theft
Motor vehicletheft
Arson
0% 10% 20% 30% 40% 50%
Data Source: Federal Bureau of Investigation. Crime in the United States 1993.
Arrest RatesThe juvenile population of the United States has changed substantially in recentdecades. Analyzing per capita arrest rates removes the effect of this changingpopulation and simplifies comparisons of arrest trends over time. During the10-year period from 1983 through 1992, the Violent Crime Index arrest rategenerally increased for juveniles (figure 2).2 However, this rate increased morethan 80% for females versus slightly less than 50% for males. Nonetheless,female arrest rates for Violent Crime Index offenses remained far lower thanmale rates. For every 100,000 females age 10–17 in 1992, there were 121 fe-male arrests for a Violent Crime Index offense. The male arrest rate was sixtimes higher (786 per 100,000).
Between 1983 and 1992 the Property Crime Index arrest rate increased 21% forfemales while remaining relatively stable for males (2%). Still, the magnitudeof the female Property Crime Index arrest rate was less than one-third the ratefor males during the entire 10-year period.
For every 100,000females age 10–17 in1992, there were 121female arrests for aViolent Crime Indexoffense.
Percent of arrests involving juveniles
2. At the time this analysis was prepared, the FBI had not released 1993 arrest rate statistics.

6
Note: Arrest rates are arrests per 100,000 males or females ages 10–17, based on data published by the FBI. FBI arrest rates, which use a base population ofyouth under age 18, have been recalculated with a base of youth ages 10–17. See Howard Snyder in “Arrests of Youth 1990,” OJJDP Update on Statistics.
Figure 2: Percent Change in Juvenile Arrest Rates by Sex, 1983–1992
Rate 1983 1992Female 66 121Male 529 786
1983 1984 1985 1986 1987 1988 1989 1990 1991 1992-10%
0%
10%
20%
30%
40%
50%
60%
70%
80%
90%
Percent change from 1983
Females
Males
Violent Crime Index
1983 1984 1985 1986 1987 1988 1989 1990 1991 1992-5%
0%
5%
10%
15%
20%
25%
30%
Percent change from 1983
Rate 1983 1992Female 956 1,155Male 3,680 3,746
Females
Males
Property Crime Index
1983 1984 1985 1986 1987 1988 1989 1990 1991 1992-20%
0%
20%
40%
60%
80%
100%
120%
140%
160%
Percent change from 1983
Rate 1983 1992Female 1 1Male 10 22
Females
Males
1983 1984 1985 1986 1987 1988 1989 1990 1991 19920%
5%
10%
15%
20%
25%
30%
Percent change from 1983
Rate 1983 1992Female * *Male 34 42
* Female numbers are too small to produce reliable trends.
Males
Forcible Rape
1983 1984 1985 1986 1987 1988 1989 1990 1991 1992-20%
-10%
0%
10%
20%
30%
40%
50%
60%
Percent change from 1983
Rate 1983 1992Female 19 29Male 261 294
Females
Males
Robbery
1983 1984 1985 1986 1987 1988 1989 1990 1991 19920%
10%
20%
30%
40%
50%
60%
70%
80%
90%
100%
Percent change from 1983
Rate 1983 1992Female 45 90Male 224 429
Females
Males
Aggravated Assault
Murder

7
Data Source: Federal Bureau of Investigation. Age-Specific and Race-Specific Arrest Rates for Selected Offenses 1965–1992.
Figure 2: continued
Females
Males
1983 1984 1985 1986 1987 1988 1989 1990 1991 1992-25%
-20%
-15%
-10%
-5%
0%
5%
Percent change from 1983
Rate 1983 1992Female 89 89Male 1,177 889
Burglary
1983 1984 1985 1986 1987 1988 1989 1990 1991 19920%
5%
10%
15%
20%
25%
30%
Percent change from 1983
Rate 1983 1992Female 830 980Male 2,199 2,265
Females
Males
Larceny-Theft
1983 1984 1985 1986 1987 1988 1989 1990 1991 19920%
20%
40%
60%
80%
100%
120%
140%
160%
Percent change from 1983
Rate 1983 1992Female 32 79Male 258 536
Females
Males
Motor Vehicle Theft
1983 1984 1985 1986 1987 1988 1989 1990 1991 1992-5%
0%
5%
10%
15%
20%
25%
30%
Percent change from 1983
Rate 1983 1992Female 5 7Male 46 57
Females
Males
Arson
1983 1984 1985 1986 1987 1988 1989 1990 1991 19920%
20%
40%
60%
80%
100%
120%
140%
160%
Percent change from 1983
Rate 1983 1992Female 12 29Male 167 354
Females
Males
Weapons Law Violation
1983 1984 1985 1986 1987 1988 1989 1990 1991 1992-40%
-30%
-20%
-10%
0%
10%
20%
30%
40%
50%
Percent change from 1983
Rate 1983 1992Female 98 70Male 483 565
Females
Males
Drug Abuse Violation

8
In some offense categories, changes in female and male arrest rates were simi-lar. For example, aggravated assault arrest rates for both females and malesnearly doubled between 1983 and 1992. Robbery arrest rates for both femalesand males generally declined between 1983 and 1987, before increasing sharplybetween 1988 and 1991 and then declining slightly in 1992.
For other offenses, the female arrest rate remained relatively flat while the malearrest rate grew. For example, the arrest rate for murder more than doubledamong male juveniles between 1983 and 1992, while the female rate fluctuatedwithin a limited range during the entire 10-year period. Between 1983 and1992 the drug arrest rate for females generally declined, while the rate for malesincreased sharply between 1983 and 1989 and then declined to a level compa-rable to that of the early 1980s.
For some offenses, changes in arrest rates were parallel for females and malesduring much of the past 10 years and diverged only recently. For example, bur-glary arrest rates generally declined from 1983 to 1988 for both females andmales. Since 1988, however, the male arrest rate for burglary continued to dropwhile the arrest rate for females returned to the levels of the early 1980s. Arrestrates for motor vehicle theft jumped sharply between 1983 and 1989 for bothfemales and males. Between 1989 and 1992, however, the male arrest rate be-gan to decline but the female rate did not. Between 1983 and 1990 the increasein arrest rates for weapons offenses was comparable for females and males(59% and 63%). However, between 1990 and 1992 the weapons arrest rate in-creased more sharply among females than males.
Arrest Rates by AgeBetween 1983 and 1992, the Violent Crime Index arrest rate increased substan-tially among individuals in nearly every age category (figure 3). In relativeterms, the increase in the Violent Crime Index arrest rate was almost alwaysgreater among females than among males. While very few changes occurred inthe Property Crime Index arrest rate between 1983 and 1992 for males under theage of 30, the arrest rate for females increased more markedly.
Female Offenders in the Juvenile CourtJuvenile courts in the United States handled an estimated 1,489,700 delin-quency cases in 1993 (table 3). Females were involved in 20% of these cases,which nearly equaled the female proportion of juvenile arrests that year (24%).Female juveniles were responsible for 22% of all person offense cases, 20% ofproperty offense cases, 12% of drug law violation cases, and 20% of publicorder offense cases (e.g., disorderly conduct, weapons offenses, liquor law vio-lations). Females were most involved in cases of simple assault (28%) and lar-ceny-theft (29%).
The female proportions of delinquency cases involving Violent and PropertyCrime Index offenses were almost equal to the female proportions of arrests forthose offenses. In 1993, females were involved in 16% of juvenile court casesinvolving Violent Crime Index offenses compared with 14% of juvenile arrests
Female juvenileswere responsible for22% of all personoffense cases in 1993.

9
for those charges. Females accounted for 22% of juvenile court cases involvingProperty Crime Index offenses versus 24% of juvenile arrests for those offenses.
Delinquency Case TrendsAs found in the preceding analysis of arrest trends, the number of juvenile courtcases involving females increased more in relative terms between 1989 and1993 than did the number of cases involving males. The total number of delin-quency cases involving females increased by 31% between 1989 and 1993,while cases involving males increased by 21%. Growth in the delinquencycaseload was greater among females than among males in cases involving per-son offenses and property offenses. By contrast, the number of cases involvingdrug law violations and public order offenses increased more among males thanamong females. In general, the relative growth in female and male delinquencycases paralleled the juvenile arrest trends shown above.
0
50
100
150
200
250
10 15 20 25 30 35 40 45 50
Age
Arrests per 100,000 females
1992
1983
0
500
1000
1500
2000
10 15 20 25 30 35 40 45 50
Age
Arrests per 100,000 males
1992
1983
0
500
1000
1500
2000
10 15 20 25 30 35 40 45 50
Age
Arrests per 100,000 females
1992
1983
0
1000
2000
3000
4000
5000
6000
7000
10 15 20 25 30 35 40 45 50
Age
Arrests per 100,000 males
1992
1983
Female Violent Crime Index Male Violent Crime Index
Female Property Crime Index Male Property Crime Index
Note: Arrest rates are arrests per 100,000 population in each age group.
Data Source: Federal Bureau of Investigation. Age-Specific and Race-Specific Arrest Rates for Selected Offenses 1965–1992.
Figure 3: Arrest Rates by Sex and Age, 1983 and 1992
The total numberof delinquency casesinvolving femalesincreased by 31%between 1989 and1993.

10
Court ProcessingAt all stages of juvenile court processing, delinquency cases involving femaleyouth received less severe outcomes than cases involving males. For example,females referred to juvenile court were less likely than males to be formallyprocessed with the filing of a delinquency petition (figure 4). Females weremost likely to be petitioned for cases involving public order offenses, whilecases involving males were petitioned most often for drug law violations (table 4).Between 1989 and 1993, the likelihood of formal handling increased slightly forboth females (from 41% to 43%) and males (from 53% to 56%).
Table 3: Delinquency Cases by Most Serious Offense andSex, 1993
Percent ChangeNumber of Cases Percent 1989–1993
Most Serious Offense Total Female Female Female Male
Total Cases 1,489,700 297,400 20% 31% 21%
Person Offense 318,800 70,400 22 68 49Criminal homicide 2,800 200 8 6 49Forcible rape 6,100 200 3 92 47Robbery 35,600 3,200 9 62 55Aggravated assault 77,500 16,200 21 84 53Simple assault 166,400 46,300 28 66 46Other violent sex offense 10,900 500 5 70 63Other person offense 19,300 3,800 20 42 33
Property Offense 808,900 161,000 20 25 12Burglary 149,700 13,300 9 20 13Larceny-theft 353,700 102,800 29 24 7Motor vehicle theft 61,100 10,200 17 10 -13Arson 8,200 1,000 12 27 20Vandalism 117,100 12,200 10 43 41Trespassing 60,500 10,000 16 23 22Stolen property offense 27,400 3,000 11 22 15Other property offense 31,300 8,500 27 52 23
Drug Law Violation 89,100 11,000 12 1 16
Public Order Offense 272,800 54,900 20 19 25Obstruction of justice 96,000 22,100 23 12 19Disorderly conduct 71,200 17,200 24 67 44Weapons offense 47,200 4,300 9 120 85Liquor law violation 13,200 3,500 27 -17 -16Nonviolent sex offense 10,900 1,000 10 -21 -10Other public order 34,400 6,800 20 -19 -3
Violent Crime Index 122,000 19,800 16 79 53
Property Crime Index 572,600 127,300 22 22 6
Note: National estimates of juvenile delinquency cases are generated annually for the Juvenile Court Statisticsseries. For information on the procedures used to generate the estimates, see the methods section in thisUpdate or in Juvenile Court Statistics 1993. Detail may not add to totals due to rounding. Percentages arecalculated on unrounded numbers.
Data Source: National Center for Juvenile Justice. National Juvenile Court Data Archive: Juvenile CourtCase Records 1989 and 1993 [machine-readable data files].

11
Female
Transferred 400 0.3%Petitioned Placed 15,300 23%127,500 43% Adjudicated 67,000 53% Probation 40,300 60%
Other 8,800 13%Dismissed 2,500 4%
297,400 Cases Placed 1,600 3%
Nonadjudicated 60,100 47% Probation 15,600 26%Other 8,500 14%Dismissed 34,400 57%
Nonpetitioned Placed 800 <1%169,900 57% Probation 45,800 27%
Other 40,600 24%Dismissed 82,600 49%
Male
Transferred 11,300 1.7%Petitioned Placed 113,400 29%661,800 56% Adjudicated 390,000 59% Probation 214,500 55%
Other 46,800 12%Dismissed 15,300 4%
1,192,300Cases Placed 4,600 2%
Nonadjudicated 260,500 39% Probation 58,500 22%Other 34,900 13%Dismissed 162,500 62%
Nonpetitioned Placed 5,000 1%530,500 44% Probation 145,800 27%
Other 120,100 23%Dismissed 259,500 49%
Note: Detail may not add to totals because of rounding.
Data Source: National Center for Juvenile Justice. National Juvenile Court Data Archive: Juvenile Court Case Records 1993 [machine-readable data file].
Table 4: Juvenile Court Processing of Delinquency Cases bySex, 1993
Percent ofPercent of Petitioned Cases
Most Serious Offense .Cases Petitioned Adjudicated
Female Male Female Male
Total Cases 43% 56% 53% 59%Person 47 60 49 55Property 38 53 51 60Drugs 49 63 53 60Public order 51 56 60 62
Data Source: National Center for Juvenile Justice. National Juvenile Court Data Archive: Juvenile CourtCase Records 1993 [machine-readable data file].
Figure 4: Juvenile Court Processing of Delinquency Cases by Sex, 1993

12
When handled formally, delinquency cases involving female juveniles werealso less likely to result in juvenile court adjudication. In 1993, 53% of peti-tioned cases involving female juveniles were adjudicated compared with 59%of cases involving males. For both females and males, the probability of adjudi-cation was greatest in cases involving public order offenses. The probability ofadjudication decreased slightly between 1989 and 1993 for formally handledcases involving females as well as for those involving males.
Offense CharacteristicsPerson offenses accounted for 24% of all female delinquency cases in 1993compared with 21% of cases involving males (table 5). Both the female andmale caseloads included a higher proportion of person offenses in 1993 thanin 1989. Among all adjudicated cases between 1989 and 1993, person offensecases grew from 18% to 24% of the female caseload and from 17% to 21% ofthe male caseload.
Probation CaseloadsAdjudicated females were more likely than males to be placed on formal proba-tion. Probation was the most restrictive disposition ordered by juvenile courtsin 60% of adjudicated delinquency cases involving females in 1993 comparedwith 55% of cases involving males (table 6). This pattern occurred in all offensecategories. The likelihood of probation was virtually unchanged between 1989and 1993 for both females and males.
Table 5: Offense Profile of Delinquency Cases at VariousStages of Court Processing by Sex, 1989 and 1993
Female MaleMost Serious Offense . 1989 1993 1989 1993
Total CasesPerson 18% 24% 17% 21%Property 57 54 59 54Drugs 5 4 7 7Public order 20 18 18 18Total 100% 100% 100% 100%
PetitionedPerson 20% 26% 19% 23%Property 51 48 56 52Drugs 6 4 8 8Public order 23 22 17 18Total 100% 100% 100% 100%
AdjudicatedPerson 18% 24% 17% 21%Property 50 46 57 52Drugs 6 4 9 8Public order 26 25 17 19Total 100% 100% 100% 100%
Note: Detail may not add to totals because of rounding.
Data Source: National Center for Juvenile Justice. National Juvenile Court Data Archive: Juvenile CourtCase Records 1989 and 1993 [machine-readable data files].
A djudicatedfemales were morelikely than males tobe placed on formalprobation.

13
In recent years, the female probation caseload increased more than that of maleprobationers. Between 1989 and 1993, the number of adjudicated delinquencycases in which probation was the most restrictive disposition increased by 26%for females and 16% for males (table 7). Increases in the number of cases result-ing in probation occurred in three of the four general offense categories for fe-males, with person offense cases showing the greatest increase.
Criminal Court TransfersDelinquency cases involving females were far less likely to be transferred to thecriminal (adult) courts than were cases involving males. In 1993, 0.3% of for-mally processed cases involving females were judicially transferred to criminalcourt compared with 1.7% of formal cases involving males. Between 1989 and1993, relatively little change occurred in the likelihood of criminal court trans-fer for either males or females.
Table 6: Percent of Adjudicated Delinquency Cases Result-ing in Formal Probation by Sex, 1989 and 1993
Female MaleMost Serious Offense . 1989 1993 1989 1993
Total Cases 60% 60% 56% 55%Person 63 61 55 54Property 62 62 58 58Drugs 61 60 55 53Public order 53 55 50 50
Data Source: National Center for Juvenile Justice. National Juvenile Court Data Archive: Juvenile CourtCase Records 1989 and 1993 [machine-readable data files].
Table 7: Percent Change in Adjudicated Delinquency CasesResulting in Formal Probation by Sex, 1989 and1993
Number of Cases PercentMost Serious Offense 1989 1993 Change
Female 31,900 40,300 26%Person 6,200 10,000 62Property 16,600 19,400 17Drugs 1,900 1,700 -11Public order 7,200 9,300 29
Male 185,100 214,500 16%Person 31,000 43,900 42Property 109,700 117,300 7Drugs 15,700 15,800 1Public order 28,700 37,500 30
Note: Detail may not add to totals because of rounding. Percent change calculations are based on unroundednumbers.
Data Source: National Center for Juvenile Justice. National Juvenile Court Data Archive: Juvenile CourtCase Records 1989 and 1993 [machine-readable data files].
Delinquencycases involving femaleswere far less likely tobe transferred to thecriminal (adult) courtsthan were cases involv-ing males.

14
Female Juvenile Offenders in CustodyFemales were less likely than males to be removed from their homes and takeninto custody either before or after juvenile court adjudication. In other words,females were less likely than males to experience either short-term custody(detention) or long-term custody (commitment and out-of-home placement).
Short-Term Custody (Detention)In 1993, secure detention was used at some point between referral and disposi-tion in 16% of delinquency cases involving females compared with 22% ofcases involving males (table 8). The likelihood of detention changed very littlebetween 1989 and 1993 for either sex. The largest relative change was in theproportion of drug cases involving detention, which fell from 27% to 23% forfemales and from 38% to 32% for males. Females and males were least likely tobe detained in cases involving property offenses. Males were most likely to bedetained in drug offense cases (32%), while the greatest use of detention forfemales occurred in both drug offense and public order offense cases (23%).
Despite the lower likelihood of detention for female juvenile offenders, thenumber of juvenile court cases involving detained females increased more inrelative terms than the number of detention cases involving males. The numberof female detention cases increased by 23% between 1989 and 1993, while thecorresponding increase for males was 18% (table 9). Growth in female propertyoffense cases involving detention was more than double the growth among malecases. However, the number of drug offense cases involving detention declinedmore among females than among males.
Offense Profiles. The offense profile of the juvenile detention populationchanged slightly between 1989 and 1993. Person offenses increased both as aproportion of delinquency cases involving detention and as a proportion of ju-veniles held in public detention facilities. In 1993, person offenses accountedfor 25% of female delinquency cases involving detention, up from 21% in 1989(table 10). Person offenses were also more common in the male detentioncaseload, accounting for 25% of delinquency cases involving detention in 1993versus 20% of detention cases in 1989.
Table 8: Percent of Delinquency Cases Detained by Sex,1989 and 1993
Female MaleMost Serious Offense 1989 1993 1989 1993
Total Cases 17% 16% 22% 22%Person 19 17 27 25Property 12 12 18 18Drugs 27 23 38 32Public order 25 23 26 25
Data Source: National Center for Juvenile Justice. National Juvenile Court Data Archive: Juvenile CourtCase Records 1989 and 1993 [machine-readable data files].
S ecure detentionwas used betweenreferral and dispositionin 16% of delinquencycases involvingfemales.

15
Table 9: Percent Change in Delinquency Cases InvolvingSecure Detention by Sex, 1989 and 1993
Cases PercentMost Serious Offense 1989 1993 Change
Female 38,400 47,100 23%Person 8,100 11,900 47Property 15,900 20,000 26Drugs 3,000 2,600 -13Public order 11,400 12,700 11
Male 217,900 256,600 18%Person 44,600 63,200 42Property 102,400 114,300 12Drugs 25,200 24,800 -2Public order 45,700 54,300 19
Note: Detail may not add to totals due to rounding. Percent change calculations are based on unroundednumbers.
Data Source: National Center for Juvenile Justice. National Juvenile Court Data Archive: Juvenile CourtCase Records 1989 and 1993 [machine-readable data files].
Table 10: Offense Profile of Delinquency Cases InvolvingSecure Detention and Juveniles Detained inPublic Facilities by Sex, 1989 and 1993
Female MaleMost Serious Offense 1989 1993 1989 1993
Delinquency CasesInvolving Detention
Person 21% 25% 20% 25%Property 41 43 47 45Drugs 8 5 12 10Public order* 30 27 21 21Total 100% 100% 100% 100%
Juveniles Detainedin Public Facilities
Person 16% 29% 25% 37%Property 33 28 39 30Drugs 9 6 14 9Public order 15 14 10 11Probation/parole violation 26 24 13 12Total 100% 100% 100% 100%
* Includes probation/parole violations.
Note: Offense profiles of detained juveniles are based on 1-day counts of juveniles charged with delinquentoffenses, excluding juveniles with “unknown” offenses. Unknown offenses accounted for 4% of juvenilesdetained in public facilities in 1989 and 15% in 1993. Percentages may not add to 100% because of rounding.
Data Sources: National Center for Juvenile Justice. National Juvenile Court Data Archive: Juvenile CourtCase Records 1989 and 1993 [machine-readable data files]. Office of Juvenile Justice and DelinquencyPrevention. Census of Private and Public Juvenile Detention, Correctional, and Shelter Facilities 1989 and1993 [machine-readable data files].

16
The same pattern was found in 1-day counts of youth detained in public correc-tional facilities. Between 1989 and 1993, juveniles charged with person of-fenses increased from 16% to 29% of females held under detention status inpublic facilities. Person offenses also increased as a proportion of the detainedmale population. On the other hand, juveniles charged with property offensesdeclined as a proportion of detained females as well as males. One of the moststriking gender differences in the offense profiles of detained juveniles was thepercentage of cases in which the most serious alleged charge was a violation ofprobation or parole (aftercare). In 1993, 24% of females detained were chargedwith probation and parole violations compared with 12% of male juveniles.
Long-Term Custody (Commitment)Female offenders were less likely than males to be ordered to an out-of-homeplacement following juvenile court adjudication and disposition. Placement wasthe most restrictive disposition in 23% of adjudicated delinquency cases involv-ing females in 1993 compared with 29% of cases involving males (table 11).Placement was less common for females regardless of the seriousness of theoffense charged against the youth. The likelihood of placement declined slightlybetween 1989 and 1993 for adjudicated females and males and across mostoffense categories.
In 1993, the number of male delinquency cases that resulted in out-of-homeplacement greatly outnumbered placement cases involving females. Althoughthe number of placement cases increased by 11% for both females and malesbetween 1989 and 1993, increases varied across offense categories (table 12).The increase in the number of female person offense cases involving placementwas nearly double the increase among males. However, the decline in the num-ber of drug offense cases involving placement was substantially greater for fe-males than males.
Offense Profiles. The offense profiles of committed juveniles were similar tothose of the detained population discussed above. Among youth involved injuvenile court placement cases, an increasing proportion was charged with
Table 11: Percent of Adjudicated Delinquency CasesResulting in Out-of-Home Placement by Sex,1989 and 1993
Female MaleMost Serious Offense 1989 1993 1989 1993
Total Cases 26% 23% 31% 29%Person 25 24 35 32Property 20 18 26 26Drugs 30 23 36 30Public order 37 31 39 35
Data Source: National Center for Juvenile Justice. National Juvenile Court Data Archive: Juvenile CourtCase Records 1989 and 1993 [machine-readable data files].
F emale offenderswere less likely thanmales to be orderedto an out-of-homeplacement.

17
person offenses. Between 1989 and 1993, juveniles charged with person of-fenses increased from 17% to 25% of all females involved in placement casesand from 19% to 23% of males (table 13).
Table 12: Percent Change in Delinquency Cases Resultingin Out-of-Home Placement by Sex, 1989 and 1993
Cases PercentMost Serious Offense 1989 1993 Change
Female 13,700 15,300 11%Person 2,400 3,800 60Property 5,400 5,600 5Drugs 1,000 700 -32Public order 5,000 5,200 4
Male 101,900 113,400 11%Person 19,600 26,200 34Property 49,700 52,300 5Drugs 10,400 9,000 -14Public order 22,300 26,100 17
Note: Detail may not add to totals due to rounding. Percent change calculations are based on unroundednumbers.
Data Source: National Center for Juvenile Justice. National Juvenile Court Data Archive: Juvenile CourtCase Records 1989 and 1993 [machine-readable data files].
Table 13: Offense Profile of Adjudicated Delinquency CasesResulting in Out-of-Home Placement and Juve-niles Committed to Public and Private Facilitiesby Sex, 1989 and 1993
Female MaleMost Serious Offense 1989 1993 1989 1993
Delinquency CasesInvolving Placement
Person 17% 25% 19% 23%Property 39 37 49 46Drugs 7 4 10 8Public order* 36 34 22 23Total 100% 100% 100% 100%
Juveniles Committed toPublic and Private Facilities
Person 23% 31% 28% 40%Property 46 45 50 39Drugs 8 8 11 11Public order 11 9 6 6Probation/parole violation 11 7 6 5Total 100% 100% 100% 100%
* Includes probation/parole violations.
Note: Offense profiles of committed juveniles are based on 1-day counts of juveniles charged with delinquentoffenses, excluding juveniles with “unknown” offenses. Unknown offenses accounted for 3% of committedjuveniles in 1989 and 7% in 1993. Percentages may not add to 100% because of rounding.
Data Sources: National Center for Juvenile Justice. National Juvenile Court Data Archive: Juvenile CourtCase Records 1989 and 1993 [machine-readable data files]. Office of Juvenile Justice and DelinquencyPrevention. Census of Private and Public Juvenile Detention, Correctional, and Shelter Facilities 1989 and1993 [machine-readable data files].

18
As reflected by 1-day counts of youth held in public and private facilities in1989 and 1993, juveniles charged with person offenses also increased as a pro-portion of all committed youth. Person offenses grew from 23% to 31% of thecommitted female population and from 28% to 40% of committed males. Juve-niles charged with property offenses declined as a proportion of committedjuvenile offenders, both for females and males.
State VariationsIn 1992, females represented 20% or more of juvenile detention admissions topublic facilities in 27 States and the District of Columbia (table 14).3 Overall,the number of detention admissions involving female juvenile offenders in-creased by 3% between 1988 and 1992. The largest relative increases in femaledetention admissions were seen in Louisiana, Massachusetts, Montana, andNew York.4 Substantial decreases (greater than 50%) were reported by severalother jurisdictions, including Delaware, the District of Columbia, Hawaii,Rhode Island, and Wyoming.
Females were less prevalent among juvenile commitment admissions to publicfacilities, accounting for 20% or more of the admissions in only nine jurisdic-tions.5 Three States—Delaware, Massachusetts, and Vermont—reported nofemale commitment admissions to public facilities in 1992. The highest propor-tions of females among commitment admissions to public facilities were re-ported by the District of Columbia (39%), Oklahoma (33%), Wyoming (33%),and South Dakota (26%). The largest relative increases in female commitmentadmissions were seen in the District of Columbia, Oklahoma, Rhode Island, andIdaho, while the largest relative decreases occurred in Colorado, Massachusetts,New Jersey, and South Dakota.
ConclusionThe findings of this study support the popular contention that female delin-quency has increased relatively more than male delinquency in recent years. Ofcourse, juvenile crime is still predominantly a male problem. More than three-quarters of juvenile arrests and juvenile court delinquency cases involve males.If recent trends continue, however, female delinquents will occupy even moreof the time and attention of policymakers, service providers, court officials, lawenforcement agencies, and communities.
3. Information collected in the CIC census reflects the total number of admissions for the preceding year.Thus, data from the 1989 census are for 1988 admissions, and the 1993 census reflects 1992 admissions.
4. Very large percentage increases in female admissions reported by smaller States are often the result of thenumber of admissions being very low in 1989.
5. Admissions data reflect publicly operated facilities only. Because some jurisdictions employ privateproviders for residential placement of juvenile offenders, these data may represent neither the entirejuvenile correctional population of a given State nor its overall placement practices. See the methodssection of this Summary for further information.
Juvenile crime isstill predominantly amale problem.

19
Table 14: Juvenile Detention and Commitment Admissions to Public Facilities by State,1988–1992
Detention Admissions Commitment AdmissionsPercent Change: Percent Change:
Percent 1988–1992 Percent 1988–1992State (Number of Facilities) Total Female Female Female Male Total Female Female Female Male
Total U.S. (1,025) 532,683 99,571 19% 3% 8% 138,661 14,998 11% 3% 19%Alabama (16) 7,986 1,462 18 -19 28 2,303 261 11 -29 1Alaska (5) 1,350 355 26 7 -18 97 12 12 -48 -4Arizona (14) 15,312 3,004 20 63 15 2,115 292 14 50 -41Arkansas (10) 4,253 783 18 58 115 1,107 75 7 -35 -8California (103) 128,974 17,698 14 0 7 47,690 2,964 6 10 39Colorado (9) 12,759 2,269 18 34 52 641 6 1 -73 180Connecticut (4) 3,021 668 22 39 10 472 97 21 21 31Delaware (3) 711 92 13 -53 -18 327 0 0 — 57District of Columbia (4) 365 150 41 -84 -97 370 143 39 500+ -59Florida (49) 33,498 4,857 14 -14 -12 3,397 372 11 -38 -14Georgia (28) 19,723 4,539 23 10 22 1,430 250 17 -37 -50Hawaii (2) 1,304 477 37 -62 -54 222 31 14 15 -6Idaho (3) 686 114 17 -35 -16 536 117 22 244 79Illinois (19) 11,786 1,447 12 -32 -21 7,275 341 5 -17 38Indiana (31) 13,599 3,465 25 9 9 3,230 642 20 -34 0Iowa (13) 2,431 762 31 -31 -35 1,086 243 22 51 55Kansas (13) 5,703 1,502 26 39 78 778 88 11 -54 14Kentucky (27) 4,361 926 21 -24 57 2,299 381 17 127 157Louisiana (15) 7,425 1,305 18 102 134 1,195 75 6 -29 -16Maine (1) 299 56 19 -3 -5 255 35 14 40 -11Maryland (13) 5,364 723 13 -32 -12 1,118 61 5 -59 -21Massachusetts (10) 1,857 321 17 120 -20 609 0 0 -100 -63Michigan (43) 15,936 3,189 20 10 8 1,995 279 14 -19 -2Minnesota (18) 7,722 1,765 23 22 7 2,400 290 12 100 14Mississippi (9) 3,045 1,047 34 -19 -42 1,587 156 10 81 75Missouri (45) 8,962 2,221 25 -19 -7 1,878 266 14 8 54Montana (6) 414 140 34 500+ 500+ 481 113 23 -16 7Nebraska (4) 2,632 450 17 -32 24 456 71 16 -8 -15Nevada (9) 8,201 2,593 32 45 10 1,043 141 14 38 30New Hampshire (2) 429 85 20 12 80 174 28 16 -15 -24New Jersey (46) 12,224 1,874 15 -10 -14 2,362 78 3 -66 -15New Mexico (14) 6,532 1,159 18 16 14 1,646 241 15 59 21New York (65) 6,566 1,845 28 107 -22 4,499 534 12 -4 30North Carolina (24) 5,668 1,844 33 -3 6 982 163 17 -46 -43North Dakota (3) 419 139 33 -8 23 390 57 15 8 152Ohio (62) 35,956 9,075 25 -7 11 10,134 1,920 19 23 25Oklahoma (16) 3,774 880 23 -25 3 1,889 622 33 368 456Oregon (13) 7,992 1,380 17 -13 39 1,999 174 9 1 -10Pennsylvania (34) 14,794 1,370 9 2 17 1,171 108 9 -1 -21Rhode Island (1) 324 82 25 -59 -56 644 89 14 256 296South Carolina (9) 2,776 489 18 -27 10 1,306 254 19 27 33South Dakota (6) 2,327 723 31 29 37 347 91 26 -61 -8Tennessee (23) 17,349 4,214 24 -2 15 1,605 200 12 -30 -27Texas (55) 34,316 5,421 16 13 39 5,865 414 7 0 23Utah (16) 8,405 1,877 22 45 51 1,630 296 18 164 146Vermont (1) 285 50 18 25 40 4 0 0 — -71Virginia (58) 16,277 3,197 20 17 31 2,911 464 16 -41 31Washington (30) 15,153 2,794 18 44 -4 8,508 1,230 14 50 16West Virginia (6) 801 131 16 -42 -19 563 53 9 18 8Wisconsin (13) 10,631 2,556 24 91 84 1,406 102 7 -45 81Wyoming (2) 6 6 100 -63 -100 234 78 33 -43 -31
Note: Figures in parentheses are the number of public facilities reporting 1992 data in each jurisdiction in 1993.
Data Source: Office of Juvenile Justice and Delinquency Prevention. Census of Private and Public Juvenile Detention, Correctional, and Shelter Facilities1989 and 1993 [machine-readable data files].

20
Related ReadingFor more information about the National Center for Juvenile Justice, write to710 Fifth Avenue, Pittsburgh, PA 15219-3000, or call 412-227-6950. To obtainJuvenile Court Statistics, other publications using data from the National Juve-nile Court Data Archive, or any reports that focus on juvenile justice statistics,contact the Juvenile Justice Clearinghouse (related readings appear below).
For more information about juvenile justice issues, the Office of Juvenile Jus-tice and Delinquency Prevention offers many free (up to five) and fee titles thatcan be ordered by juvenile justice professionals. Write the Juvenile JusticeClearinghouse, P.O. Box 6000, Rockville, MD 20849–6000, call 800–638–8736,or e-mail [email protected].
Delinquency Prevention Works (Program Summary), November 1995,NCJ 155006.
How Juveniles Get to Criminal Court (Update on Statistics), October 1994,NCJ 150039.
Juvenile Court Statistics 1992 (Statistics Report), June 1996, NCJ 154168.
Juvenile Court’s Response to Violent Offenders: 1985–1989 (Update on Statis-tics), April 1993, NCJ 139558.
Juvenile Offenders and Victims: A National Report, August 1995, NCJ 153569.
Juvenile Offenders and Victims: 1996 Update on Violence (Statistics Sum-mary), February 1996, NCJ 159107.
Juveniles Taken Into Custody: Fiscal Year 1993 (Statistics Report),September 1995, NCJ 154022.
Matrix of Community-Based Initiatives (Program Summary), Updated Septem-ber 1995, NCJ 154816.
Offenders in Juvenile Court, 1993 (Update on Statistics), June 1996,NCJ 160945.
What Works: Promising Interventions in Juvenile Justice (Program Report),October 1994, NCJ 150858. $19.00 (U.S.), $23.00 (Canada), $30.00 (othercountries).
A topical literature search of the NCJRS data base on female juvenileoffenders is also available (TS 021529) for $5.00 (U.S./Canada) or $7.50(other countries).

21
Methods
Juvenile ArrestsThe FBI’s Uniform Crime Reporting (UCR) Program collects information onarrests made by local law enforcement agencies throughout the United States.The data can be separated into arrests involving persons under and over the ageof 18 and arrests involving males versus those involving females. The arreststatistics generated by the UCR Program are based on the experience of a largenumber of law enforcement agencies. However, not all agencies are able toparticipate in the UCR. Furthermore, some agencies are unable to report data inenough detail to support analyses of arrests by age and sex. In 1993, arrest databy age and sex were reported by police agencies with jurisdiction over 83% ofthe U.S. population.
This study presents national estimates of the number of arrests involving per-sons under the age of 18. The FBI does not calculate national estimates for ar-rests involving persons under the age of 18, but its annual publication Crime inthe United States provides national estimates for the total number of arrests forvarious offenses. The arrest estimates for persons under the age of 18 presentedin this study were developed by deriving the proportion of youth arrests in eachoffense category from data reported by UCR-participating jurisdictions andapplying that proportion to the UCR national estimate of total arrests for thatoffense.
Similarly, the FBI publishes arrest rates (see Age-Specific Arrest Rates andRace-Specific Arrest Rates for Selected Offenses 1965–1992) that are calculatedas the number of juvenile arrests per 100,000 persons under the age of 18. Thearrest rates used in this study are based on rates published by the FBI but arerecalculated using a population base of persons ages 10–17. These rates arepreferred because very few arrests involve persons under the age of 10.
Juvenile Delinquency CasesNational estimates of juvenile delinquency cases are generated by the NationalJuvenile Court Data Archive and published annually in a series of reports titledJuvenile Court Statistics.6 Sponsored by OJJDP, the National Juvenile CourtData Archive collects data about juvenile court cases from State and local agen-cies throughout the Nation. Data are collected in two forms—detailed case-leveldata and aggregate court-level data. In 1993, case-level data describing eachcase’s demographic and processing characteristics were obtained from 1,375jurisdictions in 26 States. Combined, these jurisdictions contained 49% of theNation’s juvenile population (i.e., youth age 10 through the upper age of juve-nile court jurisdiction) and handled 689,505 delinquency cases in 1993. Aggre-gate court-level data (e.g., number of cases handled per year) were collected
6. The latest report in the series is: Jeffrey A. Butts, Howard N. Snyder, Terrence A. Finnegan, Anne L.Aughenbaugh, and Rowen S. Poole. Juvenile Court Statistics 1993. Washington, DC: Office of JuvenileJustice and Delinquency Prevention. 1996.

22
from an additional 443 jurisdictions in 6 States. In all, the 1993 national esti-mates of delinquency cases were based on data from 1,818 jurisdictions con-taining 67% of the Nation’s juvenile population.
National estimates of juvenile court cases are developed by weighting thearchive’s case-level and court-level data with weights that incorporate key char-acteristics known to affect juvenile court caseloads—the upper age of the juve-nile court’s jurisdiction in each State and the age and race composition of thejuvenile population in each U.S. county. The basic assumption underlying theestimation procedure is that the volume and characteristics of juvenile courtcaseloads are shaped by the same set of factors in reporting and nonreportingjurisdictions of similar size and demographic profile. A more complete descrip-tion of the estimation procedure appears in each Juvenile Court Statistics report.
Juvenile Correctional PopulationsSponsored by OJJDP, the Census of Public and Private Juvenile Detention,Correctional, and Shelter Facilities is conducted biannually by the U.S. Bureauof the Census. More commonly known as Children in Custody (or CIC), thecensus is designed to provide facility-based admissions and 1-day counts ofyouth held in public and private residential centers, such as detention centers,reception and/or diagnostic facilities, shelters, training schools, camps, ranches,and group homes. Detention centers operated as part of adult jails, drug abusetreatment centers, and foster homes are not included in the census. Data areprovided through questionnaires completed by facility administrators or otherpersonnel. The data analyzed in this study represent 1988 and 1992 juvenileadmissions to short-term and long-term public facilities and 1-day countsof all youth held in either public or private facilities on the 1989 and 1993 cen-sus reference dates (February 15 and 16, respectively). Only juveniles chargedwith delinquency offenses were included in the analyses. Status offenders andnonoffenders were excluded.

23
Data
Table
1:
Juvenile A
rrest
Rate
s b
y S
ex, 1
97
3–1
99
2
Vio
lent
Cri
me I
ndex
Ye
ar
19
73
19
74
19
75
19
76
19
77
19
78
19
79
19
80
19
81
19
82
19
83
19
84
19
85
19
86
19
87
19
88
19
89
19
90
19
91
19
92
Fe
ma
le5
7.9
68
.46
8.1
65
.96
4.1
67
.86
8.0
71
.16
9.9
69
.36
6.1
67
.76
8.0
72
.57
2.9
78
.49
1.9
10
5.8
11
1.1
12
0.6
Ma
le5
09
.75
68
.65
47
.65
27
.65
30
.76
00
.65
82
.05
93
.35
74
.45
61
.25
28
.85
24
.95
38
.35
60
.25
49
.95
75
.46
69
.77
49
.17
89
.77
86
.4
Murd
er
Ye
ar
19
73
19
74
19
75
19
76
19
77
19
78
19
79
19
80
19
81
19
82
19
83
19
84
19
85
19
86
19
87
19
88
19
89
19
90
19
91
19
92
Fe
ma
le1
.21
.21
.21
.41
.01
.21
.41
.01
.31
.11
.10
.91
.10
.91
.11
.21
.41
.21
.21
.4
Ma
le1
2.1
12
.11
0.0
10
.71
1.1
11
.01
1.3
11
.61
2.6
11
.99
.69
.71
0.1
11
.81
2.4
15
.61
8.4
22
.12
3.5
21
.7
Rap
eY
ea
r1
97
31
97
41
97
51
97
61
97
71
97
81
97
91
98
01
98
11
98
21
98
31
98
41
98
51
98
61
98
71
98
81
98
91
99
01
99
11
99
2
Fe
ma
le—
0.6
0.4
0.6
0.6
0.6
0.4
0.6
0.6
0.6
0.4
0.4
0.9
0.9
0.9
0.7
0.9
0.7
0.9
0.9
Ma
le3
1.5
32
.72
7.3
28
.92
9.9
30
.63
3.4
30
.83
1.2
33
.73
4.4
38
.74
0.1
41
.64
0.7
38
.34
1.1
42
.64
3.8
41
.6
Rob
bery
Ye
ar
19
73
19
74
19
75
19
76
19
77
19
78
19
79
19
80
19
81
19
82
19
83
19
84
19
85
19
86
19
87
19
88
19
89
19
90
19
91
19
92
Fe
ma
le2
1.1
24
.82
5.1
21
.92
1.6
23
.12
2.1
23
.92
3.4
20
.91
9.1
17
.61
7.9
18
.21
7.0
18
.42
4.3
27
.33
0.6
28
.7
Ma
le2
76
.63
10
.52
93
.02
63
.92
64
.93
16
.72
88
.43
07
.12
96
.22
79
.72
60
.82
44
.02
38
.62
35
.32
19
.22
14
.72
52
.12
79
.43
04
.52
94
.2
Agg
rava
ted A
ssau
ltY
ea
r1
97
31
97
41
97
51
97
61
97
71
97
81
97
91
98
01
98
11
98
21
98
31
98
41
98
51
98
61
98
71
98
81
98
91
99
01
99
11
99
2
Fe
ma
le3
5.4
41
.84
1.4
42
.24
0.9
42
.94
4.3
45
.54
4.8
46
.94
5.2
48
.84
8.1
52
.55
3.6
58
.16
5.2
76
.37
8.4
89
.5
Ma
le1
89
.32
13
.32
17
.32
23
.92
24
.52
42
.52
48
.82
43
.72
34
.22
35
.82
24
.02
32
.82
49
.52
71
.72
77
.63
06
.83
58
.04
04
.94
18
.14
29
.1
Weapons
Ye
ar
19
73
19
74
19
75
19
76
19
77
19
78
19
79
19
80
19
81
19
82
19
83
19
84
19
85
19
86
19
87
19
88
19
89
19
90
19
91
19
92
Fe
ma
le8
.81
0.5
9.6
10
.31
0.5
10
.01
1.1
10
.61
1.3
13
.01
2.0
12
.71
5.4
15
.01
6.3
17
.71
9.4
19
.12
3.5
29
.2
Ma
le1
52
.51
70
.31
46
.41
50
.51
47
.61
53
.91
70
.51
71
.41
77
.11
74
.61
67
.11
79
.12
02
.32
09
.02
02
.62
33
.62
63
.72
71
.63
29
.43
53
.6
Not
e: A
rres
t rat
es a
re a
rres
ts p
er 1
00,0
00 m
ales
or
fem
ales
age
s 10
–17,
bas
ed o
n da
ta p
ublis
hed
by th
e F
BI.
FB
I arr
est r
ates
, whi
ch u
se a
bas
e po
pula
tion
of y
outh
und
er a
ge 1
8, h
ave
been
reca
lcul
ated
with
a b
ase
of y
outh
age
s 10
–17.
See
How
ard
Sny
der
in
Arr
est
s o
f Y
ou
th 1
99
0, OJJ
DP
Upd
ate
on S
tatis
tics.
24
Pro
pert
y C
rim
e Index
Ye
ar
19
73
19
74
19
75
19
76
19
77
19
78
19
79
19
80
19
81
19
82
19
83
19
84
19
85
19
86
19
87
19
88
19
89
19
90
19
91
19
92
Fe
ma
le8
91
.61
14
3.5
10
89
.91
03
4.9
10
75
.31
08
2.7
10
68
.31
00
5.3
97
6.9
97
8.0
95
5.8
96
0.7
10
43
.81
04
9.5
10
97
.91
04
7.2
10
64
.81
17
7.4
12
17
.41
15
4.7
Ma
le3
76
8.1
46
70
.04
46
3.1
42
63
.04
28
4.0
44
03
.04
36
7.8
42
34
.24
03
1.4
39
08
.73
68
0.4
35
93
.43
82
6.4
39
31
.23
93
3.6
39
25
.33
94
3.0
40
45
.24
05
2.1
37
46
.1
Burg
lary
Ye
ar
19
73
19
74
19
75
19
76
19
77
19
78
19
79
19
80
19
81
19
82
19
83
19
84
19
85
19
86
19
87
19
88
19
89
19
90
19
91
19
92
Fe
ma
le7
5.4
94
.89
9.4
93
.91
04
.41
08
.81
13
.81
07
.51
01
.39
8.1
88
.58
6.2
89
.79
0.4
87
.28
0.5
84
.88
7.4
91
.38
9.3
Ma
le1
35
4.1
16
48
.51
68
3.1
15
52
.41
56
0.7
16
23
.71
54
0.8
14
98
.51
42
0.8
13
26
.31
17
7.2
10
63
.81
11
0.5
10
75
.61
04
0.7
95
2.0
93
6.0
95
1.7
94
2.4
88
8.7
Larc
eny—
Theft
Ye
ar
19
73
19
74
19
75
19
76
19
77
19
78
19
79
19
80
19
81
19
82
19
83
19
84
19
85
19
86
19
87
19
88
19
89
19
90
19
91
19
92
Fe
ma
le7
75
.71
00
3.7
94
6.7
89
6.2
91
6.2
91
6.1
89
3.3
84
5.5
83
0.4
83
6.8
82
9.6
83
4.5
90
5.7
90
3.9
95
0.1
89
9.1
90
2.7
10
08
.21
04
1.4
98
0.1
Ma
le1
84
8.3
24
43
.42
27
7.4
22
16
.12
20
1.4
22
48
.22
30
8.3
22
91
.02
23
6.3
22
50
.22
19
8.9
22
08
.52
34
0.1
24
09
.12
40
0.6
23
96
.42
35
5.7
24
33
.42
46
4.3
22
65
.2
Moto
r V
ehic
le T
heft
Ye
ar
19
73
19
74
19
75
19
76
19
77
19
78
19
79
19
80
19
81
19
82
19
83
19
84
19
85
19
86
19
87
19
88
19
89
19
90
19
91
19
92
Fe
ma
le3
5.6
39
.13
8.2
39
.44
9.3
51
.85
4.8
46
.03
9.6
36
.73
2.4
34
.94
2.7
49
.55
5.2
61
.87
1.4
75
.97
8.6
78
.5
Ma
le5
16
.55
23
.84
50
.44
41
.04
70
.04
76
.34
60
.63
91
.83
20
.02
86
.52
58
.22
71
.93
24
.73
98
.54
45
.55
24
.66
00
.06
06
.45
86
.45
35
.6
Ars
on
Ye
ar
19
73
19
74
19
75
19
76
19
77
19
78
19
79
19
80
19
81
19
82
19
83
19
84
19
85
19
86
19
87
19
88
19
89
19
90
19
91
19
92
Fe
ma
le4
.95
.95
.65
.45
.55
.96
.46
.25
.76
.45
.25
.15
.65
.75
.55
.85
.95
.96
.16
.8
Ma
le4
9.3
54
.35
2.2
53
.55
1.8
54
.75
8.1
52
.85
4.2
45
.64
6.1
49
.25
1.0
47
.94
6.9
52
.35
1.3
53
.75
9.1
56
.6
Dru
gs
Ye
ar
19
73
19
74
19
75
19
76
19
77
19
78
19
79
19
80
19
81
19
82
19
83
19
84
19
85
19
86
19
87
19
88
19
89
19
90
19
91
19
92
Fe
ma
le1
97
.72
16
.31
66
.11
62
.21
60
.61
67
.81
40
.01
30
.41
19
.11
06
.09
7.7
93
.91
02
.58
8.6
88
.89
3.3
97
.16
9.5
64
.26
9.6
Ma
le8
65
.21
00
1.6
80
5.2
80
0.9
78
5.9
80
8.2
68
2.2
62
7.0
59
6.8
52
4.9
48
2.9
50
8.4
57
1.6
51
7.0
56
1.8
63
2.4
71
2.0
53
0.0
50
4.5
56
4.6
Not
e: A
rres
t rat
es a
re a
rres
ts p
er 1
00,0
00 m
ales
or
fem
ales
age
s 10
–17,
bas
ed o
n da
ta p
ublis
hed
by th
e F
BI.
FB
I arr
est r
ates
, whi
ch u
se a
bas
e po
pula
tion
of y
outh
und
er a
ge 1
8, h
ave
been
reca
lcul
ated
with
a b
ase
of y
outh
age
s 10
–17.
See
How
ard
Sny
der
in
Arr
est
s o
f Y
ou
th 1
99
0, OJJ
DP
Upd
ate
on S
tatis
tics.
Data
Table
1:
conti
nued

25
Violent Crimes Index Property Crimes Index
Female Male Female Male
Ages 1983 1992 1983 1992 1983 1992 1983 1992
13–14 65.5 144.8 400.2 681.3 1071.5 1443.2 3560.2 4008.9
15 110.5 214.1 783.1 1210.3 1456.0 1829.3 5298.7 5780.8
16 119.5 217.4 1037.1 1620.6 1413.5 1858.2 5813.5 6272.7
17 114.8 195.3 1196.1 1757.2 1293.4 1639.6 5905.4 5741.5
18 119.3 196.6 1231.3 1943.9 1145.2 1471.1 5214.7 5491.7
19 127.5 182.5 1183.7 1697.7 1019.6 1200.7 4347.9 4130.2
20 127.5 178.0 1138.4 1499.7 939.6 1005.9 3569.5 3241.1
21 126.5 183.8 1102.8 1441.1 841.4 919.9 3104.3 2793.9
22 121.8 185.0 1045.2 1384.8 772.3 885.1 2678.6 2465.5
23 120.9 189.1 987.0 1304.7 718.2 863.2 2406.5 2280.1
24 115.9 188.2 929.8 1263.0 689.8 882.1 2183.7 2193.6
25–29 101.5 171.8 785.0 1071.6 585.7 740.7 1794.4 1905.2
30–34 71.1 137.7 567.6 810.8 419.0 588.5 1265.9 1541.6
35–39 51.0 94.8 407.1 575.0 295.7 426.4 816.3 1154.5
40–44 39.6 51.5 302.5 374.8 243.6 275.3 596.1 757.9
45–49 29.2 32.8 214.8 247.3 196.7 190.5 441.0 451.8
50–54 16.9 21.1 148.7 172.5 164.0 144.5 336.9 300.7
55–59 10.4 12.1 97.1 112.7 123.7 107.0 242.0 200.0
60–64 6.2 6.1 66.0 71.8 93.9 82.6 173.8 140.6
Note: Arrest rates are arrests per 100,000 population in each group.
Data Source: Federal Bureau of Investigation. Age-Specific and Race-Specific Arrest Rates for Selected Offenses1965–1992.
Data Table 2: Arrest Rates by Sex and Age, 1983 and 1992


○ ○ ○ ○ ○ ○ ○ ○ ○ ○ ○ ○ ○ ○ ○ ○ ○ ○ ○ ○ ○ ○ ○ ○ ○ ○ ○ ○ ○ ○ ○ ○ ○ ○ ○ ○ ○ ○ ○ ○ ○ ○ ○ ○ ○ ○ ○ ○ ○ ○ ○ ○ ○ ○ ○ ○ ○ ○ ○ ○ ○ ○ ○ ○
HOW TO SUBSCRIBE TO
JUVJUSTThe Office of Juvenile Justice and Delinquency Prevention and the NationalCriminal Justice Reference Service are pleased to announce JUVJUST, our newestservice for the juvenile justice professional. JUVJUST is an electronic mailing listthat will allow you to receive timely and informative juvenile justice informationdirectly from OJJDP.
Although there is no cost to participate in JUVJUST, users must have access toInternet e-mail. Please take a moment and subscribe to this service by followingthese steps:
◆ Send an e-mail message to [email protected]
◆ Leave the subject line blank
◆ In the body of the message, type:subscribe juvjust [your name]
If you need technical assistance, please e-mail: [email protected]
○ ○ ○ ○ ○ ○ ○ ○ ○ ○ ○ ○ ○ ○ ○ ○ ○ ○ ○ ○ ○ ○ ○ ○ ○ ○ ○ ○ ○ ○ ○ ○ ○ ○ ○ ○ ○ ○ ○ ○ ○ ○ ○ ○ ○ ○ ○ ○ ○ ○ ○ ○ ○ ○ ○ ○ ○ ○ ○ ○ ○ ○ ○ ○
ONLINE


Publications From OJJDPDelinquency PreventionCombating Violence and Delinquency: TheNational Juvenile Justice Action Plan. 1996,NCJ 157105 (36 pp.).Combating Violence and Delinquency: TheNational Juvenile Justice Action Plan (FullReport). 1996, NCJ 157106 (200 pp.).Delinquency Prevention Works. 1995,NCJ 155006 (74 pp.).Family Life, Delinquency, and Crime: APolicymaker’s Guide. 1994, NCJ 140517(65 pp.).Family Strengthening in PreventingDelinquency—A Literature Review. 1994,NCJ 150222 (76 pp.), $13.00.Matrix of Community-Based Initiatives. 1995,NCJ 154816 (51 pp.).Strengthening America’s Families: PromisingParenting Strategies for Delinquency Preven-tion. 1993, NCJ 140781 (105 pp.), $9.15.What Works: Promising Interventions inJuvenile Justice. 1994, NCJ 150858(248 pp.), $19.00.
Missing and Exploited ChildrenAddressing Confidentiality of Records inSearches for Missing Children (Full Report).1995, NCJ 155183 (284 pp.), $15.00.The Compendium of the North AmericanSymposium on International Child Abduction:How To Handle International Child AbductionCases. 1993, NCJ 148137 (928 pp.), $17.50.Missing, Abducted, Runaway, andThrownaway Children in America, FirstReport: Numbers and Characteristics,National Incidence Studies (Full Report).1990, NCJ 123668 (251 pp.), $14.40.Obstacles to the Recovery and Return ofParentally Abducted Children. 1994,NCJ 143458 (21 pp.).Obstacles to the Recovery and Return ofParentally Abducted Children (Full Report).1993, NCJ 144535 (877 pp.), $22.80.Parental Abductors: Four Interviews (Video).1993, NCJ 147866 (43 min.), $12.50.Using Agency Records to Find MissingChildren: A Guide for Law Enforcement.1995, NCJ 154633 (20 pp.).
Status OffendersCurfew: An Answer to Juvenile Delinquencyand Victimization? 1996, NCJ 159533(11 pp.).Unlocking the Doors for Status Offenders:The State of the States. 1995, NCJ 160803(85 pp.), $16.50.
Law EnforcementLaw Enforcement Custody of Juveniles(Video). 1992, NCJ 137387 (31 min.),$13.50.Law Enforcement Policies and PracticesRegarding Missing Children and HomelessYouth. 1993, NCJ 145644 (25 pp.).Law Enforcement Policies and PracticesRegarding Missing Children and HomelessYouth (Full Report). 1993, NCJ 143397(217 pp.), $13.00.
CourtsThe Child Victim as a Witness, ResearchReport. 1994, NCJ 149172 (143 pp.).Helping Victims and Witnesses in the Juve-nile Justice System: A Program Handbook.1991, NCJ 139731 (282 pp.), $15.00.How Juveniles Get to Criminal Court. 1994,NCJ 150309 (5 pp.).
Juvenile Court Statistics 1993. 1996, NCJ159535 (98 pp.).Offenders in Juvenile Court, 1993. 1996,NCJ 160945 (12 pp.).
GangsGang Suppression and Intervention:An Assessment (Full Report). 1994,NCJ 146494 (197 pp.), $15.00.Gang Suppression and Intervention:Community Models. 1994, NCJ 148202(26 pp.).Gang Suppression and Intervention: Problemand Response. 1994, NCJ 149629 (21 pp.).Rising Above Gangs and Drugs: How ToStart a Community Reclamation Project.1995, NCJ 133522 (264 pp.).
CorrectionsAmerican Probation and Parole Association’sDrug Testing Guidelines and Practices forJuvenile Probation and Parole Agencies.1992, NCJ 136450 (163 pp.).Conditions of Confinement: JuvenileDetention and Corrections Facilities. 1994,NCJ 141873 (16 pp.).Desktop Guide to Good Juvenile ProbationPractice. 1991, NCJ 128218 (141 pp.).Effective Practices in Juvenile CorrectionalEducation: A Study of the Literature andResearch 1980–1992. 1994, NCJ 150066(194 pp.), $15.00.Improving Literacy Skills of JuvenileDetainees. 1994, NCJ 150707 (5 pp.).Intensive Aftercare for High-Risk Juveniles:An Assessment (Full Report). 1994,NCJ 144018 (195 pp.), $15.00.Intensive Aftercare for High-Risk Juveniles:A Community Care Model. 1994, NCJ147575 (20 pp.).Intensive Aftercare for High-Risk Juveniles:Policies and Procedures. 1994, NCJ 147712(28 pp.).Juvenile Correctional Education: A Time forChange. 1994, NCJ 150309 (3 pp.).Juvenile Detention Training Needs Assess-ment. 1996, NCJ 156833 (60 pp.).Juvenile Intensive Supervision: An Assess-ment (Full Report). 1994, NCJ 150064(89 pp.), $13.00.Juvenile Intensive Supervision: PlanningGuide. 1994, NCJ 150065 (80 pp.).Juvenile Probation: The Workhorse of theJuvenile Justice System. 1996, NCJ 158534(5 pp.).Juveniles Taken Into Custody: Fiscal Year1993 Report. 1995, NCJ 154022 (195 pp.).National Survey of Reading Programs forIncarcerated Juvenile Offenders. 1993,NCJ 144017 (51 pp.), $6.75.OJJDP: Conditions of Confinement Tele-conference (Video). 1993, NCJ 147531(90 min.), $14.00.A Resource Manual for Juvenile Detentionand Corrections: Effective and InnovativePrograms. 1995, NCJ 155285 (164 pp.),$15.00.
General Juvenile JusticeBalanced and Restorative Justice. 1994,NCJ 149727 (16 pp.).Breaking the Code (Video). 1993,NCJ 146604 (83 min.), $20.65.Bridging the Child Welfare and JuvenileJustice Systems. 1995, NCJ 152155 (4 pp.).
Guide for Implementing the ComprehensiveStrategy for Serious, Violent, and ChronicJuvenile Offenders. 1995, NCJ 153571(6 pp.).Innovative Community Partnerships: WorkingTogether for Change. 1994, NCJ 146483(32 pp.).Juvenile Justice, Volume II, Number 2. 1995,NCJ 152979 (30 pp.).Juvenile Offenders and Victims: 1996 Updateon Violence. 1996, NCJ 159107 (32 pp.).Juvenile Offenders and Victims: A NationalReport (Full Report). 1995, NCJ 153569(188 pp.).Law-Related Education for Juvenile JusticeSettings. 1993, NCJ 147063 (173 pp.),$13.20.Minorities and the Juvenile Justice System.1993, NCJ 145849 (18 pp.).Minorities and the Juvenile Justice System(Full Report). 1993, NCJ 139556 (176 pp.),$11.50.Reducing Youth Gun Violence: An Overviewof Programs and Initiatives. 1996,NCJ 154303 (74 pp.).Study of Tribal and Alaska Native JuvenileJustice Systems. 1992, NCJ 148217(208 pp.), $17.20.Title V Incentive Grants for Local Delin-quency Prevention Programs. 1996,NCJ 160942 (100 pp.).Urban Delinquency and Substance Abuse:Initial Findings. 1994, NCJ 143454 (27 pp.).Urban Delinquency and Substance Abuse:Technical Report and Appendices. 1993,NCJ 146416 (400 pp.), $25.60.
Through OJJDP’s Clearinghouse, informa-tion, publications, and resources are as closeas your phone, fax, computer, or mail box.Phone:800–638–8736(Monday–Friday, 8:30 a.m.–7:00 p.m. ET)Fax:301–251–5212Fax-on-Demand:800–638–8736, select option 1 for automatedordering services, select option 2 for Fax-on-Demand instructionsOnline:Bulletin Board:301–738–8895(modem set at 9600 baud and 8–N–1)NCJRS World Wide Web:http://www.ncjrs.orgOJJDP Home Page:http://www.ncjrs.org/ojjhome.htmlFile Transfer Protocol (FTP):ftp://ncjrs.org.pub/ncjrsE-mail:[email protected] Mailing List:e-mail to [email protected], typesubscribe juvjust (your name)JUSTINFO Newsletter:e-mail to [email protected], typesubscribe justinfo (your name)Mail:Juvenile Justice Clearinghouse/NCJRS, P.O.Box 6000, Rockville, MD 20849–6000Visit:Juvenile Justice Clearinghouse/NCJRS, 1600Research Boulevard, Rockville, MD 20850

NCJ 160941
Statistics Summary
BULK RATEPOSTAGE & FEES PAID
DOJ/OJJDPPermit No. G–91
U.S. Department of Justice
Office of Justice Programs
Office of Juvenile Justice and Delinquency Prevention
Washington, D.C. 20531
Official BusinessPenalty for Private Use $300