guardian bank annual...
TRANSCRIPT
GUARDIAN BANKANNUAL REPORT31ST DECEMBER 2016
Guardian Bank Limited (“the Bank” or “the company”)
is a company domiciled in Kenya. The consolidated
financial statements of the Bank as at 31 December
2016 comprise the Bank and its subsidiaries (together
referred to as the “Group” or “consolidated”).
GUARDIAN BANKANNUAL REPORT
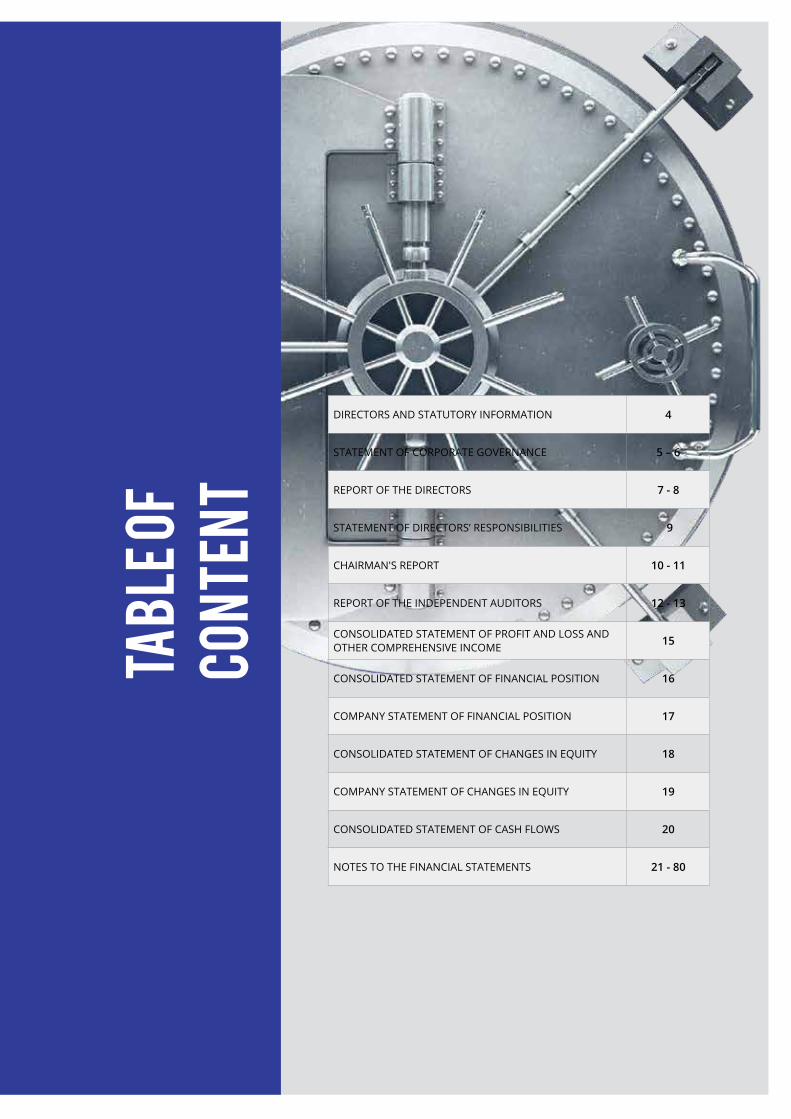
DIRECTORS AND STATUTORY INFORMATION 4
STATEMENT OF CORPORATE GOVERNANCE 5 – 6
REPORT OF THE DIRECTORS 7 - 8
STATEMENT OF DIRECTORS’ RESPONSIBILITIES 9
CHAIRMAN'S REPORT 10 - 11
REPORT OF THE INDEPENDENT AUDITORS 12 - 13
CONSOLIDATED STATEMENT OF PROFIT AND LOSS AND OTHER COMPREHENSIVE INCOME 15
CONSOLIDATED STATEMENT OF FINANCIAL POSITION 16
COMPANY STATEMENT OF FINANCIAL POSITION 17
CONSOLIDATED STATEMENT OF CHANGES IN EQUITY 18
COMPANY STATEMENT OF CHANGES IN EQUITY 19
CONSOLIDATED STATEMENT OF CASH FLOWS 20
NOTES TO THE FINANCIAL STATEMENTS 21 - 80
TABL
E OF
CONT
ENT
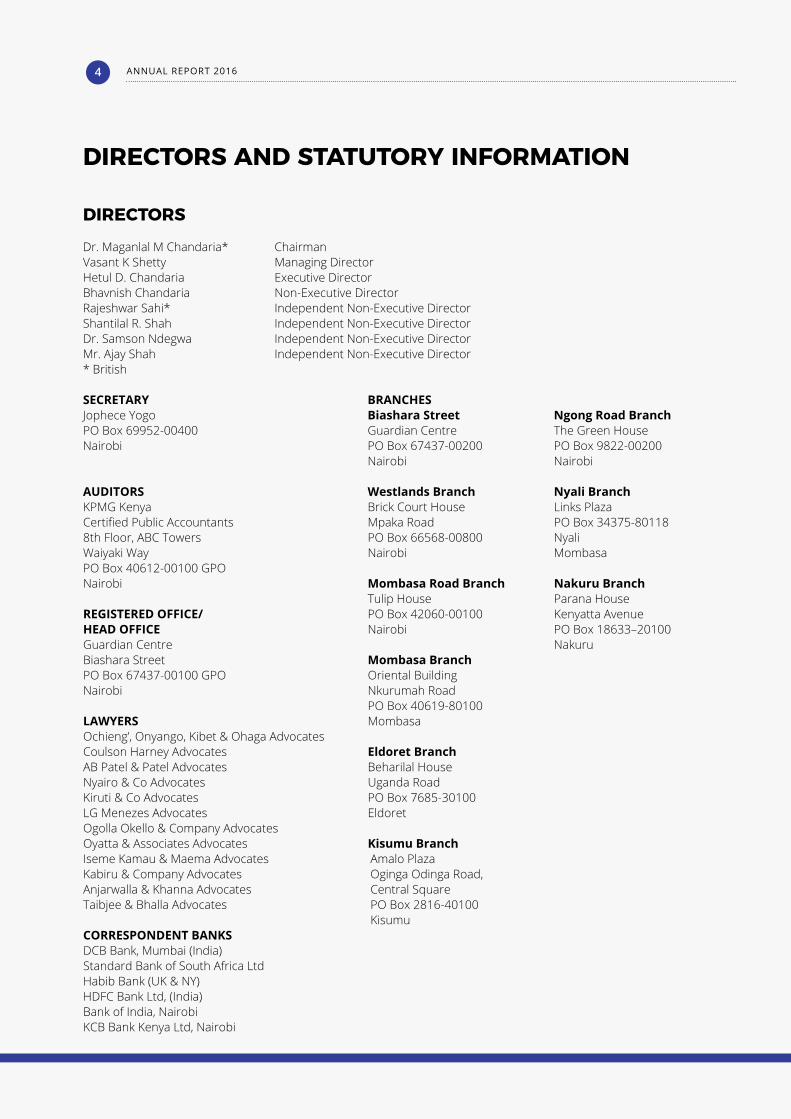
DIRECTORS AND STATUTORY INFORMATION
DIRECTORS
Dr. Maganlal M Chandaria* ChairmanVasant K Shetty Managing DirectorHetul D. Chandaria Executive DirectorBhavnish Chandaria Non-Executive Director Rajeshwar Sahi* Independent Non-Executive DirectorShantilal R. Shah Independent Non-Executive DirectorDr. Samson Ndegwa Independent Non-Executive DirectorMr. Ajay Shah Independent Non-Executive Director* British
SECRETARY BRANCHESJophece Yogo Biashara Street Ngong Road BranchPO Box 69952-00400 Guardian Centre The Green HouseNairobi PO Box 67437-00200 PO Box 9822-00200 Nairobi Nairobi
AUDITORS Westlands Branch Nyali BranchKPMG Kenya Brick Court House Links PlazaCertified Public Accountants Mpaka Road PO Box 34375-801188th Floor, ABC Towers PO Box 66568-00800 NyaliWaiyaki Way Nairobi MombasaPO Box 40612-00100 GPO Nairobi Mombasa Road Branch Nakuru Branch Tulip House Parana HouseREGISTERED OFFICE/ PO Box 42060-00100 Kenyatta AvenueHEAD OFFICE Nairobi PO Box 18633–20100Guardian Centre NakuruBiashara Street Mombasa Branch PO Box 67437-00100 GPO Oriental BuildingNairobi Nkurumah Road PO Box 40619-80100LAWYERS MombasaOchieng’, Onyango, Kibet & Ohaga Advocates Coulson Harney Advocates Eldoret BranchAB Patel & Patel Advocates Beharilal HouseNyairo & Co Advocates Uganda RoadKiruti & Co Advocates PO Box 7685-30100LG Menezes Advocates EldoretOgolla Okello & Company Advocates Oyatta & Associates Advocates Kisumu BranchIseme Kamau & Maema Advocates Amalo PlazaKabiru & Company Advocates Oginga Odinga Road,Anjarwalla & Khanna Advocates Central SquareTaibjee & Bhalla Advocates PO Box 2816-40100 Kisumu CORRESPONDENT BANKS DCB Bank, Mumbai (India) Standard Bank of South Africa Ltd Habib Bank (UK & NY) HDFC Bank Ltd, (India) Bank of India, Nairobi KCB Bank Kenya Ltd, Nairobi
ANNUAL REPORT 20164
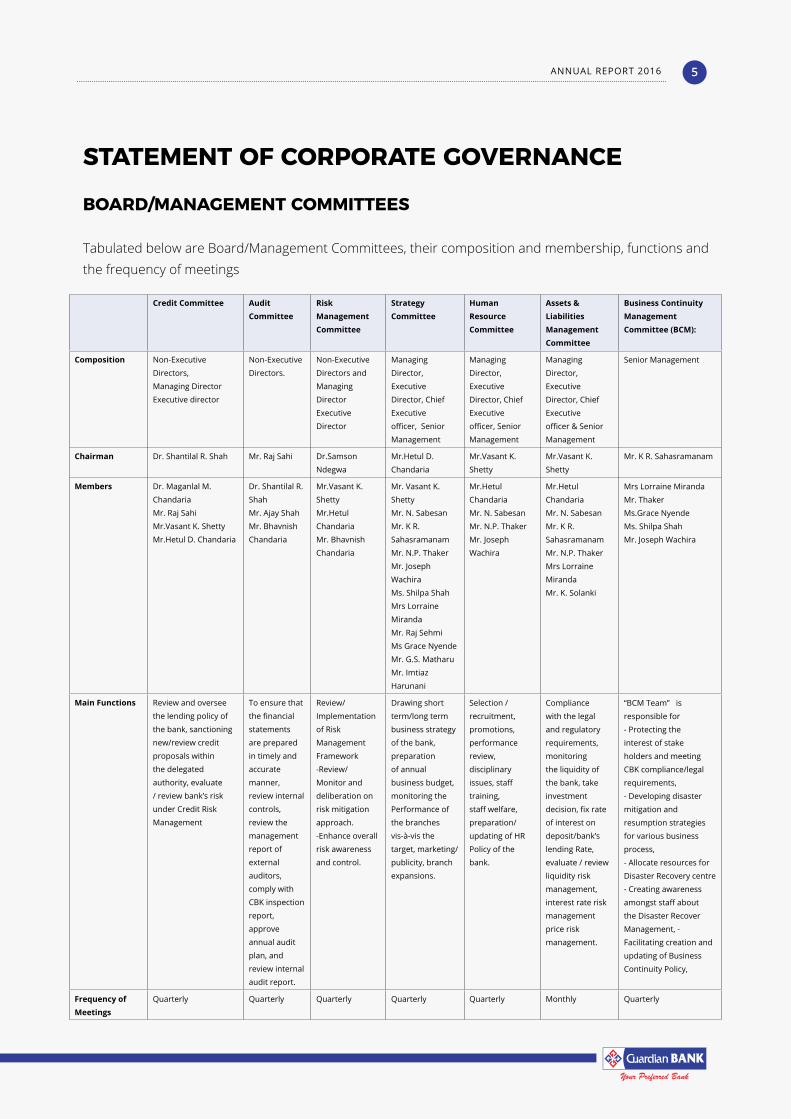
STATEMENT OF CORPORATE GOVERNANCE
BOARD/MANAGEMENT COMMITTEES
Tabulated below are Board/Management Committees, their composition and membership, functions and the frequency of meetings
Credit Committee Audit Committee
Risk Management Committee
Strategy Committee
Human Resource Committee
Assets & Liabilities Management Committee
Business Continuity Management Committee (BCM):
Composition Non-Executive
Directors,
Managing Director
Executive director
Non-Executive
Directors.
Non-Executive
Directors and
Managing
Director
Executive
Director
Managing
Director,
Executive
Director, Chief
Executive
officer, Senior
Management
Managing
Director,
Executive
Director, Chief
Executive
officer, Senior
Management
Managing
Director,
Executive
Director, Chief
Executive
officer & Senior
Management
Senior Management
Chairman Dr. Shantilal R. Shah Mr. Raj Sahi Dr.Samson
Ndegwa
Mr.Hetul D.
Chandaria
Mr.Vasant K.
Shetty
Mr.Vasant K.
Shetty
Mr. K R. Sahasramanam
Members Dr. Maganlal M.
Chandaria
Mr. Raj Sahi
Mr.Vasant K. Shetty
Mr.Hetul D. Chandaria
Dr. Shantilal R.
Shah
Mr. Ajay Shah
Mr. Bhavnish
Chandaria
Mr.Vasant K.
Shetty
Mr.Hetul
Chandaria
Mr. Bhavnish
Chandaria
Mr. Vasant K.
Shetty
Mr. N. Sabesan
Mr. K R.
Sahasramanam
Mr. N.P. Thaker
Mr. Joseph
Wachira
Ms. Shilpa Shah
Mrs Lorraine
Miranda
Mr. Raj Sehmi
Ms Grace Nyende
Mr. G.S. Matharu
Mr. Imtiaz
Harunani
Mr.Hetul
Chandaria
Mr. N. Sabesan
Mr. N.P. Thaker
Mr. Joseph
Wachira
Mr.Hetul
Chandaria
Mr. N. Sabesan
Mr. K R.
Sahasramanam
Mr. N.P. Thaker
Mrs Lorraine
Miranda
Mr. K. Solanki
Mrs Lorraine Miranda
Mr. Thaker
Ms.Grace Nyende
Ms. Shilpa Shah
Mr. Joseph Wachira
Main Functions Review and oversee
the lending policy of
the bank, sanctioning
new/review credit
proposals within
the delegated
authority, evaluate
/ review bank’s risk
under Credit Risk
Management
To ensure that
the financial
statements
are prepared
in timely and
accurate
manner,
review internal
controls,
review the
management
report of
external
auditors,
comply with
CBK inspection
report,
approve
annual audit
plan, and
review internal
audit report.
Review/
Implementation
of Risk
Management
Framework
-Review/
Monitor and
deliberation on
risk mitigation
approach.
-Enhance overall
risk awareness
and control.
Drawing short
term/long term
business strategy
of the bank,
preparation
of annual
business budget,
monitoring the
Performance of
the branches
vis-à-vis the
target, marketing/
publicity, branch
expansions.
Selection /
recruitment,
promotions,
performance
review,
disciplinary
issues, staff
training,
staff welfare,
preparation/
updating of HR
Policy of the
bank.
Compliance
with the legal
and regulatory
requirements,
monitoring
the liquidity of
the bank, take
investment
decision, fix rate
of interest on
deposit/bank’s
lending Rate,
evaluate / review
liquidity risk
management,
interest rate risk
management
price risk
management.
“BCM Team” is
responsible for
- Protecting the
interest of stake
holders and meeting
CBK compliance/legal
requirements,
- Developing disaster
mitigation and
resumption strategies
for various business
process,
- Allocate resources for
Disaster Recovery centre
- Creating awareness
amongst staff about
the Disaster Recover
Management, -
Facilitating creation and
updating of Business
Continuity Policy,
Frequency of Meetings
Quarterly Quarterly Quarterly Quarterly Quarterly Monthly Quarterly
ANNUAL REPORT 2016 5
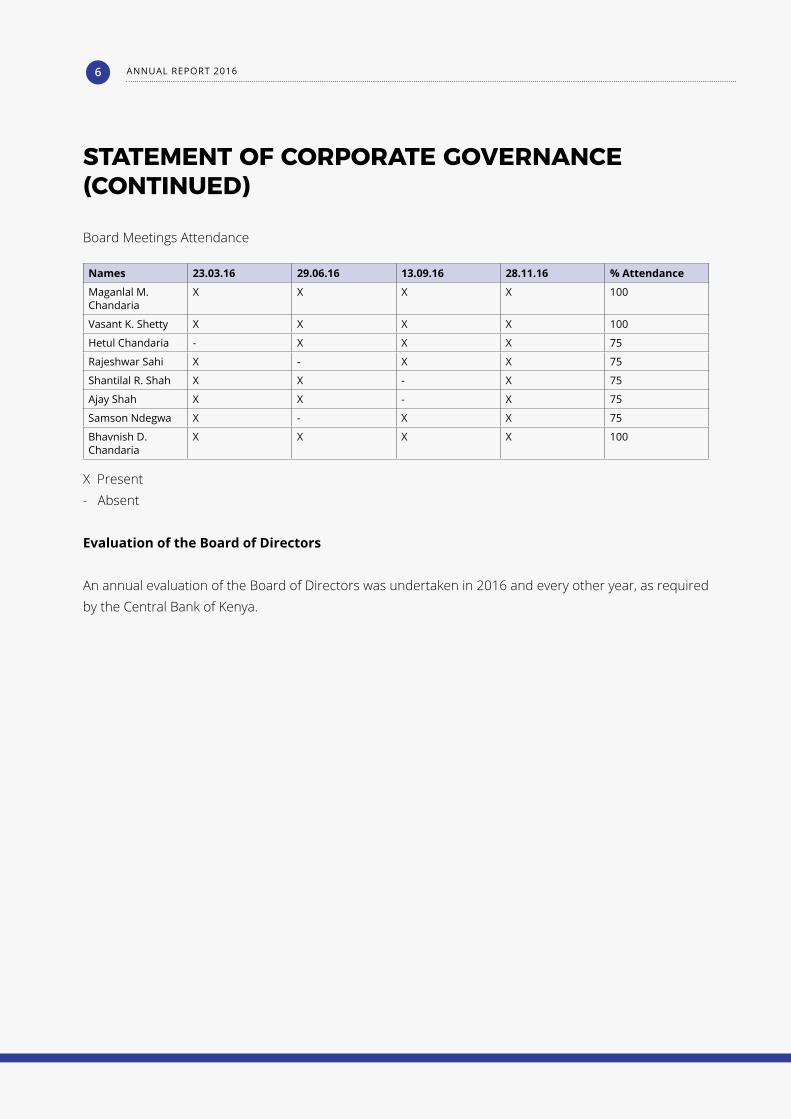
STATEMENT OF CORPORATE GOVERNANCE(CONTINUED)
Board Meetings Attendance
X Present- Absent
Evaluation of the Board of Directors
An annual evaluation of the Board of Directors was undertaken in 2016 and every other year, as required by the Central Bank of Kenya.
Names 23.03.16 29.06.16 13.09.16 28.11.16 % Attendance
Maganlal M. Chandaria
X X X X 100
Vasant K. Shetty X X X X 100
Hetul Chandaria - X X X 75
Rajeshwar Sahi X - X X 75
Shantilal R. Shah X X - X 75
Ajay Shah X X - X 75
Samson Ndegwa X - X X 75
Bhavnish D. Chandaria
X X X X 100
ANNUAL REPORT 20166
REPORT OF THE DIRECTORSFOR THE YEAR ENDED 31 DECEMBER 2016
The directors have pleasure in submitting their report together with the audited financial statements for the year ended 31 December 2016 which disclose the state of affairs of the Group and Company, in accordance with Section 22 of the Banking Act and the Kenyan Companies Act, 2015.
1. ACTIVITIES The company is licensed to operate as a bank under the Banking Act.
2. RESULTS The results for the year are set out on page 15.
3. DIVIDEND The directors do not recommend the payment of a dividend (2015 – Nil).
4. DIRECTORS The directors who served during the year and up to the date of this report are set out on page 4.
During the year 2016, there were 4 (2015 – 4) scheduled board meetings and the attendance by the directors is as tabulated on page 6.
Evaluation of board of directors was suitably carried out as required by Central Bank of Kenya regulations.
5. BUSINESS OVERVIEW Performance Despite various challenges and uncertainties, more particularly confidence crisis in the banking
industry, which has led to movement of large volume of deposit from the private sector banks to bigger banks, Guardian Bank has performed fairly well.
Risk management Bank has managed the risk associated with various segments fairly well by maintaining various
business ratios above the statutory requirements. The Bank is committed to maintain a sustainable business growth and focus strongly on exemplary operational risk management and the concept of zero tolerance towards regulatory breaches. The Bank’s approach to risk management, including financial risk management objectives and policies and information on the Bank’s exposure to credit, liquidity, market and operational risk, is discussed on pages 42 to 61 of the financials.
ANNUAL REPORT 2016 7
Post Balance Events There has been no significant events between the year end and the date of approval of these
accounts which would require a change to or disclosure in the accounts.
Outlook The year 2017 is expected to be a tough year globally. There will be a range of uncertainties in the
external environment including those related to general elections in the Republic of Kenya and the interest rate capping. The bank will continue to deliver on its strategic agenda and live up to the expectations of the various stakeholders, its customers, staff, investors, regulators and the society.
6. RELEVANT AUDIT INFORMATION The Directors in office at the date of this report confirm that:
(i) There is no relevant audit information of which the Group’s auditor is unaware; and
(ii) Each director has taken all the steps that they ought to have taken as a director so as to be aware of any relevant audit information and to establish that the Group’s auditor is aware of that information.
7. AUDITORS The auditors, KPMG Kenya, continue in office in accordance with Section 719(2) of the Kenyan
Companies Act, 2015 and subject to Section 24(1) of the Banking Act (Cap. 488).
8. APPROVAL OF FINANCIAL STATEMENTS The financial statements were approved by the Board of Directors on 28th March 2017
BY ORDER OF THE BOARD
Jophece Yogo Secretary
Date: 28th March 2017
ANNUAL REPORT 20168
The Directors are responsible for the preparation and fair presentation of the consolidated financial statements of Guardian Bank Limited set out on pages 15 to 80 which comprise the statements of financial position of the Group and the Company at 31 December 2016, the Group’s statement of
profit and loss and other comprehensive income, the Group and Company statement of changes in equity and the Group statement of cash flows for the year then ended, and the notes to the financial statements, which include a summary of significant accounting policies and other explanatory information.
The Directors’ responsibilities include: determining that the basis of accounting described in Note 2 is an acceptable basis for preparing and fairly presenting the financial statements in the circumstances, preparation and presentation of financial statements in accordance with International Financial Reporting Standards and in the manner required by the Kenyan Companies Act, 2015 and for such internal control as the Directors determine is necessary to enable the preparation of financial statements that are free from material misstatements, whether due to fraud or error.
Under the Kenyan Companies Act, 2015 the Directors are required to prepare financial statements for each financial year which give a true and fair view of the state of affairs of the Group and the Company as at the end of the financial year and of the operating results of the Group and the Company for that year. It also requires the Directors to ensure the Company keeps proper accounting records which disclose with reasonable accuracy the financial position of the Group and the Company.The Directors accept responsibility for the annual financial statements, which have been prepared using appropriate accounting policies supported by reasonable and prudent judgements and estimates, in conformity with International Financial Reporting Standards and in the manner required by the Kenyan Companies Act, 2015. The Directors are of the opinion that the financial statements give a true and fair view of the state of the financial affairs of the Group and the Company and of the Group’s operating results.
The Directors further accept responsibility for the maintenance of accounting records which may be relied upon in the preparation of financial statements, as well as adequate systems of internal financial control.
The Directors have made an assessment of the Group’s ability to continue as a going concern and have no reason to believe the Group and its subsidiaries will not be a going concern for at least the next twelve months from the date of this statement.
Approval of the financial statementsThe financial statements, as indicated above, were approved by the Board of Directors on 28th March 2017 and were signed on its behalf by:
Director Director DirectorVasant K Shetty Hetul D. Chandaria Samson Ndegwa
STATEMENT OF DIRECTORS’ RESPONSIBILITIES
ANNUAL REPORT 2016 9
I am privileged to present the Annual Report and the Financial Statements of Guardian Bank for the financial year ending 31 December 2016.
The Banking Industry faced many challenges during the financial year 2016. The Parliament passed Banking Amendment Act 2015 (capping of interest rate on advances and deposit) and the same was assented by His Excellency President Uhuru Kenyatta. The said Act became effective from 14th September 2016. With the implementation of the Act, the spread between yield on advances and cost of deposit reduced considerably which had negative impact on the profitability of commercial Banks. Besides, failure of rain and other challenging business environment, there was a surge in the non-performing assets of the banks which resulted into substantial increase in the provisioning. Coupled with the same, the interest capping on advances
slowed down the credit expansion, particularly to sectors that are traditionally vulnerable to political and economic vagaries. On the other hand, tight liquidity had pushed the cost of deposit of the banks that had in turn increased the cost of operation. The net effect of these factors, banks were looking for areas for cost-cutting that included reducing their man power and closure of Branches that are uneconomical to operate.
Central Bank of Kenya has put in place stricter measures by seeking management Information Reports at regular intervals to ensure that Corporate Governance principles are adhered to by the banks so that the health of the Banks remain robust and any slip up in the health of the Banks is identified without delay. This made the banks to be more focused on quality of doing business while engaged in increasing the volume of business.
Guardian Bank had performed reasonably well in the background of what has been stated above. The Bank had not resorted to any of the harsh measures that some of the banks were implementing, especially closing down branches and retrenchment of staff. The Bank further implemented, in true spirit of the Act, the ‘Interest Capping Act’ with effect from 14th September 2016 and the benefit of interest capping, both for the lending and deposits, was passed on to even to the existing customers of the bank despite its adverse effect on the Bank’s profitability.
The total assets of the bank reached a level of Kshs. 14.705 billion as at 31 December 2016, an increase by Kshs. 96 mn over the previous year. The total deposit of the bank stood at Kshs. 12.313 billion whereas the gross advances of the bank reached Kshs. 9.636 billion; while the deposits increased marginally, the advances dropped from the level of the previous year. The Bank adopted a rigorous vetting process of Credit applications to safeguard against the prevailing economic conditions and also to avoid accounts slipping into the default category; it is a matter of record that the rate growth of Non-performing assets in the industry was high. But our Bank has been maintaining a very healthy credit portfolio. The net non-performing assets of the bank as at the date of balance sheet stood at Kshs. 151.685 mn which was 1.57% of the gross advances. This ratio is much lower than the industry level position.
The gross profit of the Bank as at 31 December 2016 stood at Kshs. 452.191 mn. The Bank has been strictly adhering to the prudential guidelines in classifying the advances and making provision in respect of non-performing assets. The net profit of the bank as at 31 December 2016, after making provision for
CHAIRMAN'S REPORT
ANNUAL REPORT 201610
taxation and non-performing assets stood at Kshs. 230.127 mn. as against Kshs. 229.330 mn. during the previous year. The shareholders of the bank have been ploughing back the net profit of the bank since the inception of the bank and the total retained earnings of the bank stood at Kshs. 1.699 billion; and the core capital was Kshs. 2.149 billion as at 31 December 2016, as against the statutory requirements of Kshs. 1.000 billion.
The Bank has been maintaining a very comfortable liquidity ratio and the same stood at 40.66% as against the statutory requirements of 20.0%. The total capital to total risk weighted assets {capital adequacy ratio} stood at 19.62% as against the statutory requirements of 14.50%
The Board of Directors of the bank consists of two Executive Directors, two Non-Executive Directors and four Independent Non-Executive Directors. The Board has established various board level and management level committees to guide the management and these committees meet regularly. All the Board level committees are chaired by Non-Executive Directors as per the prudential guidelines. Management has, with the approval of the Board put in place various policy documents and working guidelines for the operational staff to follow and comply .
The day to day affairs of the bank are managed by qualified, experienced and dynamic professional management. The Bank has also installed various software to monitor the daily transactions, more particularly large transactions and ensure strict compliance of ‘Know Your Customer’ guidelines and provisions of “Anti Money Laundering Act”.
The customer service extended at the branches is of very high standard. “Customer Service Committee’ is established at every branch and the committee meets on monthly basis to review the level of customer service. Meetings of such committee are attended by customers, randomly selected, who give valuable suggestions which are given consideration for implementation.
I would like to thank all my colleagues in the Board for the excellent co-operation and invaluable guidance / advice to the management from time to time for improving the performance of the bank. I also thank the team of KPMG Kenya, the Bank’s statutory Auditors, for carrying timely audit of the books of the bank and their continued support and guidance.
My sincere appreciation goes to the Governor, the officials of Central Bank of Kenya and the Ministry of Finance for their co-operation and valuable guidance from time to time. The dedicated team of the Bank is the back-bone for the progress of the Bank. I thank each and every member of “Guardian Family’ for their dedication, loyalty and hard work and request each one of them to continue to give their best in the development of the Bank’s business.
Thanking you
Dr. Maganlal M Chandaria.Chairman
ANNUAL REPORT 2016 11
REPORT OF THE INDEPENDENT AUDITORS TO THE MEMBERS OF GUARDIAN BANK LIMITED
REPORT ON THE AUDIT OF THE FINANCIAL STATEMENTS
OPINIONWe have audited the Group financial statements of Guardian Bank Limited (“the Group”) set out on pages 15 to 80 which comprise the Group and Company statement of financial position as at 31 December 2016, Group statement of profit and loss and other comprehensive income, Group and Company statement of changes in equity and Group statement of cash flows, for the year then ended, and a summary of significant accounting policies and other explanatory information.
In our opinion, the financial statements give a true and fair view of the Group and Company financial position at 31 December 2016, and the Group’s and Company’s financial performance and cash flows for the year then ended in accordance with International Financial Reporting Standards and the Kenyan Companies Act, 2015.
BASIS FOR OPINIONWe conducted our audit in accordance with International Standards on Auditing (ISAs). Our responsibilities under those standards are further described in the “Auditors’ Responsibilities for the Audit of the Financial Statements” section of our report. We are independent of the Group in accordance with the International Ethics Standards Board for Accountants’ Code of Ethics for Professional Accountants (IESBA Code) together with the ethical requirements that are relevant to our audit of the financial statements in Kenya. We have fulfilled our other ethical responsibilities in accordance with the IESBA Code and in accordance with other ethical requirements applicable to performing audits in Kenya. We believe that the audit evidence we have obtained is sufficient and appropriate to provide a basis for our opinion.
OTHER INFORMATION The Directors are responsible for the other information. The other information comprises the information included in the Annual Report and Financial Statements but does not include the financial statements and our auditors’ report thereon.
Our opinion on the financial statements does not cover the other information and we do not express any form of assurance conclusion thereon.
In connection with our audit of the financial statements, our responsibility is to read the other information and, in doing so, consider whether the other information is materially inconsistent with the financial statements or our knowledge obtained in the audit or otherwise appears to be materially misstated.
ANNUAL REPORT 201612
If, based on the work we have performed, we conclude that there is a material misstatement of this other information, then we are required to report that fact. We have nothing to report in this regard.
Responsibilities of directors for the financial statementsAs stated on page 9, the directors are responsible for the preparation and fair presentation of these financial statements in accordance with International Financial Reporting Standards (IFRSs) and in the manner required by the Kenyan Companies Act, 2015 and for such internal control as the Directors determine is necessary to enable the preparation of financial statements that are free from material misstatement, whether due to fraud or error.
In preparing the financial statements, directors are responsible for assessing the Group’s ability to continue as a going concern, disclosing, as applicable, matters related to going concern and using the going concern basis of accounting unless the directors either intend to liquidate the Group or to cease operations, or has no realistic alternative but to do so.
The directors are responsible for overseeing the Group’s financial reporting process.
Auditors’ responsibilities for the audit of the financial statementsOur objectives are to obtain reasonable assurance about whether the financial statements as a whole are free from material misstatement, whether due to fraud or error, and to issue an auditor’s report that includes our opinion. Reasonable assurance is a high level of assurance, but is not a guarantee that an audit conducted in accordance with ISAs will always detect a material misstatement when it exists. Misstatements can arise from fraud or error and are considered material if, individually or in the aggregate, they could reasonably be expected to influence the economic decisions of users taken on the basis of these financial statements.
As part of an audit in accordance with ISAs, we exercise professional judgment and maintain professional scepticism throughout the audit. We also:
• Identify and assess the risks of material misstatement of the financial statements, whether due to fraud or error, design and perform audit procedures responsive to those risks, and obtain audit evidence that is sufficient and appropriate to provide a basis for our opinion. The risk of not detecting a material misstatement resulting from fraud is higher than for one resulting from error, as fraud may involve collusion, forgery, intentional omissions, misrepresentations, or the override of internal control.
• Obtain an understanding of internal control relevant to the audit in order to design audit procedures that are appropriate in the circumstances, but not for the purpose of expressing an opinion on the effectiveness of the Group’s internal control.
ANNUAL REPORT 2016 13
• Evaluate the appropriateness of accounting policies used and the reasonableness of accounting estimates and related disclosures made by the Directors.
• Evaluate the overall presentation, structure and content of the financial statements, including the disclosures, and whether the financial statements represent the underlying transactions and events in a manner that achieves fair presentation.
• Conclude on the appropriateness of Directors’ use of the going concern basis of accounting and, based on the audit evidence obtained, whether a material uncertainty exists related to events or conditions that may cast significant doubt on the Group’s ability to continue as a going concern. If we conclude that a material uncertainty exists, we are required to draw attention in our auditor’s report to the related disclosures in the financial statements or, if such disclosures are inadequate, to modify our opinion. Our conclusions are based on the audit evidence obtained up to the date of our auditor’s report. However, future events or conditions may cause the Group to cease to continue as a going concern.
We communicate with those charged with governance regarding, among other matters, the planned scope and timing of the audit and significant audit findings, including any significant deficiencies in internal control that we identify during our audit.
Report on other legal and regulatory requirementsAs required by the Kenyan Companies Act, 2015 we report to you, based on our audit, that:
(i) We have obtained all the information and explanations, which to the best of our knowledge and belief were necessary for the purpose of our audit;
(ii) In our opinion, proper books of account have been kept by the Company, so far as appears from our examination of those books; and
(iii) The statement of financial position of the Company is in agreement with the books of account.
The Engagement Partner responsible for the audit resulting in this independent auditors’ report is CPA Alexander Mbai - P/2172.
Date: 28th March 2017
ANNUAL REPORT 201614
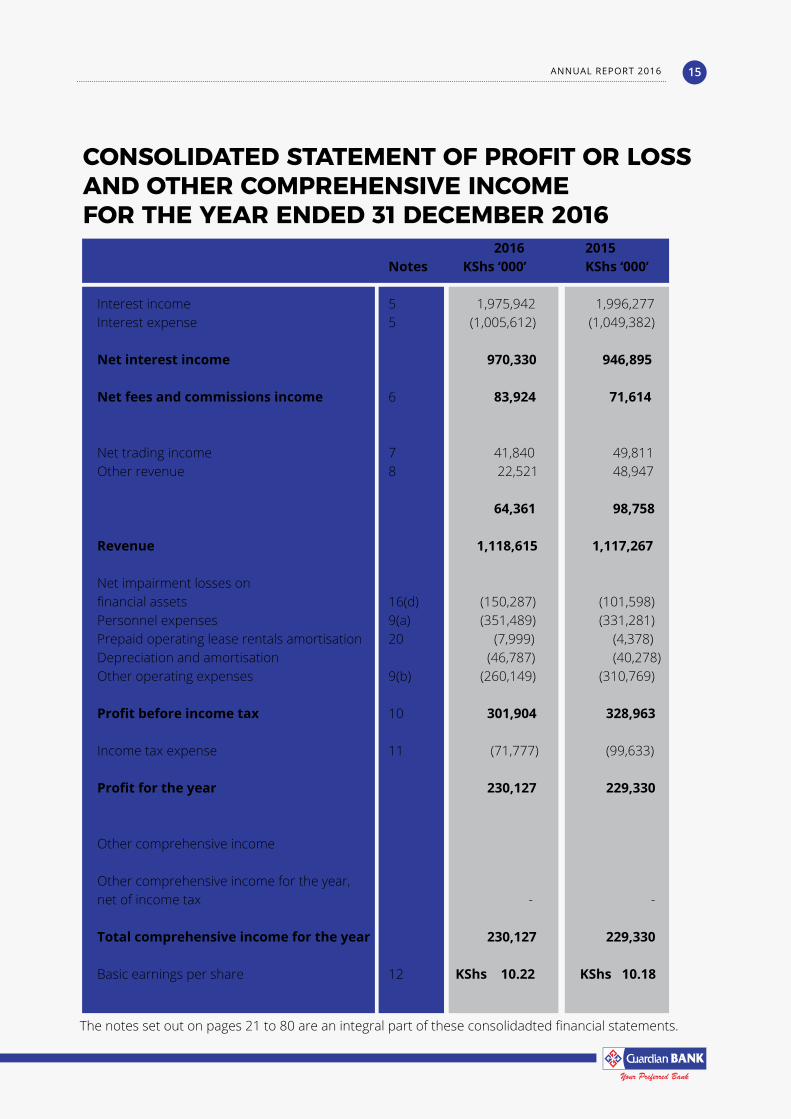
2016 2015 Notes KShs ‘000’ KShs ‘000’
Interest income 5 1,975,942 1,996,277 Interest expense 5 (1,005,612) (1,049,382)
Net interest income 970,330 946,895
Net fees and commissions income 6 83,924 71,614 Net trading income 7 41,840 49,811 Other revenue 8 22,521 48,947
64,361 98,758
Revenue 1,118,615 1,117,267
Net impairment losses on financial assets 16(d) (150,287) (101,598) Personnel expenses 9(a) (351,489) (331,281) Prepaid operating lease rentals amortisation 20 (7,999) (4,378) Depreciation and amortisation (46,787) (40,278) Other operating expenses 9(b) (260,149) (310,769)
Profit before income tax 10 301,904 328,963
Income tax expense 11 (71,777) (99,633)
Profit for the year 230,127 229,330 Other comprehensive income
Other comprehensive income for the year,net of income tax - -
Total comprehensive income for the year 230,127 229,330
Basic earnings per share 12 KShs 10.22 KShs 10.18
CONSOLIDATED STATEMENT OF PROFIT OR LOSSAND OTHER COMPREHENSIVE INCOMEFOR THE YEAR ENDED 31 DECEMBER 2016
The notes set out on pages 21 to 80 are an integral part of these consolidadted financial statements.
ANNUAL REPORT 2016 15
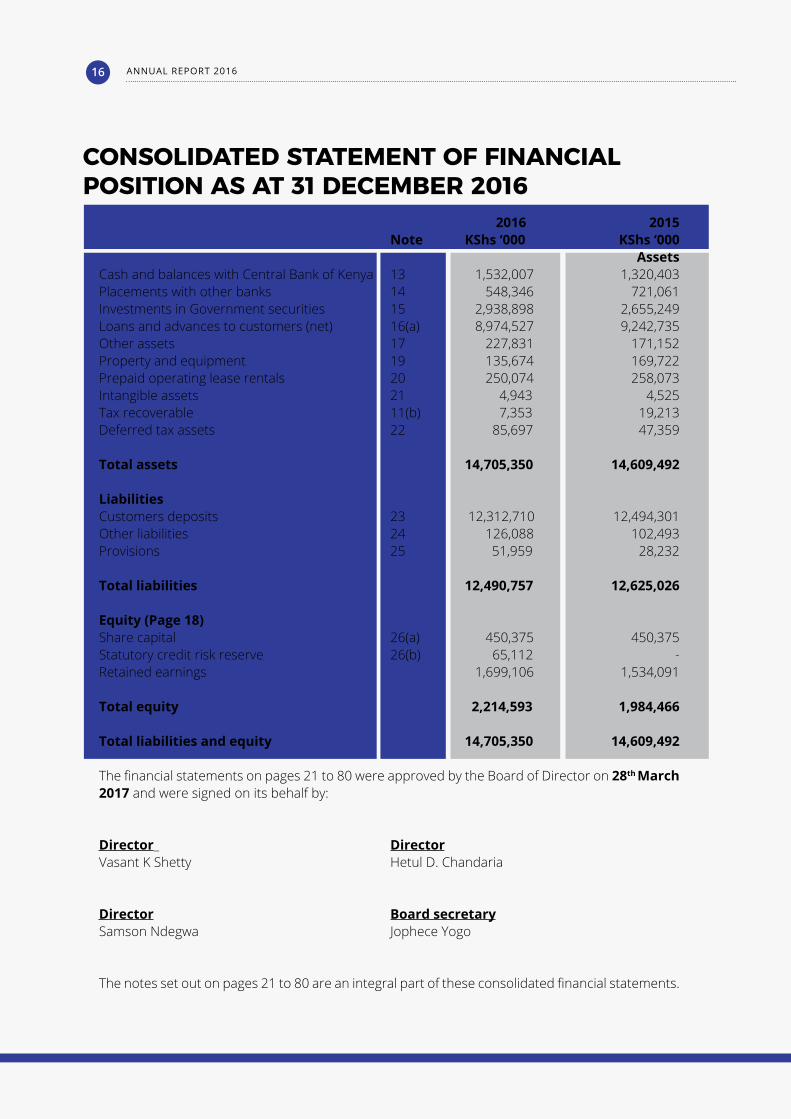
CONSOLIDATED STATEMENT OF FINANCIAL POSITION AS AT 31 DECEMBER 2016
2016 2015 Note KShs ‘000 KShs ‘000
AssetsCash and balances with Central Bank of Kenya 13 1,532,007 1,320,403 Placements with other banks 14 548,346 721,061 Investments in Government securities 15 2,938,898 2,655,249 Loans and advances to customers (net) 16(a) 8,974,527 9,242,735 Other assets 17 227,831 171,152 Property and equipment 19 135,674 169,722 Prepaid operating lease rentals 20 250,074 258,073 Intangible assets 21 4,943 4,525 Tax recoverable 11(b) 7,353 19,213 Deferred tax assets 22 85,697 47,359
Total assets 14,705,350 14,609,492
LiabilitiesCustomers deposits 23 12,312,710 12,494,301 Other liabilities 24 126,088 102,493 Provisions 25 51,959 28,232
Total liabilities 12,490,757 12,625,026
Equity (Page 18)Share capital 26(a) 450,375 450,375 Statutory credit risk reserve 26(b) 65,112 - Retained earnings 1,699,106 1,534,091
Total equity 2,214,593 1,984,466
Total liabilities and equity 14,705,350 14,609,492
The financial statements on pages 21 to 80 were approved by the Board of Director on 28th March 2017 and were signed on its behalf by:
Director_ DirectorVasant K Shetty Hetul D. Chandaria
Director Board secretarySamson Ndegwa Jophece Yogo
The notes set out on pages 21 to 80 are an integral part of these consolidated financial statements.
ANNUAL REPORT 201616
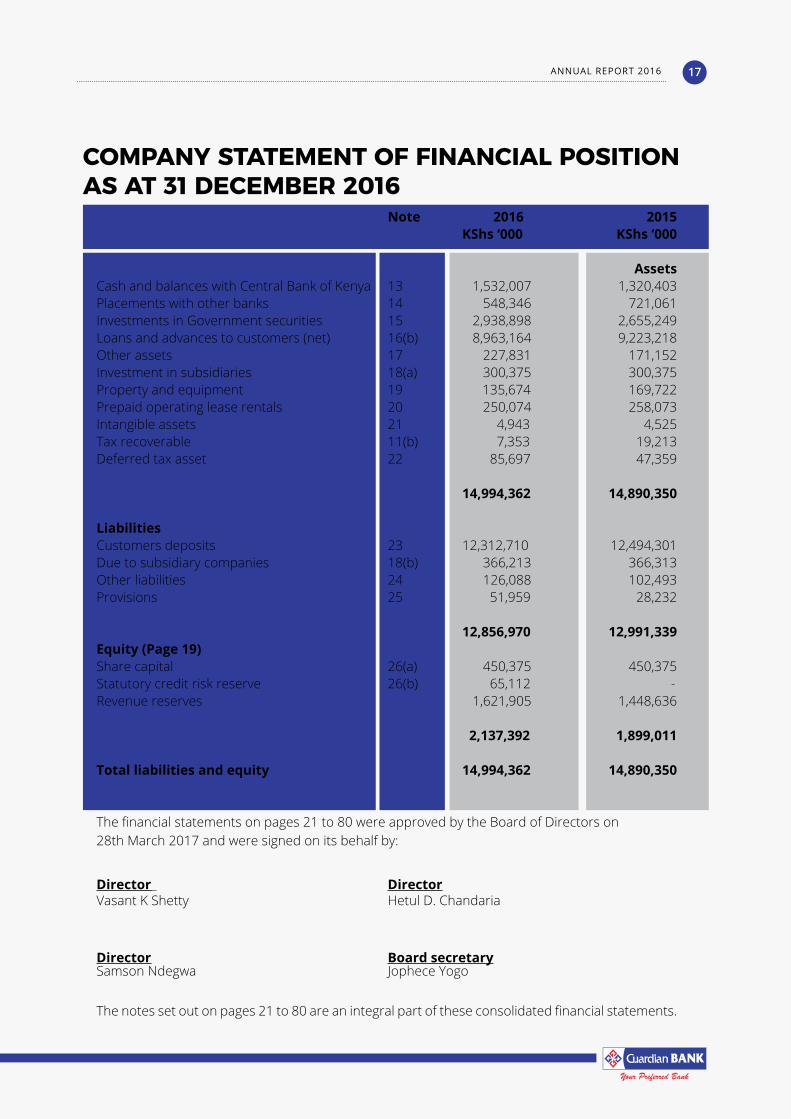
COMPANY STATEMENT OF FINANCIAL POSITION AS AT 31 DECEMBER 2016
Note 2016 2015 KShs ‘000 KShs ‘000
AssetsCash and balances with Central Bank of Kenya 13 1,532,007 1,320,403 Placements with other banks 14 548,346 721,061 Investments in Government securities 15 2,938,898 2,655,249 Loans and advances to customers (net) 16(b) 8,963,164 9,223,218 Other assets 17 227,831 171,152 Investment in subsidiaries 18(a) 300,375 300,375 Property and equipment 19 135,674 169,722Prepaid operating lease rentals 20 250,074 258,073Intangible assets 21 4,943 4,525 Tax recoverable 11(b) 7,353 19,213 Deferred tax asset 22 85,697 47,359 14,994,362 14,890,350
LiabilitiesCustomers deposits 23 12,312,710 12,494,301 Due to subsidiary companies 18(b) 366,213 366,313 Other liabilities 24 126,088 102,493 Provisions 25 51,959 28,232
12,856,970 12,991,339 Equity (Page 19)Share capital 26(a) 450,375 450,375 Statutory credit risk reserve 26(b) 65,112 - Revenue reserves 1,621,905 1,448,636 2,137,392 1,899,011
Total liabilities and equity 14,994,362 14,890,350
The financial statements on pages 21 to 80 were approved by the Board of Directors on28th March 2017 and were signed on its behalf by:
Director_ DirectorVasant K Shetty Hetul D. Chandaria
Director Board secretarySamson Ndegwa Jophece Yogo
The notes set out on pages 21 to 80 are an integral part of these consolidated financial statements.
ANNUAL REPORT 2016 17
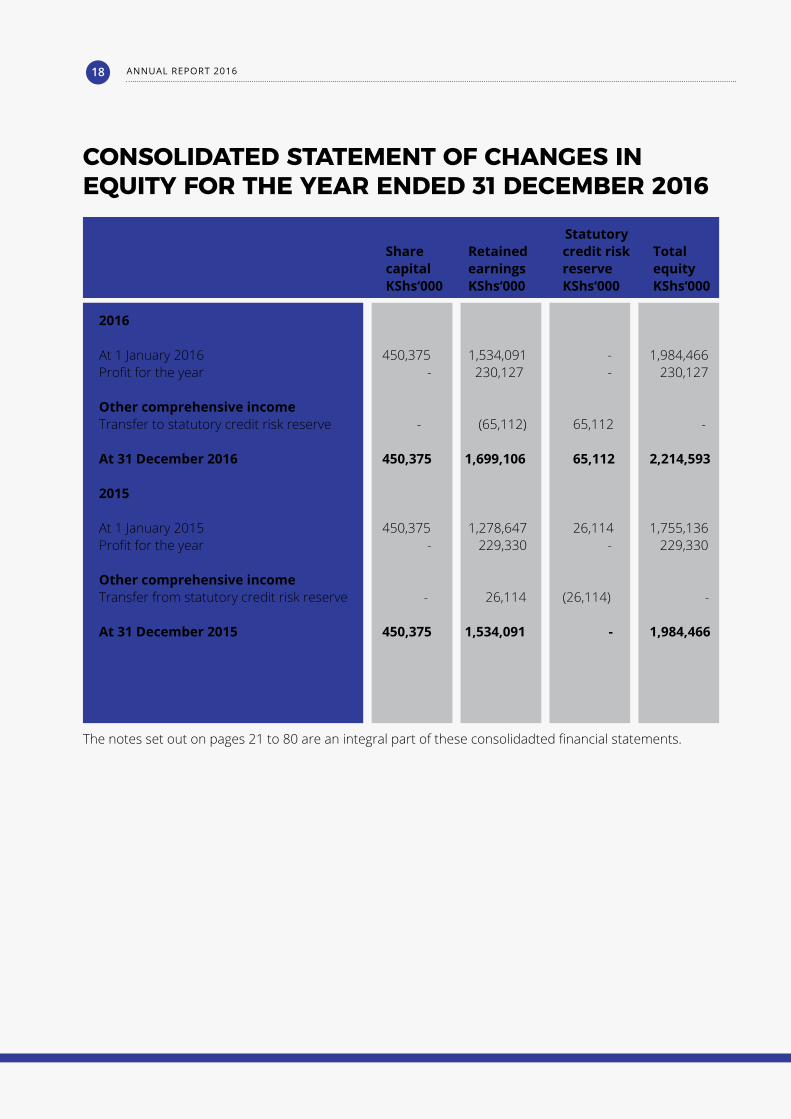
CONSOLIDATED STATEMENT OF CHANGES IN EQUITY FOR THE YEAR ENDED 31 DECEMBER 2016
Statutory Share Retained credit risk Total capital earnings reserve equity KShs‘000 KShs‘000 KShs‘000 KShs‘000
2016 At 1 January 2016 450,375 1,534,091 - 1,984,466Profit for the year - 230,127 - 230,127
Other comprehensive incomeTransfer to statutory credit risk reserve - (65,112) 65,112 -
At 31 December 2016 450,375 1,699,106 65,112 2,214,593
2015 At 1 January 2015 450,375 1,278,647 26,114 1,755,136Profit for the year - 229,330 - 229,330
Other comprehensive incomeTransfer from statutory credit risk reserve - 26,114 (26,114) -
At 31 December 2015 450,375 1,534,091 - 1,984,466
The notes set out on pages 21 to 80 are an integral part of these consolidadted financial statements.
ANNUAL REPORT 201618
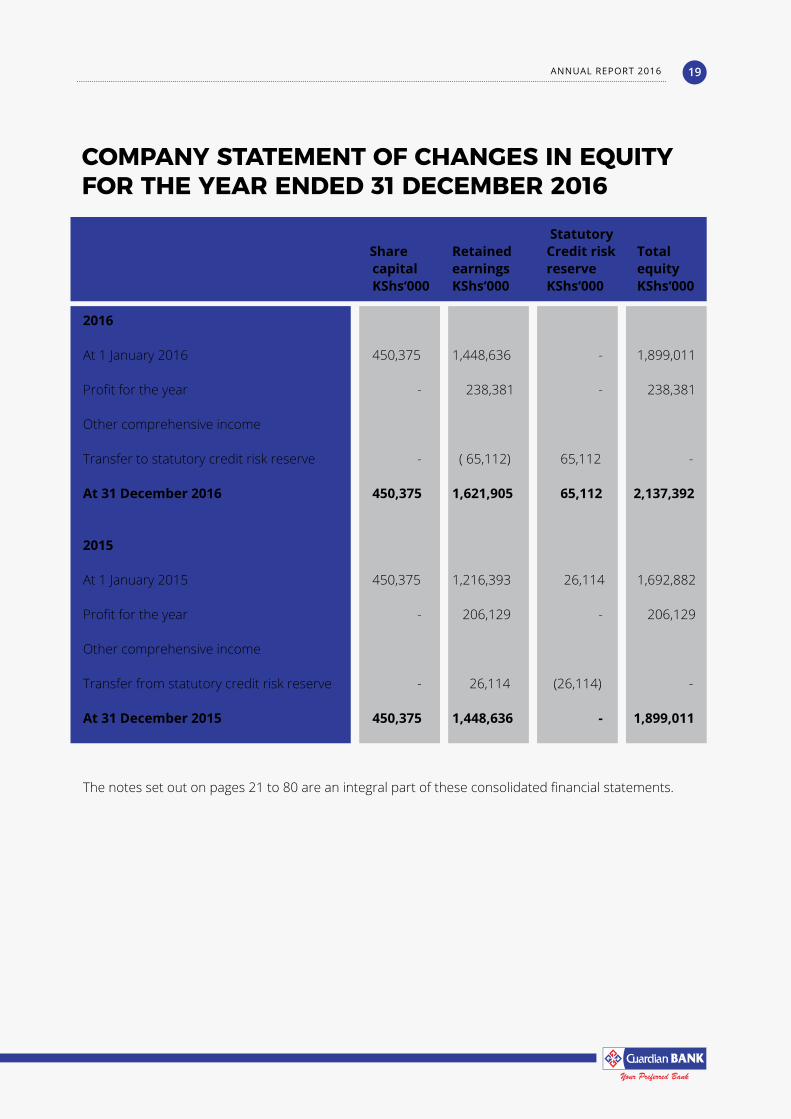
COMPANY STATEMENT OF CHANGES IN EQUITYFOR THE YEAR ENDED 31 DECEMBER 2016
Statutory Share Retained Credit risk Total capital earnings reserve equity KShs‘000 KShs‘000 KShs‘000 KShs‘000
2016
At 1 January 2016 450,375 1,448,636 - 1,899,011
Profit for the year - 238,381 - 238,381
Other comprehensive income
Transfer to statutory credit risk reserve - ( 65,112) 65,112 -
At 31 December 2016 450,375 1,621,905 65,112 2,137,392
2015 At 1 January 2015 450,375 1,216,393 26,114 1,692,882
Profit for the year - 206,129 - 206,129
Other comprehensive income
Transfer from statutory credit risk reserve - 26,114 (26,114) -
At 31 December 2015 450,375 1,448,636 - 1,899,011
The notes set out on pages 21 to 80 are an integral part of these consolidated financial statements.
ANNUAL REPORT 2016 19
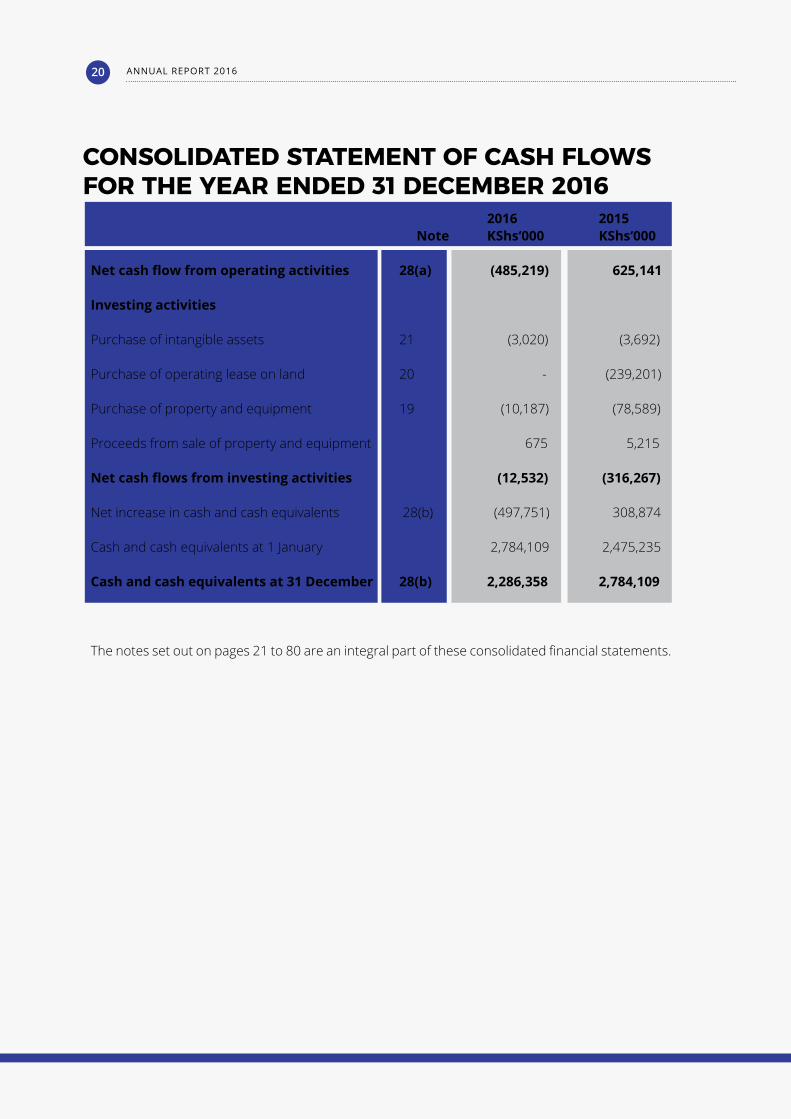
CONSOLIDATED STATEMENT OF CASH FLOWSFOR THE YEAR ENDED 31 DECEMBER 2016
2016 2015 Note KShs‘000 KShs‘000 Net cash flow from operating activities 28(a) (485,219) 625,141
Investing activities
Purchase of intangible assets 21 (3,020) (3,692)
Purchase of operating lease on land 20 - (239,201)
Purchase of property and equipment 19 (10,187) (78,589)
Proceeds from sale of property and equipment 675 5,215
Net cash flows from investing activities (12,532) (316,267)
Net increase in cash and cash equivalents 28(b) (497,751) 308,874
Cash and cash equivalents at 1 January 2,784,109 2,475,235
Cash and cash equivalents at 31 December 28(b) 2,286,358 2,784,109
The notes set out on pages 21 to 80 are an integral part of these consolidated financial statements.
ANNUAL REPORT 201620
NOTES TO THE CONSOLIDATED FINANCIAL STATEMENTS FOR THE YEAR ENDED 31 DECEMBER 2016
1. REPORTING ENTITY Guardian Bank Limited (“the Bank” or “the company”) is a company domiciled in Kenya. The consolidated financial statements of the Bank as at end of the year 31 December 2016 comprise the Bank and its subsidiaries (together referred to as the “Group” or “consolidated”). The Group is involved in investment, corporate and retail banking. The address of the Group’s registered office is as follows:
Guardian CentreBiashara StreetPO Box 67437 - 00100 GPONairobi
2. BASIS OF PREPARATION (a) Statement of compliance
The consolidated financial statements of the company and its subsidiaries together referred to as “the financial statements”, have been prepared in accordance with International Financial Reporting Standards (IFRSs) as issued by the International Accounting Standards Board (IASB) and the Kenyan Companies Act, 2015.
For the Kenyan Companies Act, 2015 reporting purposes in these financial statements, the balance sheet is represented by the statement of financial position and the profit and loss account is represented by the statement of profit or loss and other comprehensive income.
(b) Basis of measurement
The financial statements have been prepared on the historical cost basis of accounting.
(c) Use of estimates and judgments
The preparation of financial statements in conformity with IFRSs requires management to make judgments, estimates and assumptions that affect the application of accounting policies and
ANNUAL REPORT 2016 21
reported amounts of assets and liabilities and disclosures of contingent assets and liabilities at the date of the financial statements and the reported amounts of revenues and expenses during the reporting period. The estimates and assumptions are based on the Directors’ best knowledge of current events, actions, historical experience and various other factors that are believed to be reasonable under the circumstances, the results of which form the basis of making the judgments about the carrying values of assets and liabilities that are not readily apparent from other sources. Actual results may differ from these estimates.
The estimates and underlying assumptions are reviewed on an ongoing basis. Revisions to accounting estimates are recognized in the period which the estimate is revised if the revision affects only that period or in the period of the revision and future periods if the revision affects both current and future periods.
In particular, information about significant areas of estimation and critical judgments in applying accounting policies that have the most significant effect on the amounts recognized in the financial statements is set out below:
(i) Impairment of loans and receivables
The Group’s loan loss provisions are established to recognise incurred impairment losses either on specific loan assets or within a portfolio of loans and receivables.
Impairment losses for specific loan assets are assessed on an individual basis. Individual impairment losses are determined as the difference between the carrying value and the present value of estimated future cash flows, discounted at the loans’ original effective interest rate. Impairment losses determined on a portfolio basis are assessed based on the profitability of default inherent within the portfolio of impaired loans or receivables
Estimating the amount and timing of future recoveries involves significant judgement, and considers the level of arrears as well as the assessment of matters such as future economic conditions and the value of collateral, for which there may not be a readily accessible market.
Loan losses that have been incurred but have not been separately identified at the reporting date are determined on a portfolio basis, which takes into account past loss experience and defaults based on portfolio trends. Actual losses identified could differ significantly from the impairment provisions reported as a result of uncertainties arising from the economic environment.
ANNUAL REPORT 201622
(ii) Fairvalueoffinancialinstruments
Where the fair values of the financial assets and finance liabilities recorded in the statement of financial position cannot be derived from active markets, they are determined using a variety of valuation techniques that include the use of mathematical models. The input to these models is taken from observable market data where possible, but where this is not feasible, a degree of judgment is required in establishing fair values.
(iii) Taxation
Judgment is required in determining the provision for income taxes due to the complexity of legislation. There are many transactions and calculations for which ultimate tax determination is uncertain during the ordinary course of business. The Group recognises liabilities for anticipated tax audit issues based on estimates of whether additional taxes will be due. Where the final tax outcome of these matters is different from the amounts that were initially recorded, such differences will impact the income tax and deferred tax provisions in the period in which such determination is made.
The Group recognises the net future tax benefit that relates to deferred income tax assets to the extent that it is probable that the deductible temporary differences will reverse in the foreseeable future. Assessing the recoverability of deferred income tax assets requires the Group to make significant estimates related to expectations of future taxable income. Estimates of future taxable income are based on forecast cash flows from operations and the application of existing tax laws in each jurisdiction. To the extent that future cash flows and taxable income differ significantly from estimates, the ability of the Group to realise the net deferred tax assets recorded at the reporting date could be impacted.
(iv) Useful lives and residual values of property and equipment
The company tests annually whether the useful life and residual value estimates were appropriate and in accordance with its accounting policy. Useful lives and residual values of property and equipment have been determined based on previous experience and anticipated disposal values when the assets are disposed. The rates used are set out on Note 3(d).
(d) Functional and presentation currency
The financial statements are presented in Kenya Shillings which is also the Group’s functional and presentation currency, the currency of the primary economic environment in which the entity operates. Except when otherwise indicated, financial information presented in Kenya Shillings (KShs) has been rounded to the nearest thousand.
ANNUAL REPORT 2016 23
3. SIGNIFICANT ACCOUNTING POLICIES (a) Basis of consolidation The consolidated financial statements include the Company and subsidiaries in which the
company holds 100% of the voting rights. A listing of the company’s subsidiaries is set out in Note 18. Subsidiaries are investees controlled by the Group. The Group controls an investee when it is exposed to, or has rights to, variable returns from its involvement with the investee and has the ability to affect those returns through its power over the investee. The financial statements of subsidiaries are included in the consolidated financial statements from the date that control commences until the date that control ceases.
All inter-company balances and transactions are eliminated upon consolidation. Investments in
subsidiaries are accounted for at cost at company level. The carrying amounts of these investments are reviewed annually and written down for impairment where considered necessary.
(b) Revenue recognition Income is derived substantially from banking business and related activities. Revenue comprises
of net interest income and non-interest income. The group recognises revenue when the amount of revenue can be reliably measured, it is probable that future economic benefits will flow to the entity and when the specific criteria have been met for each of the group’s activities as described below. The amount of revenue is not considered to be reliably measured until all contingencies relating to the sale have been resolved. The group bases its estimates on historical results, taking into consideration the type of customer, type of transaction and specifics of each arrangement
(i) Interest income and interest expense
For all financial instruments measured at amortized cost, interest income or expense is recognized at the effective interest rate, which is the rate that exactly discounts estimated future cash payments or receipts through the expected life of the financial instrument or shorter period, where appropriate, to the net carrying amount of the financial asset or financial liability. The carrying amount of the financial asset or financial liability is adjusted if the Group revises its estimates of payments or receipts. The adjusted carrying amount is calculated based on the original effective interest rate and the change in carrying amount is recognized as interest income or expense. The calculation of effective interest rate includes transaction costs and fees that are an integral part of the effective interest rate.
ANNUAL REPORT 201624
(ii) Fees and commission income
Fees and commissions are generally recognized on an accrual basis when the service has been provided. Loan commitment fees for loans that are likely to be drawn down are deferred (together with related direct costs) and recognized as an adjustment to the effective interest rate on the loan. Commission and fees arising from negotiating, or participating in the negotiation of a transaction for a third party is recognized on completion of the underlying transaction. Other fees and commission income including account servicing fees and placement fees are recognized as the related services are performed. Other fees and commission expense relate mainly to transaction and services fee, which are expensed as the services are received.
(c) Translation of foreign currencies Transactions in foreign currencies during the year are converted into Kenya Shillings at the exchange
rate ruling at the date of the transaction. Monetary assets and liabilities denominated in foreign currencies as at the reporting date are translated into Kenya Shillings at the exchange rate ruling at that date. The foreign currency gain or loss on monetary items is the difference between the amortised cost in the functional currency at the beginning of the year adjusted for effective interest and payments during the year, and the amortised cost in foreign currency translated at the spot exchange rate at the end of the year. Resulting exchange differences are recognised in profit or loss for the year. Non monetary assets and liabilities denominated in foreign currency are recorded at the exchange rate ruling at the transaction date.
(d) Property and equipment
(i) Recognition and measurement
Items of property and equipment are measured at historical cost less accumulated depreciation and impairment losses.
Cost includes expenditure that are directly attributable to the acquisition of the asset.
(ii) Subsequent cost
The cost of replacing a component of an item of property or equipment is recognised in the carrying amount of the item if it is probable that the future economic benefits embodied within the part will flow to the Group and its cost can be measured reliably. The costs of the day-to-day servicing of property, plant and equipment are recognised in the profit or loss.
ANNUAL REPORT 2016 25
(iii) Depreciation
Depreciation is charged to the profit or loss on a straight line basis over the estimated useful lives of each item of property, plant and equipment. The estimated useful lives are as follows:
• Leasehold improvements 5 years • Equipment, fixtures and fittings, motor vehicles 3 to 8 years• Buildings 40 years
The assets’ residual values and useful lives are reviewed, and adjusted if appropriate, at each reporting date.
(iv) Disposal of property and equipment
Gain and losses on disposal of an item of property and equipment are determined by comparing the proceeds from the disposal with the carrying amount of the property and equipment and are recognised net in profit or loss.
(e) Intangible assets
Intangible assets acquired separately are measured on initial recognition at cost. The cost of intangible assets acquired in a business combination is the fair value as at the date of acquisition. Following initial recognition, intangible assets are carried at cost less any accumulated amortisation and any accumulated impairment losses. Internally generated intangible assets, excluding capitalised development costs, are not capitalised and expenditure is recognised in profit or loss in the year in which the expenditure is incurred.
Acquired computer software licences are capitalised on the basis of the costs incurred to acquire and bring to use the specific software. Software is amortised on a straight line basis in profit or loss over its estimated useful life, from the date that is available for use. The estimated useful life of software is 3 years.
The amortisation method, useful life and the residual value are reviewed at each financial year-end and adjusted if appropriate. Changes in the expected useful life or the expected pattern of consumption of future economic benefits embodied in the asset is accounted for by changing the amortisation method, as appropriate, and treated as changes in accounting estimates. The amortisation expense on intangible assets with finite lives is recognised in profit or loss in the expense category consistent with the function of the intangible asset.
ANNUAL REPORT 201626
(f) Operating leases Leases where a significant portion of the risks and rewards of ownership are retained by the lessor,
are classified as operating leases. Payments made under operating leases are charged to the profit and loss on a straight-line basis over the period of the lease. Prepaid operating lease rentals in respect of leasehold land is recognised as an asset and amortised over the lease period. The Company holds prepaid operating leases over two pieces of land which are being amortised on a straight line basis over 33 years and 40 years.
(g) Taxation
Tax on the profit or loss for the year comprises current tax and deferred tax. Current tax is provided on the results in the year as shown in the financial statements adjusted in accordance with tax legislation.
Deferred tax is recognised in respect of temporary differences between the carrying amounts of
assets and liabilities for financial reporting purposes and the amounts used for taxation purposes, except differences relating to the initial recognition of assets or liabilities which affect neither accounting nor taxable profit.
A deferred tax asset on tax losses is recognised only to the extent that it is probable that future
taxable profits will be available against which the asset can be utilised. Deferred tax asset is reviewed at each reporting date and reduced to the extent that it is no longer probable that the related tax benefit will be realised.
Deferred tax is calculated on the basis of the tax rates currently enacted.
(h) Financial instruments
(i) Classification
A financial instrument is any contract that gives rise to a financial asset of one entity and a financial liability of another entity. Financial instruments are classified as follows:
Loans and receivables
Loans and receivables are non-derivative financial assets with fixed or determinable payments that are not quoted in an active market. They arise when the Group provides money, goods and services directly to a debtor, with no intention of trading the receivable. Loans and receivables comprise loans and advances, placements with other banks and cash and bank balances.
ANNUAL REPORT 2016 27
Held-to-maturity
Held-to-maturity assets are non-derivative financial assets with fixed or determinable payments and fixed maturity that the bank has the positive intent and ability to hold to maturity. Were the Group to sell, other than insignificant amount of held-to-maturity assets, the entire category would be tainted and reclassified as available for sale. These include treasury bills and bonds and other investments.
Other Financial liabilities
The Group classifies financial liabilities as other financial liabilities at amortised cost. Other financial liabilities include customer deposits, borrowings and deposits from banking and non-banking financial institutions.
(ii) Recognition and measurement
The Group initially recognises loans and advances, deposits and debt securities issues on the date at which they are originated. All other financial assets and liabilities (including assets designated at fair value through the income statement) are initially recognized on the trade date, which is the date the Group becomes party to the contractual provisions of the instrument.
A financial asset of financial liability is initially measured at fair value plus, for items not at fair value through profit or loss, translation costs are directly attributable to the acquisition or issue.
Subsequent to initial recognition, financial liabilities (deposits and debt securities) are measured at their amortised cost using the effective rate method except where the Group design liabilities at fair value through profit or loss.
(iii) De-recognition
A financial asset is derecognised when the Group loses control over the contractual rights that comprise that asset. This occurs when the rights are realised, expire or are surrendered. A financial liability is derecognised when its contractual obligations are discharged or cancelled or expire.
On de-recognition of a financial asset, the difference between the carrying amount of the asset and the consideration received is recognised in profit or loss.
ANNUAL REPORT 201628
Held-to-maturity instruments and originated loans and receivables are derecognised on the day they are repaid in full or when they are transferred by the Bank to a third party.
(iv) Identificationandmeasurementofimpairmentoffinancialassets At each reporting date the Group assesses whether there is objective evidence that financial
assets not carried at fair value through profit or loss are impaired. Financial assets are impaired when objective evidence demonstrates that a loss event has occurred after the initial recognition of the asset, and that the loss event has an impact on the future cash flows on the asset that can be estimated reliably.
The Group considers evidence of impairment at both a specific asset and collective level. All
individually significant financial assets are assessed for specific impairment. All significant assets found not be specifically impaired are then collectively assessed for any impairment that has been incurred but not yet identified. Assets that are not individually significant are then collectively assessed for impairment by grouping together financial assets (carried at amortised cost) with similar risk characteristics.
Objective evidence that financial assets (including equity securities) are impaired can include default or delinquency by a borrower, restructuring of a loan or advance by the Group on terms that the Group would otherwise consider, indications that a borrower or issuer will enter bankruptcy, the disappearance of an active market for a security, or other observable data relating to a group of assets such as adverse changes in the payment status of borrowers or issuers in the group, or economic conditions that correlate with defaults in the group.
In assessing collective impairment the Group uses statistical modelling of historical trends of the probability of default, timing of recoveries and the amount of loss incurred, adjusted for management’s judgement as to whether current economic and credit conditions are such that the actual losses are likely to be greater or less than suggested by historical modelling.
Default rate, loss rates and the expected timing of future recoveries are regularly benchmarked against actual outcomes to ensure that they remain appropriate.
Impairment losses on assets carried at amortised cost are measured as the difference between
the carrying amount of the financial assets and the present value of estimated cash flows discounted at the assets’ original effective interest rate. Losses are recognised in profit or loss and reflected in an allowance account against loans and advances. Interest on the impaired asset continues to be recognised through the unwinding of the discount.
When a subsequent event causes the amount of impairment loss to decrease, the impairment
loss is reversed through profit or loss.
ANNUAL REPORT 2016 29
(v) Offsettingoffinancialassetsandfinancialliabilities Financial assets and financial liabilities are offset and the net amount reported on the statement
of financial position when there is a legally enforceable right to set-off the recognised amount and there is an intention to settle on a net basis, or to realise the asset and settle the liability simultaneously.
(vi) Amortised cost measurement
The amortised cost of a financial asset or liability is the amount at which the financial asset or liability is measured at initial recognition, minus principal repayments, plus or minus the cumulative amortisation using the effective interest method of any difference between the initial amount recognised and the maturity amount, minus any reduction for impairment.
(i) Impairmentofnon-financialassets The carrying amounts of the Group’s non-financial assets other than deferred tax assets are
reviewed at each reporting date to determine whether there is any indication of impairment. If any such indication exists then the asset’s recoverable amount is estimated.
An impairment loss is recognised if the carrying amount of an asset or its cash-generating
unit exceeds its recoverable amount. A cash-generating unit is the smallest identifiable asset group that generates cash flows that largely are independent from other assets and groups. Impairment losses are recognised in the profit or loss. Impairment losses recognised in respect of cash-generating units reduce the carrying amount of the other assets in the unit (group of units) on a pro rata basis.
The recoverable amount of an asset or cash-generating unit is the greater of its value in use and its fair value less costs to sell. In assessing value in use, the estimated future cash flows are discounted to their present value using a pre-tax discount rate that reflects current market assessments of the time value of money and the risks specific to the asset.
Impairment losses recognised in prior periods are assessed at each reporting date for any indications that the loss has decreased or no longer exists. An impairment loss is reversed if there has been a change in the estimates used to determine the recoverable amount. An impairment loss is reversed only to the extent that the asset’s carrying amount does not exceed the carrying amount that would have been determined, net of depreciation or amortisation, if no impairment loss had been recognised.
ANNUAL REPORT 201630
(j) Contingent liabilities Letters of credit, guarantees, bills for collection and swaps are accounted for as off balance sheet
transactions and disclosed as contingent liabilities. Estimates of the outcome and of the financial effect of contingent liabilities are made by the management based on the information available up to the date the financial statements are approved for issue by the directors. Any expected loss is charged to the profit or loss.
(k) Cash and cash equivalents For the purpose of presentation of the cash flows in the financial statements the cash and cash
equivalents include cash and balances with Central Bank of Kenya (CBK) available to finance the bank’s day-to-day operations, net balances from banking institutions and treasury bills and bonds which mature within three months or less from the date of acquisition. Cash and cash equivalents are carried at amortised cost in the statement of financial position.
(l) Employee benefits (i) Short term employee benefits
Short term employee benefits are expensed as the related services are provided. A liability is recognised for the amount expected to be paid if the company has a present or constructive obligation to pay this amount as a result of past services provided by the employee and the obligation can be estimated reliably.
(ii) Post-employment benefits
The Bank operates gratuity scheme. The gratuity policy provides that an employee who works for more than 5 years, is eligible for the gratuity amount based on the lower of six months monthly salary or an equivalent of 15 days salary for every year worked; however, this is at management’s discretion. A provision is made in the Bank’s financial statements for the accrued liability in respect of the benefits promised under the arrangement and movements in the provision are recognised in profit or loss.
The Bank’s net obligation in respect of the scheme is calculated separately as the present value of the benefits in respect of service completed to the valuation date but based on projected earnings to the date of retirement or earlier exit for each employee. The total accrued (past service) liability (or the required balance sheet provision as at the valuation date) is obtained by summing the individual benefits over all employees. There is no separate pool of assets is set aside to meet the accrued liabilities under the arrangement.
ANNUAL REPORT 2016 31
The required contribution rate for future years expressed as a percentage of basic salaries is determined as the cost of accrual of benefit in the year after the valuation date, but based on projected earnings to date of retirement. The retirement age, sex and salary distribution is expected to remain relatively stable provided that the age, sex and salary distribution of the employees remains broadly unchanged. If in the absence of new entrants, the average age of the employees were to rise, then other things being equal, the required contribution rate would be expected to rise.
The calculation of defined benefit obligation in the current year has been performed by a qualified actuary using the projected unit credit method.
(m) Dividends Dividends on ordinary shares are recognised as a liability in the period in which they are declared
and proposed dividends are disclosed as a separate component of equity.
(n) Provisions Provisions are recognised when the company has a present legal or constructive obligation as a
result of past events and it is probable that an outflow of resources embodying economic benefits will be required to settle the obligation and a reliable estimate of the amount of the obligation can be made.
(o) Earnings per share
Basic and diluted earnings per share (EPS) data for ordinary shares are presented in the financial statements. Basic EPS is calculated by dividing the profit or loss attributable to ordinary shareholders of the Bank by the weighted average number of ordinary shares outstanding during the period. Diluted EPS is determined by adjusting the profit or loss attributable to ordinary shareholders and the weighted average number of ordinary shares outstanding for the effects of all dilutive potential ordinary shares, if any.
(p) Determination of fair values
Fair value is the price that would be received to sell an asset or paid to transfer a liability in an orderly transaction between market participants at the measurement date in the principal or, in its absence, the most advantageous market to which the Bank has access at that date. The fair value of a liability reflects its non-performance risk. When available, the Bank measures the fair value of an instrument using the quoted price in an active market for that instrument. A market is regarded as active if transactions for the asset or liability take place with sufficient frequency and volume to
ANNUAL REPORT 201632
provide pricing information on an ongoing basis. If there is no quoted prices in an active market, then the Bank uses valuation techniques that maximise the use of relevant observable inputs and minimise the use of unobservable inputs. The chosen valuation technique incorporates all of the factors that market participants would take into account in pricing a transaction.
(q) New standards and interpretations effective and adopted during the year
The Group has adopted the following new standards and amendments during the year ended 31 December 2016, including any consequential amendments to other standards, with a date of initial application of 1 January 2016. The nature and effects of the changes are explained below:
• Accounting for Acquisitions of Interests in Joint Operations (Amendments to IFRS 11)
The amendments require business combination accounting to be applied to acquisitions of interests in a joint operation that constitutes a business. Business combination accounting also applies to the acquisition of additional interests in a joint operation while the joint operator retains joint control. The additional interest acquired will be measured at fair value. The previously held interest in the joint operation will not be remeasured. The amendments apply prospectively for annual periods beginning on or after 1 January 2016 and early adoption is permitted
The amendments did not have significant impact on the Group’s financial statements, as the Group did not acquire any interests in joint ventures during the year.
• ClarificationofAcceptableMethodsofDepreciationandAmortisation(AmendmentstoIAS16and IAS 38)
The amendments to IAS 16 Property, Plant and Equipment explicitly state that revenue-based methods of depreciation cannot be used for property, plant and equipment.
The amendments to IAS 38 Intangible Assets introduce a rebuttable presumption that the use of revenue-based amortisation methods for intangible assets is inappropriate. The presumption can be overcome only when revenue and the consumption of the economic benefits of the intangible asset are ‘highly correlated’, or when the intangible asset is expressed as a measure of revenue.
The amendments apply prospectively for annual periods beginning on or after 1 January 2016 and early adoption is permitted.
ANNUAL REPORT 2016 33
The adoption of these changes did not affect the amounts and disclosures of the Group’s property, plant and equipment and intangible assets.
• AmendmentstoIAS41-BearerPlants(AmendmentstoIAS16andIAS41)
The amendments to IAS 16 Property, Plant and Equipment and IAS 41 Agriculture require a bearer plant (which is a living plant used solely to grow produce over several periods) to be accounted for as property, plant and equipment in accordance with IAS 16 Property, Plant and Equipment instead of IAS 41 Agriculture. The produce growing on bearer plants will remain within the scope of IAS 41.
The new requirements are effective from 1 January 2016, with earlier adoption permitted.
The amendment did not have a significant impact on the Group’s financial statements as the Group does not have bearer plants.
• EquityMethodinSeparateFinancialStatements(AmendmentstoIAS27)
The amendments allow the use of the equity method in separate financial statements, and apply to the accounting not only for associates and joint ventures but also for subsidiaries.
The amendments apply retrospectively for annual periods beginning on or after 1 January 2016 with early adoption permitted.
The adoption of these changes did not affect the amounts and disclosures of the Group’s financial statements.
• IFRS14RegulatoryDeferralAccounts
IFRS 14 provides guidance on accounting for regulatory deferral account balances by first-time adopters of IFRS. To apply this standard, the entity has to be rate-regulated i.e. the establishment of prices that can be charged to its customers for goods and services is subject to oversight and/or approval by an authorised body.
The standard is effective for financial reporting years beginning on or after 1 January 2016 with early adoption is permitted.
The adoption of this standard did not have an impact the financial statements of the Group given that it is not a first time adopter of IFRS.
ANNUAL REPORT 201634
• InvestmentEntities:ApplyingtheConsolidationException(AmendmentstoIFRS10,IFRS12andIAS 28)
The amendment to IFRS 10 Consolidated Financial Statements clarifies which subsidiaries of an investment entity are consolidated instead of being measured at fair value through profit and loss. The amendment also modifies the condition in the general consolidation exemption that requires an entity’s parent or ultimate parent to prepare consolidated financial statements. The amendment clarifies that this condition is also met where the ultimate parent or any intermediary parent of a parent entity measures subsidiaries at fair value through profit or loss in accordance with IFRS 10 and not only where the ultimate parent or intermediate parent consolidates its subsidiaries. The amendment to IFRS 12 Disclosure of Interests in Other Entities requires an entity that prepares financial statements in which all its subsidiaries are measured at fair value through profit or loss in accordance with IFRS 10 to make disclosures required by IFRS 12 relating to investment entities. The amendment to IAS 28 Investments in Associates and Joint Ventures modifies the conditions where an entity need not apply the equity method to its investments in associates or joint ventures to align these to the amended IFRS 10 conditions for not presenting consolidated financial statements. The amendments introduce relief when applying the equity method which permits a non-investment entity investor in an associate or joint venture that is an investment entity to retain the fair value through profit or loss measurement applied by the associate or joint venture to its subsidiaries.
The amendments apply retrospectively for annual periods beginning on or after 1 January 2016. The adoption of these changes will not affect the amounts and disclosures of the Group’s financial statements as all subsidiaries are consolidated.
• DisclosureInitiative(AmendmentstoIAS1) The amendments provide additional guidance on the application of materiality and aggregation
when preparing financial statements. The amendments apply for annual periods beginning on or after 1 January 2016 and early application is permitted.
The adoption of these changes did not have a significant impact on the financial statements of the Company.
ANNUAL REPORT 2016 35
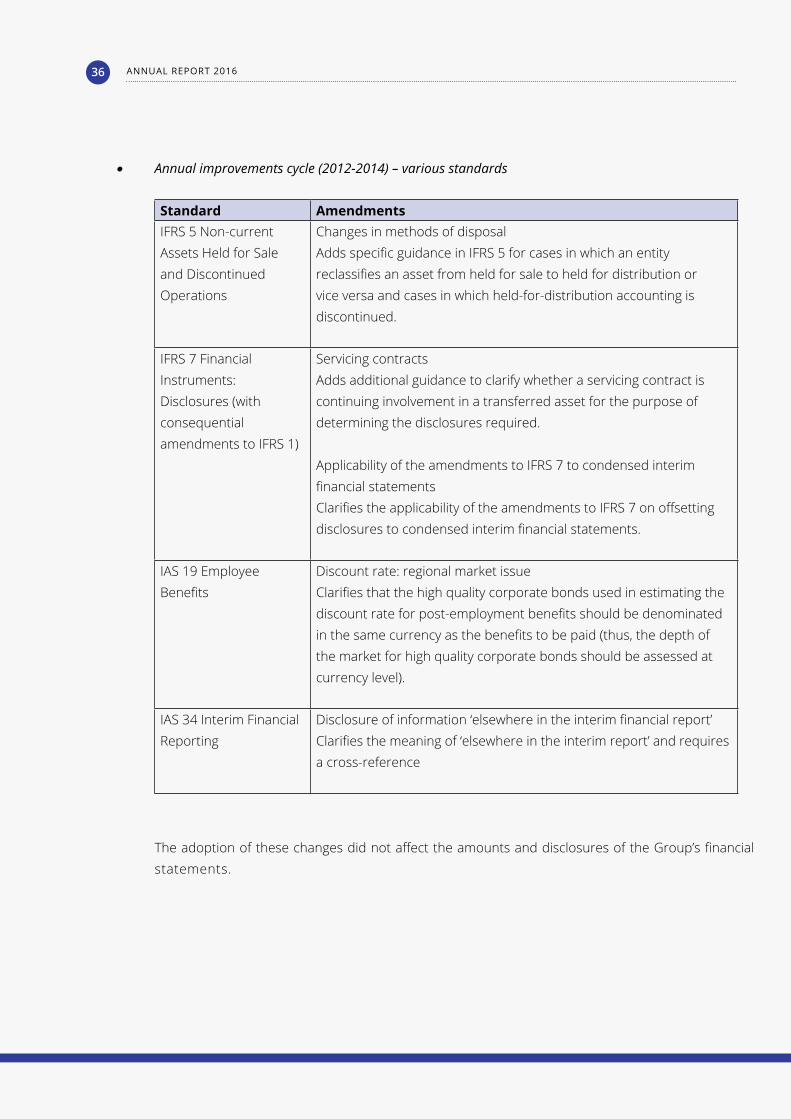
• Annualimprovementscycle(2012-2014)–variousstandards
Standard AmendmentsIFRS 5 Non-current Assets Held for Sale and Discontinued Operations
Changes in methods of disposalAdds specific guidance in IFRS 5 for cases in which an entity reclassifies an asset from held for sale to held for distribution or vice versa and cases in which held-for-distribution accounting is discontinued.
IFRS 7 Financial Instruments: Disclosures (with consequential amendments to IFRS 1)
Servicing contractsAdds additional guidance to clarify whether a servicing contract is continuing involvement in a transferred asset for the purpose of determining the disclosures required.
Applicability of the amendments to IFRS 7 to condensed interim financial statementsClarifies the applicability of the amendments to IFRS 7 on offsetting disclosures to condensed interim financial statements.
IAS 19 Employee Benefits
Discount rate: regional market issueClarifies that the high quality corporate bonds used in estimating the discount rate for post-employment benefits should be denominated in the same currency as the benefits to be paid (thus, the depth of the market for high quality corporate bonds should be assessed at currency level).
IAS 34 Interim Financial Reporting
Disclosure of information ‘elsewhere in the interim financial report’Clarifies the meaning of ‘elsewhere in the interim report’ and requires a cross-reference
The adoption of these changes did not affect the amounts and disclosures of the Group’s financial statements.
ANNUAL REPORT 201636
(r) New and amended standards and interpretations in issue but not yet effective for the year ended 31 December 2016
A number of new standards, amendments to standards and interpretations are not yet effective for the year ended 31 December 2016, and have not been applied in preparing these financial statements. These are summarised below and the extent of the impact has not been determined. The Group does not plan to early adopt these standards.
• DisclosureInitiative(AmendmentstoIAS7)
The amendments in Disclosure Initiative (Amendments to IAS 7) come with the objective that entities shall provide disclosures that enable users of financial statements to evaluate changes in liabilities arising from financing activities.
The International Accounting Standards Board (IASB) requires that the following changes in liabilities arising from financing activities are disclosed (to the extent necessary): (i) changes from financing cash flows; (ii) changes arising from obtaining or losing control of subsidiaries or other businesses; (iii) the effect of changes in foreign exchange rates; (iv) changes in fair values; and (v) other changes.
The IASB defines liabilities arising from financing activities as liabilities “for which cash flows were, or future cash flows will be, classified in the statement of cash flows as cash flows from financing activities”. It also stresses that the new disclosure requirements also relate to changes in financial assets if they meet the same definition.
The amendments state that one way to fulfil the new disclosure requirement is to provide a reconciliation between the opening and closing balances in the statement of financial position for liabilities arising from financing activities.
Finally, the amendments state that changes in liabilities arising from financing activities must be disclosed separately from changes in other assets and liabilities.
The amendments are effective for annual periods beginning on or after 1 January 2017, with early application permitted. Since the amendments are being issued less than one year before the effective date, entities need not provide comparative information when they first apply the amendments.
The Group is assessing the potential impact on its financial statements resulting from the application of IAS 7.
ANNUAL REPORT 2016 37
• RecognitionofDeferredTaxAssetsforUnrealisedLosses(AmendmentstoIAS12)
The amendments in Recognition of Deferred Tax Assets for Unrealised Losses clarify the following aspects:
− Unrealised losses on debt instruments measured at fair value and measured at cost for tax purposes give rise to a deductible temporary difference regardless of whether the debt instrument’s holder expects to recover the carrying amount of the debt instrument by sale or by use.
− The carrying amount of an asset does not limit the estimation of probable future taxable profits.
− Estimates for future taxable profits exclude tax deductions resulting from the reversal of deductible temporary differences.
− Recognition of Deferred Tax Assets for Unrealised Losses (Amendments to IAS 12) - continued
− An entity assesses a deferred tax asset in combination with other deferred tax assets. Where tax law restricts the utilisation of tax losses, an entity would assess a deferred tax asset in combination with other deferred tax assets of the same type.
The amendments are effective for annual periods beginning on or after 1 January 2017 with early application permitted. As transition relief, an entity may recognise the change in the opening equity of the earliest comparative period in opening retained earnings on initial application without allocating the change between opening retained earnings and other components of equity. The Board has not added additional transition relief for first-time adopters.
The Group is assessing the potential impact on its financial statements resulting from the application of IAS 12.
• IFRS 15 Revenue from Contracts with Customers
This standard replaces IAS 11 Construction Contracts, IAS 18 Revenue, IFRIC 13 Customer Loyalty Programmes, IFRIC 15 Agreements for the Construction of Real Estate, IFRIC 18 Transfer of Assets from Customers and SIC-31 Revenue – Barter of Transactions Involving Advertising Services.
The standard contains a single model that applies to contracts with customers and two approaches to recognising revenue: at a point in time or over time. The standard specifies how and when an IFRS reporter will recognise revenue as well as requiring such entities to provide users of financial statements with more informative, relevant disclosures.
ANNUAL REPORT 201638
The standard provides a single, principles based five-step model to be applied to all contracts with customers in recognising revenue being: Identify the contract(s) with a customer; identify the performance obligations in the contract; determine the transaction price; Allocate the transaction price to the performance obligations in the contract; and recognise revenue when (or as) the entity satisfies a performance obligation.
IFRS 15 is effective for annual reporting periods beginning on or after 1 January 2018, with early adoption permitted. The application of IFRS 15 is not expected to have a significant impact on the Group’s financial statements.
• IFRS9:FinancialInstruments(2014)
On 24 July 2014 the IASB issued the final IFRS 9 Financial Instruments Standard, which replaces earlier versions of IFRS 9 and completes the IASB’s project to replace IAS 39 Financial Instruments: Recognition and Measurement. This standard introduces changes in the measurement bases of the financial assets to amortized cost, fair value through other comprehensive income or fair value through profit or loss. Even though these measurement categories are similar to IAS 39, the criteria for classification into these categories are significantly different. In addition, the IFRS 9 impairment model has been changed from an “incurred loss” model from IAS 39 to an “expected credit loss” model. The standard is effective for annual periods beginning on or after 1 January 2018 with retrospective application, early adoption is permitted.
• Applying IFRS 9 Financial Instruments with IFRS 4 Insurance Contracts (Amendments to IFRS 4)
The amendments in Applying IFRS 9 ‘Financial Instruments’ with IFRS 4 ‘Insurance Contracts’ (Amendments to IFRS 4) provide two options for entities that issue insurance contracts within the scope of IFRS 4:
− an option that permits entities to reclassify, from profit or loss to other comprehensive income, some of the income or expenses arising from designated financial assets; this is the so-called overlay approach;
− an optional temporary exemption from applying IFRS 9 for entities whose predominant activity is issuing contracts within the scope of IFRS 4; this is the so-called deferral approach.
The application of both approaches is optional and an entity is permitted to stop applying them before the new insurance contracts standard is applied.
An entity applies the overlay approach retrospectively to qualifying financial assets when it first applies IFRS 9. Application of the overlay approach requires disclosure of sufficient information
ANNUAL REPORT 2016 39
to enable users of financial statements to understand how the amount reclassified in the reporting period is calculated and the effect of that reclassification on the financial statements.
An entity applies the deferral approach for annual periods beginning on or after 1 January 2018. Predominance is assessed at the reporting entity level at the annual reporting date that immediately precedes 1 April 2016. Application of the deferral approach needs to be disclosed together with information that enables users of financial statements to understand how the insurer qualified for the temporary exemption and to compare insurers applying the temporary exemption with entities applying IFRS 9. The deferral can only be made use of for the three years following 1 January 2018. Predominance is only reassessed if there is a change in the entity’s activities.
The adoption of these changes will not affect the amounts and disclosures of the Group’s financial statements as the Group does not issue out any contracts that fall within the premise of IFRS 4 as insurance contracts.
• IFRS16:Leases
On 13 January 2016 the IASB issued IFRS 16 Leases, completing the IASB’s project to improve the financial reporting of leases. IFRS 16 replaces the previous leases standard, IAS 17 Leases, and related interpretations.
IFRS 16 sets out the principles for the recognition, measurement, presentation and disclosure of leases for both parties to a contract, i.e. the customer (‘lessee’) and the supplier (‘lessor’). The standard defines a lease as a contract that conveys to the customer (‘lessee’) the right to use an asset for a period of time in exchange for consideration. A company assesses whether a contract contains a lease on the basis of whether the customer has the right to control the use of an identified asset for a period of time.
The standard eliminates the classification of leases as either operating leases or finance leases
for a lessee and introduces a single lessee accounting model. All leases are treated in a similar way to finance leases. Applying that model significantly affects the accounting and presentation of leases and consequently, the lessee is required to recognise:
a) assets and liabilities for all leases with a term of more than 12 months, unless the underlying asset is of low value. A company recognises the present value of the unavoidable lease payments and shows them either as lease assets (right-of-use assets) or together with property, plant and equipment. If lease payments are made over time, a company also recognises a financial liability representing its obligation to make future lease payments.
ANNUAL REPORT 201640
b) depreciation of lease assets and interest on lease liabilities in profit or loss over the lease term; and
c) Separate the total amount of cash paid into a principal portion (presented within financing activities) and interest (typically presented within either operating or financing activities) in the statement of cash flows
IFRS 16 substantially carries forward the lessor accounting requirements in IAS 17. Accordingly, a lessor continues to classify its leases as operating leases or finance leases, and to account for those two types of leases differently. However, compared to IAS 17, IFRS 16 requires a lessor to disclose additional information about how it manages the risks related to its residual interest in assets subject to leases.
The standard does not require a company to recognise assets and liabilities for:
(a) short-term leases (i.e. leases of 12 months or less) and;(b) leases of low-value assets
The new Standard is effective for annual periods beginning on or after 1 January 2019. Early application is permitted insofar as the recently issued revenue Standard, IFRS 15 Revenue from Contracts with Customers is also applied).
The application of IFRS 16 is not expected to have a significant impact on the Group’s financial statements.
• Sale or Contribution of Assets between an Investor and its Associate or Joint Venture (Amendments toIFRS10andIAS28)
The amendments require the full gain to be recognised when assets transferred between an investor and its associate or joint venture meet the definition of a ‘business’ under IFRS 3 Business Combinations. Where the assets transferred do not meet the definition of a business, a partial gain to the extent of unrelated investors’ interests in the associate or joint venture is recognised. The definition of a business is key to determining the extent of the gain to be recognised.
The effective date for these changes has now been postponed until the completion of a broader review.
The amendment is not expected to have a significant impact on the Group’s financial statements, as the Group does not have associates and joint ventures
ANNUAL REPORT 2016 41
4. FINANCIAL RISK MANAGEMENT
Introduction and overview
The Group has exposure to the following risks from its use of financial instruments:
• credit risk• liquidity risk• market risks; and• operational risks
This note presents information about the Group’s exposure to each of the above risks, the Group’s objectives, policies and processes for measuring and managing risk, and the Group’s management of capital.
Risk management framework
The Board of Directors has overall responsibility for the establishment and oversight of the Group’s risk management framework. The Board has established the Group Asset and Liability (ALCO), Credit and Operational Risk committees, which are responsible for developing and monitoring Group risk management policies in their specified areas.
All Board committees have both executive and non-executive members and report regularly to the Board of Directors on their activities.
The Group’s risk management policies are established to identify and analyse the risks faced by the Group, to set appropriate risk limits and controls, and to monitor risks and adherence to limits. Risk management policies and systems are reviewed regularly to reflect changes in market conditions, products and services offered. The Group, through its training and management standards and procedures, aims to develop a disciplined and constructive control environment, in which all employees understand their roles and obligations.
The Group Risk Management Committee is responsible for monitoring compliance with the Group’s risk management policies and procedures, and for reviewing the adequacy of the risk management framework in relation to the risks faced by the Group. The Group Audit Committee is assisted in these functions by Internal Audit. Internal Audit undertakes both regular and ad-hoc reviews of risk management controls and procedures, the results of which are reported to the Audit Committee.
ANNUAL REPORT 201642
(a) Credit risk
Credit risk is the risk of financial loss to the Group if a customer or counterparty to a financial instrument fails to meet its contractual obligations, and arises principally from the Group’s loans and advances to customers and other banks and investment securities. For risk management reporting purposes, the Group considers and consolidates all elements of credit risk exposure.
For risk management purposes, credit risk arising on trading securities is managed independently, but reported as a component of market risk exposure.
Management of credit risk
The Board of Directors has delegated responsibility for the management of credit risk to its Group Credit Committee. A separate Group Credit department, reporting to the Group Credit Committee, is responsible for oversight of the Group’s credit risk, including:
• Formulating credit policies in consultation with business units, covering collateral requirements, credit assessment, risk grading and reporting, documentary and legal procedures, and compliance with regulatory and statutory requirements.
• Establishing the authorisation structure for the approval and renewal of credit facilities. Authorisation limits are allocated to business unit Credit Officers. Larger facilities require approval by Group Credit Department, Head of Group Credit, Group Credit Committee or the Board of Directors as appropriate.
• Reviewing and assessing credit risk. Group Credit Department assesses all credit exposures in excess of designated limits, prior to facilities being committed to customers by the business unit concerned. Renewals and reviews of facilities are subject to the same review process.
• Limiting concentrations of exposure to counterparties, geographies and industries (for loans and advances), and by issuer, credit rating band, market liquidity and country (for investment securities).
• Developing and maintaining the Group’s risk grading in order to categorise exposures according to the degree of risk of financial loss faced and to focus management on the attendant risks. The risk grading system is used in determining where impairment provisions may be required against specific credit exposures. The current risk grading framework consists of eight grades reflecting varying degrees of risk of default and the availability of collateral or other credit risk mitigation. The responsibility for setting risk grades lies with the final approving
ANNUAL REPORT 2016 43
executive / committee as appropriate. Risk grades are subject to regular reviews by Group Risk Management Department.
• Reviewing compliance of business units with agreed exposure limits, including those for selected industries, country risk and product types. Regular reports are provided to Group Credit Department on the credit quality of local portfolios and appropriate corrective action is taken.
• Providing advice, guidance and specialist skills to business units to promote best practice throughout the Group in the management of credit risk.
Each business unit is required to implement Group credit policies and procedures, with credit approval authorities delegated from the Group Credit Committee. Each business unit has a Chief Credit Risk officer who reports on all credit related matters to local management and the Group Credit Committee. Each business unit is responsible for the quality and performance of its credit portfolio and for monitoring and controlling all credit risks in its portfolios, including those subject to central approval.
Regular audits of business units and Group Credit processes are undertaken by Internal Audit.
ANNUAL REPORT 201644
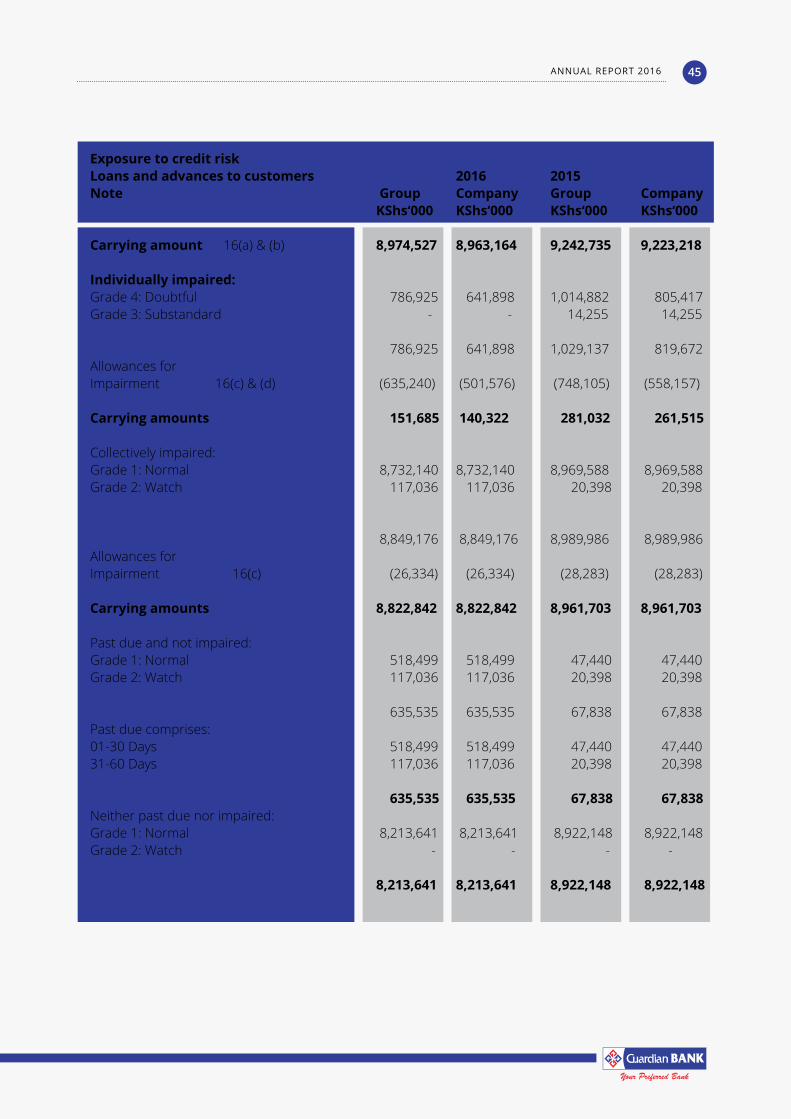
Exposure to credit riskLoans and advances to customers 2016 2015Note Group Company Group Company KShs‘000 KShs‘000 KShs‘000 KShs‘000
Carrying amount 16(a) & (b) 8,974,527 8,963,164 9,242,735 9,223,218
Individually impaired: Grade 4: Doubtful 786,925 641,898 1,014,882 805,417 Grade 3: Substandard - - 14,255 14,255
786,925 641,898 1,029,137 819,672 Allowances forImpairment 16(c) & (d) (635,240) (501,576) (748,105) (558,157)
Carrying amounts 151,685 140,322 281,032 261,515
Collectively impaired:Grade 1: Normal 8,732,140 8,732,140 8,969,588 8,969,588 Grade 2: Watch 117,036 117,036 20,398 20,398 8,849,176 8,849,176 8,989,986 8,989,986 Allowances for Impairment 16(c) (26,334) (26,334) (28,283) (28,283)
Carrying amounts 8,822,842 8,822,842 8,961,703 8,961,703
Past due and not impaired:Grade 1: Normal 518,499 518,499 47,440 47,440 Grade 2: Watch 117,036 117,036 20,398 20,398 635,535 635,535 67,838 67,838 Past due comprises: 01-30 Days 518,499 518,499 47,440 47,440 31-60 Days 117,036 117,036 20,398 20,398
635,535 635,535 67,838 67,838 Neither past due nor impaired:Grade 1: Normal 8,213,641 8,213,641 8,922,148 8,922,148Grade 2: Watch - - - - 8,213,641 8,213,641 8,922,148 8,922,148
ANNUAL REPORT 2016 45
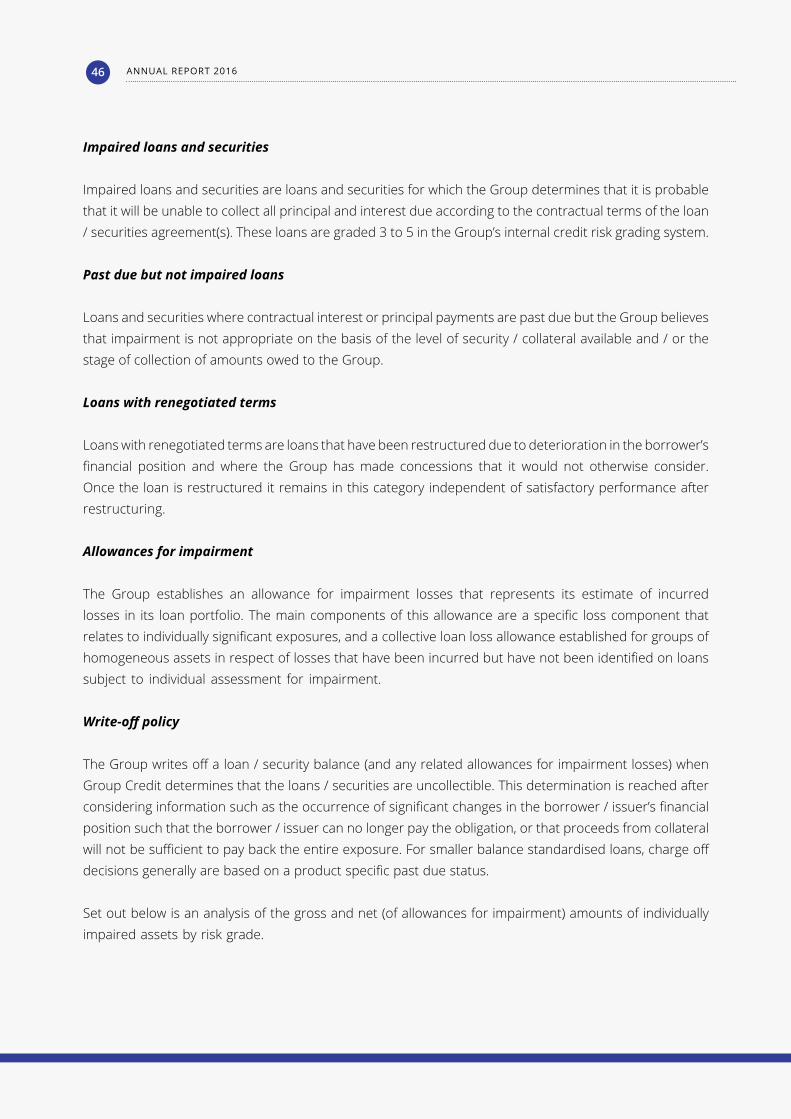
Impaired loans and securities
Impaired loans and securities are loans and securities for which the Group determines that it is probable that it will be unable to collect all principal and interest due according to the contractual terms of the loan / securities agreement(s). These loans are graded 3 to 5 in the Group’s internal credit risk grading system. Past due but not impaired loans
Loans and securities where contractual interest or principal payments are past due but the Group believes that impairment is not appropriate on the basis of the level of security / collateral available and / or the stage of collection of amounts owed to the Group.
Loans with renegotiated terms
Loans with renegotiated terms are loans that have been restructured due to deterioration in the borrower’s financial position and where the Group has made concessions that it would not otherwise consider. Once the loan is restructured it remains in this category independent of satisfactory performance after restructuring.
Allowances for impairment
The Group establishes an allowance for impairment losses that represents its estimate of incurred losses in its loan portfolio. The main components of this allowance are a specific loss component that relates to individually significant exposures, and a collective loan loss allowance established for groups of homogeneous assets in respect of losses that have been incurred but have not been identified on loans subject to individual assessment for impairment.
Write-offpolicy
The Group writes off a loan / security balance (and any related allowances for impairment losses) when Group Credit determines that the loans / securities are uncollectible. This determination is reached after considering information such as the occurrence of significant changes in the borrower / issuer’s financial position such that the borrower / issuer can no longer pay the obligation, or that proceeds from collateral will not be sufficient to pay back the entire exposure. For smaller balance standardised loans, charge off decisions generally are based on a product specific past due status.
Set out below is an analysis of the gross and net (of allowances for impairment) amounts of individually impaired assets by risk grade.
ANNUAL REPORT 201646
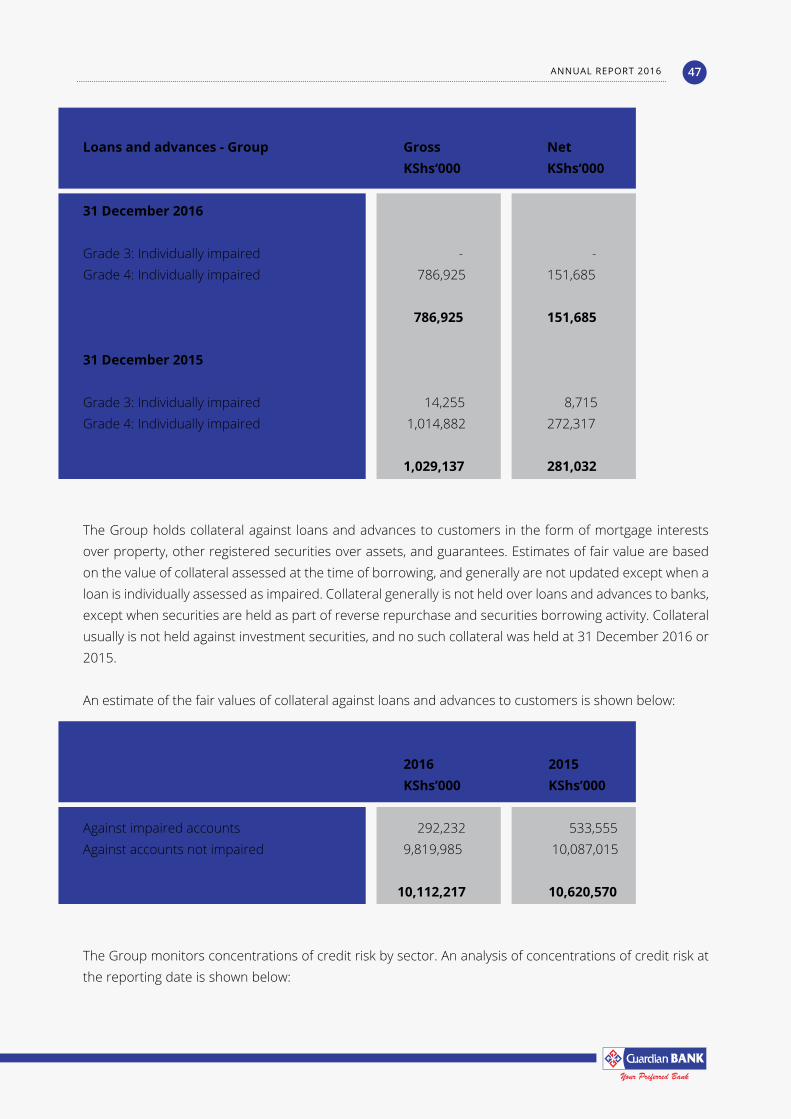
Loans and advances - Group Gross Net KShs‘000 KShs‘000
31 December 2016
Grade 3: Individually impaired - -Grade 4: Individually impaired 786,925 151,685 786,925 151,685 31 December 2015
Grade 3: Individually impaired 14,255 8,715Grade 4: Individually impaired 1,014,882 272,317
1,029,137 281,032
The Group holds collateral against loans and advances to customers in the form of mortgage interests over property, other registered securities over assets, and guarantees. Estimates of fair value are based on the value of collateral assessed at the time of borrowing, and generally are not updated except when a loan is individually assessed as impaired. Collateral generally is not held over loans and advances to banks, except when securities are held as part of reverse repurchase and securities borrowing activity. Collateral usually is not held against investment securities, and no such collateral was held at 31 December 2016 or 2015.
An estimate of the fair values of collateral against loans and advances to customers is shown below:
2016 2015 KShs’000 KShs’000
Against impaired accounts 292,232 533,555 Against accounts not impaired 9,819,985 10,087,015
10,112,217 10,620,570
The Group monitors concentrations of credit risk by sector. An analysis of concentrations of credit risk at the reporting date is shown below:
ANNUAL REPORT 2016 47
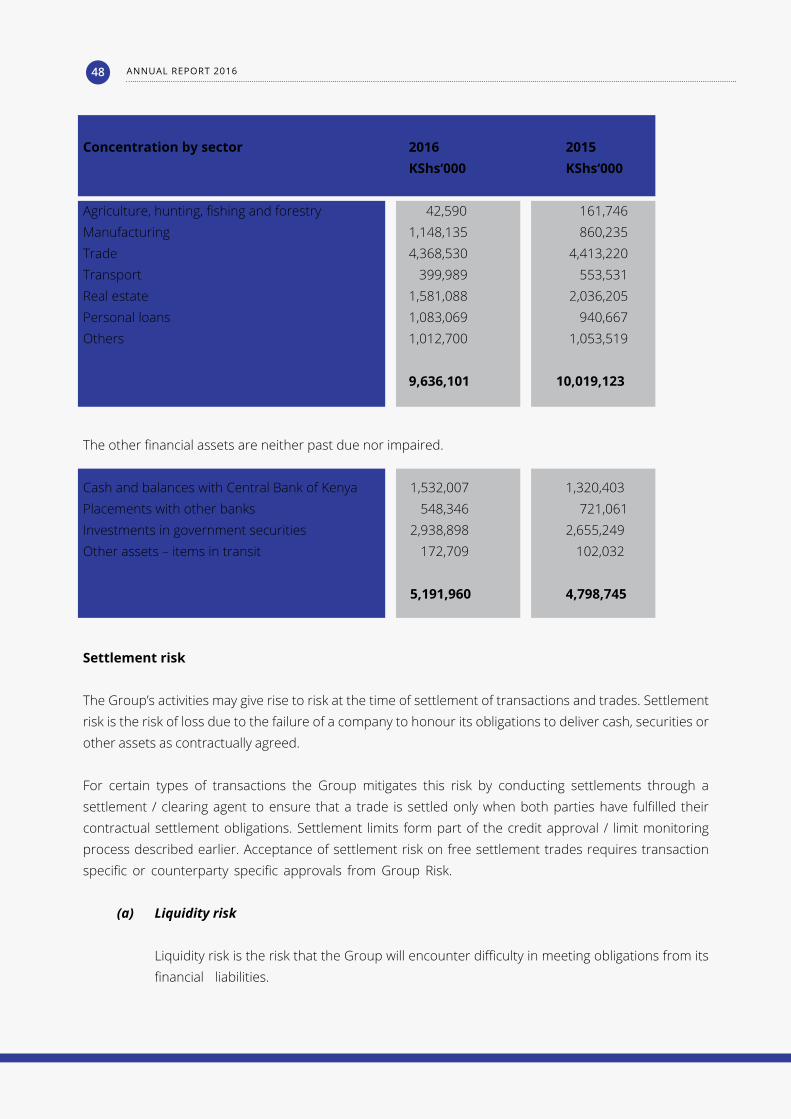
Concentration by sector 2016 2015 KShs‘000 KShs‘000
Agriculture, hunting, fishing and forestry 42,590 161,746 Manufacturing 1,148,135 860,235 Trade 4,368,530 4,413,220 Transport 399,989 553,531 Real estate 1,581,088 2,036,205 Personal loans 1,083,069 940,667 Others 1,012,700 1,053,519
9,636,101 10,019,123
The other financial assets are neither past due nor impaired.
Cash and balances with Central Bank of Kenya 1,532,007 1,320,403 Placements with other banks 548,346 721,061 Investments in government securities 2,938,898 2,655,249 Other assets – items in transit 172,709 102,032
5,191,960 4,798,745
Settlement risk
The Group’s activities may give rise to risk at the time of settlement of transactions and trades. Settlement risk is the risk of loss due to the failure of a company to honour its obligations to deliver cash, securities or other assets as contractually agreed.
For certain types of transactions the Group mitigates this risk by conducting settlements through a settlement / clearing agent to ensure that a trade is settled only when both parties have fulfilled their contractual settlement obligations. Settlement limits form part of the credit approval / limit monitoring process described earlier. Acceptance of settlement risk on free settlement trades requires transaction specific or counterparty specific approvals from Group Risk.
(a) Liquidity risk
Liquidity risk is the risk that the Group will encounter difficulty in meeting obligations from its financial liabilities.
ANNUAL REPORT 201648
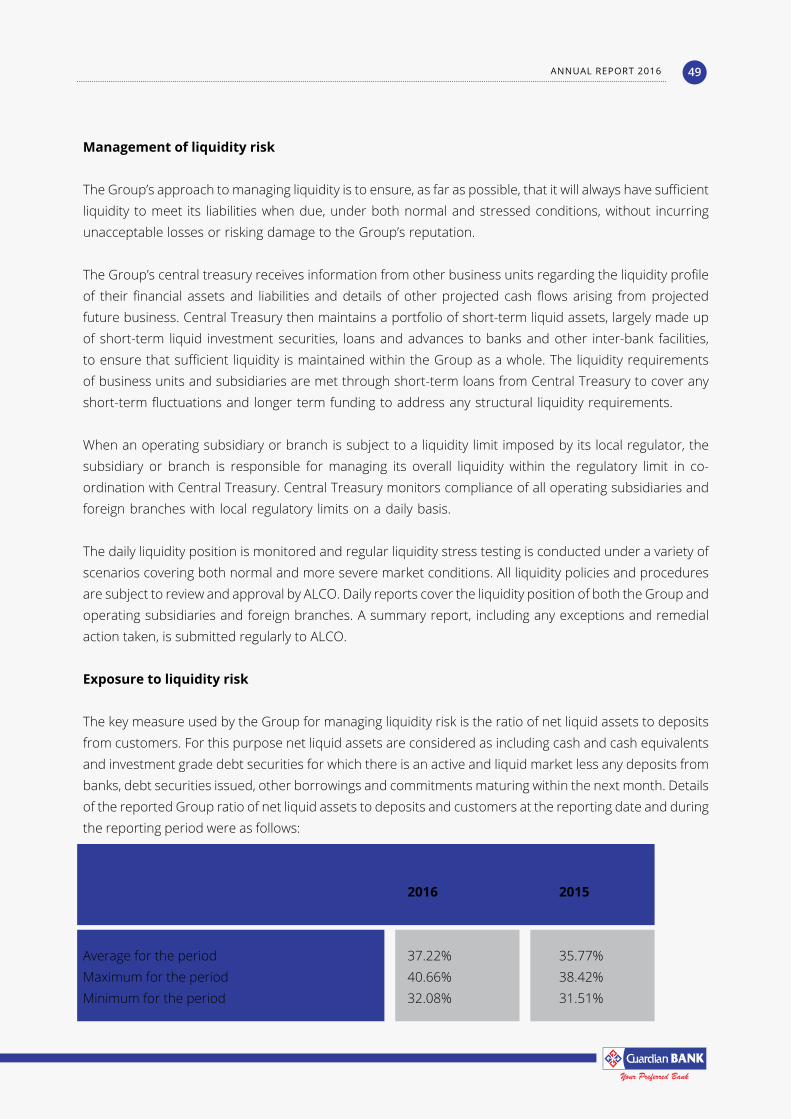
Management of liquidity risk
The Group’s approach to managing liquidity is to ensure, as far as possible, that it will always have sufficient liquidity to meet its liabilities when due, under both normal and stressed conditions, without incurring unacceptable losses or risking damage to the Group’s reputation.
The Group’s central treasury receives information from other business units regarding the liquidity profile of their financial assets and liabilities and details of other projected cash flows arising from projected future business. Central Treasury then maintains a portfolio of short-term liquid assets, largely made up of short-term liquid investment securities, loans and advances to banks and other inter-bank facilities, to ensure that sufficient liquidity is maintained within the Group as a whole. The liquidity requirements of business units and subsidiaries are met through short-term loans from Central Treasury to cover any short-term fluctuations and longer term funding to address any structural liquidity requirements.
When an operating subsidiary or branch is subject to a liquidity limit imposed by its local regulator, the subsidiary or branch is responsible for managing its overall liquidity within the regulatory limit in co-ordination with Central Treasury. Central Treasury monitors compliance of all operating subsidiaries and foreign branches with local regulatory limits on a daily basis.
The daily liquidity position is monitored and regular liquidity stress testing is conducted under a variety of scenarios covering both normal and more severe market conditions. All liquidity policies and procedures are subject to review and approval by ALCO. Daily reports cover the liquidity position of both the Group and operating subsidiaries and foreign branches. A summary report, including any exceptions and remedial action taken, is submitted regularly to ALCO.
Exposure to liquidity risk
The key measure used by the Group for managing liquidity risk is the ratio of net liquid assets to deposits from customers. For this purpose net liquid assets are considered as including cash and cash equivalents and investment grade debt securities for which there is an active and liquid market less any deposits from banks, debt securities issued, other borrowings and commitments maturing within the next month. Details of the reported Group ratio of net liquid assets to deposits and customers at the reporting date and during the reporting period were as follows:
2016 2015
Average for the period 37.22% 35.77% Maximum for the period 40.66% 38.42% Minimum for the period 32.08% 31.51%
ANNUAL REPORT 2016 49
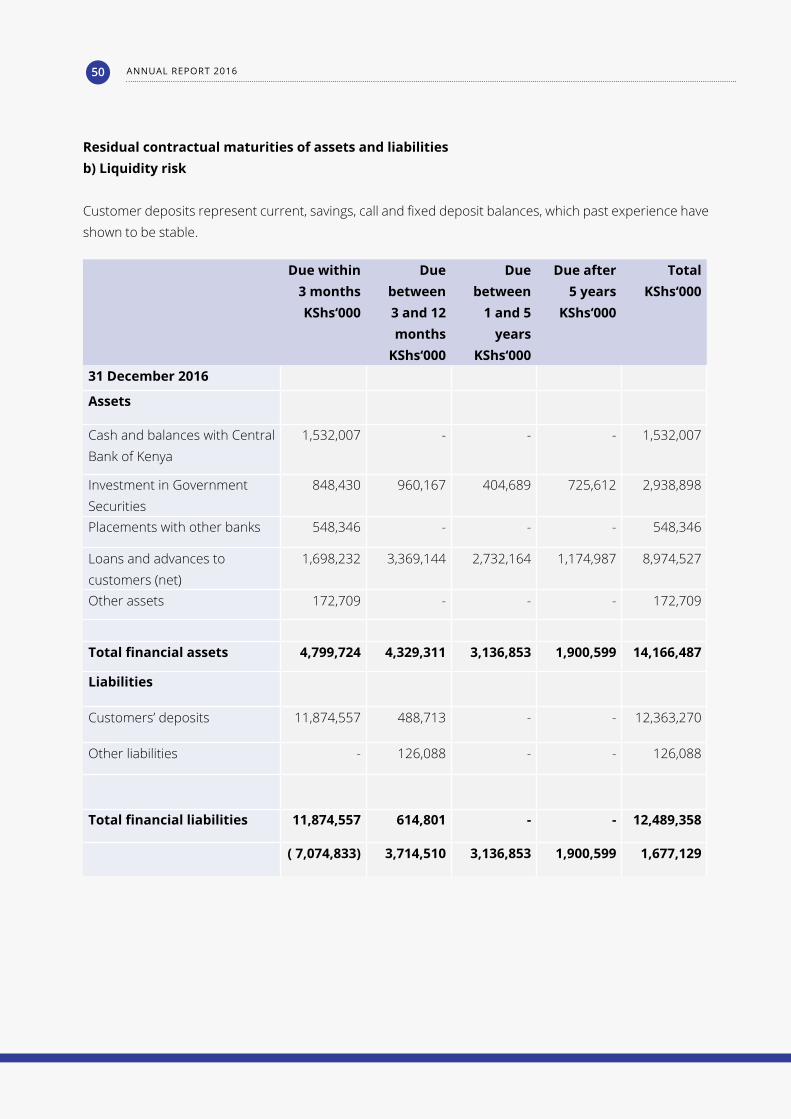
Residual contractual maturities of assets and liabilitiesb) Liquidity risk
Customer deposits represent current, savings, call and fixed deposit balances, which past experience have shown to be stable.
Due within3 monthsKShs‘000
Due between 3 and 12 months
KShs‘000
Due between
1 and 5 years
KShs‘000
Due after5 years
KShs‘000
TotalKShs‘000
31 December 2016
Assets
Cash and balances with Central Bank of Kenya
1,532,007 - - - 1,532,007
Investment in Government Securities
848,430 960,167 404,689 725,612 2,938,898
Placements with other banks 548,346 - - - 548,346
Loans and advances to customers (net)
1,698,232 3,369,144 2,732,164 1,174,987 8,974,527
Other assets 172,709 - - - 172,709
Total financial assets 4,799,724 4,329,311 3,136,853 1,900,599 14,166,487
Liabilities
Customers’ deposits 11,874,557 488,713 - - 12,363,270
Other liabilities - 126,088 - - 126,088
Total financial liabilities 11,874,557 614,801 - - 12,489,358
( 7,074,833) 3,714,510 3,136,853 1,900,599 1,677,129
ANNUAL REPORT 201650
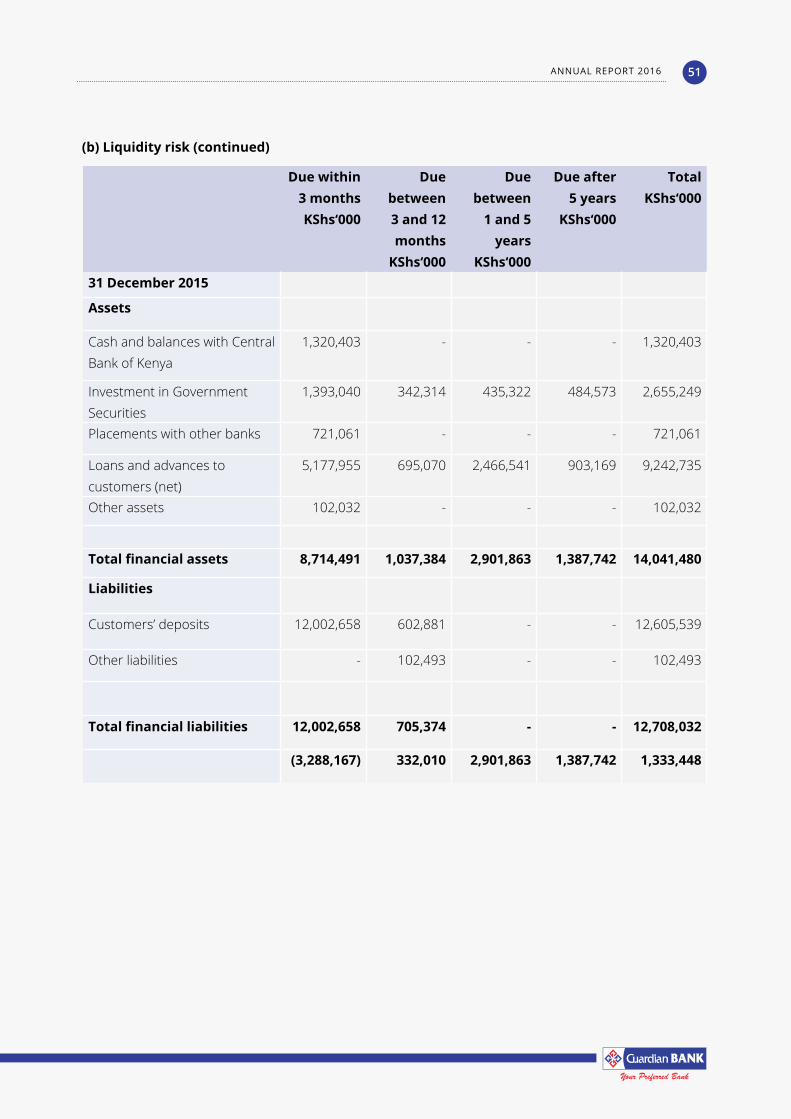
(b) Liquidity risk (continued)
Due within3 monthsKShs‘000
Due between 3 and 12 months
KShs‘000
Due between
1 and 5 years
KShs‘000
Due after5 years
KShs‘000
TotalKShs‘000
31 December 2015
Assets
Cash and balances with Central Bank of Kenya
1,320,403 - - - 1,320,403
Investment in Government Securities
1,393,040 342,314 435,322 484,573 2,655,249
Placements with other banks 721,061 - - - 721,061
Loans and advances to customers (net)
5,177,955 695,070 2,466,541 903,169 9,242,735
Other assets 102,032 - - - 102,032
Total financial assets 8,714,491 1,037,384 2,901,863 1,387,742 14,041,480
Liabilities
Customers’ deposits 12,002,658 602,881 - - 12,605,539
Other liabilities - 102,493 - - 102,493
Total financial liabilities 12,002,658 705,374 - - 12,708,032
(3,288,167) 332,010 2,901,863 1,387,742 1,333,448
ANNUAL REPORT 2016 51
The previous table shows the undiscounted cash flows on the Group’s financial liabilities and unrecognised loan commitments on the basis of their earliest possible contractual maturity. The Group’s expected cash flows on these instruments vary significantly from this analysis. For example, demand deposits from customers are expected to maintain a stable or increasing balance; and unrecognised loan commitments are not all expected to be drawn down immediately.
The gross nominal inflow/(outflow) disclosed in the previous table is the contractual, undiscounted cash flow on the financial liability or commitment. The disclosure for derivatives shows a net amount for derivatives that are net settled, but a gross inflow and outflow amount for derivatives that have simultaneous gross settlement (e.g., forward exchange contracts and currency swaps).
(b) Market risk
Market risk is the risk that changes in market prices, such as interest rate, equity prices, foreign exchange rates and credit spreads (not relating to changes in the obligor’s / issuer’s credit standing) will affect the Group’s income or the value of its holdings of financial instruments. The objective of market risk management is to manage and control market risk exposures within acceptable parameters, while optimising the return on risk.
Management of market risks
The Group separates its exposure to market risk between trading and non-trading portfolios. Trading portfolios mainly are held by the corporate banking unit, and include positions arising from market making and proprietary position taking, together with financial assets and liabilities that are managed on a fair value basis.
With the exception of translation risk arising on the Group’s net investment in its foreign operations, all foreign exchange risk within the Group is transferred and sold down by Central Treasury to the corporate Banking unit. Accordingly, the foreign exchange position is treated as part of the Group’s trading portfolios for risk management purposes.
Overall authority for market risk is vested in ALCO. Group Risk is responsible for the development of detailed risk management policies (subject to review and approval by ALCO) and for the day-to-day review of their implementation.
Exposure to interest rate risk – non-trading portfolios
The principal risk to which non-trading portfolios are exposed is the risk of loss from fluctuations in the future cash flows or fair values of financial instrument because of a change in market interest rates. Interest rate risk is managed principally through monitoring interest rate gaps and by having
ANNUAL REPORT 201652
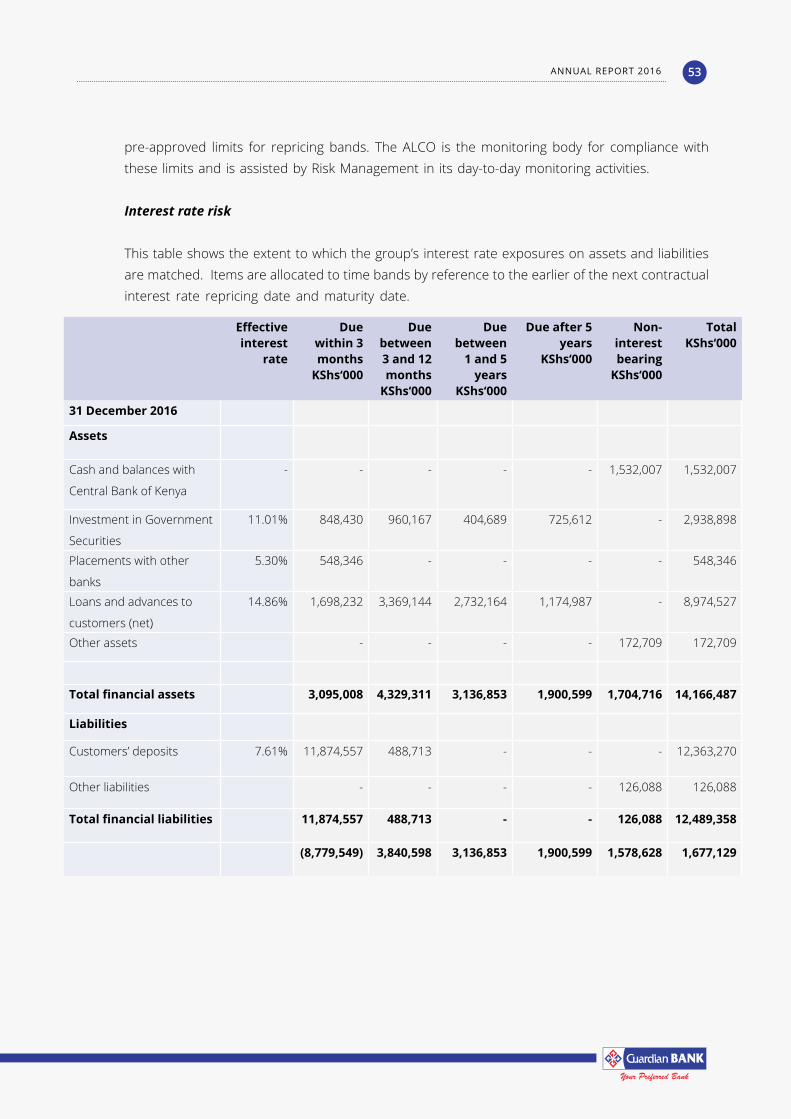
pre-approved limits for repricing bands. The ALCO is the monitoring body for compliance with these limits and is assisted by Risk Management in its day-to-day monitoring activities.
Interest rate risk
This table shows the extent to which the group’s interest rate exposures on assets and liabilities are matched. Items are allocated to time bands by reference to the earlier of the next contractual interest rate repricing date and maturity date.
Effective interest
rate
Due within 3 months
KShs‘000
Due between 3 and 12 months
KShs‘000
Due between
1 and 5 years
KShs‘000
Due after 5 years
KShs‘000
Non-interest bearing
KShs‘000
TotalKShs‘000
31 December 2016
Assets
Cash and balances with
Central Bank of Kenya
- - - - - 1,532,007 1,532,007
Investment in Government
Securities
11.01% 848,430 960,167 404,689 725,612 - 2,938,898
Placements with other
banks
5.30% 548,346 - - - - 548,346
Loans and advances to
customers (net)
14.86% 1,698,232 3,369,144 2,732,164 1,174,987 - 8,974,527
Other assets - - - - 172,709 172,709
Total financial assets 3,095,008 4,329,311 3,136,853 1,900,599 1,704,716 14,166,487
Liabilities
Customers’ deposits 7.61% 11,874,557 488,713 - - - 12,363,270
Other liabilities - - - - 126,088 126,088
Total financial liabilities 11,874,557 488,713 - - 126,088 12,489,358
(8,779,549) 3,840,598 3,136,853 1,900,599 1,578,628 1,677,129
ANNUAL REPORT 2016 53
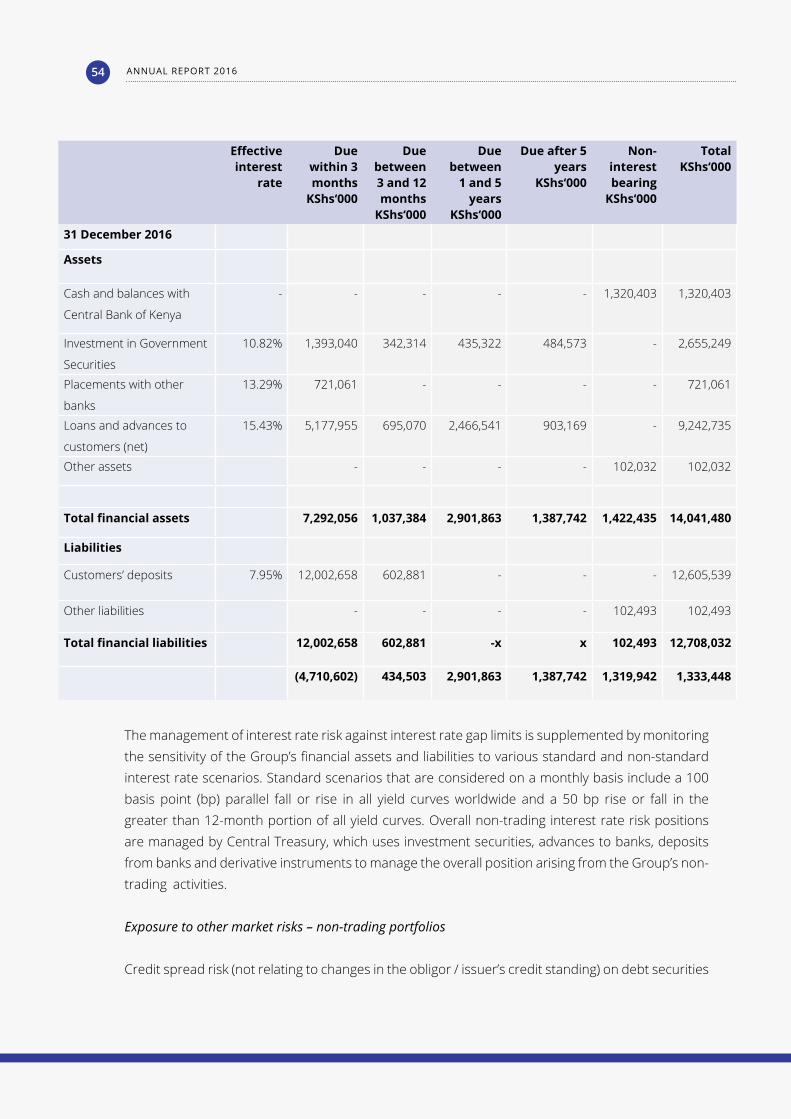
Effective interest
rate
Due within 3 months
KShs‘000
Due between 3 and 12 months
KShs‘000
Due between
1 and 5 years
KShs‘000
Due after 5 years
KShs‘000
Non-interest bearing
KShs‘000
TotalKShs‘000
31 December 2016
Assets
Cash and balances with
Central Bank of Kenya
- - - - - 1,320,403 1,320,403
Investment in Government
Securities
10.82% 1,393,040 342,314 435,322 484,573 - 2,655,249
Placements with other
banks
13.29% 721,061 - - - - 721,061
Loans and advances to
customers (net)
15.43% 5,177,955 695,070 2,466,541 903,169 - 9,242,735
Other assets - - - - 102,032 102,032
Total financial assets 7,292,056 1,037,384 2,901,863 1,387,742 1,422,435 14,041,480
Liabilities
Customers’ deposits 7.95% 12,002,658 602,881 - - - 12,605,539
Other liabilities - - - - 102,493 102,493
Total financial liabilities 12,002,658 602,881 -x x 102,493 12,708,032
(4,710,602) 434,503 2,901,863 1,387,742 1,319,942 1,333,448
The management of interest rate risk against interest rate gap limits is supplemented by monitoring the sensitivity of the Group’s financial assets and liabilities to various standard and non-standard interest rate scenarios. Standard scenarios that are considered on a monthly basis include a 100 basis point (bp) parallel fall or rise in all yield curves worldwide and a 50 bp rise or fall in the greater than 12-month portion of all yield curves. Overall non-trading interest rate risk positions are managed by Central Treasury, which uses investment securities, advances to banks, deposits from banks and derivative instruments to manage the overall position arising from the Group’s non-trading activities.
Exposuretoothermarketrisks–non-tradingportfolios
Credit spread risk (not relating to changes in the obligor / issuer’s credit standing) on debt securities
ANNUAL REPORT 201654
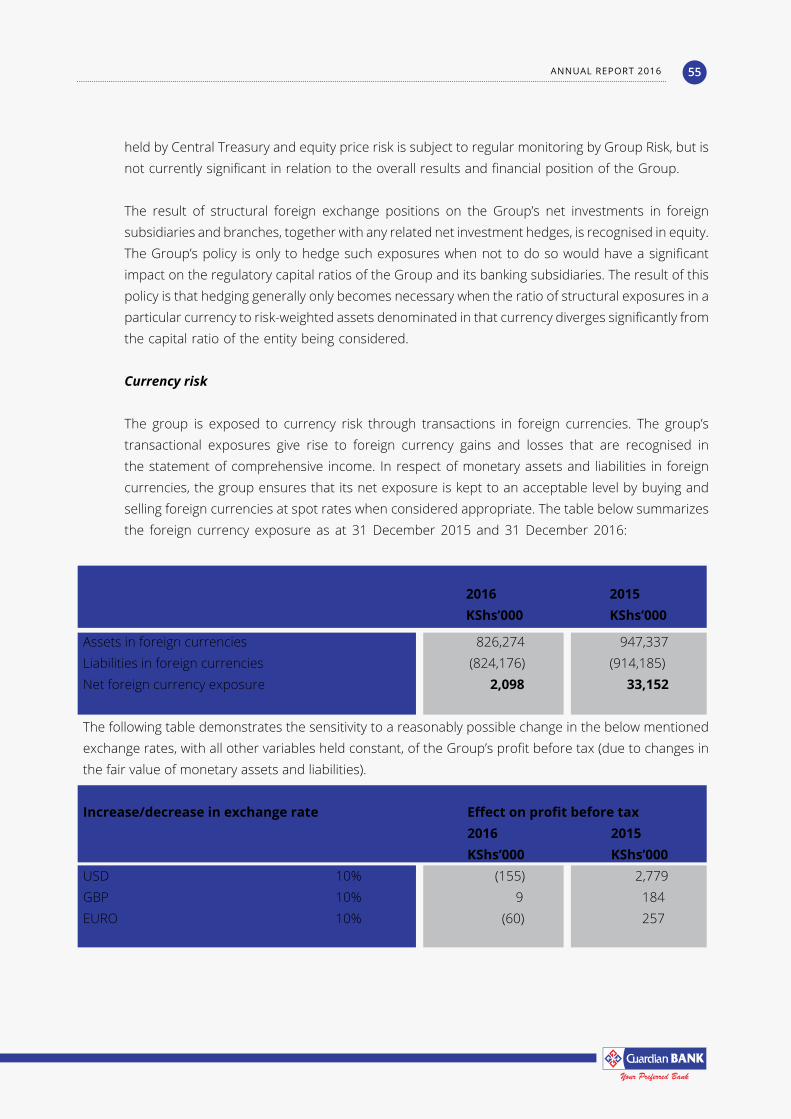
held by Central Treasury and equity price risk is subject to regular monitoring by Group Risk, but is not currently significant in relation to the overall results and financial position of the Group.
The result of structural foreign exchange positions on the Group’s net investments in foreign subsidiaries and branches, together with any related net investment hedges, is recognised in equity. The Group’s policy is only to hedge such exposures when not to do so would have a significant impact on the regulatory capital ratios of the Group and its banking subsidiaries. The result of this policy is that hedging generally only becomes necessary when the ratio of structural exposures in a particular currency to risk-weighted assets denominated in that currency diverges significantly from the capital ratio of the entity being considered.
Currency risk
The group is exposed to currency risk through transactions in foreign currencies. The group’s transactional exposures give rise to foreign currency gains and losses that are recognised in the statement of comprehensive income. In respect of monetary assets and liabilities in foreign currencies, the group ensures that its net exposure is kept to an acceptable level by buying and selling foreign currencies at spot rates when considered appropriate. The table below summarizes the foreign currency exposure as at 31 December 2015 and 31 December 2016:
2016 2015 KShs’000 KShs’000
Assets in foreign currencies 826,274 947,337Liabilities in foreign currencies (824,176) (914,185)Net foreign currency exposure 2,098 33,152
The following table demonstrates the sensitivity to a reasonably possible change in the below mentioned exchange rates, with all other variables held constant, of the Group’s profit before tax (due to changes in the fair value of monetary assets and liabilities).
Increase/decrease in exchange rate Effect on profit before tax 2016 2015 KShs’000 KShs’000 USD 10% (155) 2,779GBP 10% 9 184EURO 10% (60) 257
ANNUAL REPORT 2016 55
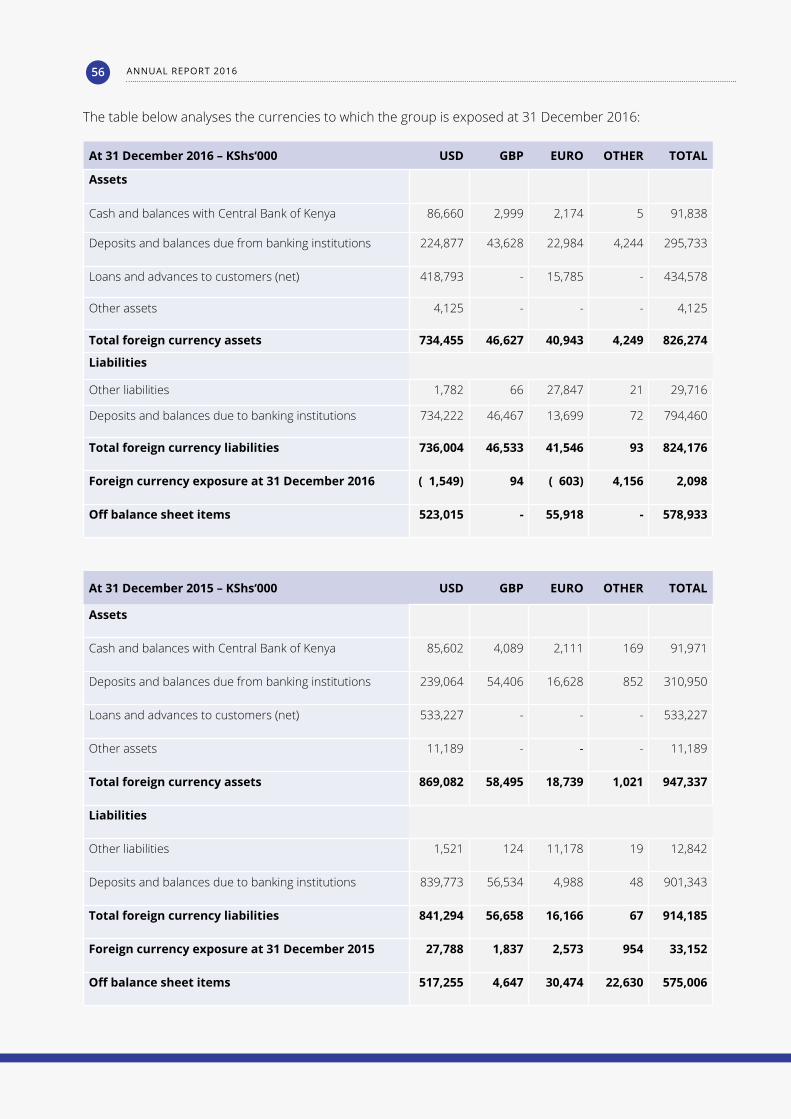
At 31 December 2016 – KShs‘000 USD GBP EURO OTHER TOTAL
Assets
Cash and balances with Central Bank of Kenya 86,660 2,999 2,174 5 91,838
Deposits and balances due from banking institutions 224,877 43,628 22,984 4,244 295,733
Loans and advances to customers (net) 418,793 - 15,785 - 434,578
Other assets 4,125 - - - 4,125
Total foreign currency assets 734,455 46,627 40,943 4,249 826,274
Liabilities
Other liabilities 1,782 66 27,847 21 29,716
Deposits and balances due to banking institutions 734,222 46,467 13,699 72 794,460
Total foreign currency liabilities 736,004 46,533 41,546 93 824,176
Foreign currency exposure at 31 December 2016 ( 1,549) 94 ( 603) 4,156 2,098
Off balance sheet items 523,015 - 55,918 - 578,933
At 31 December 2015 – KShs‘000 USD GBP EURO OTHER TOTAL
Assets
Cash and balances with Central Bank of Kenya 85,602 4,089 2,111 169 91,971
Deposits and balances due from banking institutions 239,064 54,406 16,628 852 310,950
Loans and advances to customers (net) 533,227 - - - 533,227
Other assets 11,189 - - - 11,189
Total foreign currency assets 869,082 58,495 18,739 1,021 947,337
Liabilities
Other liabilities 1,521 124 11,178 19 12,842
Deposits and balances due to banking institutions 839,773 56,534 4,988 48 901,343
Total foreign currency liabilities 841,294 56,658 16,166 67 914,185
Foreign currency exposure at 31 December 2015 27,788 1,837 2,573 954 33,152
Off balance sheet items 517,255 4,647 30,474 22,630 575,006
The table below analyses the currencies to which the group is exposed at 31 December 2016:
ANNUAL REPORT 201656
(c) Operational risk
Operational risk is the risk of direct or indirect loss arising from a wide variety of causes associated with the Group’s processes, personnel, technology and infrastructure, and from external factors other than credit, market and liquidity risks such as those arising from legal and regulatory requirements and generally accepted standards of corporate behaviour. Operational risks arise from all of the Group’s operations and are faced by all business entities.
The Group’s objective is to manage operational risk so as to balance the avoidance of financial losses and damage to the Group’s reputation with overall cost effectiveness and to avoid control procedures that restrict initiative and creativity.
The primary responsibility for the development and implementation of controls to address operational risk is assigned to senior management within each business unit. This responsibility is supported by the development of overall Group standards for the management of operational risk in the following areas:
• requirements for appropriate segregation of duties, including the independent authorisation of transactions
• requirements for the reconciliation and monitoring of transactions• compliance with regulatory and other legal requirements • documentation of controls and procedures• requirements for the periodic assessment of operational risks faced, and the
adequacy of controls and procedures to address the risks identified• requirements for the reporting of operational losses and proposed remedial action• development of contingency plans• training and professional development• ethical and business standards• risk mitigation, including insurance where this is effective.
Compliance with Group standards is supported by a programme of periodic reviews undertaken by Internal Audit. The results of Internal Audit reviews are discussed with the management of the business unit to which they relate, with summaries submitted to the Audit Committee and senior management of the Group.
(d) Capital management
Regulatory capital
The Central Bank of Kenya sets and monitors capital requirements for the Group as a whole. The
ANNUAL REPORT 2016 57
parent company and individual banking operations are directly supervised by the regulator.
In implementing current capital requirements, the Central Bank of Kenya requires the Group to maintain a prescribed ratio of total capital to total risk-weighted assets. The Group calculates requirements for market risk in its trading portfolios based upon the Group’s value at risk (VaR) models and uses its internal grading as the basis for risk weightings for credit risk.
The Group’s regulatory capital is analysed into two tiers:
• Tier 1 capital, which includes ordinary share capital, share premium, perpetual bonds (which are classified as innovative Tier 1 securities), retained earnings, translation reserve and minority interests after deductions for goodwill and intangible assets, and other regulatory adjustments relating to items that are included in equity but are treated differently for capital adequacy purposes.
• Tier 2 capital, which includes qualifying subordinated liabilities, collective impairment allowances and the element of the fair value reserve relating to unrealised gains on equity instruments classified as available-for-sale.
Various limits are applied to elements of the capital base. The amount of innovative tier 1 securities cannot exceed 15 percent of total tier 1 capital; qualifying tier 2 capital cannot exceed tier 1 capital; and qualifying term subordinated loan capital may not exceed 50 percent of tier 1 capital. There also are restrictions on the amount of collective impairment allowances that may be included as part of tier 2 capital. Other deductions from capital include the carrying amounts of investments in subsidiaries that are not included in the regulatory consolidation, investments in the capital of banks and certain other regulatory items.
Banking operations are categorised as either trading book or banking book, and risk-weighted assets are determined according to specified requirements that seek to reflect the varying levels of risk attached to assets and off-balance sheet exposures.
The Group’s policy is to maintain a strong capital base so as to maintain investor, creditor and market confidence and to sustain future development of the business. The impact of the level of capital on shareholders’ return is also recognised and the Group recognises the need to maintain a balance between the higher returns that might be possible with greater gearing and the advantages and security afforded by a sound capital position.
The Group and its individually regulated operations have complied with all externally imposed capital requirements throughout the period.
ANNUAL REPORT 201658
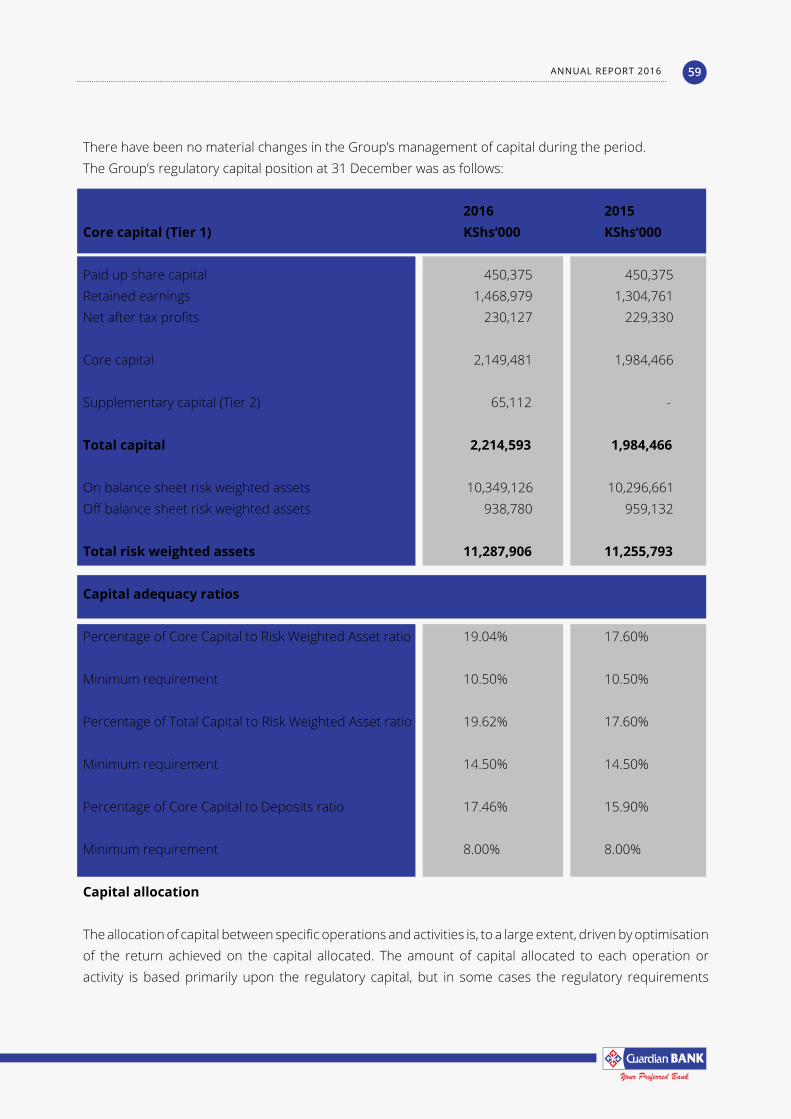
There have been no material changes in the Group’s management of capital during the period.The Group’s regulatory capital position at 31 December was as follows:
2016 2015Core capital (Tier 1) KShs‘000 KShs‘000
Paid up share capital 450,375 450,375 Retained earnings 1,468,979 1,304,761 Net after tax profits 230,127 229,330 Core capital 2,149,481 1,984,466
Supplementary capital (Tier 2) 65,112 - Total capital 2,214,593 1,984,466
On balance sheet risk weighted assets 10,349,126 10,296,661 Off balance sheet risk weighted assets 938,780 959,132
Total risk weighted assets 11,287,906 11,255,793
Capital adequacy ratios
Percentage of Core Capital to Risk Weighted Asset ratio 19.04% 17.60%
Minimum requirement 10.50% 10.50%
Percentage of Total Capital to Risk Weighted Asset ratio 19.62% 17.60%
Minimum requirement 14.50% 14.50%
Percentage of Core Capital to Deposits ratio 17.46% 15.90%
Minimum requirement 8.00% 8.00%
Capital allocation
The allocation of capital between specific operations and activities is, to a large extent, driven by optimisation of the return achieved on the capital allocated. The amount of capital allocated to each operation or activity is based primarily upon the regulatory capital, but in some cases the regulatory requirements
ANNUAL REPORT 2016 59
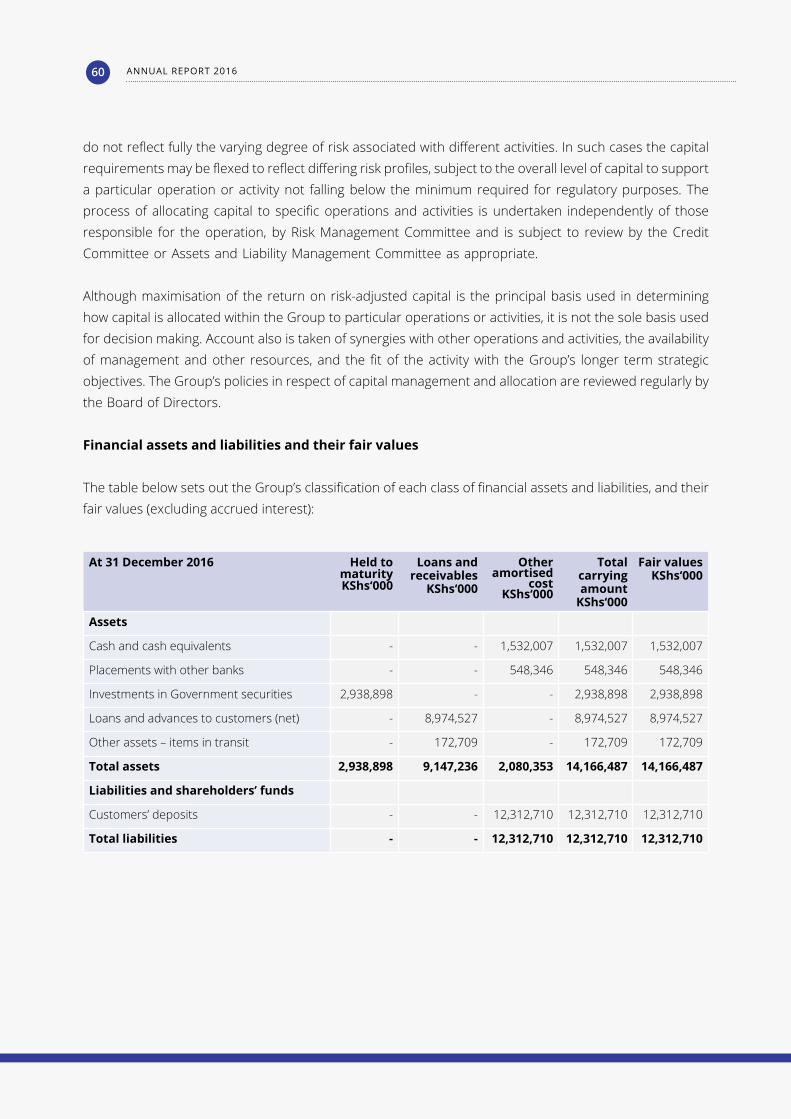
do not reflect fully the varying degree of risk associated with different activities. In such cases the capital requirements may be flexed to reflect differing risk profiles, subject to the overall level of capital to support a particular operation or activity not falling below the minimum required for regulatory purposes. The process of allocating capital to specific operations and activities is undertaken independently of those responsible for the operation, by Risk Management Committee and is subject to review by the Credit Committee or Assets and Liability Management Committee as appropriate.
Although maximisation of the return on risk-adjusted capital is the principal basis used in determining how capital is allocated within the Group to particular operations or activities, it is not the sole basis used for decision making. Account also is taken of synergies with other operations and activities, the availability of management and other resources, and the fit of the activity with the Group’s longer term strategic objectives. The Group’s policies in respect of capital management and allocation are reviewed regularly by the Board of Directors.
Financial assets and liabilities and their fair values
The table below sets out the Group’s classification of each class of financial assets and liabilities, and their fair values (excluding accrued interest):
At 31 December 2016 Held tomaturityKShs‘000
Loans andreceivables
KShs‘000
Otheramortised
costKShs‘000
Totalcarryingamount
KShs‘000
Fair valuesKShs‘000
Assets
Cash and cash equivalents - - 1,532,007 1,532,007 1,532,007
Placements with other banks - - 548,346 548,346 548,346
Investments in Government securities 2,938,898 - - 2,938,898 2,938,898
Loans and advances to customers (net) - 8,974,527 - 8,974,527 8,974,527
Other assets – items in transit - 172,709 - 172,709 172,709
Total assets 2,938,898 9,147,236 2,080,353 14,166,487 14,166,487
Liabilities and shareholders’ funds
Customers’ deposits - - 12,312,710 12,312,710 12,312,710
Total liabilities - - 12,312,710 12,312,710 12,312,710
ANNUAL REPORT 201660
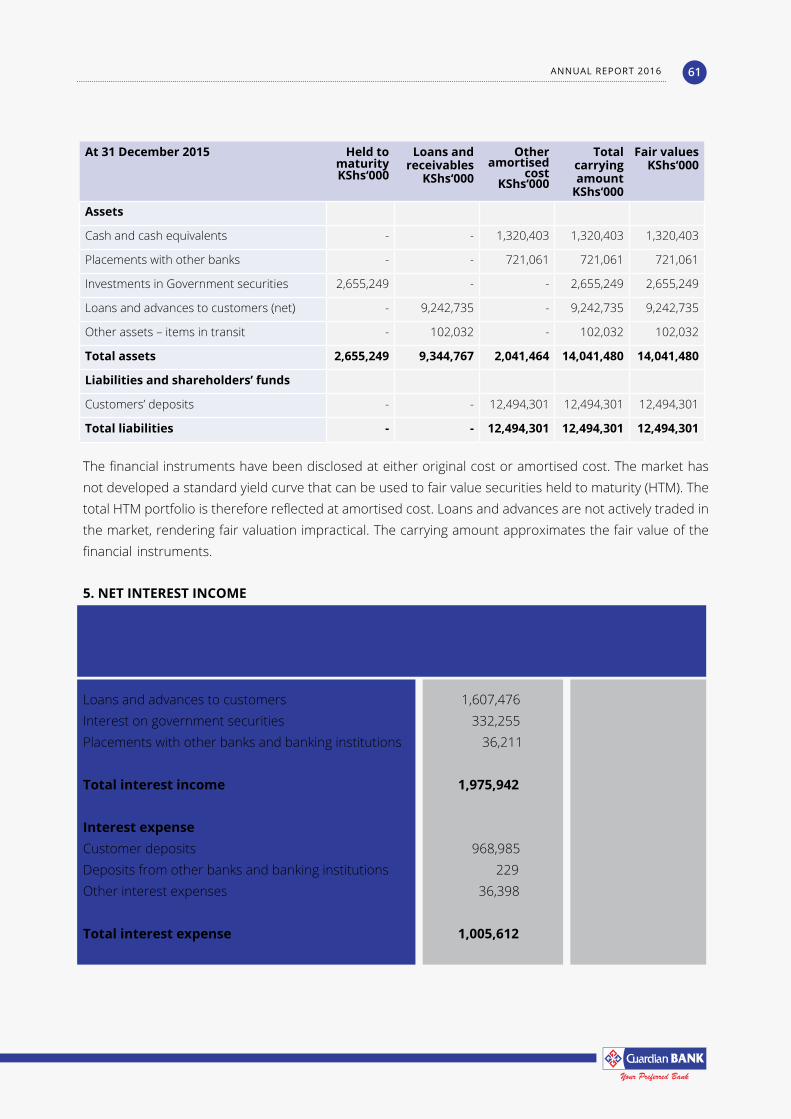
5. NET INTEREST INCOME 2016 2015 KShs‘000 KShs‘000Interest income Loans and advances to customers 1,607,476 1,630,122 Interest on government securities 332,255 301,358 Placements with other banks and banking institutions 36,211 64,797
Total interest income 1,975,942 1,996,277
Interest expenseCustomer deposits 968,985 1,024,918 Deposits from other banks and banking institutions 229 1,325 Other interest expenses 36,398 23,139
Total interest expense 1,005,612 1,049,382
The financial instruments have been disclosed at either original cost or amortised cost. The market has not developed a standard yield curve that can be used to fair value securities held to maturity (HTM). The total HTM portfolio is therefore reflected at amortised cost. Loans and advances are not actively traded in the market, rendering fair valuation impractical. The carrying amount approximates the fair value of the financial instruments.
At 31 December 2015 Held tomaturityKShs‘000
Loans andreceivables
KShs‘000
Otheramortised
costKShs‘000
Totalcarryingamount
KShs‘000
Fair valuesKShs‘000
Assets
Cash and cash equivalents - - 1,320,403 1,320,403 1,320,403
Placements with other banks - - 721,061 721,061 721,061
Investments in Government securities 2,655,249 - - 2,655,249 2,655,249
Loans and advances to customers (net) - 9,242,735 - 9,242,735 9,242,735
Other assets – items in transit - 102,032 - 102,032 102,032
Total assets 2,655,249 9,344,767 2,041,464 14,041,480 14,041,480
Liabilities and shareholders’ funds
Customers’ deposits - - 12,494,301 12,494,301 12,494,301
Total liabilities - - 12,494,301 12,494,301 12,494,301
ANNUAL REPORT 2016 61
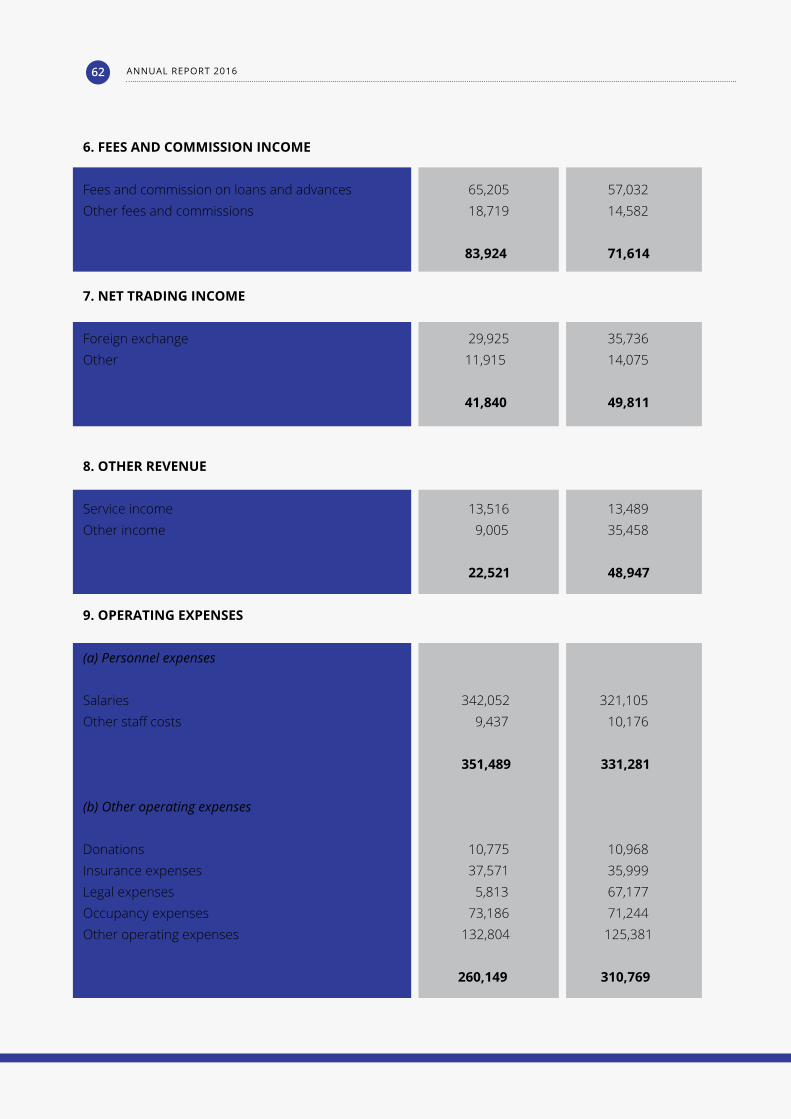
6. FEES AND COMMISSION INCOME
Fees and commission on loans and advances 65,205 57,032 Other fees and commissions 18,719 14,582
83,924 71,614
7. NET TRADING INCOME
Foreign exchange 29,925 35,736 Other 11,915 14,075
41,840 49,811
8. OTHER REVENUE
Service income 13,516 13,489 Other income 9,005 35,458 22,521 48,947
9. OPERATING EXPENSES
(a) Personnel expenses
Salaries 342,052 321,105 Other staff costs 9,437 10,176
351,489 331,281
(b) Other operating expenses Donations 10,775 10,968 Insurance expenses 37,571 35,999 Legal expenses 5,813 67,177 Occupancy expenses 73,186 71,244 Other operating expenses 132,804 125,381
260,149 310,769
ANNUAL REPORT 201662
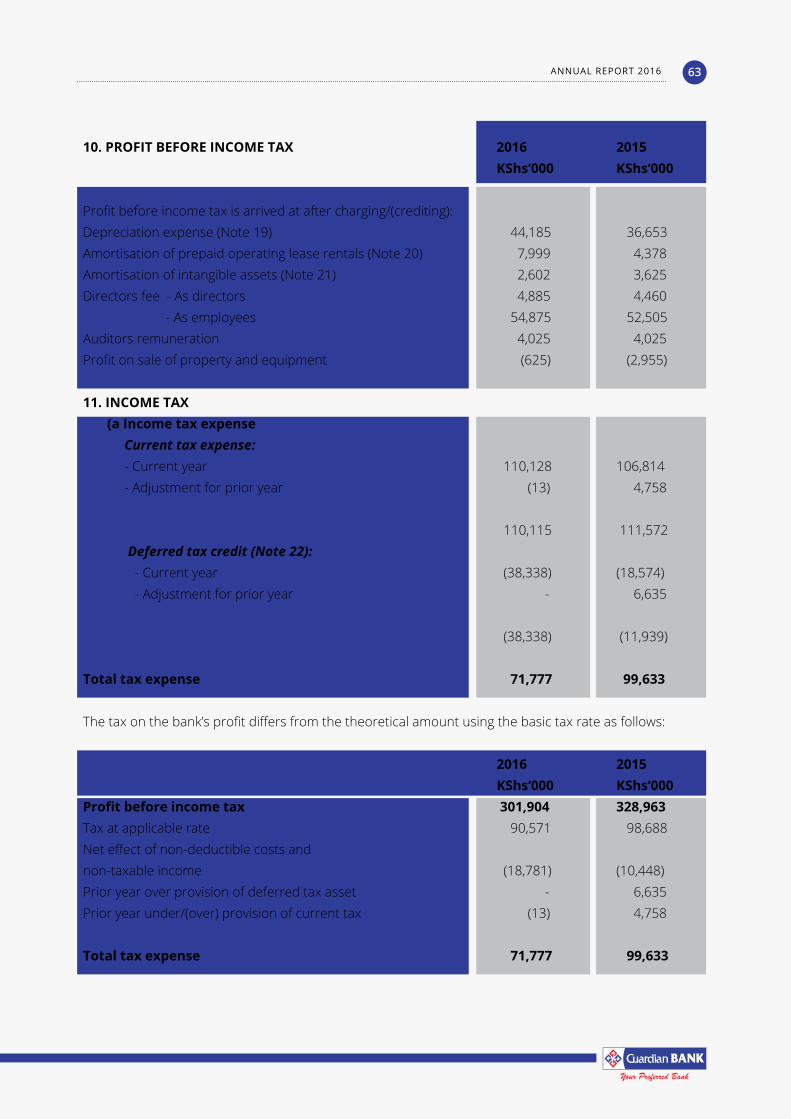
10. PROFIT BEFORE INCOME TAX 2016 2015 KShs‘000 KShs‘000
Profit before income tax is arrived at after charging/(crediting):Depreciation expense (Note 19) 44,185 36,653 Amortisation of prepaid operating lease rentals (Note 20) 7,999 4,378 Amortisation of intangible assets (Note 21) 2,602 3,625 Directors fee - As directors 4,885 4,460 - As employees 54,875 52,505 Auditors remuneration 4,025 4,025 Profit on sale of property and equipment (625) (2,955)
11. INCOME TAX (a Income tax expense Current tax expense: - Current year 110,128 106,814 - Adjustment for prior year (13) 4,758
110,115 111,572 Deferred tax credit (Note 22): - Current year (38,338) (18,574) - Adjustment for prior year - 6,635
(38,338) (11,939)
Total tax expense 71,777 99,633
The tax on the bank’s profit differs from the theoretical amount using the basic tax rate as follows: 2016 2015 KShs‘000 KShs‘000Profit before income tax 301,904 328,963 Tax at applicable rate 90,571 98,688 Net effect of non-deductible costs and non-taxable income (18,781) (10,448) Prior year over provision of deferred tax asset - 6,635 Prior year under/(over) provision of current tax (13) 4,758
Total tax expense 71,777 99,633
ANNUAL REPORT 2016 63
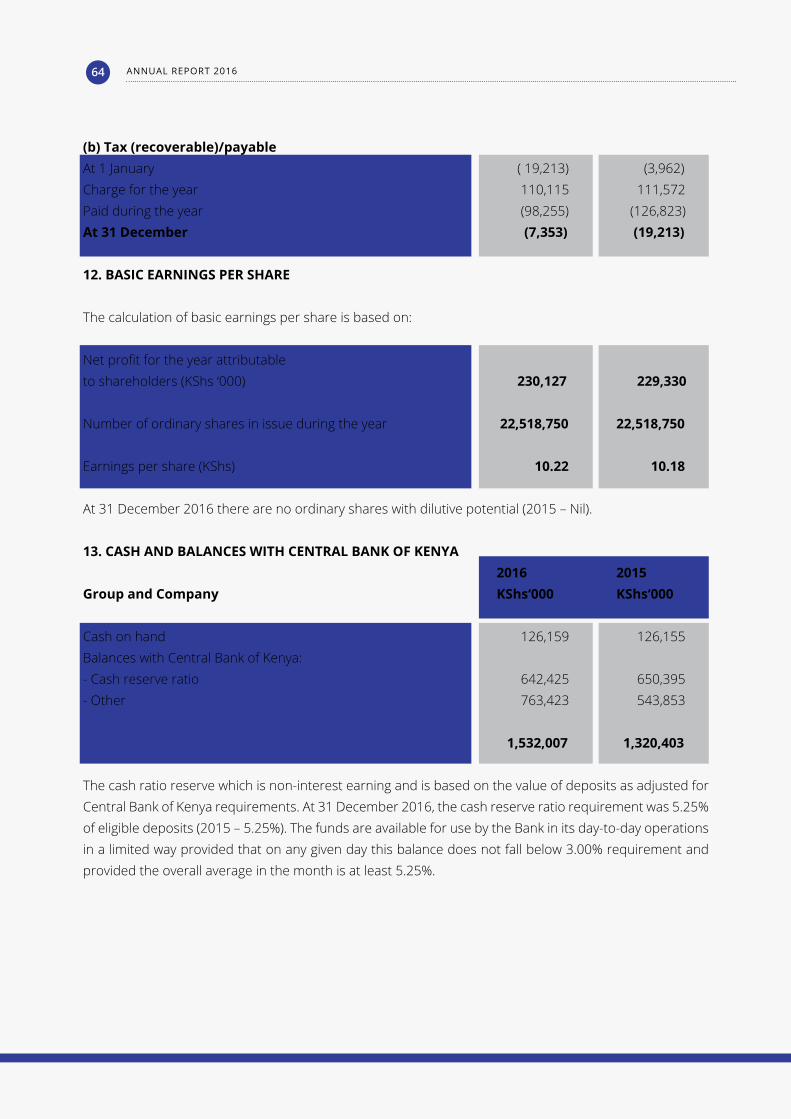
(b) Tax (recoverable)/payable At 1 January ( 19,213) (3,962) Charge for the year 110,115 111,572 Paid during the year (98,255) (126,823) At 31 December (7,353) (19,213) 12. BASIC EARNINGS PER SHARE
The calculation of basic earnings per share is based on: Net profit for the year attributableto shareholders (KShs ‘000) 230,127 229,330
Number of ordinary shares in issue during the year 22,518,750 22,518,750
Earnings per share (KShs) 10.22 10.18
At 31 December 2016 there are no ordinary shares with dilutive potential (2015 – Nil).
13. CASH AND BALANCES WITH CENTRAL BANK OF KENYA 2016 2015Group and Company KShs‘000 KShs‘000
Cash on hand 126,159 126,155 Balances with Central Bank of Kenya: - Cash reserve ratio 642,425 650,395 - Other 763,423 543,853
1,532,007 1,320,403
The cash ratio reserve which is non-interest earning and is based on the value of deposits as adjusted for Central Bank of Kenya requirements. At 31 December 2016, the cash reserve ratio requirement was 5.25% of eligible deposits (2015 – 5.25%). The funds are available for use by the Bank in its day-to-day operations in a limited way provided that on any given day this balance does not fall below 3.00% requirement and provided the overall average in the month is at least 5.25%.
ANNUAL REPORT 201664
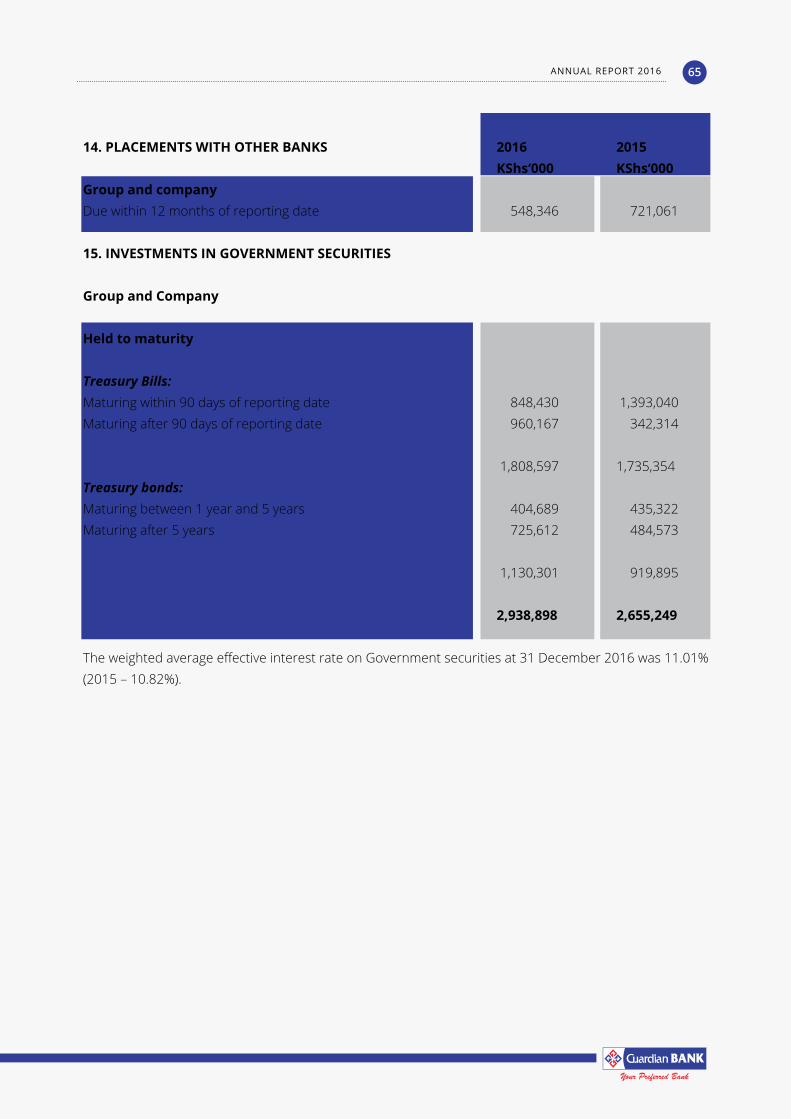
14. PLACEMENTS WITH OTHER BANKS 2016 2015 KShs‘000 KShs‘000Group and company Due within 12 months of reporting date 548,346 721,061
15. INVESTMENTS IN GOVERNMENT SECURITIES
Group and Company Held to maturity
Treasury Bills:Maturing within 90 days of reporting date 848,430 1,393,040 Maturing after 90 days of reporting date 960,167 342,314 1,808,597 1,735,354 Treasury bonds:Maturing between 1 year and 5 years 404,689 435,322 Maturing after 5 years 725,612 484,573
1,130,301 919,895
2,938,898 2,655,249
The weighted average effective interest rate on Government securities at 31 December 2016 was 11.01% (2015 – 10.82%).
ANNUAL REPORT 2016 65
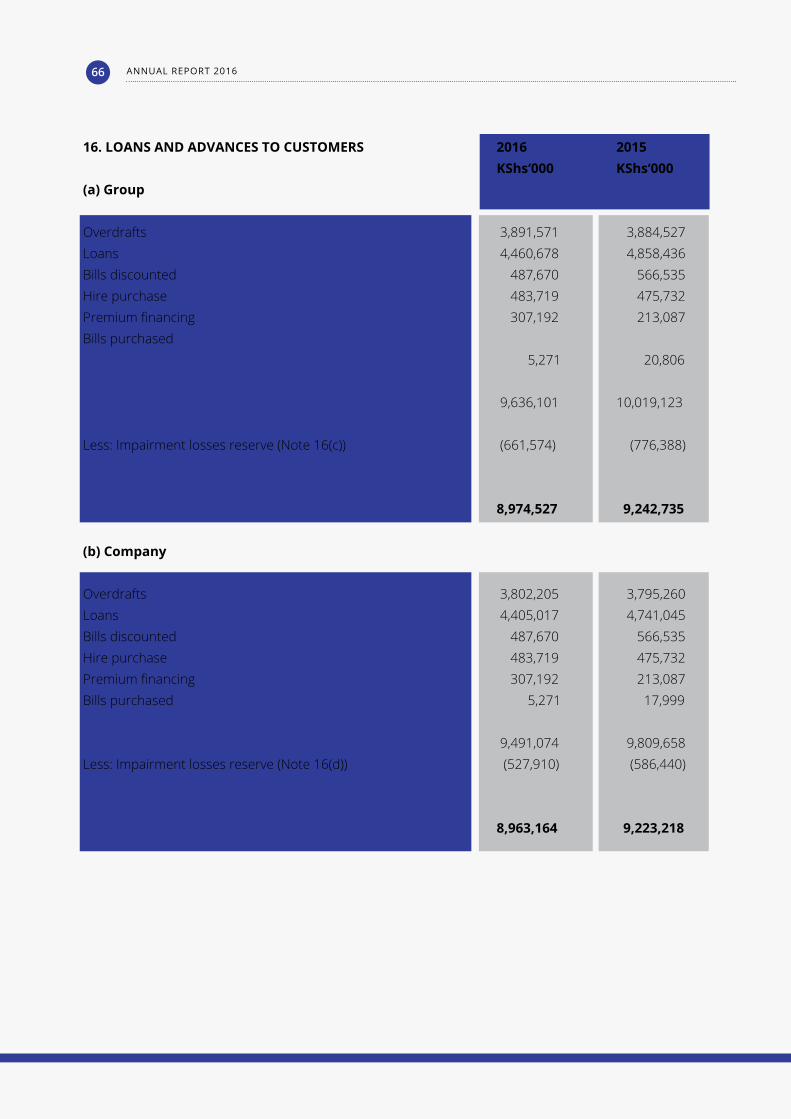
16. LOANS AND ADVANCES TO CUSTOMERS 2016 2015 KShs‘000 KShs‘000(a) Group
Overdrafts 3,891,571 3,884,527 Loans 4,460,678 4,858,436 Bills discounted 487,670 566,535 Hire purchase 483,719 475,732 Premium financing 307,192 213,087 Bills purchased 5,271 20,806
9,636,101 10,019,123
Less: Impairment losses reserve (Note 16(c)) (661,574) (776,388)
8,974,527 9,242,735
(b) Company
Overdrafts 3,802,205 3,795,260 Loans 4,405,017 4,741,045 Bills discounted 487,670 566,535 Hire purchase 483,719 475,732 Premium financing 307,192 213,087 Bills purchased 5,271 17,999
9,491,074 9,809,658 Less: Impairment losses reserve (Note 16(d)) (527,910) (586,440)
8,963,164 9,223,218
ANNUAL REPORT 201666
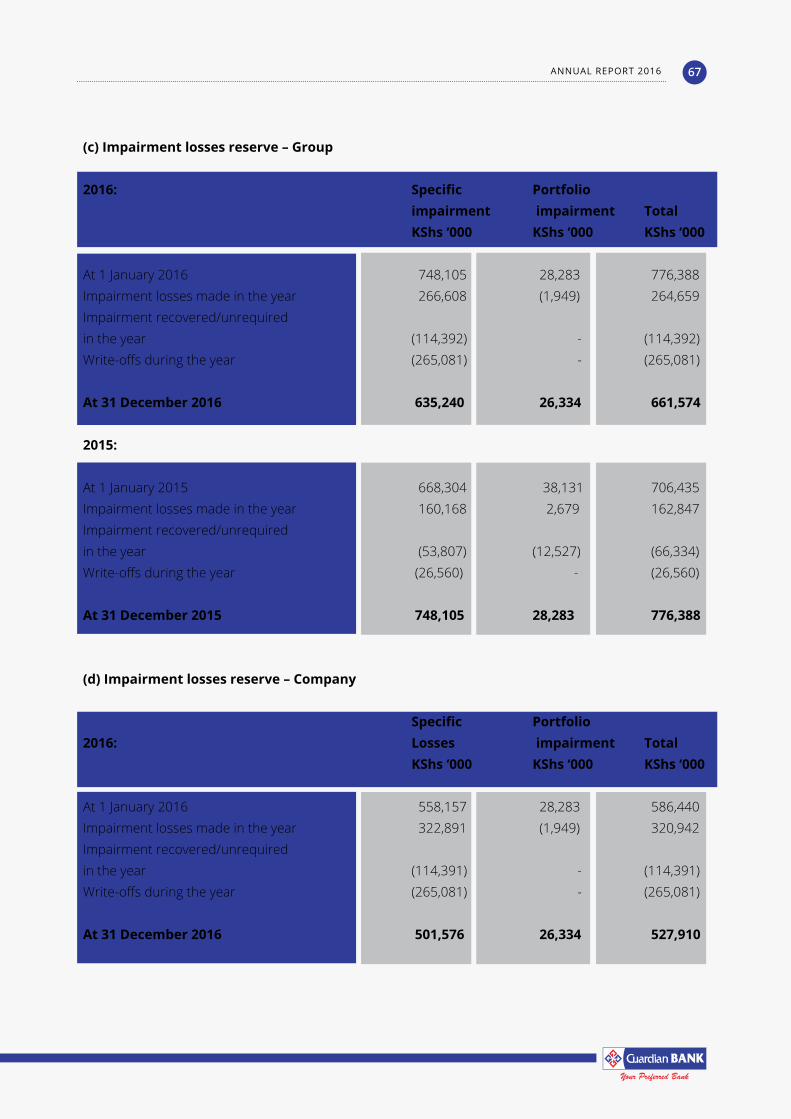
(c) Impairment losses reserve – Group
2016: Specific Portfolio impairment impairment Total KShs ‘000 KShs ‘000 KShs ‘000
At 1 January 2016 748,105 28,283 776,388Impairment losses made in the year 266,608 (1,949) 264,659Impairment recovered/unrequired in the year (114,392) - (114,392)Write-offs during the year (265,081) - (265,081)
At 31 December 2016 635,240 26,334 661,574
2015:
At 1 January 2015 668,304 38,131 706,435Impairment losses made in the year 160,168 2,679 162,847Impairment recovered/unrequired in the year (53,807) (12,527) (66,334)Write-offs during the year (26,560) - (26,560)
At 31 December 2015 748,105 28,283 776,388
(d) Impairment losses reserve – Company
Specific Portfolio2016: Losses impairment Total KShs ‘000 KShs ‘000 KShs ‘000
At 1 January 2016 558,157 28,283 586,440Impairment losses made in the year 322,891 (1,949) 320,942Impairment recovered/unrequired in the year (114,391) - (114,391) Write-offs during the year (265,081) - (265,081)
At 31 December 2016 501,576 26,334 527,910
ANNUAL REPORT 2016 67
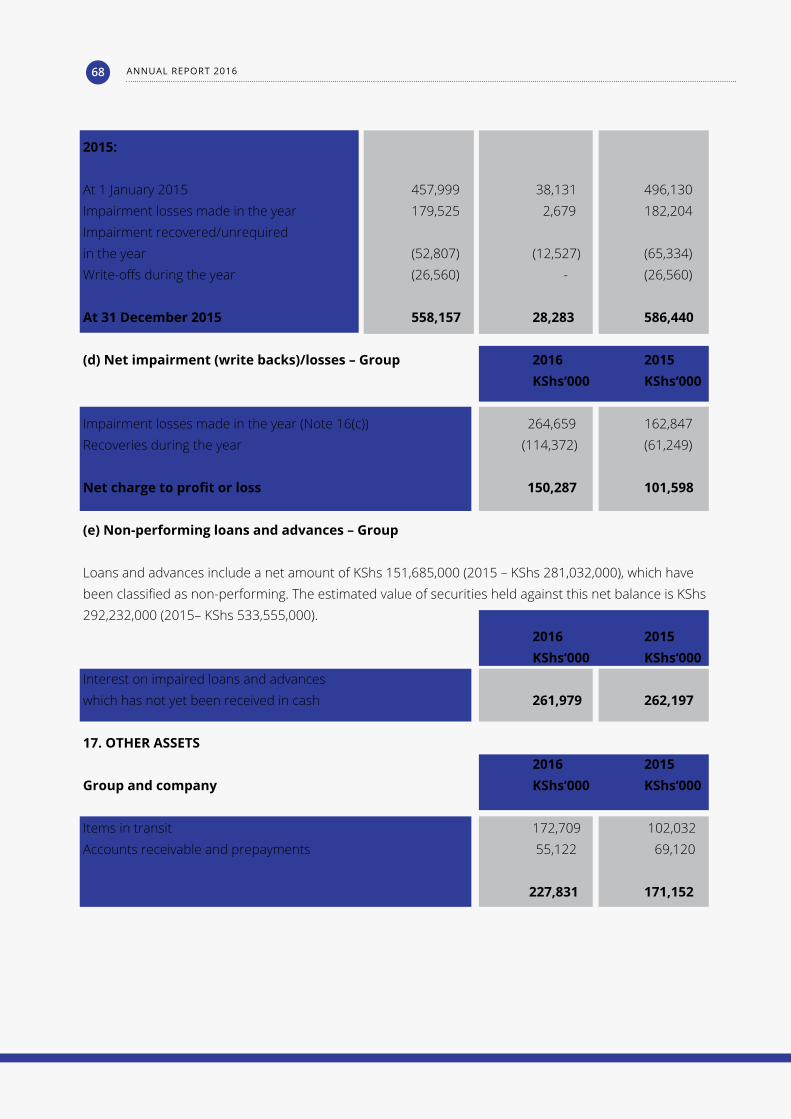
2015:
At 1 January 2015 457,999 38,131 496,130Impairment losses made in the year 179,525 2,679 182,204Impairment recovered/unrequired in the year (52,807) (12,527) (65,334)Write-offs during the year (26,560) - (26,560)
At 31 December 2015 558,157 28,283 586,440
(d) Net impairment (write backs)/losses – Group 2016 2015 KShs‘000 KShs‘000
Impairment losses made in the year (Note 16(c)) 264,659 162,847 Recoveries during the year (114,372) (61,249)
Net charge to profit or loss 150,287 101,598
(e) Non-performing loans and advances – Group
Loans and advances include a net amount of KShs 151,685,000 (2015 – KShs 281,032,000), which have been classified as non-performing. The estimated value of securities held against this net balance is KShs 292,232,000 (2015– KShs 533,555,000). 2016 2015 KShs‘000 KShs‘000Interest on impaired loans and advanceswhich has not yet been received in cash 261,979 262,197
17. OTHER ASSETS 2016 2015Group and company KShs‘000 KShs‘000
Items in transit 172,709 102,032 Accounts receivable and prepayments 55,122 69,120
227,831 171,152
ANNUAL REPORT 201668
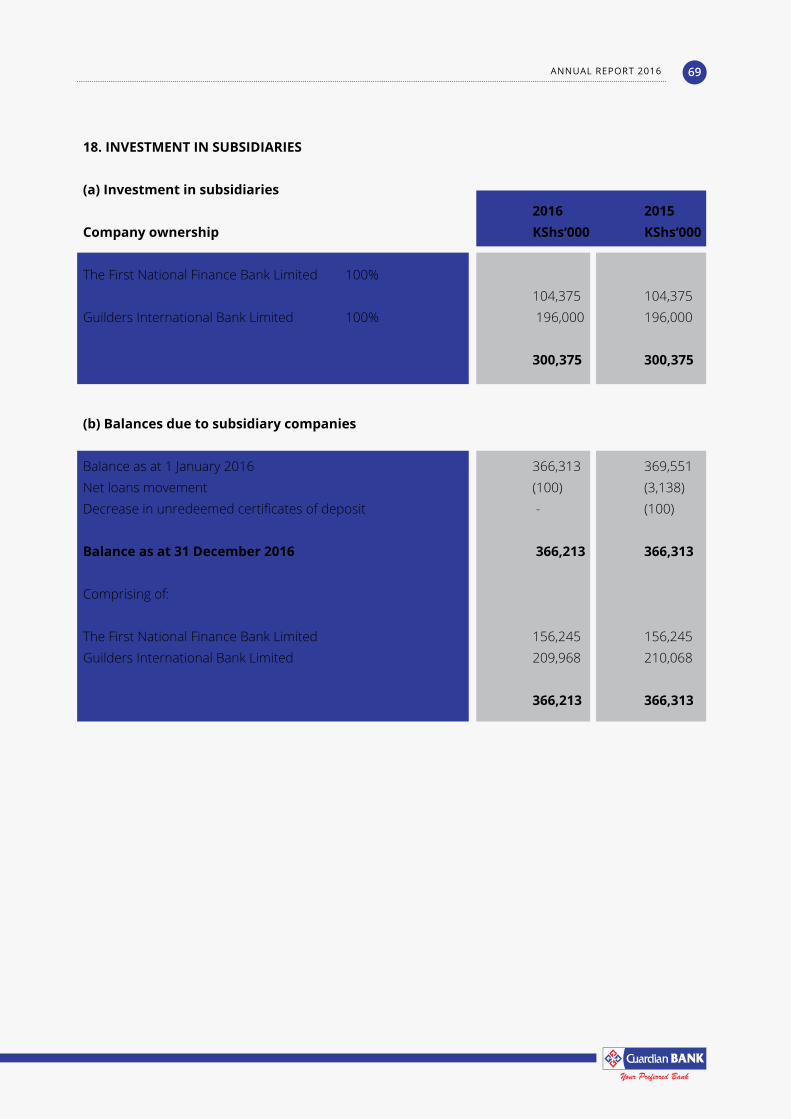
18. INVESTMENT IN SUBSIDIARIES
(a) Investment in subsidiaries 2016 2015Company ownership KShs‘000 KShs‘000
The First National Finance Bank Limited 100% 104,375 104,375 Guilders International Bank Limited 100% 196,000 196,000
300,375 300,375 (b) Balances due to subsidiary companies
Balance as at 1 January 2016 366,313 369,551 Net loans movement (100) (3,138) Decrease in unredeemed certificates of deposit - (100)
Balance as at 31 December 2016 366,213 366,313
Comprising of:
The First National Finance Bank Limited 156,245 156,245Guilders International Bank Limited 209,968 210,068
366,213 366,313
ANNUAL REPORT 2016 69
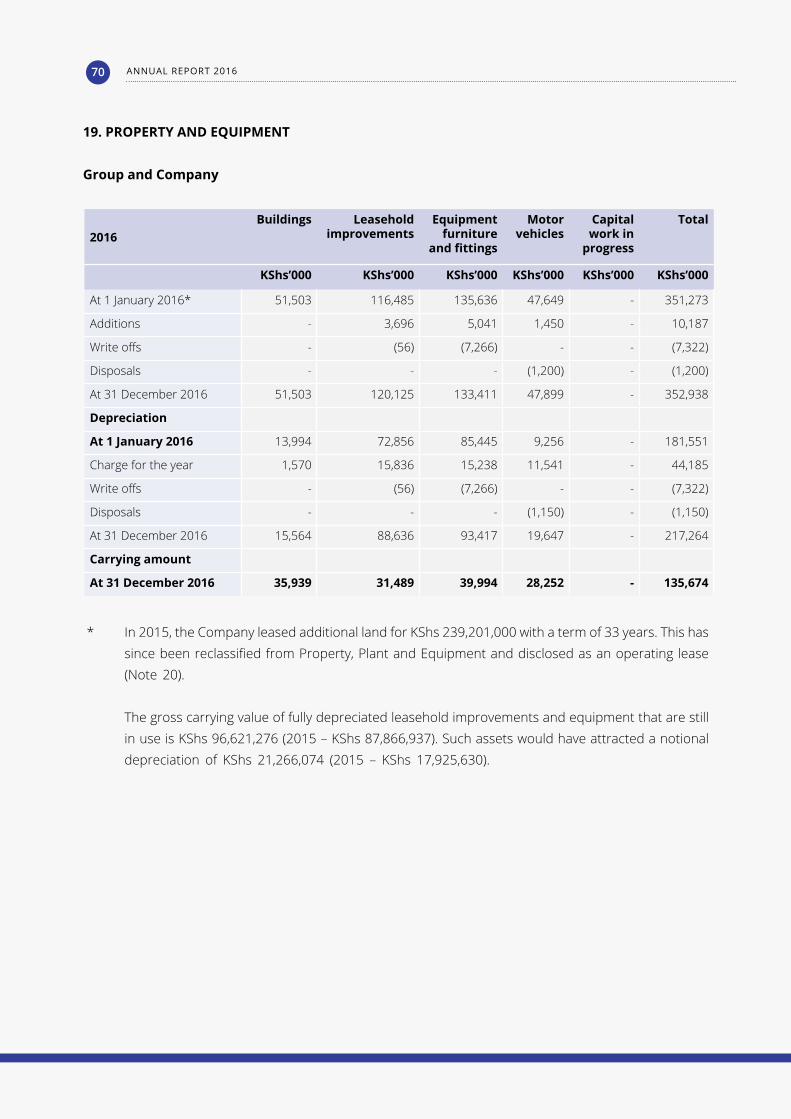
2016Buildings Leasehold
improvementsEquipment
furnitureand fittings
Motorvehicles
Capitalwork in
progress
Total
KShs’000 KShs’000 KShs’000 KShs’000 KShs’000 KShs’000
At 1 January 2016* 51,503 116,485 135,636 47,649 - 351,273
Additions - 3,696 5,041 1,450 - 10,187
Write offs - (56) (7,266) - - (7,322)
Disposals - - - (1,200) - (1,200)
At 31 December 2016 51,503 120,125 133,411 47,899 - 352,938
Depreciation
At 1 January 2016 13,994 72,856 85,445 9,256 - 181,551
Charge for the year 1,570 15,836 15,238 11,541 - 44,185
Write offs - (56) (7,266) - - (7,322)
Disposals - - - (1,150) - (1,150)
At 31 December 2016 15,564 88,636 93,417 19,647 - 217,264
Carrying amount
At 31 December 2016 35,939 31,489 39,994 28,252 - 135,674
* In 2015, the Company leased additional land for KShs 239,201,000 with a term of 33 years. This has since been reclassified from Property, Plant and Equipment and disclosed as an operating lease (Note 20).
The gross carrying value of fully depreciated leasehold improvements and equipment that are still in use is KShs 96,621,276 (2015 – KShs 87,866,937). Such assets would have attracted a notional depreciation of KShs 21,266,074 (2015 – KShs 17,925,630).
19. PROPERTY AND EQUIPMENT
Group and Company
ANNUAL REPORT 201670
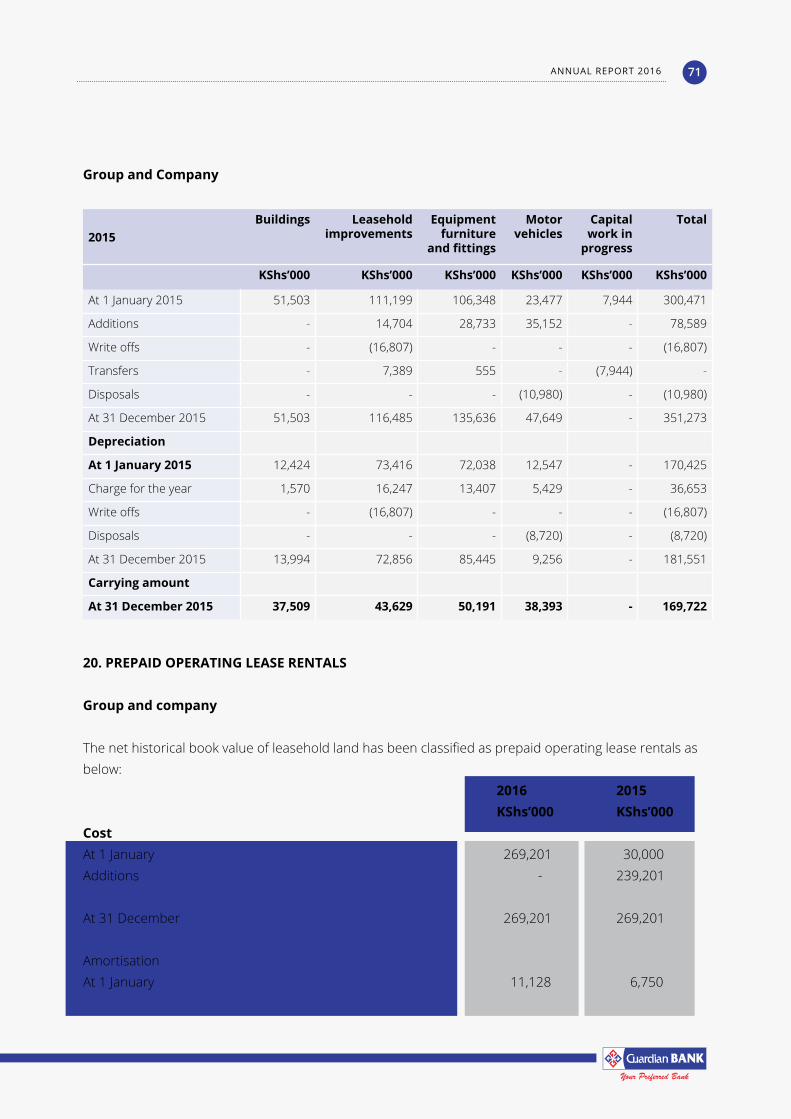
2015Buildings Leasehold
improvementsEquipment
furnitureand fittings
Motorvehicles
Capitalwork in
progress
Total
KShs’000 KShs’000 KShs’000 KShs’000 KShs’000 KShs’000
At 1 January 2015 51,503 111,199 106,348 23,477 7,944 300,471
Additions - 14,704 28,733 35,152 - 78,589
Write offs - (16,807) - - - (16,807)
Transfers - 7,389 555 - (7,944) -
Disposals - - - (10,980) - (10,980)
At 31 December 2015 51,503 116,485 135,636 47,649 - 351,273
Depreciation
At 1 January 2015 12,424 73,416 72,038 12,547 - 170,425
Charge for the year 1,570 16,247 13,407 5,429 - 36,653
Write offs - (16,807) - - - (16,807)
Disposals - - - (8,720) - (8,720)
At 31 December 2015 13,994 72,856 85,445 9,256 - 181,551
Carrying amount
At 31 December 2015 37,509 43,629 50,191 38,393 - 169,722
Group and Company
20. PREPAID OPERATING LEASE RENTALS
Group and company
The net historical book value of leasehold land has been classified as prepaid operating lease rentals as below: 2016 2015 KShs’000 KShs’000CostAt 1 January 269,201 30,000 Additions - 239,201
At 31 December 269,201 269,201
AmortisationAt 1 January 11,128 6,750
ANNUAL REPORT 2016 71
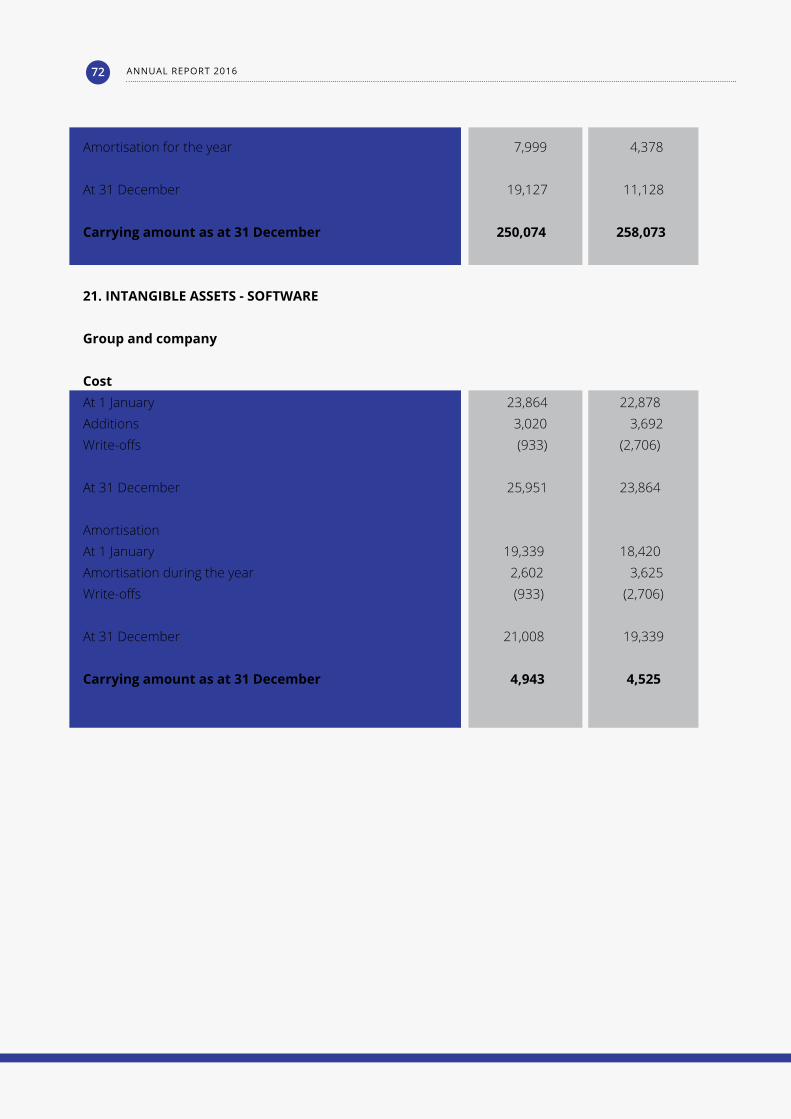
Amortisation for the year 7,999 4,378
At 31 December 19,127 11,128
Carrying amount as at 31 December 250,074 258,073
21. INTANGIBLE ASSETS - SOFTWARE
Group and company
CostAt 1 January 23,864 22,878 Additions 3,020 3,692 Write-offs (933) (2,706)
At 31 December 25,951 23,864
AmortisationAt 1 January 19,339 18,420 Amortisation during the year 2,602 3,625 Write-offs (933) (2,706)
At 31 December 21,008 19,339
Carrying amount as at 31 December 4,943 4,525
ANNUAL REPORT 201672
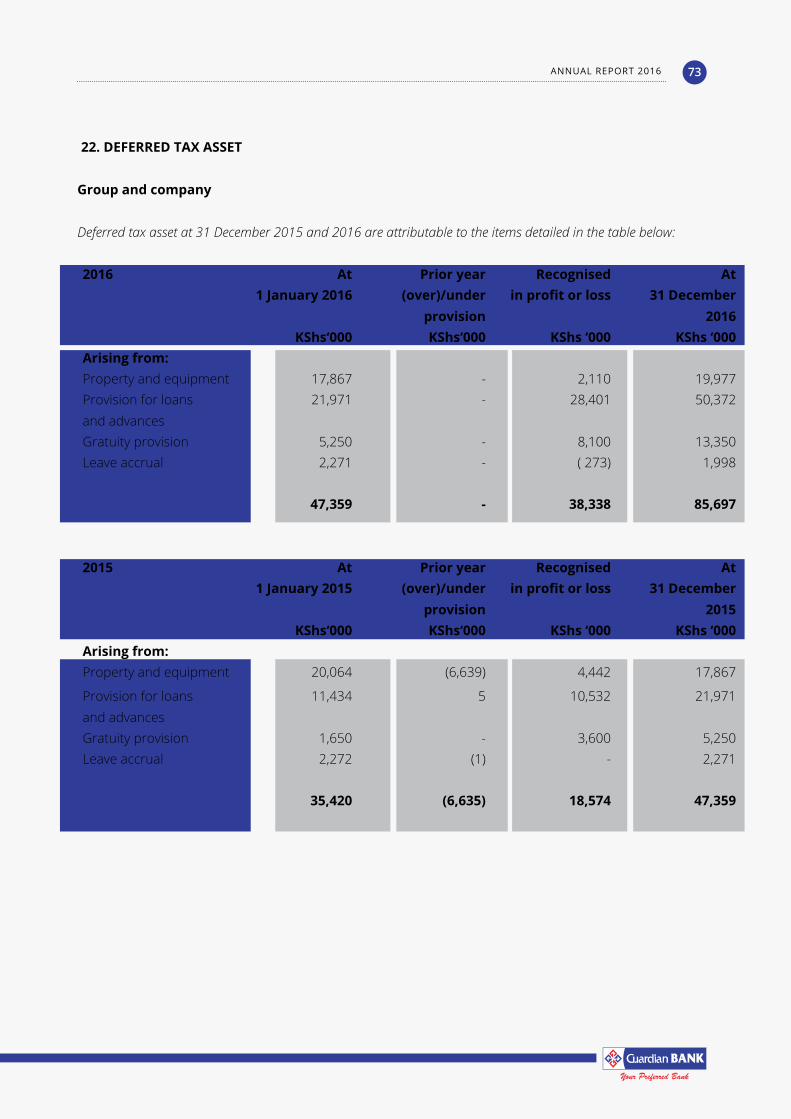
22. DEFERRED TAX ASSET
Group and company
Deferred tax asset at 31 December 2015 and 2016 are attributable to the items detailed in the table below:
2016 At Prior year Recognised At1 January 2016 (over)/under
provisionin profit or loss 31 December
2016KShs‘000 KShs‘000 KShs ‘000 KShs ‘000
Arising from:Property and equipment 17,867 - 2,110 19,977Provision for loans and advances
21,971 - 28,401 50,372
Gratuity provision 5,250 - 8,100 13,350Leave accrual 2,271 - ( 273) 1,998
47,359 - 38,338 85,697
2015 At Prior year Recognised At1 January 2015 (over)/under
provisionin profit or loss 31 December
2015KShs‘000 KShs‘000 KShs ‘000 KShs ‘000
Arising from:Property and equipment 20,064 (6,639) 4,442 17,867
Provision for loans and advances
11,434 5 10,532 21,971
Gratuity provision 1,650 - 3,600 5,250Leave accrual 2,272 (1) - 2,271
35,420 (6,635) 18,574 47,359
ANNUAL REPORT 2016 73
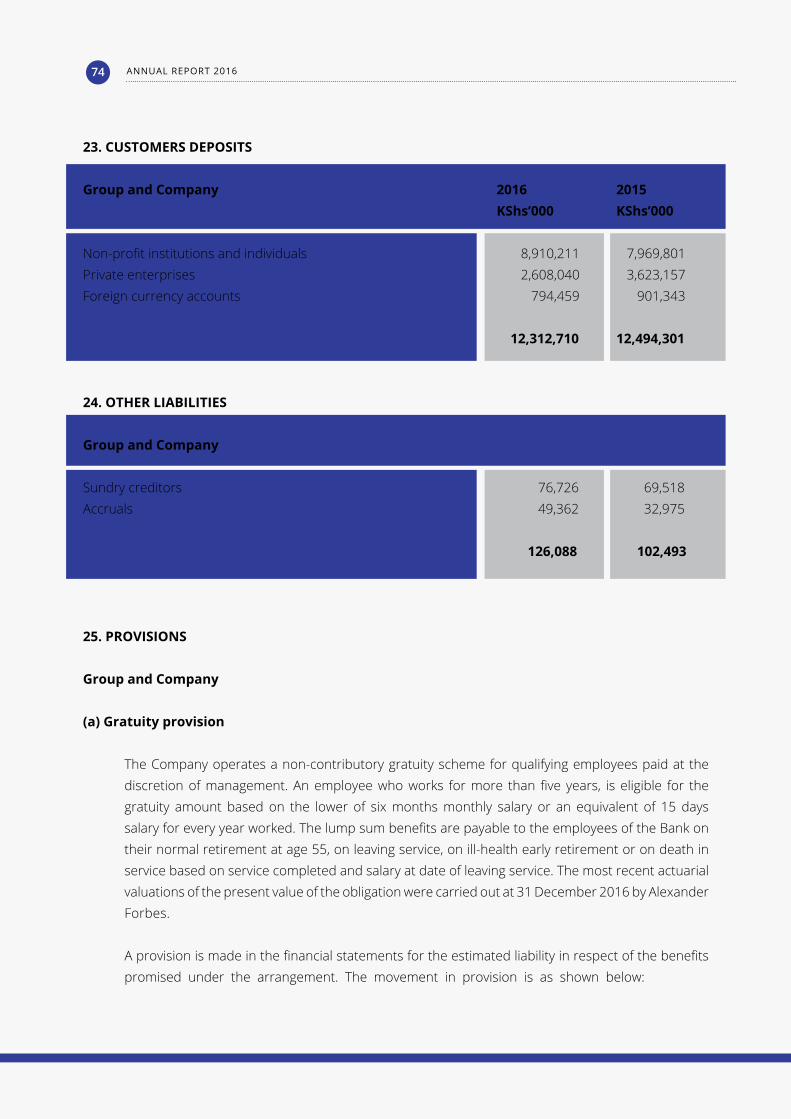
23. CUSTOMERS DEPOSITS
Group and Company 2016 2015 KShs’000 KShs’000
Non-profit institutions and individuals 8,910,211 7,969,801 Private enterprises 2,608,040 3,623,157 Foreign currency accounts 794,459 901,343
12,312,710 12,494,301
24. OTHER LIABILITIES Group and Company
Sundry creditors 76,726 69,518 Accruals 49,362 32,975
126,088 102,493
25. PROVISIONS
Group and Company
(a) Gratuity provision
The Company operates a non-contributory gratuity scheme for qualifying employees paid at the discretion of management. An employee who works for more than five years, is eligible for the gratuity amount based on the lower of six months monthly salary or an equivalent of 15 days salary for every year worked. The lump sum benefits are payable to the employees of the Bank on their normal retirement at age 55, on leaving service, on ill-health early retirement or on death in service based on service completed and salary at date of leaving service. The most recent actuarial valuations of the present value of the obligation were carried out at 31 December 2016 by Alexander Forbes.
A provision is made in the financial statements for the estimated liability in respect of the benefits promised under the arrangement. The movement in provision is as shown below:
ANNUAL REPORT 201674
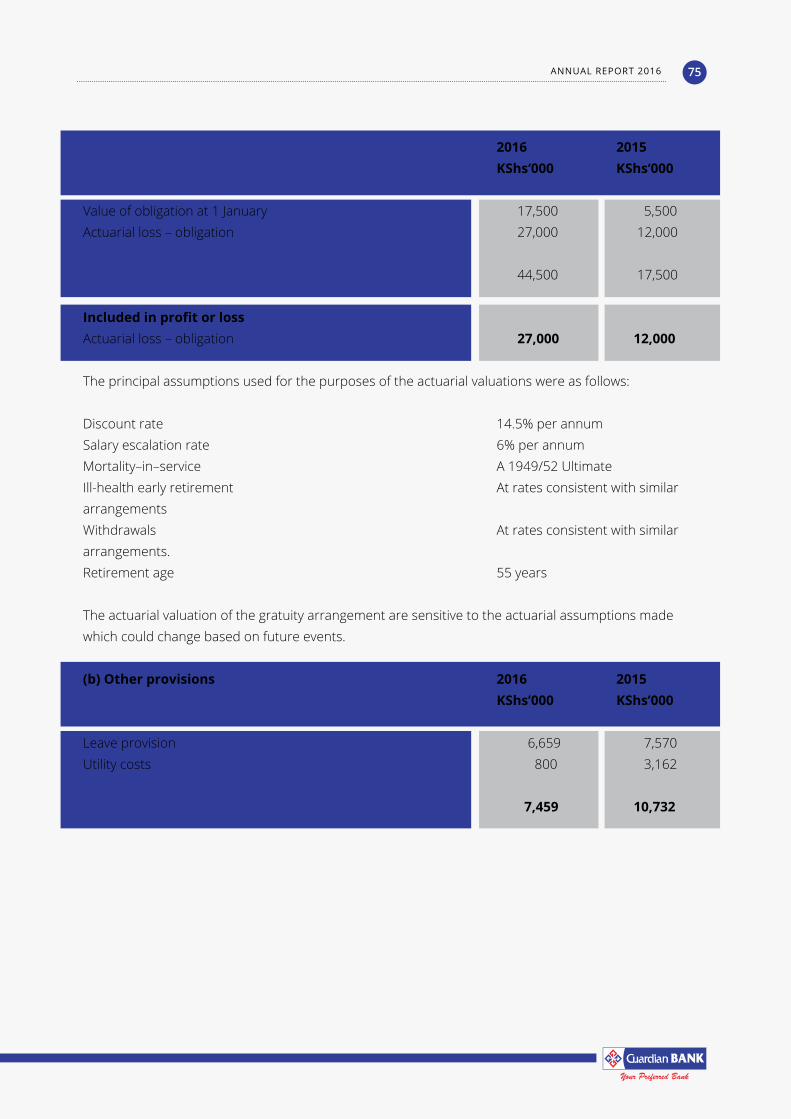
2016 2015 KShs‘000 KShs‘000
Value of obligation at 1 January 17,500 5,500 Actuarial loss – obligation 27,000 12,000
44,500 17,500
Included in profit or loss Actuarial loss – obligation 27,000 12,000
The principal assumptions used for the purposes of the actuarial valuations were as follows:
Discount rate 14.5% per annumSalary escalation rate 6% per annumMortality–in–service A 1949/52 UltimateIll-health early retirement At rates consistent with similar arrangementsWithdrawals At rates consistent with similar arrangements. Retirement age 55 years
The actuarial valuation of the gratuity arrangement are sensitive to the actuarial assumptions made which could change based on future events.
(b) Other provisions 2016 2015 KShs’000 KShs’000
Leave provision 6,659 7,570 Utility costs 800 3,162
7,459 10,732
ANNUAL REPORT 2016 75
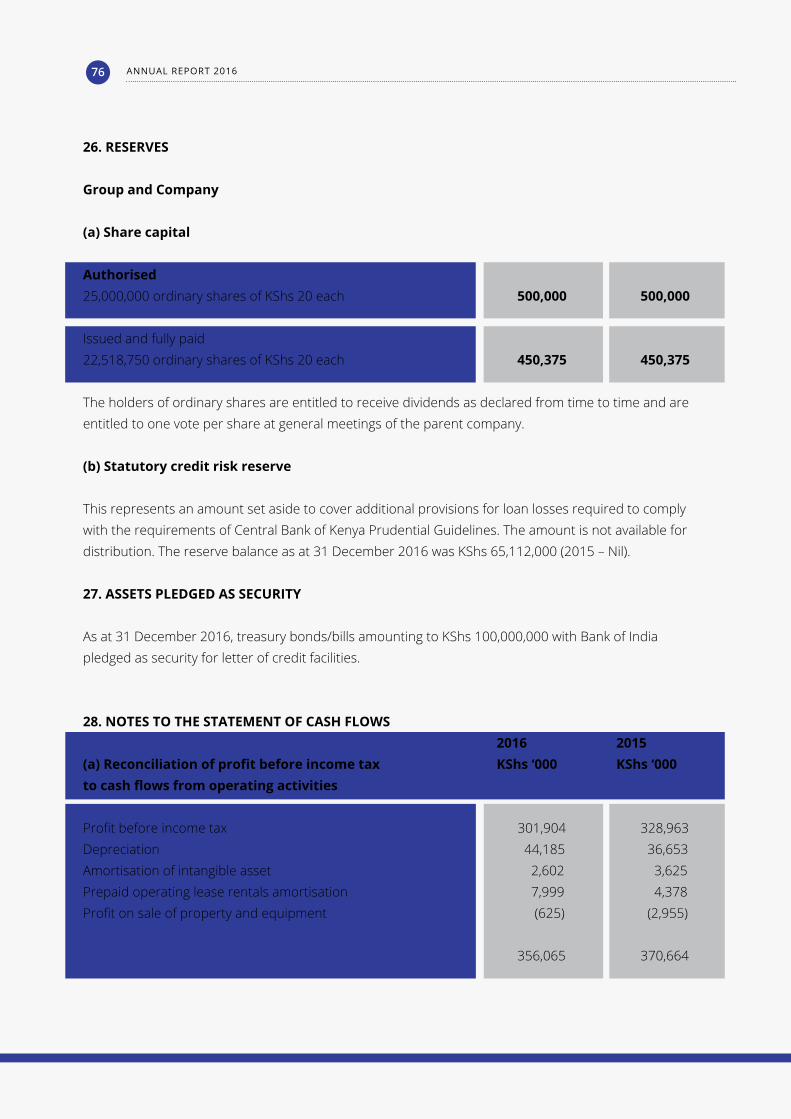
26. RESERVES Group and Company
(a) Share capital
Authorised25,000,000 ordinary shares of KShs 20 each 500,000 500,000
Issued and fully paid22,518,750 ordinary shares of KShs 20 each 450,375 450,375
The holders of ordinary shares are entitled to receive dividends as declared from time to time and are entitled to one vote per share at general meetings of the parent company.
(b) Statutory credit risk reserve
This represents an amount set aside to cover additional provisions for loan losses required to comply with the requirements of Central Bank of Kenya Prudential Guidelines. The amount is not available for distribution. The reserve balance as at 31 December 2016 was KShs 65,112,000 (2015 – Nil).
27. ASSETS PLEDGED AS SECURITY
As at 31 December 2016, treasury bonds/bills amounting to KShs 100,000,000 with Bank of India pledged as security for letter of credit facilities.
28. NOTES TO THE STATEMENT OF CASH FLOWS 2016 2015(a) Reconciliation of profit before income tax KShs ‘000 KShs ‘000to cash flows from operating activities
Profit before income tax 301,904 328,963 Depreciation 44,185 36,653 Amortisation of intangible asset 2,602 3,625 Prepaid operating lease rentals amortisation 7,999 4,378 Profit on sale of property and equipment (625) (2,955)
356,065 370,664
ANNUAL REPORT 201676
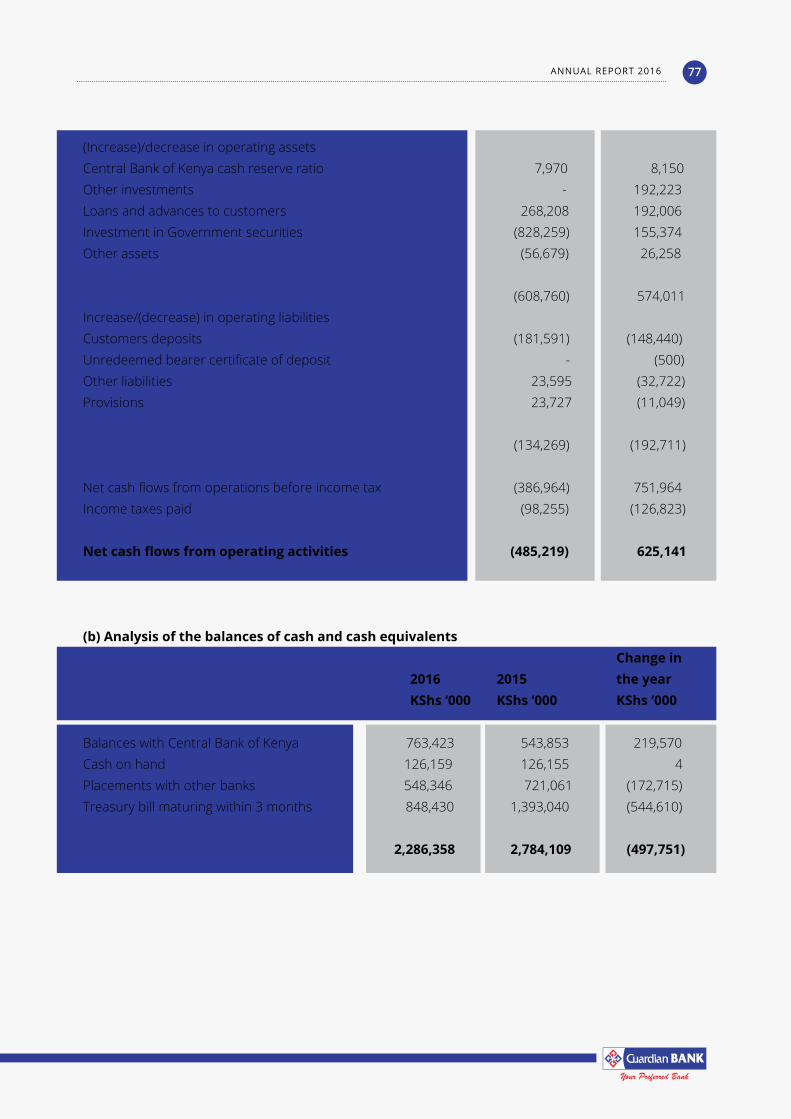
(Increase)/decrease in operating assetsCentral Bank of Kenya cash reserve ratio 7,970 8,150 Other investments - 192,223 Loans and advances to customers 268,208 192,006 Investment in Government securities (828,259) 155,374 Other assets (56,679) 26,258
(608,760) 574,011 Increase/(decrease) in operating liabilitiesCustomers deposits (181,591) (148,440) Unredeemed bearer certificate of deposit - (500) Other liabilities 23,595 (32,722) Provisions 23,727 (11,049)
(134,269) (192,711)
Net cash flows from operations before income tax (386,964) 751,964 Income taxes paid (98,255) (126,823)
Net cash flows from operating activities (485,219) 625,141
(b) Analysis of the balances of cash and cash equivalents Change in 2016 2015 the year KShs ‘000 KShs ‘000 KShs ‘000
Balances with Central Bank of Kenya 763,423 543,853 219,570Cash on hand 126,159 126,155 4Placements with other banks 548,346 721,061 (172,715)Treasury bill maturing within 3 months 848,430 1,393,040 (544,610)
2,286,358 2,784,109 (497,751)
ANNUAL REPORT 2016 77
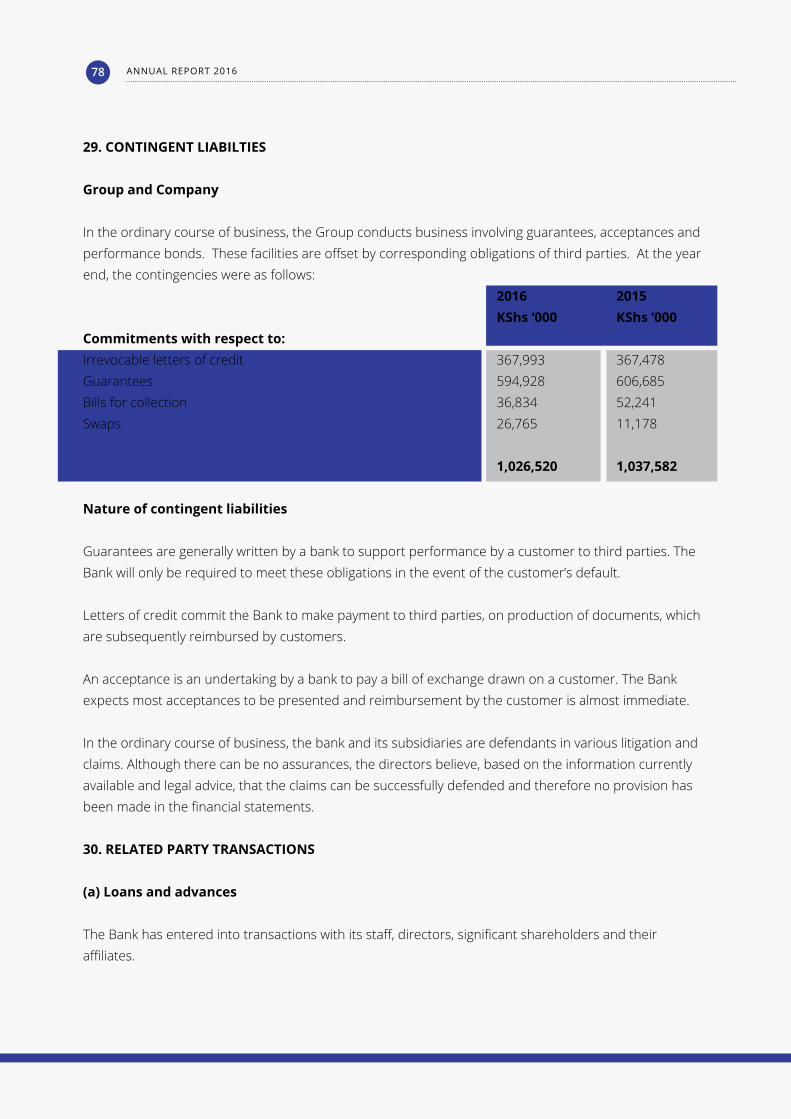
29. CONTINGENT LIABILTIES
Group and Company
In the ordinary course of business, the Group conducts business involving guarantees, acceptances and performance bonds. These facilities are offset by corresponding obligations of third parties. At the year end, the contingencies were as follows: 2016 2015 KShs ‘000 KShs ‘000Commitments with respect to:Irrevocable letters of credit 367,993 367,478 Guarantees 594,928 606,685 Bills for collection 36,834 52,241 Swaps 26,765 11,178
1,026,520 1,037,582
Nature of contingent liabilities
Guarantees are generally written by a bank to support performance by a customer to third parties. The Bank will only be required to meet these obligations in the event of the customer’s default.
Letters of credit commit the Bank to make payment to third parties, on production of documents, which are subsequently reimbursed by customers.
An acceptance is an undertaking by a bank to pay a bill of exchange drawn on a customer. The Bank expects most acceptances to be presented and reimbursement by the customer is almost immediate.
In the ordinary course of business, the bank and its subsidiaries are defendants in various litigation and claims. Although there can be no assurances, the directors believe, based on the information currently available and legal advice, that the claims can be successfully defended and therefore no provision has been made in the financial statements.
30. RELATED PARTY TRANSACTIONS
(a) Loans and advances
The Bank has entered into transactions with its staff, directors, significant shareholders and their affiliates.
ANNUAL REPORT 201678
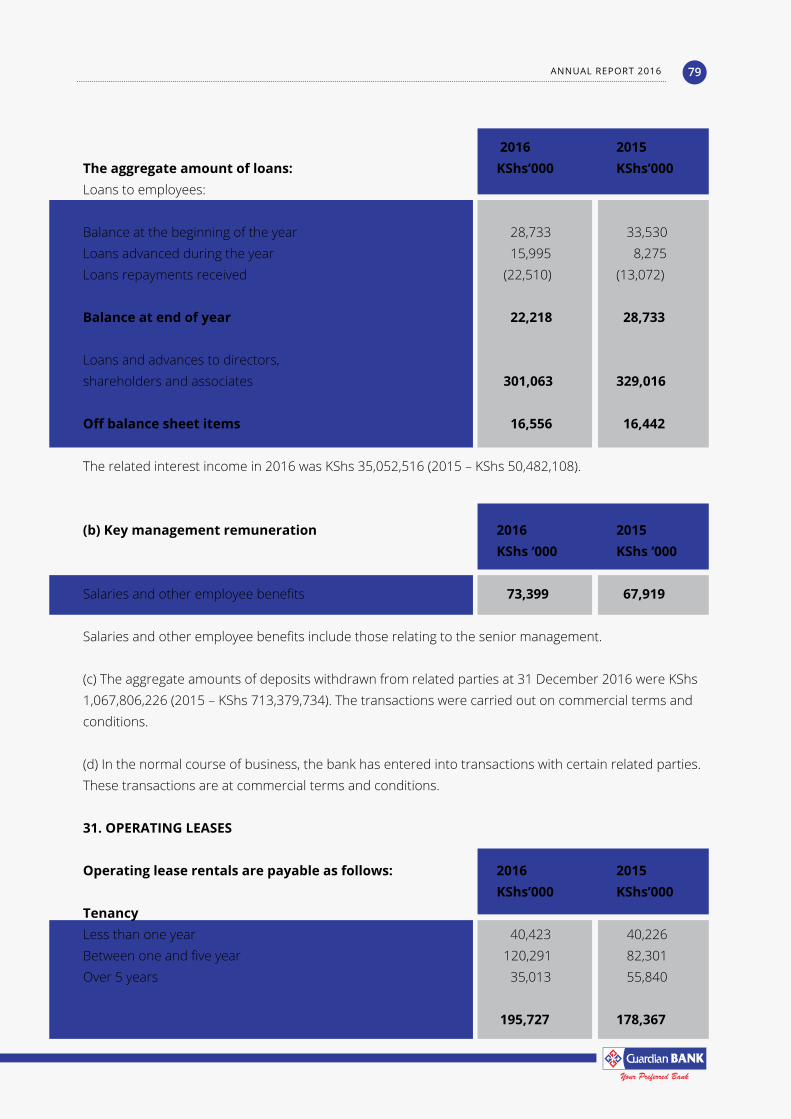
2016 2015The aggregate amount of loans: KShs’000 KShs’000Loans to employees:
Balance at the beginning of the year 28,733 33,530 Loans advanced during the year 15,995 8,275 Loans repayments received (22,510) (13,072)
Balance at end of year 22,218 28,733
Loans and advances to directors, shareholders and associates 301,063 329,016
Off balance sheet items 16,556 16,442
The related interest income in 2016 was KShs 35,052,516 (2015 – KShs 50,482,108).
(b) Key management remuneration 2016 2015 KShs ‘000 KShs ‘000
Salaries and other employee benefits 73,399 67,919
Salaries and other employee benefits include those relating to the senior management.
(c) The aggregate amounts of deposits withdrawn from related parties at 31 December 2016 were KShs 1,067,806,226 (2015 – KShs 713,379,734). The transactions were carried out on commercial terms and conditions.
(d) In the normal course of business, the bank has entered into transactions with certain related parties. These transactions are at commercial terms and conditions.
31. OPERATING LEASES
Operating lease rentals are payable as follows: 2016 2015 KShs’000 KShs’000TenancyLess than one year 40,423 40,226 Between one and five year 120,291 82,301 Over 5 years 35,013 55,840
195,727 178,367
ANNUAL REPORT 2016 79

The Bank leases a number of bank premises under operating leases. The leases typically run for an initial period of between five and six years with an option to renew the lease at its expiry. During the year ended 31 December 2016, KShs 49,411,750 (2015 – KShs 48,636,058) was recognised as an expense in the statement of comprehensive income in respect of operating leases.
ANNUAL REPORT 201680

NOTES

NOTES

Administrative Office1st and 2nd floorGuardian Centre, Biashara StreetP.O. Box: 67681, 00200NairobiTel: (254 020) 2226771 / 2226774 / 2226341Mobile: 254 722282213/733888060Fax: (254 020) 213282/[email protected]
Mombasa BranchOriental Building, Nkrumah RdP.O. Box: 40619, 80100, MombasaTel: (254 041) 2223594/2227473/2222369Mobile: 254 722282216/733888059Fax: (254 041) [email protected]
Biashara Street BranchGuardian Centre, Biashara StreetP.O. Box: 67437, 00200, NairobiTel: (254 020) 2226771/2226774/2226341Mobile: 254 722282213/733888060Fax: (254 020) 213282/[email protected]
Nyali Branch, NyaliLinks Plaza, Ground floor,Links Road,Post Box No. 34375-80118NyaliTel. No. 254-020-2552286/2552287Mobile: [email protected]
Westlands BranchBrick Court Hse, Mpaka RoadP. O. Box: 66568, 00800NairobiTel: (254 020) 4443970/4442273/4440387Mobile: 254 722282217/733888054Fax: (254 020) [email protected]
Eldoret BranchBiharilal hse, Uganda RoadP.O. Box: 7685, 30100EldoretTel: (254 053)(20) 61248/61250Mobile: 254 722282219/733888053Fax: (254 053)(20) [email protected]
Mombasa Road Branch, NairobiTulip House, Ground Floor, Mombasa RoadP. O. Box: 42060, 00100, NairobiTel: (254 020) 550231/550232/550233/550234Mobile: 254 717876291/[email protected]
Kisumu BranchAmalo Plaza, Ground FloorOginga Odinga Road, Central SquareP.O. Box: 2816, 40100KisumuTel: (254 057)(20) 21646/21665Mobile: 254 722282206/733888052Fax: (254 057)(20) [email protected]
Ngong Road Branch,NairobiThe Greenhouse, Ground floor, Ngong Road,P.O. Box No. 9822-00200Nairobi.Tel. No. 254-20-2552290/2552291Mobile: [email protected]
Nakuru BranchParana House, Ground FloorKenyatta AvenueP.O. Box No. 18633-20100, NakuruMobile: 254774210771/774210772/[email protected]