intel server raid q1 2009 bootcamp training student … server raid q1 2009 bootcamp training intel...
TRANSCRIPT

Enterprise Products and Services Division
Student Workbook
Intel Server RAID Q1 2009 Bootcamp Training

Intel® Server RAID Boot Camp Training Q1 2009
Disclaimers The information contained in this document is provided for informational purposes only and represents the current view of Intel Corporation (“Intel”) and its contributors (“Contributors”), as of the date of publication. Intel and the Contributors make no commitment to update the information contained in this document, and Intel reserves the right to make changes at any time, without notice. THIS DOCUMENT IS PROVIDED “AS IS.” NEITHER INTEL, NOR THE CONTRIBUTORS MAKE ANY REPRESENTATIONS OF ANY KIND WITH RESPECT TO PRODUCTS REFERENCED HEREIN, WHETHER SUCH PRODUCTS ARE THOSE OF INTEL, THE CONTRIBUTORS, OR THIRD PARTIES. INTEL AND ITS CONTRIBUTORS EXPRESSLY DISCLAIM ANY AND ALL WARRANTIES, IMPLIED OR EXPRESS, INCLUDING WITHOUT LIMITATION, ANY WARRANTIES OF MERCHANTABILITY, FITNESS FOR ANY PARTICULAR PURPOSE, NON-INFRINGEMENT, AND ANY WARRANTY ARISING OUT OF THE INFORMATION CONTAINED HEREIN, INCLUDING WITHOUT LIMITATION, ANY PRODUCTS, SPECIFICATIONS, OR OTHER MATERIALS REFERENCED HEREIN. INTEL AND ITS CONTRIBUTORS DO NOT WARRANT THAT THIS DOCUMENT IS FREE FROM ERRORS, OR THAT ANY PRODUCTS OR OTHER TECHNOLOGY DEVELOPED IN CONFORMANCE WITH THIS DOCUMENT WILL PERFORM IN THE INTENDED MANNER, OR WILL BE FREE FROM INFRINGEMENT OF THIRD PARTY PROPRIETARY RIGHTS, AND INTEL AND ITS CONTRIBUTORS DISCLAIM ALL LIABILITY THEREFORE. INTEL AND ITS CONTRIBUTORS DO NOT WARRANT THAT ANY PRODUCT REFERENCED HEREIN OR ANY PRODUCT OR TECHNOLOGY DEVELOPED IN RELIANCE UPON THIS DOCUMENT, IN WHOLE OR IN PART, WILL BE SUFFICIENT, ACCURATE, RELIABLE, COMPLETE, FREE FROM DEFECTS OR SAFE FOR ITS INTENDED PURPOSE, AND HEREBY DISCLAIM ALL LIABILITIES THEREFORE. ANY PERSON MAKING, USING OR SELLING SUCH PRODUCT OR TECHNOLOGY DOES SO AT HIS OR HER OWN RISK. Licenses may be required. Intel, its contributors, and others may have patents or pending patent applications, trademarks, copyrights or other intellectual proprietary rights covering subject matter contained or described in this document. No license, express, implied, by estoppel or otherwise, to any intellectual property rights of Intel or any other party is granted herein. It is your responsibility to seek licenses for such intellectual property rights from Intel and others where appropriate. Intel hereby grants you a limited copyright license to copy this document for your use and internal distribution only. You may not distribute this document externally, in whole or in part, to any other person or entity. IN NO EVENT SHALL INTEL OR ITS CONTRIBUTORS HAVE ANY LIABILITY TO YOU OR TO ANY OTHER THIRD PARTY, FOR ANY LOST PROFITS, LOST DATA, LOSS OF USE OR COSTS OF PROCUREMENT OF SUBSTITUTE GOODS OR SERVICES, OR FOR ANY DIRECT, INDIRECT, SPECIAL OR CONSEQUENTIAL DAMAGES ARISING OUT OF YOUR USE OF THIS DOCUMENT OR RELIANCE UPON THE INFORMATION CONTAINED HEREIN, UNDER ANY CAUSE OF ACTION OR THEORY OF LIABILITY, AND IRRESPECTIVE OF WHETHER INTEL OR ANY CONTRIBUTOR HAS ADVANCE NOTICE OF THE POSSIBILITY OF SUCH DAMAGES. THESE LIMITATIONS SHALL APPLY NOTWITHSTANDING THE FAILURE OF THE ESSENTIAL PURPOSE OF ANY LIMITED REMEDY. Intel, the Intel logo, Intel Xeon are trademarks or registered trademarks of Intel Corporation or its subsidiaries in the United States and other countries. *Other names and brands may be claimed as the property of others. Copyright© 2009, Intel Corporation. All rights reserved.
2 © 2009 Intel Corporation

Q1 2009 Intel® Server RAID Boot Camp Training
RAID Products and Technologies Workshop Overview
Objective This workshop is designed to provide the student with
- An understanding of the correct methods of measuring RAID performance
- An understanding of the performance impact of RAID cache settings
This lab workbook contains the following labs:
Lab 1: Correct Methods of Measuring RAID Performance
Lab 2: Impact of Cache Settings on RAID Performance
Course Pre-requisites None
Course Length The estimated time to complete this workshop is 1 hour.
Lab Equipment and Materials - Intel® Server Board S5000PSL/SC5299-E system
- 6-drive non-expander backplane
- Intel® RAID Controller SRCSATAWB (or similar Intel® RAID Controller)
- Six SATA drives
- Microsoft Windows Server 2003*
- RAID Web Console 2 * If you do not have such a lab environment, you can use our ‘RAID Products and Tech Workshop Overview V1.0.exe’ tool to simulate such labs.
© 2009 Intel Corporation 3

Intel® Server RAID Boot Camp Training Q1 2009
Lab 1: Correct Ways of Measuring RAID Performance
Introduction It is a common mistake to measure RAID performance using wrong tools or with wrong test settings. Results of such tests can be very misleading.
When measuring the RAID performance, it is important to understand how the measurement tool works, the capabilities of the tool, and any limitations. It is good to avoid using a tool with unknown or unclear data access patterns, which can make the results difficult to interpret.
In this lab, we demonstrate importance of access pattern characteristics such as random versus sequential, transfer block size, and I/O queuing. We also demonstrate how to use IOmeter – the most popular and recognized performance measurement tool among RAID, storage system, and HDD vendors.
Lab Objectives Understand the difference between sequential and random performance
Understand the impact of I/O queue depth
Understand the impact of transfer block size
4 © 2009 Intel Corporation

Q1 2009 Intel® Server RAID Boot Camp Training
Performing the Lab This lab consists of the following parts:
A. Preparing for the lab
B. Comparing sequential and random performance
C. Comparing performance with different I/O queue depths
D. Comparing performance with different transfer block sizes * If you are using our ‘RAID Products and Tech Workshop Overview V1.0.exe’ tool to simulate lab 1, click ‘>>Lab 1: Correct Ways of Measuring RAID Performance’ button as shown in Figure 1.
Figure 1. Lab 1 Agenda
Then, choose either A, B, C, or D as shown in Figure 2.
Figure 2. Performing Lab 1
© 2009 Intel Corporation 5

Intel® Server RAID Boot Camp Training Q1 2009
A: Preparing for the lab
1. Clear RAID configuration a. Run ClearVD.bat file located on the desktop to clear partition information from the RAID
array that may have been left behind from other labs.
b. Open the Intel® RAID Web Console 2 by clicking the shortcut on the desktop. c. Select Intel® RAID Controller SRCSATAWB.
d. On the menu, select Operations -> Configuration –> Clear Configuration
2. Create RAID 5 array a. Launch Configuration Wizard by selecting Operations -> Configuration –> Configuration
Wizard on the menu.
b. Select Manual Configuration and click Next.
c. Select all six drives on the Unconfigured Drives list and click Add, and then click Accept.
d. Set RAID Level to RAID 5.
e. Set Disk Cache Policy to Disabled.
f. Do not change other settings. Click Accept and then click Next.
g. Click Finish.
3. Disable Background Initialization
We need to disable Background Initialization, so that it does not interfere with our performance measurements.
a. On the Logical tab, select Virtual Disk 0.
b. On the Operations tab, select Set Virtual Disk Properties.
c. Set Background Initialization to Disabled.
d. Click Go and confirm the change.
e. Open Group Operations -> Show Progress. If Background Initialization is already running, click Abort. Click Close.
4. Disable Patrol Read and Consistency Check
We need to disable Patrol Read and Consistency Check, so that they do not interfere with our performance measurements.
a. On the Physical tab, select Intel RAID® Controller SRCSATAWB.
b. Go to the Operations tab.
c. Select Set Patrol Read Properties.
d. Set Operation Mode to Disabled.
e. Click Go.
f. Select Schedule Consistency Check.
g. Set Run Consistency Check to Disabled.
h. Click Go.
5. Run ClearVD.bat file located on the desktop to clear partition information from the new virtual disk. If there is partition information left on the HDDs from previous configuration, IOmeter will not be able to use this drive.
6 © 2009 Intel Corporation

Q1 2009 Intel® Server RAID Boot Camp Training
B: Comparing sequential and random performance Sequential performance and random performance are two different characteristics of a storage subsystem. The difference comes from the mechanical nature of HDDs. Both characteristics are important. Some applications may require higher sequential performance, other applications may require higher random performance, and some applications may require both.
Sequential performance is measured in Megabytes per second (MB/s) and represents the amount of data that can be read (or written) per second from a RAID logical disk as a continuous stream of consecutive data blocks. Sequential access usually means that HDD heads do not have to move between the tracks in order to get to the next portion of data. Therefore, there are no huge delays associated with moving heads. The maximum performance in terms of MB/s can be achieved only when accessing data sequentially. (HDD heads still have to move to the next track each time the end of a track is reached, but this movement is negligible compared to movements across hundreds of tracks.)
Random performance is measured in Input/Output operations per second (IOPS). Random performance is a measure of number of data blocks randomly distributed across the drive can be read (or written) from the drive per second. Random access means that drive heads have to move to another location every time in order to get to the next data block.
A common mistake is measuring performance in MB/s while using random or mixed access pattern.
1. Measure sequential performance
a. Open iometer.icf file located on the desktop. This file has IOmeter settings configured for this lab.
b. On the Access Specification tab, select 64KB Sequential Read specification and click Add.
c. Click the Results Display tab, then click the Green Flag button to start the test and wait for 10 seconds for the test to complete.
d. Write down Total I/Os per Second result into the IOPS column in the table below.
e. Write down Total MBs per Second result into the MB/s column in the table below.
2. Measure Random Read Performance a. On the Access Specification tab, remove 64KB Sequential Read and add 64KB Random Read
instead.
b. Click the Results Display tab, then click the Green Flag button to start the test and wait for 10 seconds for the test to complete.
c. Record the Total I/Os per Second result into the IOPS column in the table below.
d. Record the Total MBs per Second result into the MB/s column in the table below.
3. Compare the results
IOPS MB/s
64 KB Sequential Read _________ IOPS _________ MB/s
64 KB Random Read _________ IOPS _________ MB/s
© 2009 Intel Corporation 7

Intel® Server RAID Boot Camp Training Q1 2009
C: Impact of I/O queue depth on performance I/O queuing is important for getting maximum performance out of the RAID subsystem. It allows sending I/Os to several HDDs in parallel. It also allows getting maximum performance out of individual HDDs by optimizing heads movement.
Queue depth (or # of Outstanding I/Os) is the number of I/Os that can be issued by an application in parallel before the first I/O is completed.
Majority of multi-threaded applications use I/O queuing. IOmeter also allows I/O queuing. The # of Outstanding IOs setting in IOmeter corresponds to the queue depth.
A very common mistake when measuring RAID performance with IOmeter is leaving # of Outstanding IOs =1, which means no queuing is used. In many cases, this results in substantially lower performance numbers.
1. On the Access Specification tab, make sure that 64KB Sequential Read is selected.
2. On the Disk Targets tab, set # of Outstanding I/Os = 1.
3. Click the Results Display tab, then click the Green Flag button to start the test and wait for 10 seconds for the test to complete.
4. Record the Total MBs per Second result into the MB/s column in the table below.
5. Repeat steps 2 through 4 for # of Outstanding IOs =2 and =4.
6. Compare the results.
Outstanding IOs MB/s
1 __________ MB/s
2 _________ MB/s
4 _________ MB/s
8 © 2009 Intel Corporation

Q1 2009 Intel® Server RAID Boot Camp Training
D: Impact of transfer block size on performance Every data transfer request has a certain size. This size may be equal to the file size in case of small files, or it may be equal to a database record size, or it may be hard-coded in an application.
Examples: - Typical database record size: 8KB-64KB - Typical block size in data streaming applications: 256K – 4MB - Typical block size used for transferring big files (file copy, FTP, HTTP): 64 KB
Transfer block size has great impact on performance. Also, the transfer block size is coefficient between performance in terms of IOPS and performance (throughput) in terms of MB/s. In case of constant transfer block size, the following formula is true:
Throughput (KB/s) = TransferBlockSize (KB) x Performance (IOPS)
Also, RAID performance depends on the relative sizes of the application transfer block and RAID strip.
With sequential type of access, the transfer block size should be larger than stripe width (strip size multiplied by the number of drives in the stripe) to get good performance (throughput) in MB/s.
With random type of access, the transfer block size should be smaller than the strip size to get good performance in IOPS.
1. On the Disk Targets tab set # of Outstanding I/Os = 1.
2. On the Access Specification tab make sure that 64KB Sequential Read is selected.
3. Click the Results Display tab, then click the Green Flag button to start the test and wait for 10 seconds for the test to complete.
4. Record the Total MBs per Second result into the MB/s column in the table below.
5. Repeat steps 2 through 4 with 8KB Sequential Read and with 1MB Sequential Read.
6. Compare the results.
Transfer Block Size MB/s
8 KB __________ MB/s
64 KB _________ MB/s
1 MB _________ MB/s
Questions 1. If we change 8 KB random read pattern to 16 KB random read, which performance metric
changes more – IOPS or MB/s?
2. If we change 1 MB sequential read pattern to 2 MB sequential read, which performance metric changes more – IOPS or MB/s?
© 2009 Intel Corporation 9

Intel® Server RAID Boot Camp Training Q1 2009
Summary A. Sequential performance is measured in MB/s; Random performance in measured in IOPS.
B. I/O queuing is important for getting maximum performance – use IOmeter.
C. Transfer block size has big impact on both sequential and random performance.
10 © 2009 Intel Corporation
Q1 2009 Intel® Server RAID Boot Camp Training
Lab 2: Impact of Cache Settings on RAID Performance
Introduction Incorrect cache settings are the most frequent reason for slow RAID performance. Depending on the measurement test, performance can be up to 50 times slower with incorrect cache settings than with correct cache settings.
In this lab, we demonstrate the impact of the following settings: Read Policy, Write Policy, and Disk Cache Policy.
Lab Objectives Understand the impact of Read Ahead
Understand the impact of Write Back cache
© 2009 Intel Corporation 11

Intel® Server RAID Boot Camp Training Q1 2009
Performing the Lab This lab consists of the following parts:
A. Measuring impact of Read Ahead mode on sequential read performance
B. Measuring impact of write caching on sequential write performance * If you are using our ‘RAID Products and Tech Workshop Overview V1.0.exe’ tool to simulate lab 2, click ‘>>Performance Lab 2: Impact of Cache Settings on RAID Performance’ button as shown in Figure 3.
Figure 3. Lab 2 Agenda
Then, choose either A or B as shown in Figure 4.
Figure 4. Performing Lab 2
12 © 2009 Intel Corporation

Q1 2009 Intel® Server RAID Boot Camp Training
A: Measuring impact of Read Policy on sequential read performance Intel often gets complaints about slow RAID performance when copying large files.
Copying large files, under both Windows and Linux, is done as a single threaded process with no I/O queuing and with transfer block size of 64K. As we have seen in Labs 1C and 1D, this type of access results in much slower than the maximum read speed. Read speed with this type of access is limited by the speed of a single SATA/SAS link. Taking into account various overheads, the read speed will be in the 100-200 MB/s range regardless of the number of HDDs in your RAID array.
If sequential performance with no I/O queuing is important, then Read Policy needs to be set to Adaptive Read Ahead mode. In Adaptive Read Ahead mode, the RAID controller recognizes sequential access pattern and requests data from all HDDs in parallel instead of one-by-one.
In this lab, we will use IOmeter to simulate read access pattern typical to copying large files. We will measure the difference in performance between No Read Ahead mode and Adaptive Read Ahead mode.
1. Measure sequential read performance with Adaptive Read Ahead a. Close IOmeter if it is open.
b. Open Intel® RAID Web Console2.
c. On the Logical tab, select Virtual Disk 0.
d. On the Operations tab, select Set Virtual Disk Properties.
e. Set Read Policy to Adaptive Read Ahead and click Go.
f. Open iometer.icf file located on desktop.
g. On the Disk Targets tab, set # of Outstanding I/Os = 1.
h. On the Access Specification tab, add 64KB Sequential Read.
i. Click the Results Display tab, then click the Green Flag button to start the test and wait for 10 seconds for the test to complete.
j. Record the Total MBs per Second result into the MB/s column in the table below.
2. Measure sequential read performance with No Read Ahead a. In the RAID Web Console, click the Logical tab and select Virtual Disk 0.
b. On the Operations tab, select Set Virtual Disk Properties.
c. Set Read Policy to No Read Ahead and click Go.
d. In IOmeter, click the Results Display tab, then click the Green Flag button to start the test and wait for 10 seconds for the test to complete.
e. Record the Total MBs per Second result into the MB/s column in the table below.
3. Compare the results
MB/s
Adaptive Read Ahead _________ MB/s
No Read Ahead _________ MB/s
© 2009 Intel Corporation 13
Intel® Server RAID Boot Camp Training Q1 2009
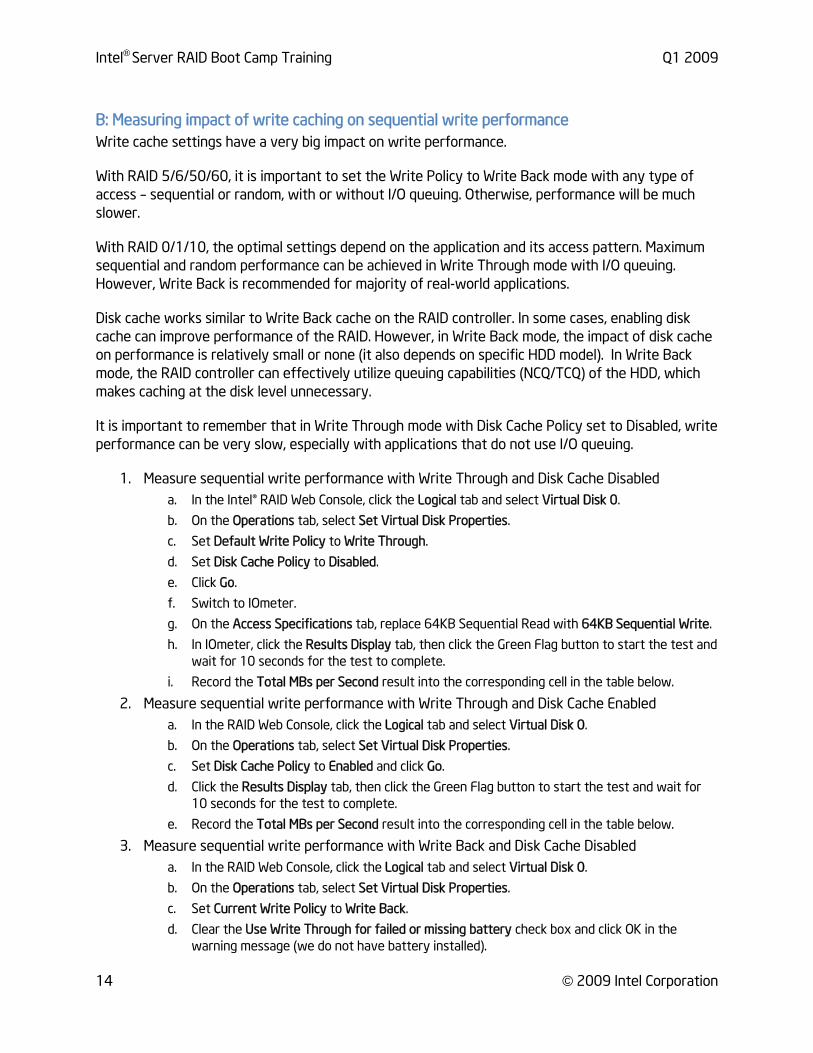
B: Measuring impact of write caching on sequential write performance Write cache settings have a very big impact on write performance.
With RAID 5/6/50/60, it is important to set the Write Policy to Write Back mode with any type of access – sequential or random, with or without I/O queuing. Otherwise, performance will be much slower.
With RAID 0/1/10, the optimal settings depend on the application and its access pattern. Maximum sequential and random performance can be achieved in Write Through mode with I/O queuing. However, Write Back is recommended for majority of real-world applications.
Disk cache works similar to Write Back cache on the RAID controller. In some cases, enabling disk cache can improve performance of the RAID. However, in Write Back mode, the impact of disk cache on performance is relatively small or none (it also depends on specific HDD model). In Write Back mode, the RAID controller can effectively utilize queuing capabilities (NCQ/TCQ) of the HDD, which makes caching at the disk level unnecessary.
It is important to remember that in Write Through mode with Disk Cache Policy set to Disabled, write performance can be very slow, especially with applications that do not use I/O queuing.
1. Measure sequential write performance with Write Through and Disk Cache Disabled a. In the Intel® RAID Web Console, click the Logical tab and select Virtual Disk 0.
b. On the Operations tab, select Set Virtual Disk Properties.
c. Set Default Write Policy to Write Through.
d. Set Disk Cache Policy to Disabled.
e. Click Go.
f. Switch to IOmeter.
g. On the Access Specifications tab, replace 64KB Sequential Read with 64KB Sequential Write.
h. In IOmeter, click the Results Display tab, then click the Green Flag button to start the test and wait for 10 seconds for the test to complete.
i. Record the Total MBs per Second result into the corresponding cell in the table below.
2. Measure sequential write performance with Write Through and Disk Cache Enabled a. In the RAID Web Console, click the Logical tab and select Virtual Disk 0.
b. On the Operations tab, select Set Virtual Disk Properties.
c. Set Disk Cache Policy to Enabled and click Go.
d. Click the Results Display tab, then click the Green Flag button to start the test and wait for 10 seconds for the test to complete.
e. Record the Total MBs per Second result into the corresponding cell in the table below.
3. Measure sequential write performance with Write Back and Disk Cache Disabled a. In the RAID Web Console, click the Logical tab and select Virtual Disk 0.
b. On the Operations tab, select Set Virtual Disk Properties.
c. Set Current Write Policy to Write Back.
d. Clear the Use Write Through for failed or missing battery check box and click OK in the warning message (we do not have battery installed).
14 © 2009 Intel Corporation

Q1 2009 Intel® Server RAID Boot Camp Training
e. Set Disk Cache Policy to Disabled.
f. Click Go.
g. In IOmeter, click the Results Display tab, then click the Green Flag button to start the test and wait for 10 seconds for the test to complete.
h. Record the Total MBs per Second result into the corresponding cell in the table below.
4. Measure sequential write performance with Write Back and Disk Cache Enabled a. In the RAID Web Console, click the Logical tab and select Virtual Disk 0.
b. On the Operations tab, select Set Virtual Disk Properties.
c. Set Disk Cache Policy to Enabled and click Go.
d. In IOmeter, click the Results Display tab, then click the Green Flag button to start the test and wait for 10 seconds for the test to complete.
e. Record the Total MBs per Second result into the corresponding cell in the table below.
5. Compare the results
Disk Cache Disabled Disk Cache Enabled
Write Through _________ MB/s _________ MB/s
Write Back _________ MB/s _________ MB/s
Questions 1. Which RAID Read Policy between No Read Ahead mode and Adaptive Read Ahead mode
provides better sequential read performance and why?
2. Why does Write Back mode provide larger performance benefits than Write Through mode during a sequential write performance test?
3. Why is SATA 2.0 disk write cache unnecessary if we set RAID Write Policy to Write Back mode during a sequential write performance test?
Summary A. Speed of copying files (as well as FTP, HTTP, backup, media streaming) can be substantially
improved by setting Adaptive Read Ahead mode.
B. Write Back mode provides huge performance benefits for many applications.
C. While increasing risk of data loss, enabling disk cache in Write Back mode provides limited performance benefits.
© 2009 Intel Corporation 15

Intel® Server RAID Boot Camp Training Q1 2009
Answers Lab 1-1. If we change 8 KB random read pattern to 16 KB random read, which performance
metric changes more – IOPS or MB/s?
There is almost no change in IOPS, because reading 16 KB versus 8 KB adds very small delay compared to moving heads from one location to another. Performance measured in MB/s is almost double, because with almost the same amount of IOPS, the amount of data transferred in every I/O is 2X times larger.
Lab 1-2. If we change 1 MB sequential read pattern to 2 MB sequential read, which performance metric changes more – IOPS or MB/s?
There is almost no change in MB/s, because with both 1 MB and 2 MB block sizes the performance is bottlenecked by sustained sequential throughput of individual HDDs. Performance in IOPS becomes two times smaller, because it takes two times longer time to read each block.
Lab 2-1. Which RAID Read Policy between No Read Ahead mode and Adaptive Read Ahead mode provides better sequential read performance and why?
We can get better sequential read performance in Adaptive Read Ahead mode. That is because the RAID controller recognizes sequential access pattern and requests data from all HDDs in parallel instead of one-by-one.
Lab 2-2. Why does Write Back mode provide larger performance benefits than Write Through mode during a sequential write performance test?
In Write Back mode, the RAID controller acknowledges write I/O requests immediately after the data loads into the controller cache. The application can continue working without waiting for the data to be physically written to the hard drives.
Lab 2-3. Why is SATA 2.0 disk write cache unnecessary if we set RAID Write Policy to Write Back mode during a sequential write performance test?
In Write Back mode, the RAID controller can effectively utilize queuing capabilities (NCQ/TCQ) of the HDD, which makes caching at the disk level unnecessary.
16 © 2009 Intel Corporation

Q1 2009 Intel® Server RAID Boot Camp Training
© 2009 Intel Corporation 17
Reference Performance Results Lab 1B
IOPS MB/s
64 KB Sequential Read ___6627.44______ IOPS __414.22_______ MB/s
64 KB Random Read __546.70_______ IOPS ___34.17______ MB/s
Lab 1C
Outstanding IOs MB/s
1 __127.17________ MB/s
2 ___231.49______ MB/s
4 __310.30_______ MB/s
Lab 1D
Transfer Block Size MB/s
8 KB __42.89________ MB/s
64 KB ___127.72______ MB/s
1 MB __379.89_______ MB/s
Lab 2A
MB/s
Adaptive Read Ahead __306.89_______ MB/s
No Read Ahead __127.23_______ MB/s
Lab 2B
Disk Cache Disabled Disk Cache Enabled
Write Through __7.09_______ MB/s ____30.17_____ MB/s
Write Back ___245.56______ MB/s ____239.50_____ MB/s