massachusetts commercial food waste ban … food waste ban economic impact analysis . 2 . ... implan...
TRANSCRIPT
Massachusetts Commercial Food Waste Ban Economic Impact Analysis
December 2016
Submitted to: Massachusetts Department of Environmental Protection
Submitted by: ICF
100 Cambridgepark Drive, Suite 501, Cambridge, MA 02140, USA
Commercial Food Waste Ban Economic Impact Analysis
2
Contents I. Introduction ...................................................................................................................................... 4
II. Study Methodology ......................................................................................................................... 5 Survey and Interview Approach ........................................................................................................ 5 Economic Impact Analysis Methodology .......................................................................................... 6
Understanding the IMPLAN Model ............................................................................................... 6 Deriving Modeling Inputs from Survey Findings ........................................................................... 8 IMPLAN Inputs .............................................................................................................................. 8
III. Study Findings ................................................................................................................................ 9 Snapshot of Industry Trends ............................................................................................................. 9
Employment ................................................................................................................................ 10 Revenue ...................................................................................................................................... 10 Customers................................................................................................................................... 11 Food Tonnage ............................................................................................................................ 12
Perceptions of the Industry ............................................................................................................. 14 Organic Waste Hauler and Processor Trends ........................................................................... 15 Trends in Food Rescue .............................................................................................................. 16
Economic Impact Results ................................................................................................................ 17 Organic Waste Haulers .............................................................................................................. 17 Organic Waste Processors ......................................................................................................... 18 Food Rescue and Donation Organizations ................................................................................ 18 IMPLAN Results Summary ......................................................................................................... 19 Projected 2017 Impact ................................................................................................................ 19
IV. Conclusion ..................................................................................................................................... 20
Appendix A: Tables of Detailed Results .......................................................................................... 21
Appendix B: Interview Trends .......................................................................................................... 25
Table of Figures Table 1: Survey Results ......................................................................................................................... 6 Table 2. Custom event--Employment and Employee Compensation as Inputs ................................... 9 Figure 1. Survey Respondents by Industry Segment ............................................................................ 9 Figure 2. Average Number of Employees per Business ..................................................................... 10 Figure 3. 2015 Revenue Responses by Segment ............................................................................... 11 Figure 4. Organic Waste Hauling and Processing Customer Distributions ......................................... 11 Figure 5. Average Annual Tonnage of Food Received by Industry Segment, 2010-2016 ................. 12 Figure 6. Estimated Total Tonnage of Food Received by Industry Segment, 2010-2016 .................. 13 Figure 7. Facility and Equipment Capital Expenditures by Segment: 2016-2017 ............................... 14 Table 3. IMPLAN Results—Organic Waste Haulers ........................................................................... 18 Table 4. IMPLAN Results—Organic Waste Processors ...................................................................... 18

Commercial Food Waste Ban Economic Impact Analysis
3
Table 5. IMPLAN Results—Rescue Organizations ............................................................................. 19 Table 6. Summary Results by Segment .............................................................................................. 19 Table 7. Estimated Employment Impact by Segment, 2017 ............................................................... 20 Table A-1. Detailed IMPLAN Results by Industry Segment ................................................................ 21 Table A-2. Top 10 Industries Experiencing Job Creation—Organic Waste Haulers .......................... 22 Table A-3. Top 10 Industries Experiencing Job Creation—Organic Waste Processors ..................... 23 Table A-4. Top 10 Industries Experiencing Job Creation—Rescue Organizations ............................ 24 Table A-5. Food Hauler/Processor Trends .......................................................................................... 25 Table A-6. Food Rescue Trends .......................................................................................................... 25
Commercial Food Waste Ban Economic Impact Analysis
4
I. Introduction In October 2014, the Massachusetts Department of Environmental Protection (MassDEP) amended its existing waste ban regulations, adding commercial organic material1 (which is primarily food material) to the list of materials banned from disposal in Massachusetts. Under these regulations, businesses and institutions may not dispose of one ton or more of commercial organic material per week in the trash. There are many ways for businesses and institutions to comply with the ban, including donating food, or sending it for animal feed, composting, or anaerobic digestion.
MassDEP contracted ICF to analyze the recent trends in the Massachusetts organics waste industry as well as potential impacts of implementing the Commercial Food Waste Disposal Ban. To understand these trends and impacts, ICF developed and administered a survey targeting industry stakeholders in Massachusetts, and subsequently conducted an economic impact analysis using data derived from this survey. The economic impact analysis relied on the commonly utilized IMPLAN model to estimate the job creation, gross state production, and tax impact of recent activity in the organics waste industry2. Additionally, ICF conducted interviews with organizations affected by the ban in order to understand current trends, challenges, and future opportunities for businesses, schools, and municipalities that seek to incorporate organic waste separation into their management operations.
Results from ICF’s quantitative and qualitative analyses indicate that organic waste diversion activities, including composting and food rescue, are gaining traction in the Commonwealth. Stakeholder segments, including organic waste haulers, processors, and food rescue organizations, have experienced significant growth in the two years since the ban’s implementation, and survey responses indicate that many of the businesses in these industries are projecting job growth for 2017. Companies are also planning significant capital investments in facilities and equipment, suggesting a stable market and a positive long-term outlook.
While the ban itself is undeniably beneficial in promoting organic waste diversion, an equally important factor is public support and cultural acceptance. Stakeholder interviews allowed ICF to gain insight into the perception of the ban and the challenges faced by core segments of the organics waste industry. Cultural acceptance for diverting organic waste, especially to compost, was strong in the greater Boston area for some residential and commercial food waste producers before the ban took effect. While the support for organic waste diversion may be strong, key barriers include lack of space for composting facilities, better source separated wastes in order to prevent contamination, and more stringent enforcement of the ban.
The following sections of this report discuss ICF’s study methodology and findings in detail.
1 MassDEP defines commercial organic material as food material or vegetative material, where “food material means material produced from human or animal food production, preparation and consumption activities and which consists of, but is not limited to, fruits, vegetables, grains, and fish and animal products and byproducts” and “vegetative material means plant material.” Final Amendments to 310 CMR 19.000 Regulations, http://www.mass.gov/eea/docs/dep/service/regulations/wbreg14.pdf. 2 IMPLAN (IMpacts for PLANning) is an input-output model commonly used to assess economy-wide effects associated with industry activity.

Commercial Food Waste Ban Economic Impact Analysis
5
II. Study Methodology
Survey and Interview Approach To assess the industry trends and estimate the statewide impact of the organics waste industry3, ICF developed and implemented a survey to collect information directly from those organizations engaged in the organics waste industry in Massachusetts. The survey was developed in collaboration with MassDEP, and was targeted at three stakeholder groups: organic waste haulers, processors and composters, and food rescue and recovery organizations. Respondents were asked questions about recent trends in their revenue, employment and capital expenditures, plans for future business activities and their experience with the ban. The survey was distributed to 98 industry contacts provided by MassDEP. Contacts received the survey link via an email from a MassDEP email address directly. The survey collected 39 unique responses over a 10 week period from June 16, 2016 through August 22, 2016, for an overall response rate of 44%4. Upon completion of the survey, ICF cross checked raw results to ensure that no survey was duplicated, incomplete surveys were not incorporated into results, and usable responses were all accounted for.
In addition to the survey, ICF conducted interviews with respondents to both corroborate survey results and to develop a richer context and understanding of the food waste industry in Massachusetts. ICF conducted 9 interviews with stakeholders engaged in organic waste hauling, processing, or food rescue. The interviews affirmed the common trends observed in the survey, and allowed for targeted insight into each industry segment. In conjunction with the survey results and the economic analysis results, the interview findings contribute to a comprehensive understanding of this growing market.
The survey received 39 unique responses. That said, some respondents did not respond to key questions and thus could data point was not included in the analysis. The analyzed sample as well as key metrics gained from the survey for each segment can be found in Table 1.
3 For the purposes of this study, MassDEP defines the organics waste industry to include organic waste hauling, composting, food processing, animal feed and anaerobic digestion, and food rescue and donation. 44 The survey response rate resulted in a 95% confidence interval (CI), +/- 15%.
Commercial Food Waste Ban Economic Impact Analysis
6
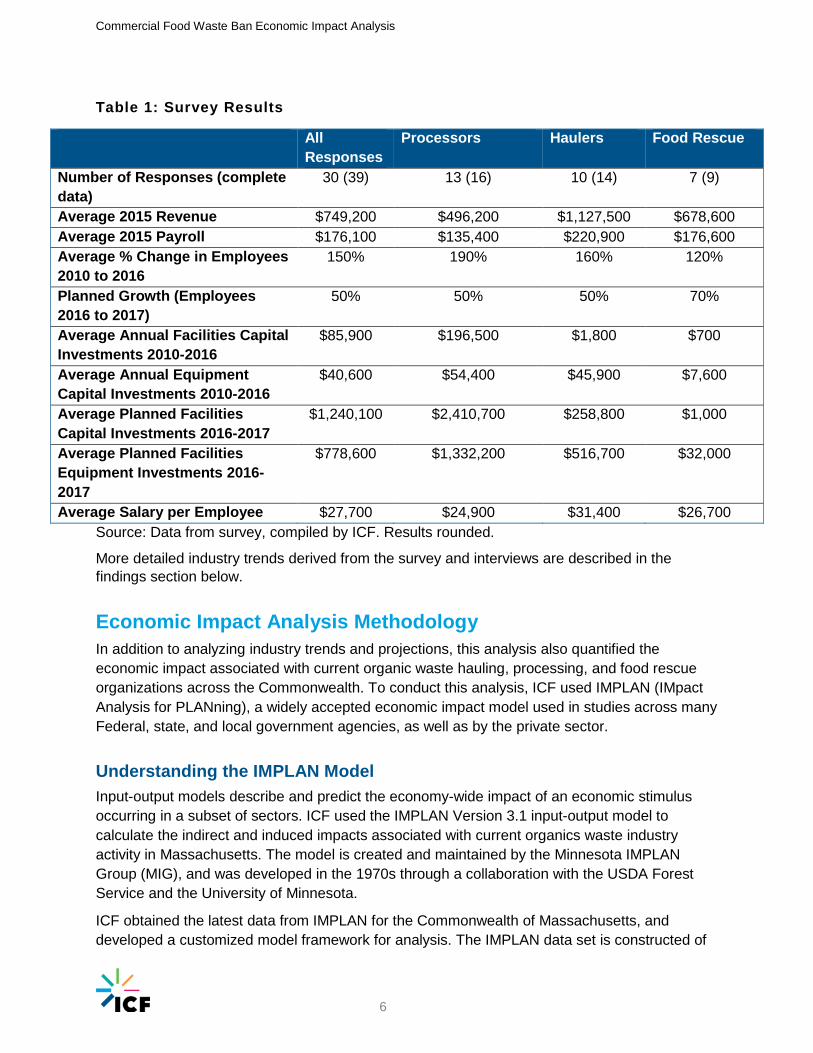
Table 1: Survey Results
Source: Data from survey, compiled by ICF. Results rounded.
More detailed industry trends derived from the survey and interviews are described in the findings section below.
Economic Impact Analysis Methodology In addition to analyzing industry trends and projections, this analysis also quantified the economic impact associated with current organic waste hauling, processing, and food rescue organizations across the Commonwealth. To conduct this analysis, ICF used IMPLAN (IMpact Analysis for PLANning), a widely accepted economic impact model used in studies across many Federal, state, and local government agencies, as well as by the private sector.
Understanding the IMPLAN Model Input-output models describe and predict the economy-wide impact of an economic stimulus occurring in a subset of sectors. ICF used the IMPLAN Version 3.1 input-output model to calculate the indirect and induced impacts associated with current organics waste industry activity in Massachusetts. The model is created and maintained by the Minnesota IMPLAN Group (MIG), and was developed in the 1970s through a collaboration with the USDA Forest Service and the University of Minnesota.
ICF obtained the latest data from IMPLAN for the Commonwealth of Massachusetts, and developed a customized model framework for analysis. The IMPLAN data set is constructed of
All Responses
Processors Haulers Food Rescue Number of Responses (complete data)
30 (39) 13 (16) 10 (14) 7 (9)
Average 2015 Revenue $749,200 $496,200 $1,127,500 $678,600 Average 2015 Payroll $176,100 $135,400 $220,900 $176,600 Average % Change in Employees 2010 to 2016
150% 190% 160% 120%
Planned Growth (Employees 2016 to 2017)
50% 50% 50% 70%
Average Annual Facilities Capital Investments 2010-2016
$85,900 $196,500 $1,800 $700
Average Annual Equipment Capital Investments 2010-2016
$40,600 $54,400 $45,900 $7,600
Average Planned Facilities Capital Investments 2016-2017
$1,240,100 $2,410,700 $258,800 $1,000
Average Planned Facilities Equipment Investments 2016-2017
$778,600 $1,332,200 $516,700 $32,000
Average Salary per Employee $27,700 $24,900 $31,400 $26,700
Commercial Food Waste Ban Economic Impact Analysis
7
data from the U.S. National Income and Product Accounts (NIPA) and the Bureau of Economic Analysis, among a variety of other data sources. The model includes 536 industry sectors based on the North American Industry Classification System (NAICS). The model uses region-specific multipliers to trace and calculate the flow of dollars from the industries that originate the impact to supplier industries. Three types of impacts are calculated in IMPLAN:
Direct Impacts, which are impacts in the primary industries that engage with organic waste hauling, processing and food rescue.
Indirect Impacts, which are impacts in the industries that supply or interact with the primary industries. For example, when a waste hauling business expands and purchases new equipment, the industry sectors supplying the equipment experience indirect impacts.
Induced Impacts, which represent increased spending by workers who earn money due to increased economic activity, such as when organics processor employees use their wages to purchase goods from local shops.
Whenever new industry activity or income is injected into an economy, it starts a ripple effect that creates a total economic impact that is much larger than the initial input. This is because the recipients of the new income spend some percentage of it and the recipients of that share, in turn, spend some of it, and so on. The total impact of the new activity/income is the sum of these progressively smaller rounds of spending within the economy. This total economic impact creates a certain level of value added Gross State Product (GSP), jobs, and also tax revenue for governments. The total impact is the sum of the multiple rounds of secondary indirect and induced impacts that remain in Massachusetts (as opposed to “leaking out” to other states). IMPLAN then uses this total impact to calculate subsequent impacts such as total jobs created and tax impacts.
The results of this analysis are reported using commonly-used metrics, consistent with best practices. A summary of each metric is provided below:
Industry Activity: Represents the total industry activity generated by the direct spending (sales).
Employment5: Represents the jobs created by industry, based on the output per worker and output impacts for each industry.
Labor Income: Includes all forms of employment income, including Employee Compensation (wages and benefits) and Proprietor Income.
Value added or GSP: The difference between an industry’s total output and the cost of its intermediate inputs; sometimes referred to as an industry’s total value added or Gross State Product (GSP).
Tax Impact: Breakdown of taxes collected by the federal, state and local government, including corporate taxes, household income taxes, and other business taxes.
The model also determines which industry sectors throughout the economy experience the greatest impact. For example, although there is no direct spending from the organics waste industry 5 Due to the static nature of the IMPLAN model, the employment impacts are presented in terms of annual job-years as the model calculates the annual impact of annual activity. It is likely that once the job is created, it will be sustained; however to ensure that the impact is not overstated, it is conservatively assumed that the job impact is annual.
Commercial Food Waste Ban Economic Impact Analysis
8
dedicated to hospital expenditures, hospitals and other healthcare industries may see increased employment due to the secondary effects of activity in the organics waste industry.
Deriving Modeling Inputs from Survey Findings The first step in conducting an economic impact analysis requires calibrating the model and preparing the inputs. ICF identified the IMPLAN industry sectors most appropriate for describing the three segments of the organics waste industry as Sector 471: Waste management and remediation services and Sector 486: Community food, housing and other relief services, including rehabilitation services. Organic waste haulers and processors were categorized under sector 471 and rescue organizations were categorized in sector 486.
To ensure that the results of our analysis most accurately reflect the current organic waste activities, ICF created custom scenarios in IMPLAN by adjusting the model’s underlying assumptions about these relevant industries.
ICF used the survey results to prepare the model inputs. In order to use the survey data for the economic model, results had to be extrapolated out to the larger industry population and thus the total economic impact assesses all 98 of the businesses providing organic waste disposal and diversion services in Massachusetts. The IMPLAN model inputs focus on employment and payroll, so ICF used survey data to estimate the total impact of both of the following categories:
Total Massachusetts employees in sectors related to the Commercial Food Waste Disposal Ban
Payroll obtained by employees in 2016
Employees ICF used the average employment per business derived from the survey data to estimate the total population of employees engaged in organics waste activity in Massachusetts. The average number of employees per business was extrapolated to the entire population of Massachusetts businesses within each segment (organic waste haulers, processors, and food rescuers) through the following calculation:
(Average employment per business) x (Total number of related Massachusetts businesses) = Estimated total number of employees
Payroll Similar to the calculation used to estimate total employment, total payroll was calculated by averaging the survey responses by segment and multiplying this average by the total number of Massachusetts businesses and institutions within the segment. The result was an estimate of the total statewide payroll for each of the three segments.
IMPLAN Inputs The IMPLAN analysis consisted of three separate scenarios, and thus required three separate input vectors for each of the segments: organic waste haulers, processors, and food rescuers. Total employment and total employee compensation values were used as direct inputs for each scenario. To ensure the model accurately representation of the industries examined in analysis (i.e. sub-segments of the broader IMPLAN industry categorizations), ICF created customized input vectors inputting values for both employment and employee compensation. Table 2 below presents the model inputs for each modeling scenario. Inputs are based on 2016 values.
Commercial Food Waste Ban Economic Impact Analysis
9
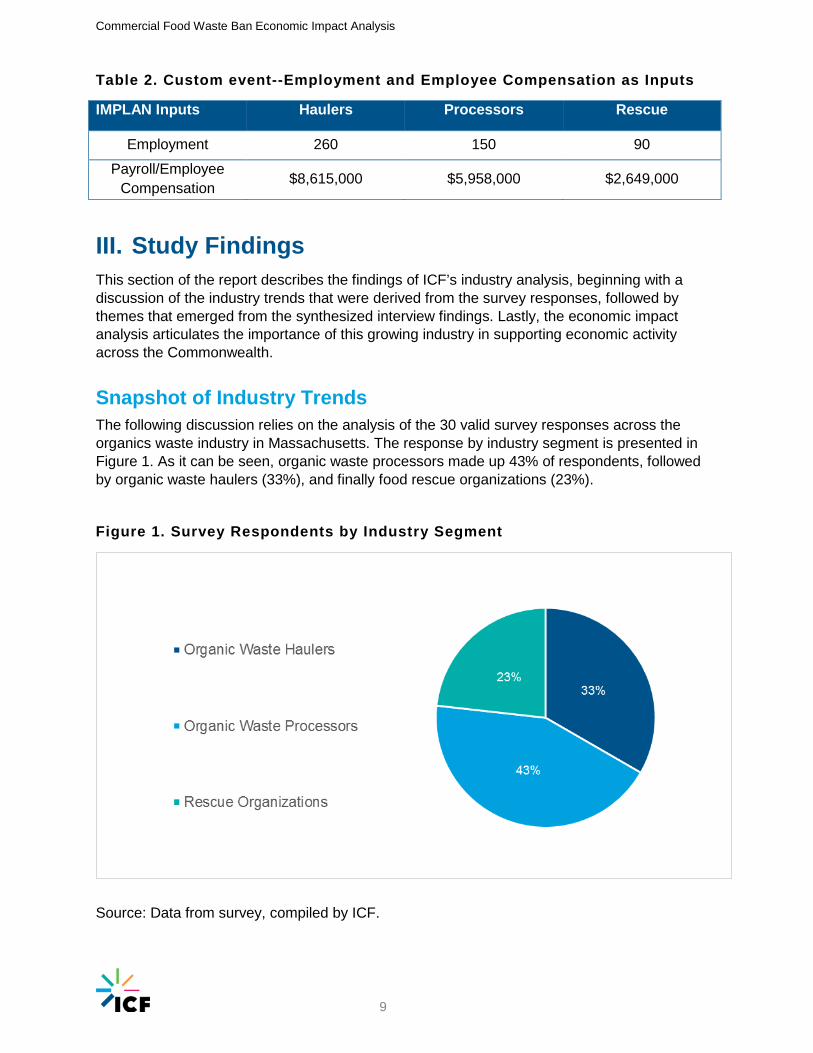
Table 2. Custom event--Employment and Employee Compensation as Inputs
IMPLAN Inputs Haulers Processors Rescue
Employment 260 150 90
Payroll/Employee Compensation $8,615,000 $5,958,000 $2,649,000
III. Study Findings This section of the report describes the findings of ICF’s industry analysis, beginning with a discussion of the industry trends that were derived from the survey responses, followed by themes that emerged from the synthesized interview findings. Lastly, the economic impact analysis articulates the importance of this growing industry in supporting economic activity across the Commonwealth.
Snapshot of Industry Trends The following discussion relies on the analysis of the 30 valid survey responses across the organics waste industry in Massachusetts. The response by industry segment is presented in Figure 1. As it can be seen, organic waste processors made up 43% of respondents, followed by organic waste haulers (33%), and finally food rescue organizations (23%).
Figure 1. Survey Respondents by Industry Segment
Source: Data from survey, compiled by ICF.
Commercial Food Waste Ban Economic Impact Analysis
10
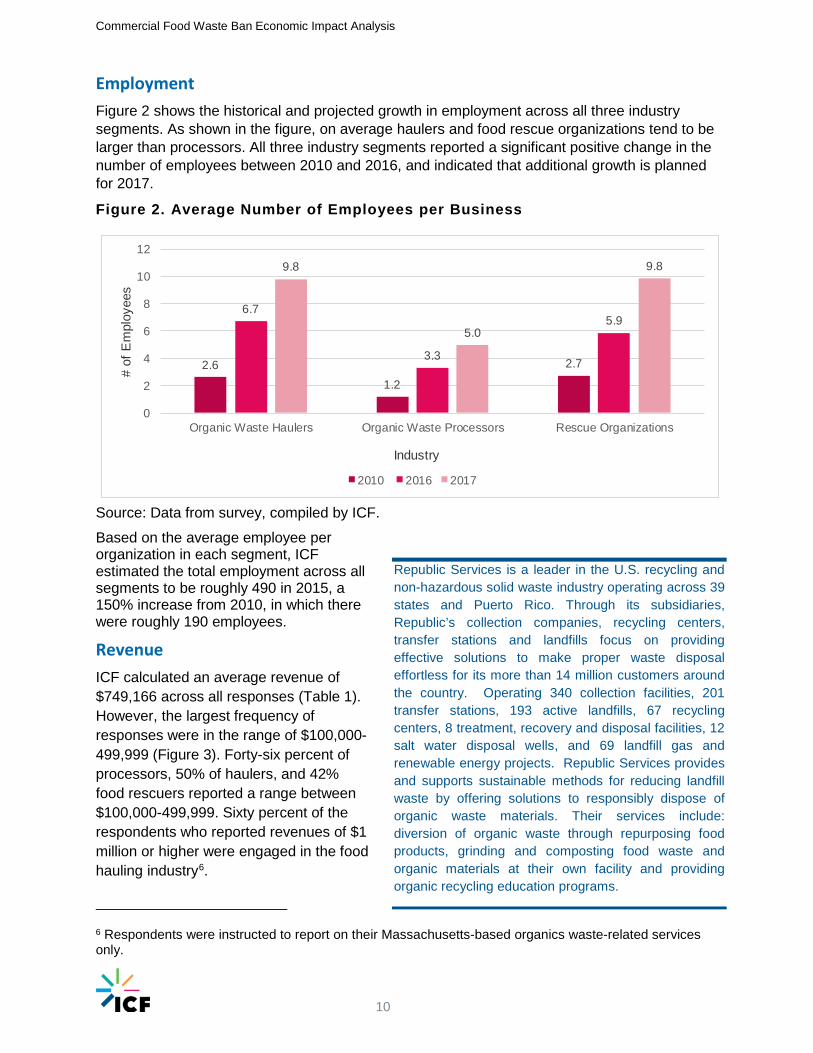
Employment Figure 2 shows the historical and projected growth in employment across all three industry segments. As shown in the figure, on average haulers and food rescue organizations tend to be larger than processors. All three industry segments reported a significant positive change in the number of employees between 2010 and 2016, and indicated that additional growth is planned for 2017.
Figure 2. Average Number of Employees per Business
2.61.2
2.7
6.7
3.3
5.9
9.8
5.0
9.8
0
2
4
6
8
10
12
Organic Waste Haulers Organic Waste Processors Rescue Organizations
# of
Em
ploy
ees
Industry
2010 2016 2017
Source: Data from survey, compiled by ICF.
Based on the average employee per organization in each segment, ICF estimated the total employment across all segments to be roughly 490 in 2015, a 150% increase from 2010, in which there were roughly 190 employees.
Revenue ICF calculated an average revenue of $749,166 across all responses (Table 1). However, the largest frequency of responses were in the range of $100,000-499,999 (Figure 3). Forty-six percent of processors, 50% of haulers, and 42% food rescuers reported a range between $100,000-499,999. Sixty percent of the respondents who reported revenues of $1 million or higher were engaged in the food hauling industry6.
6 Respondents were instructed to report on their Massachusetts-based organics waste-related services only.
Republic Services is a leader in the U.S. recycling and non-hazardous solid waste industry operating across 39 states and Puerto Rico. Through its subsidiaries, Republic’s collection companies, recycling centers, transfer stations and landfills focus on providing effective solutions to make proper waste disposal effortless for its more than 14 million customers around the country. Operating 340 collection facilities, 201 transfer stations, 193 active landfills, 67 recycling centers, 8 treatment, recovery and disposal facilities, 12 salt water disposal wells, and 69 landfill gas and renewable energy projects. Republic Services provides and supports sustainable methods for reducing landfill waste by offering solutions to responsibly dispose of organic waste materials. Their services include: diversion of organic waste through repurposing food products, grinding and composting food waste and organic materials at their own facility and providing organic recycling education programs.

Commercial Food Waste Ban Economic Impact Analysis
11
Figure 3. 2015 Revenue Responses by Segment
Source: Data from survey, compiled by ICF.
Customers Figure 4 presents the customer profile for organic waste haulers and processors. Food retailers are the main customers for the hauling segment, accounting for approximately 40% of their customer base. Food manufacturers and hospitality are tied for the second largest customer segments, followed by institutions and all other industries. Haulers and processors, as opposed to rescue organizations, reported having diverse customer distributions (Figure 4). Food rescue organizations, however, reported receiving 100% of their food from food retailers.
Figure 4. Organic Waste Hauling and Processing Customer Distributions
Source: Data from survey, compiled by ICF.
Commercial Food Waste Ban Economic Impact Analysis
12
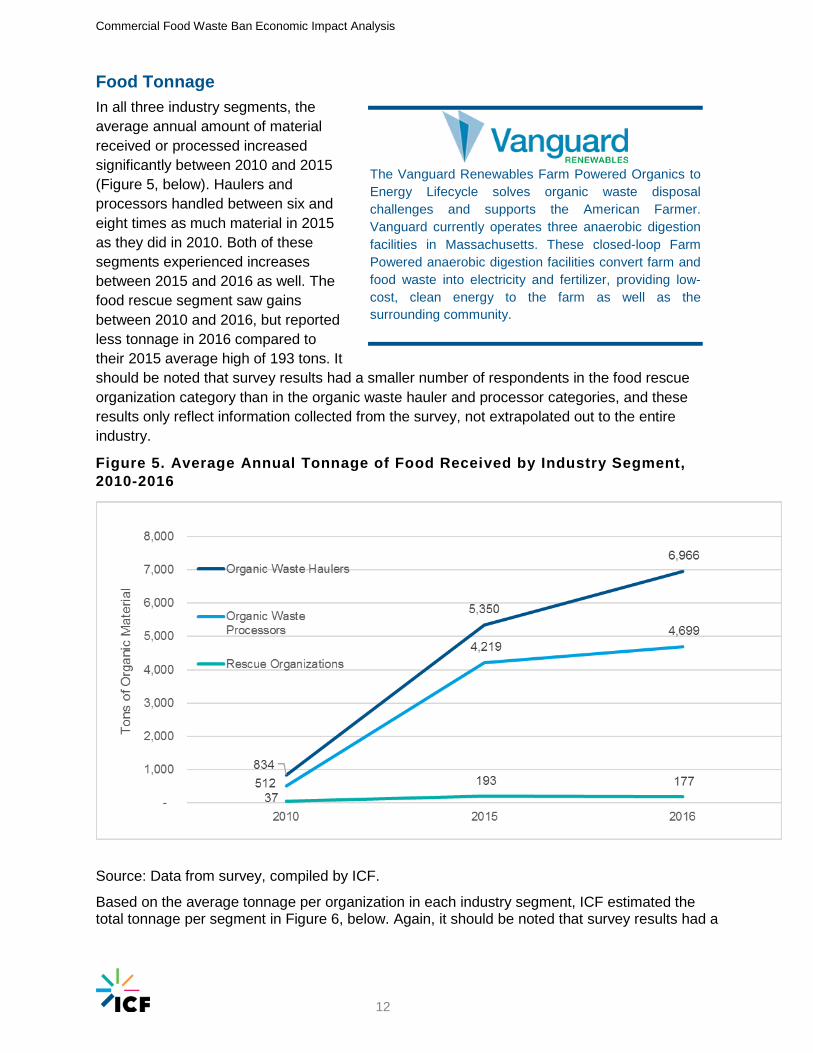
Food Tonnage In all three industry segments, the average annual amount of material received or processed increased significantly between 2010 and 2015 (Figure 5, below). Haulers and processors handled between six and eight times as much material in 2015 as they did in 2010. Both of these segments experienced increases between 2015 and 2016 as well. The food rescue segment saw gains between 2010 and 2016, but reported less tonnage in 2016 compared to their 2015 average high of 193 tons. It should be noted that survey results had a smaller number of respondents in the food rescue organization category than in the organic waste hauler and processor categories, and these results only reflect information collected from the survey, not extrapolated out to the entire industry.
Figure 5. Average Annual Tonnage of Food Received by Industry Segment, 2010-2016
Source: Data from survey, compiled by ICF.
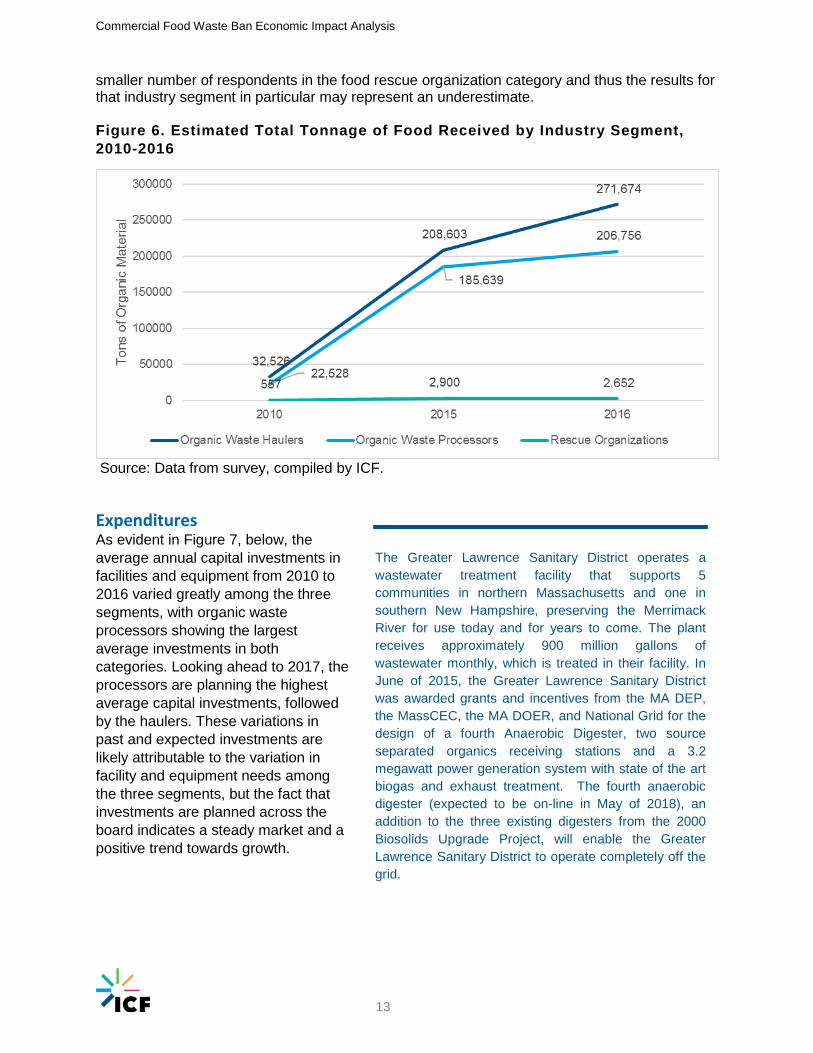
Based on the average tonnage per organization in each industry segment, ICF estimated the total tonnage per segment in Figure 6, below. Again, it should be noted that survey results had a
The Vanguard Renewables Farm Powered Organics to Energy Lifecycle solves organic waste disposal challenges and supports the American Farmer. Vanguard currently operates three anaerobic digestion facilities in Massachusetts. These closed-loop Farm Powered anaerobic digestion facilities convert farm and food waste into electricity and fertilizer, providing low-cost, clean energy to the farm as well as the surrounding community.
Commercial Food Waste Ban Economic Impact Analysis
13
smaller number of respondents in the food rescue organization category and thus the results for that industry segment in particular may represent an underestimate. Figure 6. Estimated Total Tonnage of Food Received by Industry Segment, 2010-2016
Source: Data from survey, compiled by ICF.
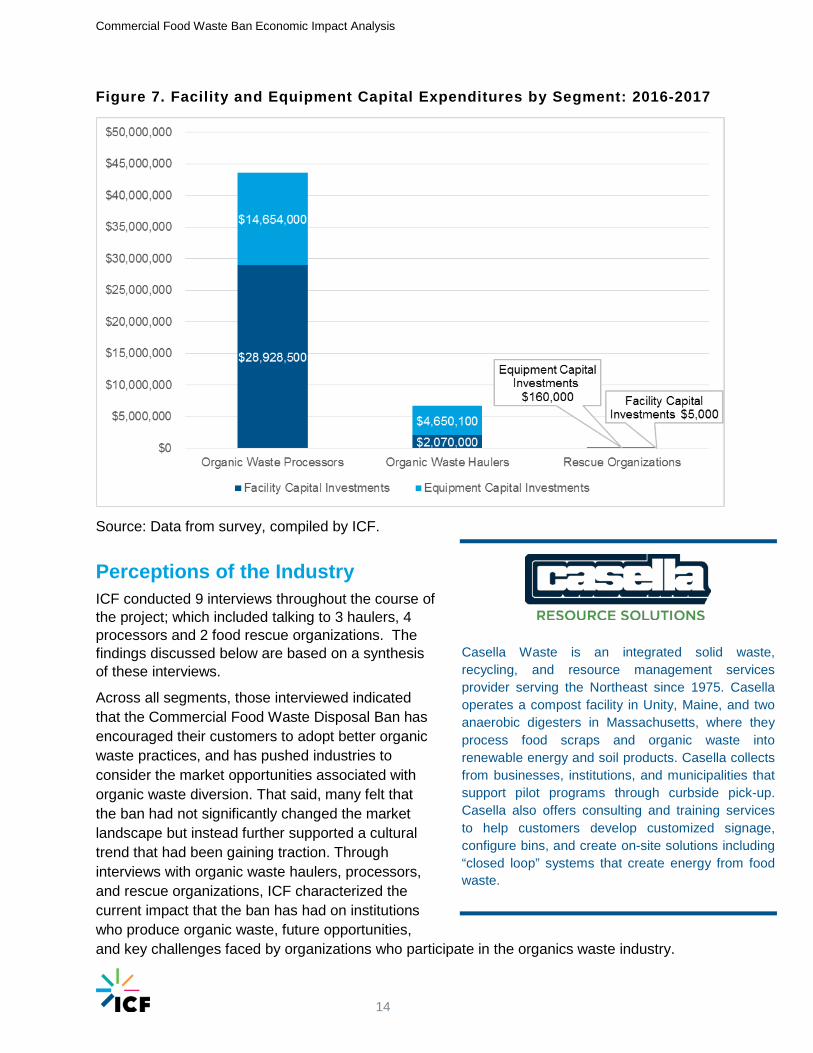
Expenditures As evident in Figure 7, below, the average annual capital investments in facilities and equipment from 2010 to 2016 varied greatly among the three segments, with organic waste processors showing the largest average investments in both categories. Looking ahead to 2017, the processors are planning the highest average capital investments, followed by the haulers. These variations in past and expected investments are likely attributable to the variation in facility and equipment needs among the three segments, but the fact that investments are planned across the board indicates a steady market and a positive trend towards growth.
The Greater Lawrence Sanitary District operates a wastewater treatment facility that supports 5 communities in northern Massachusetts and one in southern New Hampshire, preserving the Merrimack River for use today and for years to come. The plant receives approximately 900 million gallons of wastewater monthly, which is treated in their facility. In June of 2015, the Greater Lawrence Sanitary District was awarded grants and incentives from the MA DEP, the MassCEC, the MA DOER, and National Grid for the design of a fourth Anaerobic Digester, two source separated organics receiving stations and a 3.2 megawatt power generation system with state of the art biogas and exhaust treatment. The fourth anaerobic digester (expected to be on-line in May of 2018), an addition to the three existing digesters from the 2000 Biosolids Upgrade Project, will enable the Greater Lawrence Sanitary District to operate completely off the grid.
Commercial Food Waste Ban Economic Impact Analysis
14
Figure 7. Facility and Equipment Capital Expenditures by Segment: 2016-2017
Source: Data from survey, compiled by ICF.
Perceptions of the Industry ICF conducted 9 interviews throughout the course of the project; which included talking to 3 haulers, 4 processors and 2 food rescue organizations. The findings discussed below are based on a synthesis of these interviews.
Across all segments, those interviewed indicated that the Commercial Food Waste Disposal Ban has encouraged their customers to adopt better organic waste practices, and has pushed industries to consider the market opportunities associated with organic waste diversion. That said, many felt that the ban had not significantly changed the market landscape but instead further supported a cultural trend that had been gaining traction. Through interviews with organic waste haulers, processors, and rescue organizations, ICF characterized the current impact that the ban has had on institutions who produce organic waste, future opportunities, and key challenges faced by organizations who participate in the organics waste industry.
Casella Waste is an integrated solid waste, recycling, and resource management services provider serving the Northeast since 1975. Casella operates a compost facility in Unity, Maine, and two anaerobic digesters in Massachusetts, where they process food scraps and organic waste into renewable energy and soil products. Casella collects from businesses, institutions, and municipalities that support pilot programs through curbside pick-up. Casella also offers consulting and training services to help customers develop customized signage, configure bins, and create on-site solutions including “closed loop” systems that create energy from food waste.
Commercial Food Waste Ban Economic Impact Analysis
15
Black Earth Compost LLC, founded in 2010, started with just an F-350 dump truck servicing 6 restaurants in Gloucester for organics only pick-up. Since then they have grown substantially and organically, picking up from supermarkets, colleges, restaurants, three residential city-pilot programs, and one city-wide program. They operate from Northborough to Newburyport to Swampscott and everything in between. The key to their success is that they are the only vertically integrated trucking and composting company, so they are sure to only pick up clean organics, and produce a very high quality compost from that. Clean organics and high quality compost enable them to pass on the savings to their customers, which brings in more customers and denser routes and additional savings.
Organic Waste Hauler and Processor Trends Organic waste haulers and processors explained that their customer base after the implementation of the Commercial Organics Waste ban has remained largely consistent, with some new opportunities for expansion into residential markets as well as schools and restaurants. Haulers and processors noted that some of their customers have participated in organic waste diversion, such as pick up or self-composting, since the 1990s. While the ban has certainly attracted more organizations to divert organic waste, these added customers comprise a small portion of the overall customer base. Furthermore, several interviewees indicated that there was ongoing fluctuation in their customer base due to pilot programs and short-term grant opportunities. For example, MassDEP funding for residential pilot programs has generated new residential / municipal customers; however, these customers may be only temporary since many of these programs may end when the pilot funding goes away. Still, haulers and processors noticed a growing market for compost and increased cultural acceptance of composting, especially among residences, schools, and restaurants that are adopting waste diversion solutions without being prompted by the ban.
One of the most common challenges faced by processors is the large amounts of residuals and contamination found in the organic waste specifically food scraps. These residuals are mainly produced by residential and school customers that have high quantities of food waste mixed with non-compostable products, such as plastics. Processors also noted that more stringent enforcement of the ban would help ensure that all required entities were participating in organic waste diversion. Lastly, there seems to be a concern about access to low-cost/high-volume composting site options to process large quantities of organic waste. Processors explained that because these sites are unsightly and have a noticeable stench, keeping them away from highly populated areas is also a concern. Haulers in the Boston area conversely were challenged by the lack of proximity to compost sites, noting that much of the available land is far from pick up locations.
Agresource is a Massachusetts based corporation, serving municipal, industrial, and commercial clients in the Northeast since 1984. Agresource operates a composting facility, markets compost, and provides services for land application of diverted organic materials to farms and other composters. Agresource predominately focuses on composting and land application of yard, food, biosolids, and other source-separated waste, but most recently Agresource has expanded its scope to include the diversion of select residuals to anaerobic digesters.
Commercial Food Waste Ban Economic Impact Analysis
16
Trends in Food Rescue Food rescue organizations reported positive growth both in regards to increasing volumes of food, as well as a greater interest from institutions that were willing to donate their prepared and frozen foods. One organization reported donating 2 million pounds of food in 2015 alone, with opportunities for growth in 2016. Multiple interviewees noted that they were hoping to expand pick up operations from not only more food retailers, but large universities, conference centers, and hospitals. Food rescue organizations identified key opportunities that align with the practices encouraged under the Commercial Food Waste Disposal Ban. Some of these include:
Education about food rescue and best practices
Tax incentives for vendors who choose to have their waste hauled Outreach materials generated because of the ban Using the ban as a marketing tool Increased awareness on organic waste diversion options Prepared food from universities, hospitals, conference centers available for Rescue
However, food rescue organizations reported a slew of challenges that in some regards overlapped with the challenges identified by haulers and processors, including issues with the transportation of food waste. Food rescue organizations pointed out that transportation (which requires refrigeration) is often costly, and parking can be difficult, especially in the Boston area.
Independent of the ban, food waste producers prefer to compost their waste due to the ease of the process, which requires less handling on both the disposer and processor side, less effort to keep food uncontaminated, and less coordination involved in preventing food spoilage. However, food rescue organizations noted that the food ban compounded this challenge by treating food rescue and composting as equitable methods of food disposal for those mandated under the ban. Food rescue
Lovin’ Spoonfuls is a non-profit organization that facilitates the rescue and distribution of healthy, fresh food from grocery stores, produce wholesalers, farms and farmers markets to meal programs for those in need. Lovin’ Spoonfuls utilizes a direct distribution system in which 6 refrigerated trucks pick up fresh, healthy, perishable foods from donors and deliver it directly to meal centers and social assistance agencies within the same day. Since 2010, Lovin’ Spoonfuls has rescued and distributed over 4.5 million pounds of food in the greater Boston area, giving food to over 500,000 people.
Spoiler Alert, born out of MIT in June 2015, offers a collaborative, online platform and value-added services that enable food businesses, farms, and nonprofits to recover value from surplus food and organic waste. Their scalable technology platform provides real-time capabilities to manage food donations, discounted sales, and organics brokering opportunities. Additionally, Spoiler Alert offers accounting and reporting systems to capture tax benefits and document important financial, environmental, and social metrics. More information is available at foodspoileralert.com.
Commercial Food Waste Ban Economic Impact Analysis
17
organizations noted that big vendors in particular still prefer to compost due to ease, both for the reasons above and because of centralized operations employed by large food vendors. For example, a large supermarket that operates across multiple states may be reluctant to adopt food rescue at one of their Massachusetts locations because they have contracted a waste disposal service for their entire franchise.
Economic Impact Results The following section presents each segment’s impact on the economy in 2016, based on the results of the IMPLAN economic analysis, and allows for a more nuanced understanding of the relative impacts of haulers, processors, and rescue organizations. Economic impact metrics include employment, labor income, value added (or gross state product), industry activity, and tax revenue. The direct employment and employee compensation inputs described previously initiate a ripple effect throughout the Massachusetts economy, from which additional jobs, revenue, and economic activity stem. The IMPLAN results below provide quantitative context for comparison across industries and an estimate of the impact on the economy as a whole.
Organic Waste Haulers The organic waste hauling sector had the highest total direct employment and employee compensation, and thus experienced the largest impacts in terms of employment, labor income, total value added, and industry activity. Economic activity in this sector supports a total of nearly 500 jobs in Massachusetts—the 261 direct jobs in this sector drive the creation of over 230 additional indirect and induced jobs (Table 3). These indirect and induced jobs occur in industries not necessarily related to waste diversion, as they are driven by spending by businesses on outside materials (such as computer equipment) or by employees spending their wages on a variety of goods and services (such as real estate).
The hauling segment also generates over $25.5 million in labor income in the state, providing salaries to a wide range of employees and initiating a ripple effect that has benefits for the regional economy. Likewise, direct spending in the hauling segment drove over $101 million of industry activity in Massachusetts, and nearly $43 million in total value added. This segment generates over $3.1 million in annual state and local taxes.
Food For Free began in 1981 as a local endeavor to aid meal programs that were struggling to put food on their tables. With borrowed trucks, volunteers rescued fresh food fruit, vegetables, and bread—food that would have been thrown away—and delivered it to meal programs, pantries, and shelters. Today Food for Free’s Food Rescue programs serves 100+ food programs each year, including not only pantries, meal programs, and shelters, but also day care centers, after-school programs, clinics, drop-in centers, and more. In 2015, Food for Free rescued and distributed 2 million pounds of food. The non-profit’s success is made possible by their multiple programs and partnerships.
Commercial Food Waste Ban Economic Impact Analysis
18
Table 3. IMPLAN Results—Organic Waste Haulers, 2016
Impact Type Employment Labor Income Total Value Added Industry Activity
Direct Effect 260 $ 9,341,000 $ 18,736,000 $ 61,076,000
Indirect Effect 140 $ 10,354,000 $ 14,848,000 $ 25,223,000
Induced Effect 100 $ 5,873,000 $ 9,350,000 $ 15,179,000
Total Effect 500 $ 25,568,000 $ 42,935,000 $ 101,478,000 Note: Numbers may not sum due to rounding.
Source: IMPLAN Analysis, compiled by ICF
Organic Waste Processors Organic waste processor activity had the second highest total direct employment and payroll, after haulers. Accordingly, this segment experiences the second largest impact. The 147 direct jobs in the processing segment generate approximately 285 jobs throughout Massachusetts, via indirect and induced impacts (Table 4). Outside industries experiencing increased employment due to direct spending in the organic material processing industry include engineering design firms and industrial equipment maintenance and repair businesses. Direct employment and employee compensation in the processing segment drove nearly $58 million in industry activity and approximately $25.8 million in total value added in Massachusetts. This segment generates approximately $1.8 million in state and local taxes annually.
Table 4. IMPLAN Results—Organic Waste Processors, 2016
Impact Type Employme
nt
Labor Income Total Value Added Industry Activity
Direct Effect 150 $ 6,360,000 $ 11,651,000 $ 34,399,000 Indirect Effect 80 $ 5,832,000 $ 8,363,000 $ 14,206,000 Induced Effect 60 $ 3,635,000 $ 5,787,000 $ 9,395,000 Total Effect 290 $ 15,826,000 $ 25,801,000 $ 57,999,000 Note: Numbers may not sum due to rounding.
Source: IMPLAN Analysis, compiled by ICF
Food Rescue and Donation Organizations Although they had the smallest initial direct impact, food rescue organizations are still contributing a measurable impact to the Massachusetts economy. The approximately 88 direct employees in this segment are supporting almost 40 additional jobs through indirect and induced spending, for a total of nearly 130 jobs supported by rescue activities (Table 5). These jobs occur in industries such as full-service restaurants and insurance companies. The initial direct labor income of $2.6 million is more than doubled when accounting for indirect and induced labor income. Direct employment and employee compensation in this segment drove $15 million in industry activity and generated over $8 million in total value added. This segment generates over $460,000 in state and local taxes annually.
Commercial Food Waste Ban Economic Impact Analysis
19
Table 5. IMPLAN Results—Rescue Organizations, 2016
Impact Type Employment Labor Income Total Value Added Industry Activity
Direct Effect 90 $ 2,675,000 $ 3,712,000 $ 8,118,000
Indirect Effect 20 $ 1,517,000 $ 2,360,000 $ 3,763,000
Induced Effect 20 $ 1,249,000 $ 1,989,000 $ 3,229,000
Total Effect 130 $ 5,441,000 $ 8,062,000 $ 15,110,000 Note: Numbers may not sum due to rounding. Source: IMPLAN Analysis, compiled by ICF
IMPLAN Results Summary The total results by segment are shown in Table 6. Combined, the three industry segments supported over 900 total jobs in Massachusetts (a 150% increase over the estimated 360 total jobs supported in 2010), and generated over $46 million in labor income. These industries contributed nearly $77 million to gross state product and produced approximately $175 million in industry activity in the Commonwealth. Additionally, the economic activity in the organics waste industry has generated over $5 million in state and local tax revenue. The sum of these contributions demonstrates the measureable impact of the activity surrounding the ban. Table 6. Summary Results by Segment, 2016
Haulers Processors Rescue
Organizations
Total Impact
Employment 500 290 130 910
Labor Income ($ millions) $25.6 $15.8 $ 5.4 $46.8
Value Added ($ millions) $42.9 $25.8 $8.1 $76.8
Industry Activity ($ millions) $101.5 $58.0 $15.1 $174.6
State & Local Taxes ($ millions) $3.1 $1.8 $0.5 $5.4
Note: Numbers may not sum due to rounding. Source: IMPLAN Analysis, compiled by ICF.
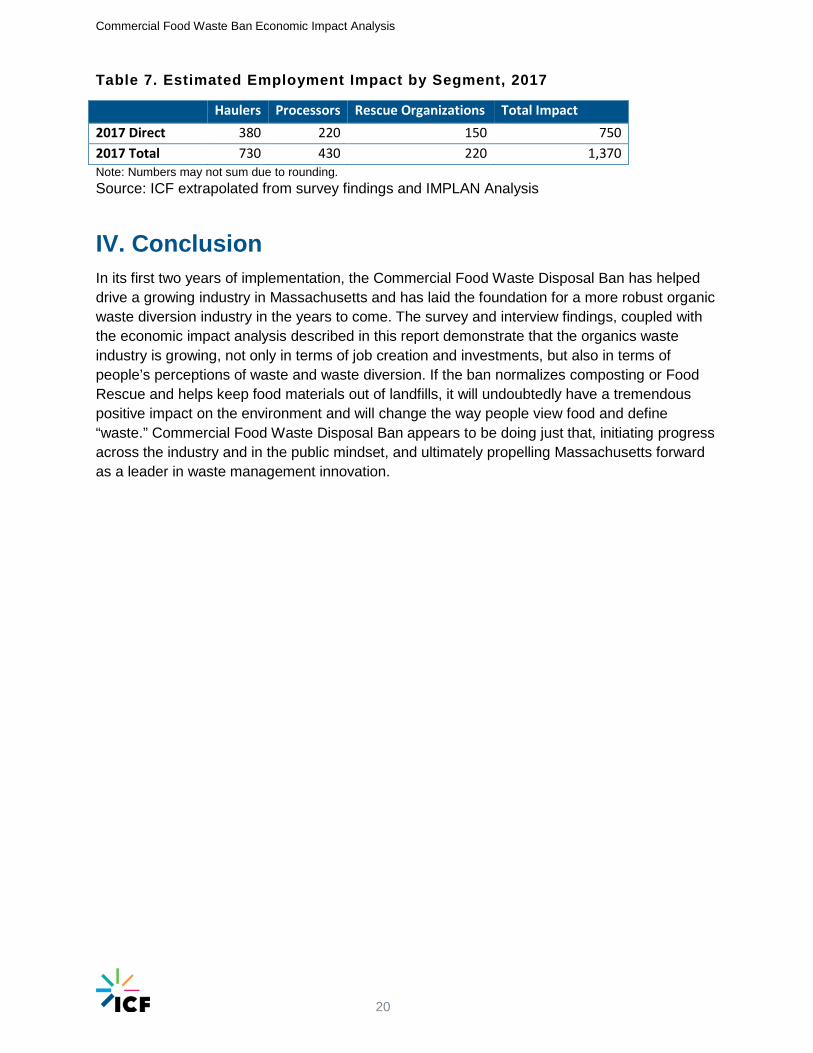
Projected 2017 Impact Lastly, ICF estimated the total employment impact in 2017 using the projected growth rate in employment and the employment multiplier derived from the 2016 analysis. As can be seen in Table 7 below, the three industry segments combined are estimated to support roughly 1,370 total jobs in Massachusetts in 2017.
Commercial Food Waste Ban Economic Impact Analysis
20
Table 7. Estimated Employment Impact by Segment, 2017
Haulers Processors Rescue Organizations Total Impact 2017 Direct 380 220 150 750 2017 Total 730 430 220 1,370 Note: Numbers may not sum due to rounding. Source: ICF extrapolated from survey findings and IMPLAN Analysis
IV. Conclusion In its first two years of implementation, the Commercial Food Waste Disposal Ban has helped drive a growing industry in Massachusetts and has laid the foundation for a more robust organic waste diversion industry in the years to come. The survey and interview findings, coupled with the economic impact analysis described in this report demonstrate that the organics waste industry is growing, not only in terms of job creation and investments, but also in terms of people’s perceptions of waste and waste diversion. If the ban normalizes composting or Food Rescue and helps keep food materials out of landfills, it will undoubtedly have a tremendous positive impact on the environment and will change the way people view food and define “waste.” Commercial Food Waste Disposal Ban appears to be doing just that, initiating progress across the industry and in the public mindset, and ultimately propelling Massachusetts forward as a leader in waste management innovation.
Commercial Food Waste Ban Economic Impact Analysis
21
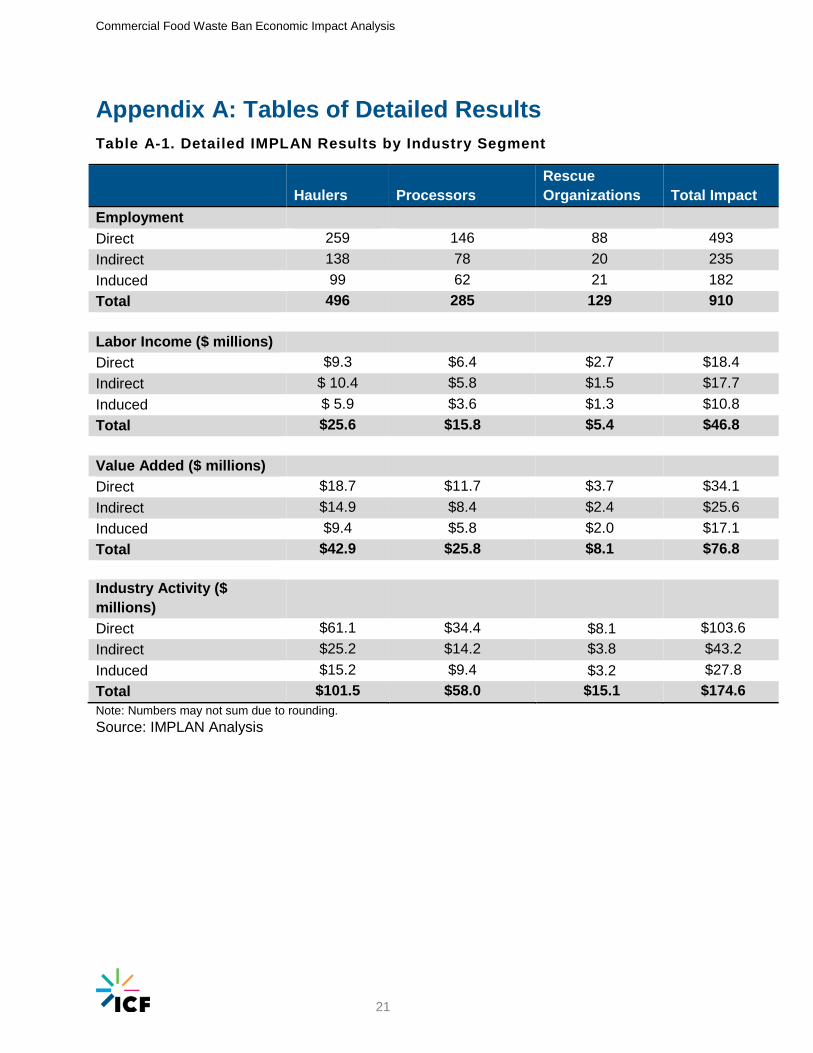
Appendix A: Tables of Detailed Results Table A-1. Detailed IMPLAN Results by Industry Segment
Haulers Processors
Rescue Organizations Total Impact
Employment Direct 259 146 88 493 Indirect 138 78 20 235 Induced 99 62 21 182 Total 496 285 129 910
Labor Income ($ millions) Direct $9.3 $6.4 $2.7 $18.4 Indirect $ 10.4 $5.8 $1.5 $17.7 Induced $ 5.9 $3.6 $1.3 $10.8 Total $25.6 $15.8 $5.4 $46.8
Value Added ($ millions) Direct $18.7 $11.7 $3.7 $34.1 Indirect $14.9 $8.4 $2.4 $25.6 Induced $9.4 $5.8 $2.0 $17.1 Total $42.9 $25.8 $8.1 $76.8
Industry Activity ($ millions)
Direct $61.1 $34.4 $8.1 $103.6 Indirect $25.2 $14.2 $3.8 $43.2 Induced $15.2 $9.4 $3.2 $27.8 Total $101.5 $58.0 $15.1 $174.6 Note: Numbers may not sum due to rounding. Source: IMPLAN Analysis
Commercial Food Waste Ban Economic Impact Analysis
22
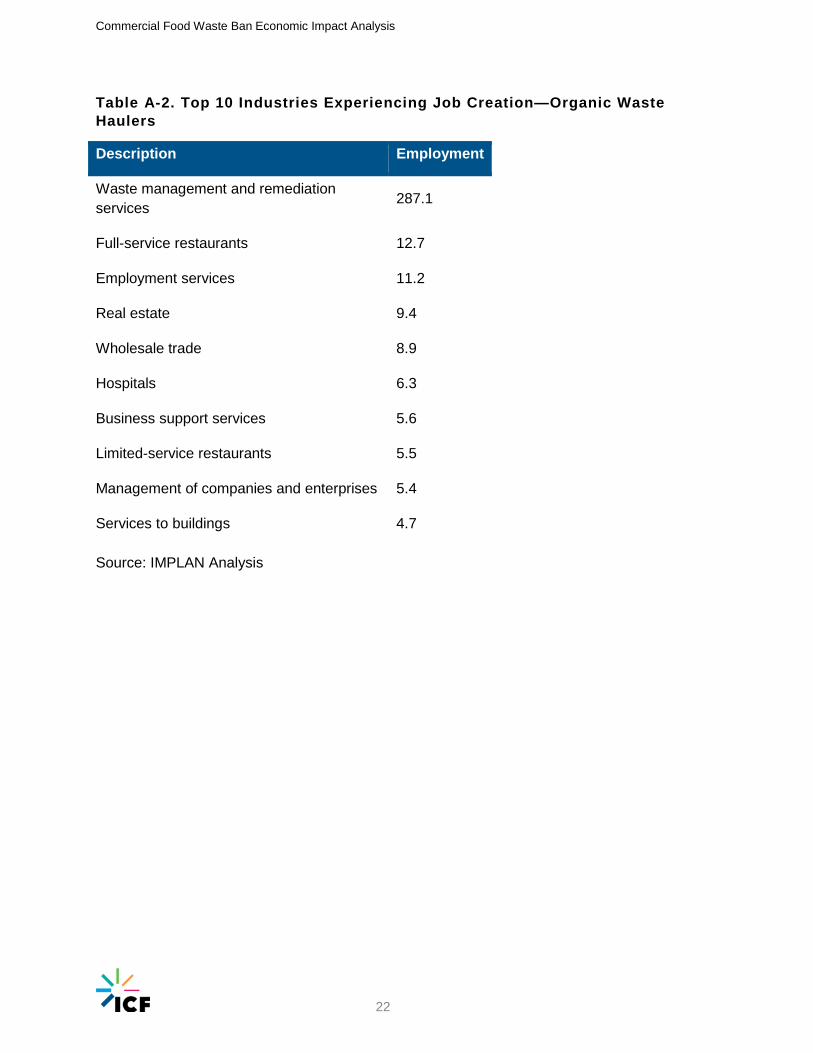
Table A-2. Top 10 Industries Experiencing Job Creation—Organic Waste Haulers
Description Employment
Waste management and remediation services 287.1
Full-service restaurants 12.7
Employment services 11.2
Real estate 9.4
Wholesale trade 8.9
Hospitals 6.3
Business support services 5.6
Limited-service restaurants 5.5
Management of companies and enterprises 5.4
Services to buildings 4.7
Source: IMPLAN Analysis

Commercial Food Waste Ban Economic Impact Analysis
23
Table A-3. Top 10 Industries Experiencing Job Creation—Organic Waste Processors
Description Employment
Waste management and remediation services 161.7
Full-service restaurants 7.5
Employment services 6.4
Real estate 5.5
Wholesale trade 5.2
Hospitals 3.9
Limited-service restaurants 3.3
Business support services 3.2
Management of companies and enterprises 3.1
Services to buildings 2.7 Source: IMPLAN Analysis
Commercial Food Waste Ban Economic Impact Analysis
24
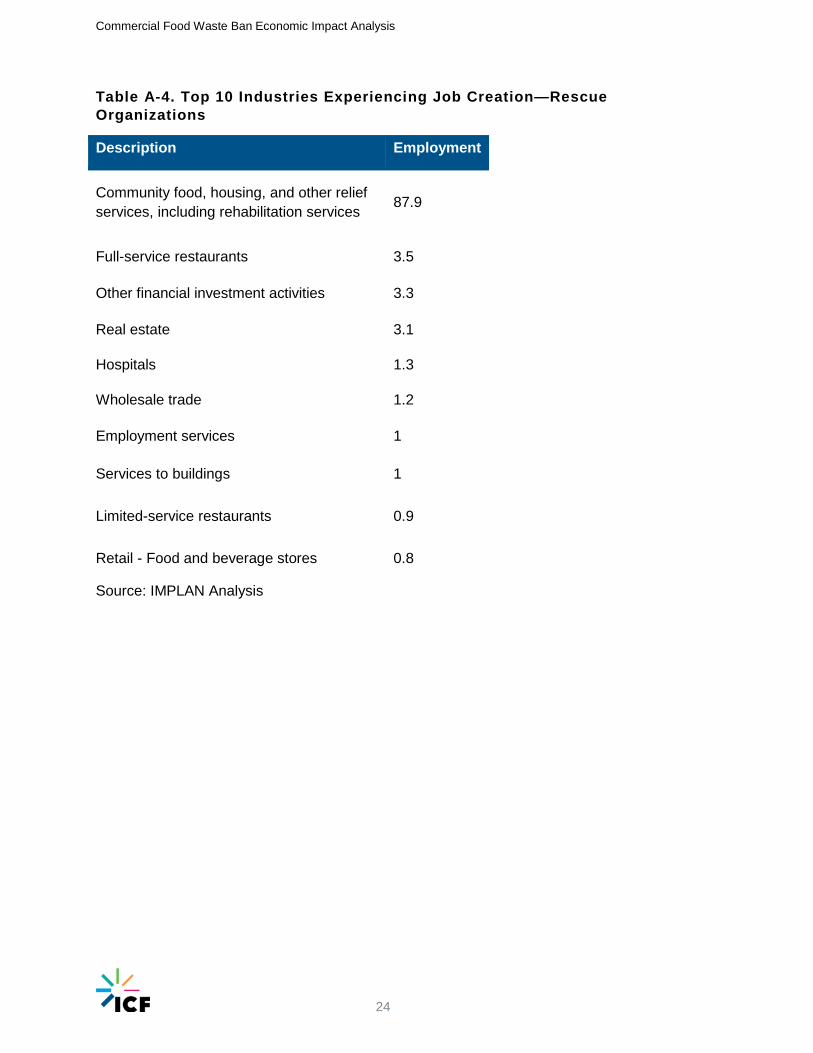
Table A-4. Top 10 Industries Experiencing Job Creation—Rescue Organizations
Description Employment
Community food, housing, and other relief services, including rehabilitation services 87.9
Full-service restaurants 3.5
Other financial investment activities 3.3
Real estate 3.1
Hospitals 1.3
Wholesale trade 1.2
Employment services 1
Services to buildings 1
Limited-service restaurants 0.9
Retail - Food and beverage stores 0.8
Source: IMPLAN Analysis
Commercial Food Waste Ban Economic Impact Analysis
25
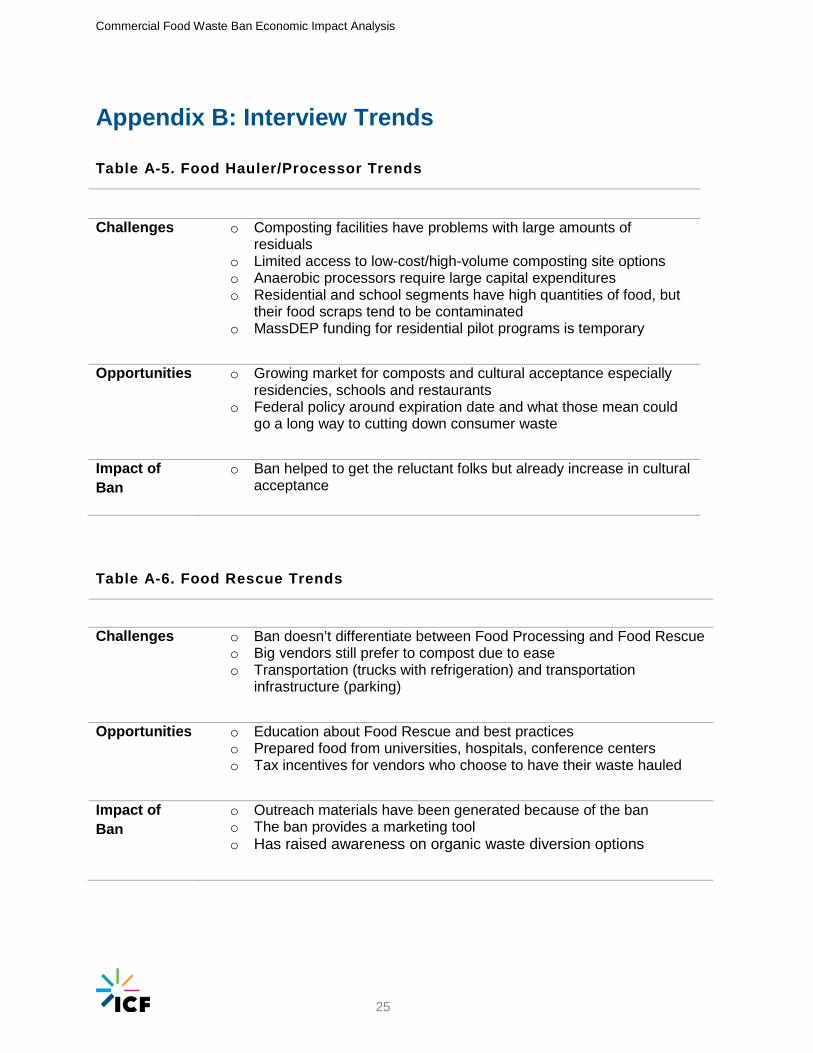
Appendix B: Interview Trends Table A-5. Food Hauler/Processor Trends
Challenges o Composting facilities have problems with large amounts of residuals
o Limited access to low-cost/high-volume composting site options o Anaerobic processors require large capital expenditures o Residential and school segments have high quantities of food, but
their food scraps tend to be contaminated o MassDEP funding for residential pilot programs is temporary
Opportunities o Growing market for composts and cultural acceptance especially residencies, schools and restaurants
o Federal policy around expiration date and what those mean could go a long way to cutting down consumer waste
Impact of Ban
o Ban helped to get the reluctant folks but already increase in cultural acceptance
Table A-6. Food Rescue Trends
Challenges o Ban doesn’t differentiate between Food Processing and Food Rescue o Big vendors still prefer to compost due to ease o Transportation (trucks with refrigeration) and transportation
infrastructure (parking)
Opportunities o Education about Food Rescue and best practices o Prepared food from universities, hospitals, conference centers o Tax incentives for vendors who choose to have their waste hauled
Impact of Ban
o Outreach materials have been generated because of the ban o The ban provides a marketing tool o Has raised awareness on organic waste diversion options