nepal economic growth assessment …pdf.usaid.gov/pdf_docs/pnadn016.pdfnepal economic growth...
TRANSCRIPT

NEPAL ECONOMIC GROWTH ASSESSMENT Agriculture
Submitted to USAID Nepal
Submitted by Madhab Karkee
Kathmandu, August 12, 2008
Table of Contents Figure index iii Box index iii Table index iii Picture index iii List of abbreviations v Executive Summary iv 1. Introduction 1 2. An overview of agriculture and poverty in Nepal 1 2.1 Sector structure 1 2.2 Sector performance 2 2.3 Poverty profile – trend and distribution 4 3. Constraints for growth in agriculture and poverty reduction 8 3.1 Technology -- production and productivity 8 3.2 Connectivity -- remoteness and access to facilities 10 3.3 Trade – scale and standards 11 4. Enabling environment 12 4.1 Policy context 12 4.2 Agricultural infrastructure 12 4.3 Institutional aspects 13 4.4 Development partnership in agriculture sector 15 5. International development assistance in agriculture 15 5.1 Foreign aid in agriculture 15 5.2 Some reflections on most recent USAID interventions in agriculture 17 6. Emerging new challenges 19 6.1 Climate change 19 6.2 Soaring food prices 20 6.3. Youth unemployment 21 7. Recommended arias for USAID support 22 7.1 Strategic thrust 22 7.2 Priority intervention areas 23 7.3 Proposed design approach 25 Annexes 27 References 42

Figure index Text Figure 1 Nepal: food grains self sufficiency ratio % 2 Figure 2 Nepal: high poverty groups and their poverty measurements 6 Figure 3 Nepal: proportion of selected groups in the poor population % 7 Figure 4 Nepal: Poverty by geographic region, 2003-2004 8 Figure 5 Nepal: yield trend of major cereals, 2000—2007 9 Figure 6 Nepal: % of households more than two hours from the nearest facility 11 Figure 7 Nepal: trend of foreign aid flow 16 Figure 8 Nepal: donors' share in foreign aid in agriculture through MoAC, 2003 – 2007 16 Figure 9 Nepal: percentage change in national average retail price of selected food items
between 2006/07 and 2007/08 20 Annex1 Figure 1 Nepal: importance of agriculture in he economy 27 Figure 2 Nepal: poverty rates by caste/ethnic groups 31 Box index Text Box 1 Nepal: agriculture's share in GDP 3 Box 2 Nepal: some indicators of mixed performance at the farm level
between 1995/96 – 2003/2004 4 Box 3 Nepal: Unequal performance in poverty reduction 5 Box 5 USAID Agricultural Program in Nepal 2003 -- 2009 17 Table index Annex 1 Table 1 Nepal: distribution of land holding by size group, 2001/02 (in %) 27 Table 2 Nepal: annual edible cereal grain production and requirement, 1991 – 2006 28 Table 3 Nepal: Share of commodities in Ag GDP 2001/02 and
change index 2006/07 (%) 29 Table 4 Nepal: Selected population groups with high poverty incidence, 2003-04 30 Table 5 Nepal: poverty by geographic region, 2003-04 30 Table 6 Nepal: Rural accessibility indicator: Mean travel time to selected nearest
facilities for rural households 31 Table 7 Nepal: foreign aid in agriculture as compared to total agricultural expenditure
and overall foreign aid 32 Table 8 Nepal: List of current foreign aided projects in agriculture (MoAC) 33 Picture index Annex 2 Picture 1: Demonstration of drip irrigation technology adopted by
farmer in Kaski district 34 Picture 2: Demonstration of treadle pump irrigation technology adopted by
farmer in Rupandehi district 34 Picture 3: A farmer growing hybrid tomato seed in Kaski district in
a plastic tunnel (size 12m x 4.5m) using drip irrigation 35
iii

Picture 4: The hybrid tomato farmer in Kaski district performing pollination 35 Picture 5: Tomato farming in plastic tunnel in Syangja district – suffering from
problem of welting 36 Picture 6: Bacterial infection in tomato produced in plastic tunnel in Tanahun district. 36 Picture 7: Weighing the farmers' produce in the collection center in
Syangja district using stone as surrogate to the standard metal weight 37 Picture 8: Farmer carrying tomato to the collection center at Syangja district in
a traditional container doko -- highly damage prone. 37 Picture 9: An instance of post harvest losses at the wholesale market at Pokhara 38
iv

List of abbreviations and acronyms
ADB Asian Development Bank AEC Agro-Enterprise Center AGDP Agricultural Gross Domestic Product APP Agriculture Perspective Plan APPSP Agriculture Perspective Plan Support Program BDS-MaPS Business Development Services - Marketing and Production Services CBS Central Bureau of Statistics CDR Central Development Region DFID Department for International Department/UK EDR Eastern Development Region FWDR Far Western Development Region FNCCI Federation of Nepalese Chambers of Commerce and Industry GDO General Development Office/USAID HoH Head of Household HVA High Value Agriculture IDE International Development Institute IFAD International Fund for Agriculture Development IPNS Integrated Plant Nutrient System LEISA Low External Input Sustainable Agriculture LRN Local Roads Network MoAC Ministry of Agriculture and Cooperatives MoF Ministry of Finance MWDR Mid-Western Development Region NARDF National Agricultural Research and Development Fund NDRI Nepal Development Research Institute NLSS Nepal Living Standards Survey NPC National Planning Commission NTFP Non-Timber Forest Product NTM Non-Tariff Measures NRs Nepalese Rupees RE Rural Eastern RW Rural Western SIMI Smallholder Irrigation Marketing Initiative SPS Sanitary and Phyto-Sanitary SRN Strategic Roads Network SSM Sustainable Soil Management TYIP Three Year Interim Plan WB The World Bank WDR Western Development Region WFP World Food Program
v

Executive Summary 1. USAID Nepal is presently undertaking a process of economic growth assessment as a
basis for designing its support to contribute to an inclusive economic growth in Nepal. The purpose of the present work is to make an assessment of agriculture sector as part of the overall assessment.
2. As agriculture continues to provide a broad base to the Nepalese economy, the growth
originating in agriculture holds high potential to have relatively wider impact on poverty reduction and inclusiveness.
3. Nepalese agriculture is one of small family farms that is mainly subsistence oriented
and yet not capable of supporting the adequate subsistence of the farm families. Agriculture production is heavily inclined to food grains production, paddy being the pervasively cultivated crop. However, the food self sufficiency is not ensured. The sector performance records a virtual stagnation with 2.7 to 2.8 percent average annual growth rates during past two decades.
4. As agriculture failed to grow, poverty remained largely an agricultural phenomenon.
Between 1995-96 and 2003-04 poverty declined by 26 %. Notwithstanding, the incidence of poverty is still high at 31 percent. Those employed in agriculture sector account for over three quarters of all poor. Spatially, Poverty is relatively high in Rural Eastern Hills where poverty increased.
5. Several constraints impede growth in agriculture. Nepal's agriculture remained
heavily lopsided to water intensive crop agriculture in a situation of inadequate back up of required inputs. Not more than a fifth of irrigable land has access to year round irrigation while use of improved seeds is quite disappointing. The sole reliance on import for supply of chemical fertilizer renders the availability uncertain and costly. The combined result is the persistently low yield of cereal crops. Agro-climatic diversity offers Nepal hills special comparative advantage in high value agriculture. However, taking advantage of such potential is limited by high transactions costs stemming from poor connectivity, deficiency of economies of scale, grades and quality compounded by weak agricultural R&D capacity.
6. There have been improvements in agricultural infrastructures in the recent years.
Works are under way to bring the last 12 districts into the national roads network soon. Recent spread of mobile phones opens up opportunities for effective and speedy market information system. Less than 10 percent population in rural areas has access to electricity which they use mostly for lights. The physical infrastructures that facilitate market transactions and post harvest performance are few to none in rural areas and their linkages with the urban market centers are weak.
7. The policy environment is generally oriented to agricultural diversification and
commercialization for broad based growth and poverty reduction. Following the implementation of Agriculture Perspective Plan, all the agriculture development plans
vi

and policies share this common thread. However, the stated policy intentions are hard to realize in the situation of persistent underinvestment and a huge human resource gap in the government system. The government now recognizes the role of private sector, cooperatives and NGOs; and has been more open to public private partnership. There have been achievements in social capital formation in the form of functional civil society and advocacy groups as well as organization of farmers into beneficiary groups.
8. Foreign aid flow, which is a source for nearly a third of public investment in
agriculture, remained stagnant during past two decades. Donor supports in agriculture are mainly focused on infrastructure, natural resource sustainability, and livelihoods improvement.
9. In recent years (2003 onwards), USAID has supported quite a number of program
activities in support of small holder farmers. The main focus of USAID's agricultural programs has been to contribute to the strategic objective of increased sustainable production and sales of forest and high-value agricultural products. The emphasis was laid the development of supply chains, production service provisions and marketing chains.
10. USAID supported programs in agriculture demonstrate that linking to markets with
some minor but critical technological intervention and social mobilization can significantly catalyze small holder farmers to the pathways out of poverty. The nascent enterprise, however, is still vulnerable to shocks of crop or market failure; and there lies ahead the challenges to develop it to benefit from the opportunities of the export market as well. The issues of plant and crop protection at the farm, and grading, packaging and standardization at the market await intensified interventions.
11. Some newly emerging challenges are facing Nepal's agriculture. The trend of climate
change has increased the vulnerability of both water intensive cropping system and rainfed agriculture. The soaring food price are affecting the food security and increasing vulnerability of the poor and small holder farmers as they are the net food buyers. For rural youths, agriculture is becoming least preferred vocation even as there is high unemployment rate among them.
Recommendations 12. In view of the above assessment, following criteria have been derived to guide the
strategic choice in relation to the forthcoming support program for inclusive growth in agriculture sector:
• Water intensive and external input dependent crop agriculture seems untenable for
growth and income sustainability in the context of small holder agriculture.
• Market opportunities are emerging for diversifying and commercializing small holder farming.
vii

• Quick outcome interventions working more directly with the beneficiaries are the
better bets in the given political-economic context.
• Building on the current achievements, consolidating them further and up scaling to reach the outliers and left out areas would be better strategy to pursue than to get into new fields.
13. Based on these criteria, connecting small holder farmers to markets through
promotion of high value agriculture emerges as the strategic choice. The following intervention areas are recommended to this end:
i. Sharpen Focus on high value agriculture
A shift to high value agriculture uniquely matches the need to taking pressure off the intensively irrigated cereals and enlarging small holder farmers' opportunities to benefit from expanding domestic and export markets. High value agriculture gives more value to per unit water application and has higher employment elasticity.
ii. Consolidate and build on value chain outcomes achieved in the Western
districts
Previous interventions in the Western Hills and Terai districts have prepared groundwork for uptake of high value agriculture. However, there are still some missing links to be sufficiently addressed. The farmers are faced with the emerging issues of risks of crop failure and market failure. An R&D system for rapidly responding to the farm problems through action and adaptive research and extension need to be developed and put in place. Appropriate grading, packaging and effective information and communication need also to be ensured. There is also scope for expanding the coverage further beyond the immediate vicinity of the road corridor working with less perishable products.
iii. Encourage plowing back remittance income into enlarging opportunities
in HVA for the rural youth
Remittance could be source for enlarging opportunities for rural youth in HVA and thereby containing both the remittance and rural youth within rural circuit that is linked to the wider economy. Agricultural enterprise advisory services, enterprise schemes, enterprise management and skills trainings could be instrumental for attracting rural youths (including the back-home migrants) in HVA. Linking to the market information system developed and operated by AEC could be an area for involving rural youth.
iv. Reach the excluded geographic region and ethnic community in the Eastern
Hills
viii

ix
Certain underprivileged districts in the Eastern Hills are home to high concentration of poverty. There is the scope for spreading the success cases of the previous interventions. There are options of working with judiciously selected relatively less perishable commodities such as garlic, red pepper (round) herbs and NTFP based commodities.
14. It is proposed that the design of the program package should adopt a three pronged
approach as follows:
i. Reducing costs and risks
Commercialization entails not only income but also costs and risks. Reducing such costs and risks are the keys for connecting small holder farmers to markets. High risks are associated with harvest and price uncertainties. Reducing such risks is essential to induce farmers to reallocate their land resource from staple food grains production to HVA.
ii. Promoting low external input sustainable agriculture (LEISA) technology.
Reliance on external and costly inputs make small holder farmers vulnerable to frequent supply breaks and rising costs, such as in case of chemical fertilizer. On the other hand the promotion of self reliant technology such as organic farming offers more sustainable alternatives.
iii. Promoting innovative institutions and linkages.
Institutions may be innovated to facilitate reduction of costs and risks and promote local resource based technology. Institutions that encourage collective action of small farmers, development and spread of grades and standards, responsive R&D effective market information, weather based insurance, etc. are important for high value agriculture.

NEPAL ECONOMIC GROWTH ASSESSMENT -- Agriculture 1. Introduction USAID Nepal is presently undertaking a process of economic growth assessment as a basis for designing its support to contribute to an inclusive economic growth in Nepal as the country prepares for embarking on prosperity, modernity and just society through consolidation of ongoing peace process. Fostering high economic growth and enhancing access of the poor and excluded to the benefit of growth is the basis for sustainable peace and poverty reduction. Agriculture sector is the important sector of the economy that holds the potential of such broad based and pro-poor growth. The present assessment is to complement to the overall economic growth assessment process from the perspective of agriculture sector. The purpose of this assessment is to identify key constraints and opportunities for growth in agriculture sector, review policy environment and ongoing activities of development partners in the sector to outline the scope for USAID support to help spur inclusive growth in agriculture. The present assessment was carried out involving reviews, interactions and field visits in a period of July 10 to August 2. 2. An overview of agriculture and poverty in Nepal 2.1 Sector structure Agriculture continues to provide a broad base to the Nepalese economy. Nearly four fifths of all Nepalese households are essentially farm households,1 who derive nearly half of income from agricultural sources consisting of farm income and agricultural wage income (Annex 1, Figure 1). Engaging two-thirds of labor force, this sector alone contributes some one-third to the GDP. As such, the growth originating in agriculture holds high potential to have relatively wider impact on poverty reduction and inclusiveness. Smallholders and marginal farms predominate Nepalese agriculture with the average holding size of 0.8 ha. Nearly a half of all farms have less than 0.5 ha of land, while those with less than 1 ha of land constitute nearly three-fourths of all holdings (Annex 1, Table 1). Farms are getting smaller – average size of holding declined by 28 percent between 1961 and 2001. Landless farmers are gradually leaving agriculture as it is hard to eke out livelihood there without holding land asset. The number of holdings without land has decreased by 16.8 % from 32.1 thousand in 1991/92. The number of permanent agricultural workers declined to 179 thousand persons – down by some 41 %.
1 Of the total 4.25 million households, 3.36 million constitute agricultural holdings.
1

Nepal's agriculture is overwhelmed by subsistence family farms. Seventy-eight percent farm holdings have been reported to be producing mainly for home consumption. The proportion of holdings that produce mainly for sale is not even 1 percent, while little over 21% farm families use their farm produce almost equally for both sale and home consumption (CBS, WB, DFID, and ADB, 2006). Ironically, these subsistence farms are not capable of supporting the adequate subsistence of the farm families. For 60 percent holdings the annual farm production was not sufficient to feed their household until the next harvest; 40% holdings were deficient for up to 6 months while 20 percent holdings were deficient for more than half a year. Agricultural production is mostly dominated by crop sub-sector which accounts for nearly two-third of AGDP. Cereal crops account for over 80 % of annual cropped area wherein paddy alone occupies 40 percent followed by maize (about 20%) and wheat (about 17 %). Cropping intensity is low at 1.8 on the average. Farms operate in a mixed farming system of crop and livestock interfacing forest. Large livestock population provides sources of meat, milk, draft power and farm yard manure. Production of staple food grains is the choice of common priority for the farms, especially production of paddy wherever it is possible to grow. 2.2 Sector performance Overall economy and agriculture is not doing well in recent years. Overall economic growth rate declined from 4.8 percent in the 1990s to 3.2 percent during 2001-2006. Agriculture virtually stagnated -- agriculture sector growth rate was 2.7 percent per annum in the 90s and 2.8 percent during 2001 to 2006. Marred by low labor productivity, agriculture is not able to contribute to the economy its due (33 percent share of GDP with 66 percent of country's labor force employed in the sector). Growth of cereals production remained weak, cash crops had mixed performance, while high value horticulture crops performed relatively better. Yields of cereals are persistently low. Yield estimates per hectare for 2007 have been reported to be at 2.77 mt for paddy, 2.16 mt for maize and 2.23 mt. for wheat. It is to be noted that this year is considered to be a good crop year due to better monsoon records (MOF, 2008). Nepal's agriculture is heavily inclined to food grains production guided by food sufficiency objectives and yet the food self sufficiency has often been in the doldrums (Figure1).
Figure 1 Nepal: Food grains self sufficiency ratio %
80
90
100
110
120
1991
1992
1993
1994
1995
1996
1997
1998
1999
2000
2001
2002
2003
2004
2005
2006
%
Source: Annex 1, Table 2.
2

Average annual production of food grains is estimated to the tune of 7.7 million tons, of which paddy alone constitutes nearly a half. During deficit years, the food grains shortfall ranged from 22 thousand tons to 485 thousand tons while surplus during better harvest years ranged from 68 thousand tons to 213 thousand tons (Annex 1, Table 2). Agriculture registered an impressive 5.7% growth last year 2007. Whether this rate will sustain depends largely on the monsoon pattern this year and thereafter. The economy has been apparently undergoing some structural changes with the shrinkage of agriculture relative to the secondary and tertiary sectors of the economy (Box 1).
Box 1 Nepal: Agriculture's share in GDP
45% 37%
33%
1991 2001 2007 Source: MoF (2008)
Within agriculture, some commercialization and diversification have been taking place in recent years taking advantage of rapidly unfolding market opportunities created by improvement in accessibility and fuelled by growth in size of urban population. Some indicators of farm level performance in this connection have been presented in Box 2. Despite greater intensification of crop production, return from crop production declined, while return from livestock rearing improved. Cost -- price squeeze intensified in crop agriculture. Likewise, importance of agriculture as a source of household income declined, although it still continues to be the single largest source of household income. Some framers in the better endowed and well connected areas are getting involved in producing high value commodities for commercial purposes. Fruits, vegetables, spices, tea and livestock products are increasing and products like coffee and honey are emerging (Annex 1, Table 3). However, the pace is not very impressive. During the period 1995 to 2005, average annual growth rates for fruits, milk and meat hovered around 3 percent; only the growth rate of vegetable production was an exception at 5.1 percent per annum on the average during this period.
3

Agricultural exports are smaller than agricultural imports by a large margin. In 2006, the country exported a meager two-fifths of what it had to import (NRs 35 billion in value terms) resulting in a huge trade deficit. Only a small range of agricultural commodities aggregated from small producers are exported mostly in raw form and mainly to India. Export of commodities like vegetable, fruits and live animals, whose production has been increasing remarkably, has remained negligible as compared to import from India. Export of vegetable compensated for little over one percent of import from India, while export of fruits was way below one percent of import from that country. Export of live animals accounted for nearly 11 percent of import. There exists a large domestic market for the domestic supply to cater if production takes place in a competitive manner. 2.3 Poverty profile – trend and distribution Poverty declined between 1995-96 and 2003-04. Overall incidence of poverty (number of people bellow poverty line) declined by 26 % (from 42% to 31%) – a rate of 3.7% per annum. This achievement in poverty reduction during a period of prolonged conflict is considered to have been driven by improvements in remittance, agricultural wage, connectivity, urbanization and dependency ratio (CBS, 2005). During the period, remittance income increased steadily approaching equivalent to 12 % of GDP. It reached 16 percent of GDP in 2007. Agricultural wages rose by 25 %, while non-agricultural wages rose by 20 percent, and skilled wages more than doubled. Network of district and rural roads increased at the rate of 11% a year. Improvement in rural connectivity helped raise nonagricultural employment and incomes. Non-farm income increased from 14% to 17%. Urbanization helped poverty reduction as low productivity rural workers moved to high productivity activities in the cities. Decline in the dependency ratio from 97 in 1995/96 to 89 in 2003-04 helped increase the consumption expenditure per capita.
• Farm income declined by 4% • Agricultural wage income declined by 19% • Share of household income from farm
declined from 47% to 39% Source: CBS, WB, DFID and ADB (2006)
• Cropping intensity increased from 1.6 to 1.8. • Real per capita crop income declined at the
rate of 0.5% per annum. • Price of inputs increased while price of major
farm outputs declined (e.g., real price of paddy declined by 12%)
• Real income per livestock unit increased at the rate of 4% per annum
Box 2 Some indicators of mixed performance at the
farm level between 1995/96 – 2003/04 • Proportion of gross crop output sold
increased from 19% to 25% • Proportion of hh selling crops increased from
34% to 54% • Share of purchased inputs increased
• Share of cereal crops in gross crop output
went down from 76% to 69%. • Fruits and vegetables production has
increased importance among small and medium farms – more so in the western hills and mountains (15%)
• Shift in livestock herd from large animals to small ruminants (29% up) and poultry (18% up)
4
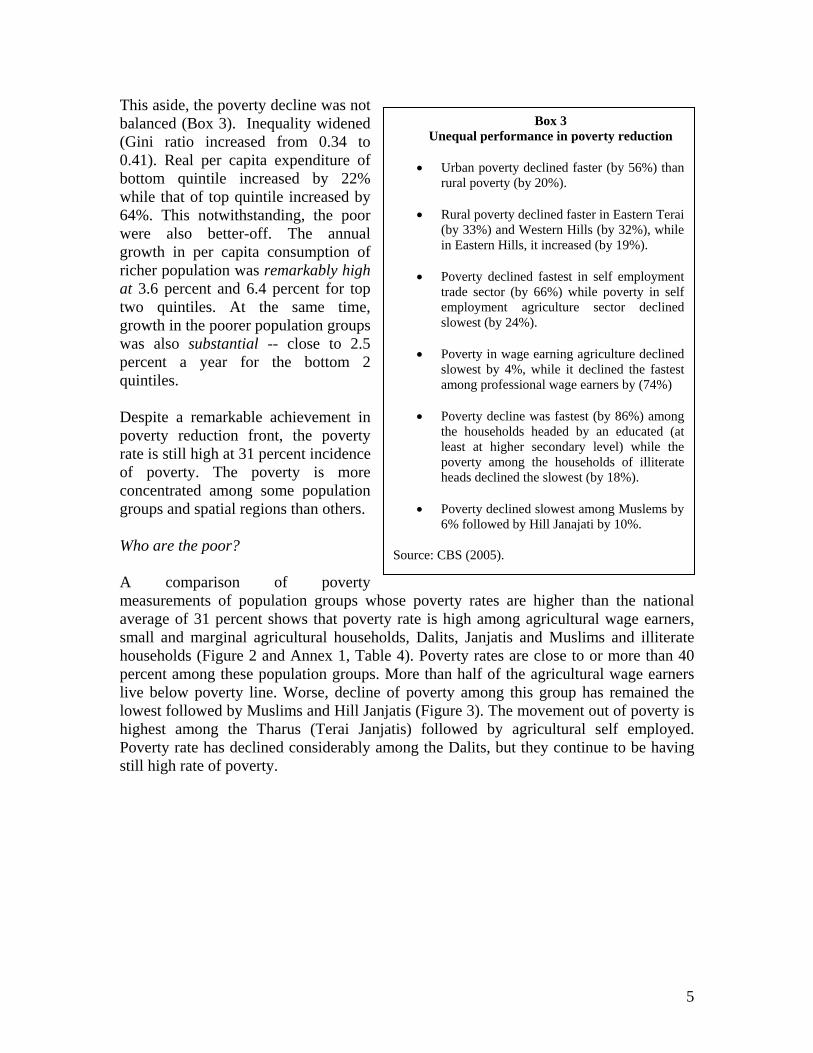
This aside, the poverty decline was not balanced (Box 3). Inequality widened (Gini ratio increased from 0.34 to 0.41). Real per capita expenditure of bottom quintile increased by 22% while that of top quintile increased by 64%. This notwithstanding, the poor were also better-off. The annual growth in per capita consumption of richer population was remarkably high at 3.6 percent and 6.4 percent for top two quintiles. At the same time, growth in the poorer population groups was also substantial -- close to 2.5 percent a year for the bottom 2 quintiles. Despite a remarkable achievement in poverty reduction front, the poverty rate is still high at 31 percent incidence of poverty. The poverty is more concentrated among some population groups and spatial regions than others. Who are the poor? A comparison of poverty measurements of population groups whose poverty rates are higher than the national average of 31 percent shows that poverty rate is high among agricultural wage earners, small and marginal agricultural households, Dalits, Janjatis and Muslims and illiterate households (Figure 2 and Annex 1, Table 4). Poverty rates are close to or more than 40 percent among these population groups. More than half of the agricultural wage earners live below poverty line. Worse, decline of poverty among this group has remained the lowest followed by Muslims and Hill Janjatis (Figure 3). The movement out of poverty is highest among the Tharus (Terai Janjatis) followed by agricultural self employed. Poverty rate has declined considerably among the Dalits, but they continue to be having still high rate of poverty.
Box 3 Unequal performance in poverty reduction
• Urban poverty declined faster (by 56%) than
rural poverty (by 20%).
• Rural poverty declined faster in Eastern Terai (by 33%) and Western Hills (by 32%), while in Eastern Hills, it increased (by 19%).
• Poverty declined fastest in self employment
trade sector (by 66%) while poverty in self employment agriculture sector declined slowest (by 24%).
• Poverty in wage earning agriculture declined
slowest by 4%, while it declined the fastest among professional wage earners by (74%)
• Poverty decline was fastest (by 86%) among
the households headed by an educated (at least at higher secondary level) while the poverty among the households of illiterate heads declined the slowest (by 18%).
• Poverty declined slowest among Muslems by
6% followed by Hill Janajati by 10%. Source: CBS (2005).
5

<== ==> % change between 1995/96 and 2003/04 head count rate (%) 2003/04 Source: CBS (2005)
Muslems
Terai Janajatis (Tharu)
Hill Janjatis
Dalits
Illiterate HoH
0.2 – 1.0 ha land holder
< 0.2 ha land holder
Agricultural self employed
Agricultural wage earners
6231 0-31-62
-6
-34
-10
-21
-18
-15
-18
-24
-4
41
35
44
46
42
38
39
33
54
Figure 2 Nepal: high poverty groups and their poverty measurements
Employment sector wise, agricultural self employed constitute more than two-thirds of all poor. Together with agricultural wage earners (11 percent), those employed in agriculture sector account for over three-quarters of all poor (Figure 3). Viewed from land holding size category, small and marginal holders together account for 76 percent of all poor. It is to be noted that the proportion of population with smaller land holdings has been increasing over time (see section 2.1). Across ethnicity, the number of poor among Dalits, Janjatis and Muslims account for well over half of total poor population in the country. Obviously, majority of the poor are also illiterate.
6

Figure 3 Nepal: proportion of selected groups in the poor populatin (%)
51
25
57
7167
11
0
100
Agriculturalwage earners
Aagriculturalself employed
Illiterate HoH Dalit, Janjatiand Muslim
Marginalfarmers (< 0.2
ha)
Small holderfarmers (0.2 –
1.0 ha)
%
Source: CBS (2005)
Where do the poor live? Obviously 95 percent poor live in the rural areas (Annex1, Table 4). It is usually also a common knowledge that poverty rate is high in remote areas of Mid- and Far-Western Development Regions and in Hills and Mountains compared to the Terai. But a closer look at the poverty incidence across the rural Hills reveals that poverty is relatively high in Rural Eastern Hills (Figure 4). Moreover, it is the only region where poverty rate has increased by 19 percent in eight years amidst a generally declining poverty in the country. The general patterns of regional disparity shown by the dispersal of poverty across development regions tend to hide the fact that some high poverty Hill districts have been coexisting in the relatively prosperous Eastern Development Region. There is no district level data readily available to identify the particular districts. However, it is known that a set of districts in the Koshi and Sagarmatha Hills (viz., Bhojpur, Khotang, Sankhuwasabha and Solukumbu) are yet to be fully connected by roads and tend to have been bypassed generally by the development interventions on that ground. Besides, remittance – an important driver of poverty reduction -- is relatively low in this region (CBS, 2005). Hatlebakk, 2008 informs that migration is at the lowest in the Eastern Hills and migration there is mostly limited within Nepal2. Notably, poverty rate has increased among Rai, Tamang, Libbu and Sarki communities between 1995/96 and 2003/04 (Annex 1, Fiure 2). Incidentally, most of these ethnic communities live in those lagging districts of the Eastern Hills.
2 Hatlebakk,M (2008) has cited the findings of Gurung, Y. (2008), Social Exclusion and Migration in Nepal: Who Go Where? In work, CMI-CEDA project on Social Exclusion.
7

Mountain Hill
Terai
FWDR
RW Hills RE Hills
RW TeraiRE Terai
EDR CDR
WDR MWDR
50-50 0 <== ==>
% change between 1995/96 and 2003/04 Poverty rate (%) in 2003/04 Source: CBS (2008)
19
28
33 35
41 45
29 27 27
25
38 43
37
-32
-15
-43
-36 -25
-30
-17
-25
-33
-17
-32
Figure 4 Nepal: Poverty by geographic region, 2003-04
3. Constraints for growth in agriculture and poverty reduction Given the breadth of the dependency of the poor for their livelihood source on a stagnant agriculture, the correspondence between growth in agriculture and poverty reduction cannot be overemphasized. As agriculture failed to grow in the past, poverty remained largely an agricultural phenomenon. A growth originating in smallholder farms would have an inclusive outcome in poverty reduction. Several constraints impede such growth in agriculture. These constraints can mainly be summarized in the following categories. 3.1 Technology -- production and productivity Nepal's agriculture remained heavily lopsided to water intensive crop agriculture for long. Critical input for cereal crop based agriculture to grow is the farmers' capacity to control the irrigation water on a year round basis. Large majority of agricultural land has not been brought under the command of irrigation infrastructure, let alone the access with required reliability, control and use efficiency. Nearly two-fifth of agricultural land has been reportedly brought to the command area of irrigation. Only about a fifth of irrigable land is reportedly under year round irrigation. Utilization of developed infrastructure with enhanced water use efficiency has remained a challenge; and so is the case with respect to ensuring the access of small and marginal farmers to the created opportunities given the generally disadvantageous location of land they own.
8

Seed is another critical input – studies reveal that improved seeds alone hold the potential of contributing up to 20 percent to the yield increment. According to the National Living Standard Survey 2003-04, only about 25 percent of households were found using improved seeds. The main crops using improved seeds were vegetables and winter potatoes. For the main cereal crops, however, use of improved seeds is quite disappointing. Awareness and availability are the problems than cost. For cereal crops to attain the potential productivity frontiers, application of chemical fertilizer in required doses is essential. There are evidences of gradual increase in the use of chemical fertilizers in recent years, but its effectiveness in terms of the quality of the fertilizer (mostly imported from informal channels from Indian borders) and quantity applied are often questioned. On average, real per hectare expenditure on fertilizer increased by almost 60 percent between 1995 and 2003, driven largely by increase in prices (CBS, WB, DFID and ADB, 2006). Moreover, uncertainty looms large on the dependency on an imported input trending towards continuous price rises in the world market. Affordability and sustainability of the dependence of small holder farmers on such inputs are uncertain. The combined result of the above is the persistently low yield of cereal crops that are the source of 37 percent of AGDP (Annex 1, Table 3). The yield of paddy remained virtually stagnant for last eight years (Figure 5). Yield growths of maize and wheat were also minimal. Yields of major crops are considerably lower than many Asian countries. Nepal's paddy yield at 2.6 mt/ha in 2006 compares with 3.7 mt/ha in Indian Punjab, 4.9 mt/ha in Vietnam and 6.3 mt/ha in China (World Bank, 2008).
Figure 5 Nepal: yield trend of major cereals, 2000--2007
0.0 0.5 1.0 1.5 2.0 2.5 3.0 Ton/ha
2000 2001 2002 2003 2004 2005 2006 2007
Source: MoAC
Paddy Maize Wheat
Farmers suffered from cost-price squeeze in cereal crop sector as price of inputs increased while price of farm outputs declined (CBS, WB, DFID and ADB, 2006). Low access of farmers to R&D services is another impediment to agricultural growth. Although a nationwide network of agricultural research and extension systems exists in
9

the public sector together with other service providers in the private sector including NGOs, only 20 to 25 percent farmers come under their effective coverage. Moreover, present R&D system is tuned heavily to cereal crops and less capable of responding to the demands of emerging high value agriculture which demands highly on measures to protect against risks of crop failure on the field and market losses during post harvest operations. Low level of commercialization is in itself a barrier to growth in agriculture. Growth cannot be spurred in subsistence agriculture – it has to be increasingly linked to the market producing in response to the market signals. According to the World Bank estimates from NLSS data, only 25 percent of gross crop output is sold by the farmers. The marketed proportion is 21% for paddy, 26 percent for wheat, 9% for summer maize and 32% for lentils. Share of output sold is not impressive even for crops like winter potato (31%), summer potato (52%), ginger (15%) winter vegetable (43%) and banana (59%). Associated with being connected to the market are costs and risks besides the remuneration. Such costs and risks are high for Nepalese farmers. 3.2 Connectivity -- remoteness and access to facilities Remoteness is the greatest constraint for growth and prosperity in Nepal – more so for agricultural growth to be led by commercialization of perishable high value commodities. Enhanced connectivity is the necessary condition for overcoming the remoteness. The level of connectivity required for the diversification and commercialization of agriculture is still far from being meaningful to the small holder farmers scattered around the interior parts of the country. The average travel time (mean) required for rural households to get connected to facilities and markets are prohibitively long (Annex 1, Table 6). An average household needs to spend more than 3.5 hours to reach the nearest bus stop and over 2 hrs to the nearest market center and Agriculture Center. Nearly two-fifths of the rural households live more than two hours away from paved road, over one-fourth live two hours away from nearest bus stop or a telephone booth, while little less than one-third households are two hours away from market center or Agriculture Center (Figure 6).
10

Figure 6 Nepal: % of households more than two hours from the nearest facility
26
39
20
31 3135
43
13
26
Bus stop
Paved road
Dirt road, ve
hicle passable
Market center
Agriculture ce
ntre
Coperative
Commercial bank
Hat bazzar
Telephone booth
Source: CBS, NLSS 2003/04
The terrain and transportation constrict the market circulation of bulky and volume intensive products. 3.3 Trade – scale and standards Agro-climatic diversity offers Nepal hills special comparative advantage in high value agriculture both for import substitution at the growing domestic market and export to the rapidly expanding markets across the border fuelled by a growing economy in neighborly India. However, taking advantage of such potential is limited by high transactions costs stemming from the deficiency of economies of scale in aggregation and standardization. Small farmers generate small marketable surplus at scattered production units and pockets. Grading and quality standards are difficult to carryout and maintain. The markets are becoming more demanding in terms of food safety, and plant, animal and human health. It is a costly business for small and scattered farms and agribusinesses to comply with the demanding sanitary and phyto-sanitory regulations and to meet the other non-tariff measures (NTMs) (such as labeling, packaging, good agricultural practices) of public and private origins. For small farmers operating in less organized fashion in areas of inadequate infrastructure, the regulations pose big challenges. The richer the market, the larger are found the restrictions under standards and regulations (Pant, 2007)
11

4. Enabling environment 4.1 Policy context The 20 year Agriculture Perspective Plan (APP) 1997—2017, Poverty Reduction Strategy Papers or the medium term periodic plans (Tenth Five Year Plan and Three Year Interim Plan), and the National Agriculture Policy, 2004 outline the broader policy context for agriculture development in Nepal. APP emphasizes on few priority inputs, outputs and outcomes. The 'green revolution' package for the Terai and high value commodities for the hills are the strategies to be pursued to achieve catch-up growth, agribusiness, poverty reduction and environmental outcomes. Regional interaction between the Hills and the Terai based on their respective specific comparative advantages were central to the APP thrust and was premised basically on the proposition of rural growth linkages.
The subsequent medium term periodic plans and policies in agriculture draw on the fundamentals set by APP and share the common thread of agricultural commercialization and diversification for broad based growth and poverty reduction. Ensuring food security and enhancing the inclusiveness of agricultural growth to benefit the cross-section of social groups as well as conservation and utilization of agro-biodiversity are the complementary policy planks of the current TYIP. Priority has been accorded to unleashing the potential of agriculture in enlarging the range of productive and self-realizing opportunities and reaching the created opportunities to the masses.
Specific policies and strategies subsequently formulated are geared towards promoting a market based and commercial agricultural production and marketing system in the country. Liberalization, deregulation and devolution are central to the policy regime that is aligned to the larger participation of multiple actors in service provisioning. Private sector and NGOs roles are recognized and the role of the state has been oriented increasingly to facilitation rather than implementation unlike in the past. 4.2 Agricultural infrastructure Substantial achievements have been made in roads network in the recent years. The Strategic Roads Network (SRN) stretched over 17,782 km until the end of the 10th plan 2006/07. SRNs are the main national arteries providing inter-regional connections and links to district headquarters, international borders and key economic centers. Out of 75 districts, 63 district headquarters have been brought under this network while works are under way at different stages in the remaining 12 districts which have been targeted to be connected by roads in the current TYIP period (NPC, 2007). In addition, the complementary network of district and rural roads, known as Local Roads Network (LRN), are important to enhance market access. There has been considerable improvement in the recent years in this sector. Between 1995/96 and 2003/4, district and rural roads increased by 11 percent. However, their purposes of
12

enhancing agricultural market access are often compromised by the tendency of dominating their alignment by other political interest rather than connecting production areas to the market. The large, medium and small irrigation schemes developed through public investment or farmers' own expenses have covered nearly two-fifths of cultivated land. Even within this limited command area of irrigation, the efficiency of on-farm water distribution networks is low -- effectively leaving large part of farms unirrigated (section 3.1). Moreover, the maintenance of sizable irrigation schemes in the hills is difficult and costly. Recently, there has been a reorientation of the government emphasis on promoting small3 and micro irrigation to enhance the effective use of irrigation water by the mall farmers (MoAC). Shallow Tube Well irrigation has been the priority for the Terai since the implementation of APP as a measure to ensure year round irrigation under farmers' control. But progress on this is limited by factors such as constraints of finance, energy availability and prices and policy controversy of capital grant (MoAC, 2007). The physical infrastructures that facilitate market transactions such as collection centers and haat bazaars (periodic markets) are few to none in rural areas and their linkages with the urban market centers are weak. Market infrastructures related to the performance of the commercialized commodities during post harvest stages along the value chains are extremely inadequate. Efficient storage structures at farm, collection centers and even the terminal markets are lacking. Cellar or rustic storages at the farm and collection center level and moderate cool chambers or modern cold storages at the urban market premises would enhance the life and competitiveness of perishable products. Quality citification system and quarantine establishments that operate at specified transit points along the border suffer from poor physical and human resource capacity. Rural electrification has been taking place as a priority. However, only less than 10 percent population in rural areas has access to electricity and they use it mostly for lights. Rural electrification as a source of energy to operate irrigation pumps has not been of avail to the farmers. Expensive capital investment is required to connect to the farms to access the facility of differentiated tariff rates. The spread of telecommunication facility to cover the length and breadth of the country opens up opportunities for effective and speedy market information system. This has been particularly made possible by the very recent spread of mobile phones even in remote villages. The present teledensity of nearly 10 lines per hundred persons is to be increased to 25 lines per 100 persons (i.e., one line for every four persons) by the end of the TYIP. 4.3 Institutional aspects There exists a public sector national agricultural research and extension system covering the entire country. But its capacity to deliver as per the demands of the commercial 3 The command area for small irrigation has been defined as not more than 25 ha in the hills and 200 ha in the Terai.
13

agriculture is severely limited by its long standing focus on cereal based agriculture and given the ever growing scale of demand for services. Agricultural and livestock services centers and the technicians located there are the front line extension workers who are the point of first contact to the farmers. One such center covers 3-4 villages making the farmers to technician ratio prohibitively high. Moreover, their skills are not regularly updated through adequate refresher trainings. The growth of government investment in support of 'core' agricultural activities have remained minimal and has, in fact, declined in real terms over the years. Average annual government expenditure in agriculture was NRs 2.31 billion during the Ninth Plan (1997/98 – 2001/02) and 2.35 billion during the Tenth Plan (2002/03 – 2006/07). The government system suffers from a huge human resource gap which is likely to widen in immediate future due to a weak human resource planning. Even as an overwhelming majority of staff with higher education are set to retire within a couple of years, opportunities for higher education for the new entrants have been disproportionately few. While the government is unable to fund the required higher education of its staff, the donors funding -- the major contributor to the human resource development until the early 1980s -- have drastically shrunk in the subsequent years till now. For Nepal's small holder agriculture, the absence of technology as such is not as much a problem as the failure of the existing centralized system of research and development to make them available to the farmers through sufficient action and adaptive research to suit the localized conditions. In view of this, a new institution namely National Agriculture Research and Development (NARDF) has been established that follows the competitive grant system to promote demand driven and decentralized action and adaptive research and development. The institution, however, suffers from the limited capacity to manage the fund as well as the inadequacy of the funding itself. There has been emergence of a functional civil society and advocacy groups helping empower the farmers to access service provisions, market access and better bargains, and voice in program formulation and implementation. Of some 20 thousand active NGOs, nearly half are engaged in community and rural development (NPC, 2007). Quite a large number of national NGOs active in agricultural sector have undergone promising institutional growth and have emerged as matured institutions for agricultural service delivery. Some of them (e.g. CEAPRED and DEPROSC) have already partnered successfully with USAID in the implementation of its agriculture program. At the beneficiary level, organizing farmers into beneficiary groups has been the central modus operandi for service delivery for more than 3 decades now. This is an innovative response to the challenge of reaching to the large scattered small farmers with limited resources. More than 13,000 farmers groups have been organized under the aegis of MoAC alone. These groups are mobilized to mature into farmers associations and cooperatives. This has been an effective process of social capital formation.
14

4.4 Development partnership in agriculture sector
The agriculture sector in Nepal has been suffering from persistent underinvestment. Successful countries have invested in agriculture before taxing it to finance industrial development (WB, 2007). Public spending in agriculture as percent of agricultural GDP is less than 3 %. in Nepal. Transforming countries invested at least 10 % during their growth spurt years (World Bank, 2007). Modernization of agriculture through technology intervention and linking it to markets through infrastructure, institutions and information are the necessary conditions for which huge investment is required. In rightful cognizance of this, agriculture sector has received high priority for development investment in the current development plan.
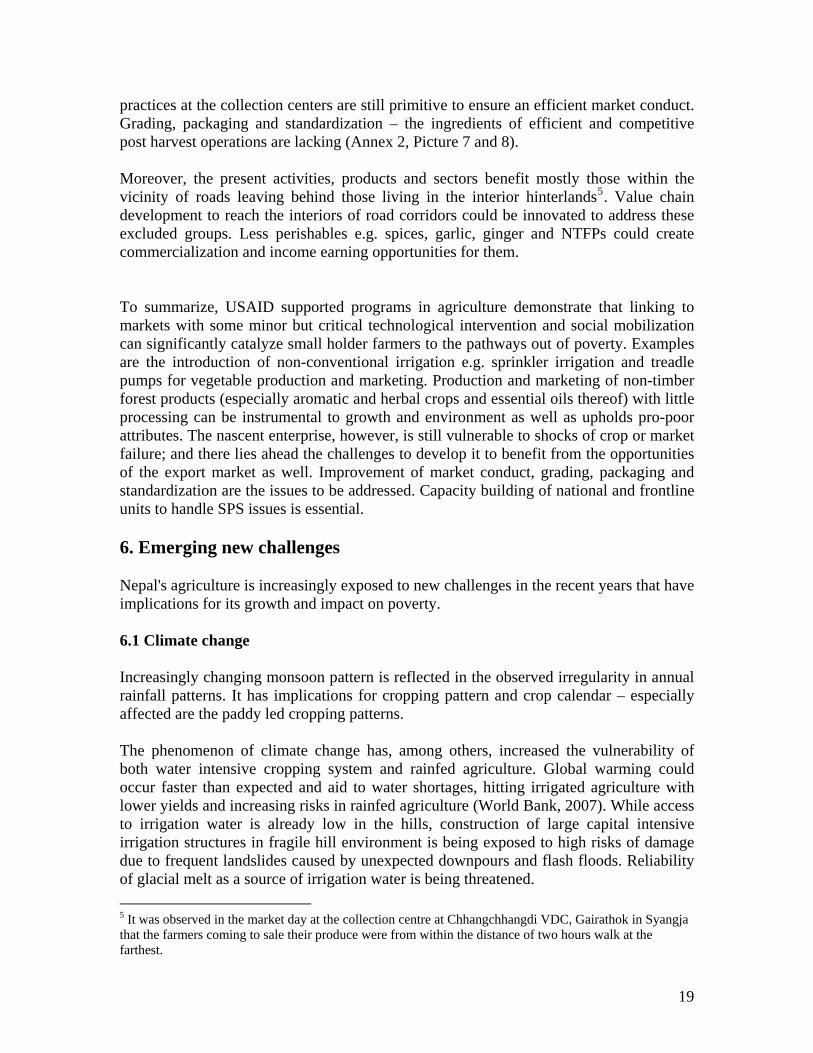
Agricultural growth is to rely heavily on private investment. Seventy percent of the capital investment in the TYIP is to come from the private sector. This sounds ambitious mainly for two reasons. For one, private investment is generally also a function of public investment. For other, the country is faced with the protracted political instability and the consequent uncertainty regarding the economic agenda that the state would pursue. In this situation, one can hardly be optimistic of the likelihood of large scale investment coming from the private sector. As committed in the Tenth Plan/PRSP I and subsequently reiterated in the TYIP, the government now recognizes the role of private sector, cooperatives and NGOs and now has accordingly demonstrated its more openness to public private partnership. Government has partnered the implementation of several agricultural development programs with NGOs and private sector. For instance, MoAC has been implementing one-village-one-product program in partnership with Federation of Nepalese Chamber of Commerce and Industry. Evidence of encouraging partnership is also found in the implementation of USAID funded SIMI program. Partnerships are more functional and stronger at the field level. 5. International development assistance in agriculture 5.1 Foreign aid in agriculture Foreign aid has remained an important source of public investment in agriculture. It accounted for nearly 30 percent of expenditure in agriculture in recent years (Annex 1, Table 7). However, agriculture is not generally a favored sector for donor support in the past. While overall foreign aid flow experienced a substantial growth rate during past two decades, it remained almost stagnant at very low level during most part of the same period (Figure 7)4.
4 This covers only the fund flow through the Ministry of Agriculture and Cooperatives and reflected in the Red Book of the Government of Nepal.
15

International financial institutions including ADB, the World Bank and IFAD were the major donors in agriculture (Figure 8). DFID was the largest among the bilateral donors with its support to Agriculture Perspective Plan Support Program (APPSP) that terminates this year. DFID has not committed its further support after the completion of the ongoing APPSP, while the World Bank seems reluctant to appraise the new project on Agricultural Commercialization and Trade which has been prepared with its technical assistance. These indicate a symptom of donor cautiousness in agriculture.
Figure 7 Nepal: trend of foreign aid flow
Foreign aid in agriculture
Overall foreign aid (all sectors)
0
15000
30000
1991 Year 2007Source: Annex 1, Table 7
NR
s. in
mill
ion
Figure 8 Nepal: donor's share in foreign aid in agriculture through MoAC, 2003-2007
ADB, 54% WB, 15%
DFID, 13% JPN, 6%
SDC, 5%
Others, 2%IFAD, 4%
NORAD, 1%
Source: MoAC
16

Donor supports in agriculture are mainly focused on infrastructure, natural resource sustainability, and livelihoods improvement. International financial institutions concentrate mainly on enlarging growth opportunities through infrastructures and commercialization. Bilateral donors support mostly on livelihoods improvement and natural resource sustainability (Refer Annex1, Table 9 for the list of current donor funded projects in agriculture). 5.2 Some reflections on most recent USAID interventions in agriculture In recent years (2003 onwards), USAID has supported quite a number of program activities in support of small holder farmers with a view to contributing to address the causes of conflict in Nepal (Box 4). As USAID's funding is under the mode of Cooperative Agreement Award, it is not reflected in the normal program budget framework of the line ministry and is not visible in Government Red Book (Section 5.1). The main focus of USAID's agricultural programs has been to contribute to the strategic objective of increased sustainable production and sales of forest and high-value agricultural products. The emphasis was laid on enlarging the income earning opportunities of the small holder farmers through the development of supply chains, production service provisions and marketing chains required for them to be benefited from the market opportunities by adopting simple critical technologies. The approach of business development services was adopted to develop functional value chains in high value commodities including vegetables, herbs, spices and non timber forest products (NTFP). Vegetable production and NTFP enterprises have demonstrated promising results. Introduction of simple, non-conventional and sustainable technologies (e.g. drip, sprinkler and, treadle pump irrigation), enthusiasm of the farmers to adopt, creation of the input supply chain and linkage with the market value chains through networks and alliances, networking of local service
Box 4 USAID Agricultural Programs in Nepal
2003 -- 2009 USAID's program activities in agriculture in Nepal in recent years included 1) Small Holder Market Initiative (SIMI), 2) Business Development Services-Marketing and Production Service (BDS-MaPS), 3) Tea Coffee GDA -Smallholder Mobilization through Improved Governance (TCGDA-SMIG), 4) Ujyalo (Light) and 5) IPM CRSP. These programs were implemented mainly by Winrock International and IDE working directly with the small holder farmers and in collaboration with various other partners. Besides, USAID also supported a policy assistance project on Improving the Policy Environment for Agriculture Trade, Production and Marketing in Nepal implemented by Agro Enterprise Centre (AEC) of Federation of Nepalese Chambers of Commerce and Industry (FNCCI). USAID's ongoing agricultural portfolio in Nepal contains SIMI which received extension until Sept 30, 2009. All other agriculture projects have been completed in 2007. Source: GDO/USAID Nepal.
17

providers and local institution building are the major achievements. Also the USAID assistance to policy analysis and advocacy to FNCCI has been reported to have contributed to the national agricultural policy formulation process including National Agriculture Policy 2004, Agribusiness Promotion Policy 2006, Herbs and Non-Timber Products Development Policy 2004 and National Dairy Development Policy 2007 (FNCCI, 2008). Market led incentives have been driving the production and processing activities to pick up. The technology adopter small farmers have demonstrated the potential to increase their income substantially from a small plot of land as compared to their previous production activities. One female farmer growing tomato in plastic tunnel (size 6 m x 28 m) in Syangja for last two years reported that she earned NRs 38 thousand net from the sale of first harvest and expects to earn at the rate of NRs 25 thousand per year for 5 consecutive years -- the life span of the plastic to build the tunnel. This was more than 400 percent of the opportunity cost of the land in terms of growing paddy. Similarly, a farmer growing hybrid tomato seed in the plastic tunnel in Kaski district produced half a kg seed which fetched her NRs. 35 thousand gross income from a land of 12m x 4.5 m. (Annex 2, Picture 3 and 4). Through BDS-MaPS interventions regional enterprise owners were linked to major trading hubs and other business institutions that resulted into the evolving of buy-back arrangements for sales of NTFP products (BDS–MaPS, 2007). Institutional arrangements for aggregation of other High Value products promoted linkages between buyers and traders which enabled farmers to obtain more favorable prices.
Anne Marie del Castillo, in her recent mission (July 2008), has concluded that the recent USAID supported agricultural projects have provided important demonstration value indicating the potential impact of various activities. She found that introduction of cultivation, processing and marketing of essential oil holds the greatest potential for quickly and substantially increasing incomes among the marginal population. It could be noted that the interventions have succeeded in creating demonstration impacts, but more remains to be done to sustain the momentum. While the developed technologies, value chains and alliances have sensitized and appealed the small holder farmers, service providers, supply chain actors, processors and traders, the enterprises are of young age and are yet to be firm-footed. Even as the early adopters of the technology are to mature and the followers are to follow suit, second generation problems are surfacing. The female tomato farmer in Syangja was worried about the problem of welting and stem rot problem that appeared in her tomato crop in the third crop season (Annex 2, Picture 3). She did every disparate attempt to remedy the problem with her traditional knowledge with no success. Plastic tunnel tomato farmers in Tanahun complain about the bacterial infection in tomato (Annex 2, Picture 6). There is conspicuous absence of the quick response system. An R&D system capable of responding to the emerging issues of a nascent enterprise needs to be put in place to sustain the farmers' enthusiasm and to make sure they continue. Besides, marketing
18
practices at the collection centers are still primitive to ensure an efficient market conduct. Grading, packaging and standardization – the ingredients of efficient and competitive post harvest operations are lacking (Annex 2, Picture 7 and 8). Moreover, the present activities, products and sectors benefit mostly those within the vicinity of roads leaving behind those living in the interior hinterlands5. Value chain development to reach the interiors of road corridors could be innovated to address these excluded groups. Less perishables e.g. spices, garlic, ginger and NTFPs could create commercialization and income earning opportunities for them. To summarize, USAID supported programs in agriculture demonstrate that linking to markets with some minor but critical technological intervention and social mobilization can significantly catalyze small holder farmers to the pathways out of poverty. Examples are the introduction of non-conventional irrigation e.g. sprinkler irrigation and treadle pumps for vegetable production and marketing. Production and marketing of non-timber forest products (especially aromatic and herbal crops and essential oils thereof) with little processing can be instrumental to growth and environment as well as upholds pro-poor attributes. The nascent enterprise, however, is still vulnerable to shocks of crop or market failure; and there lies ahead the challenges to develop it to benefit from the opportunities of the export market as well. Improvement of market conduct, grading, packaging and standardization are the issues to be addressed. Capacity building of national and frontline units to handle SPS issues is essential. 6. Emerging new challenges Nepal's agriculture is increasingly exposed to new challenges in the recent years that have implications for its growth and impact on poverty. 6.1 Climate change Increasingly changing monsoon pattern is reflected in the observed irregularity in annual rainfall patterns. It has implications for cropping pattern and crop calendar – especially affected are the paddy led cropping patterns. The phenomenon of climate change has, among others, increased the vulnerability of both water intensive cropping system and rainfed agriculture. Global warming could occur faster than expected and aid to water shortages, hitting irrigated agriculture with lower yields and increasing risks in rainfed agriculture (World Bank, 2007). While access to irrigation water is already low in the hills, construction of large capital intensive irrigation structures in fragile hill environment is being exposed to high risks of damage due to frequent landslides caused by unexpected downpours and flash floods. Reliability of glacial melt as a source of irrigation water is being threatened. 5 It was observed in the market day at the collection centre at Chhangchhangdi VDC, Gairathok in Syangja that the farmers coming to sale their produce were from within the distance of two hours walk at the farthest.
19

Irregularity observed in the pattern of the regional and seasonal variability of precipitation and more frequent and intense floods and droughts render uncertainty to rainfed agriculture. Awareness, information, adaptation and risk management are the emergent needs for mitigating the effects of climate change. 6.2 Soaring food prices For the first time since the world food crisis in the 1970s, the recent global food price spikes have grown to crisis proportions. It is estimated that price of cereal grains increased by nearly 50 percent in the international market between 2000 and 2006. Although not as high as the global trend, Nepal also experienced substantial increases in prices of major food items this year. Upon comparison of the national average retail prices during the first eight months of fiscal years (July/August to February/March), Ministry of Finance, Economic Survey 2007/2008 reports that the prices of rice, pulse (Rahar) and cooking oil (mustard) increased by 15 %, 21 % and 19 % respectively in 2007/08 than the previous year (Figure 9). Figure 9 Percentage change in national average retail price of selected
food items between 2006/07 and 2007/08(average of first eight months of fiscal year Jul/Aug -- Feb/March)
38.5%
20.7%18.7%14.7%
20.9%
Rice Pulse (Rahar) Cooking oil(Mustard)
Potto Dried onoin
Source: MoF, 2008
Food prices in Nepal are influenced less by the domestic food production than the overall supply including the import from India with whom Nepal shares 1,800 km porous border. This year's 17 % increase in domestic production could not offset the upward pressure on rice price as India tightened the supply and announced export restrictions. Rising food prices are generally considered as an opportunity for farmers to benefit from supply response. However, millions of Nepalese small farmers become worse off as they are the net food buyers. According to the recent estimates of the UN WFP and NDRI, a total of 19.2 million rural people may lose out from rising food prices while 3.8 million may stand to gain (WFP and NDRI, 2008). Those with limited access to land, high food expenditure as percent of total expenditure and low percentage of income from sales of agricultural produce are likely to lose.
20

Small farmers resources (land) would not allow them to attain food self sufficiency through food grains production – they have to depend on market for food. So their income should be enhanced in order to enable them to afford market purchase. They can do better if they are supported to earn more income from the intensive farming of high value commodities in their small plot of land. It has been reported that farmers intensively cultivating vegetables in Panchkhal area of Kavrepalanchok can support their household with only a tenth of a hectare of land (Greenslade, 2008). The issue here is to increase the availability in the market and empower the small holder farmers to afford to buy from there in the short to medium term. Given the pressure of food prices, the government would be in pressure to focus more on cereal grins production in the coming years to address the problem from the supply side. It is to be noted that the food sovereignty has been enshrined in the interim constitution. Besides, the G8, the UN System and the multilateral financial institutions are taking initiatives to mobilize resources to enhance the supply response. For small farmers in the hills, there is a pressing need to support the increase of income from their small land by diversification and commercialization to non-conventional non-cereal based agricultural activities. Besides, there is a segment of rural population who are chronically food insecure and rely on the subsidized and other targeted safety measure of food distribution – they do not depend on markets for their supply. The scale of support needs to be increased to meet their food needs; and this support can be mobilized by augmenting the resources from other special windows to be forthcoming in the international level than by utilizing the regular development allocations. 6.3. Youth unemployment Unemployment rate among youth at 15 percent is substantially higher than the national average of below 4 percent (MOF, 2008). Moreover, the underemployment in agriculture is alarming. Presently, agriculture is the least preferred vocation for youth. Many youth aspire to work in non-agricultural non-rural sectors and seek opportunities in urban areas or abroad for higher wages (Dukowicz et.al, 2008.). According to the NLSS 2003/04, while 53 percent of remittance originates in overseas countries, migration within Nepal or to India (almost fifty-fifty) is the source of remaining 47 percent of remittance. Migration of youth leaving aged and illiterate at farms is an issue of concern. The stigma of low living standards inherent in traditional agriculture caused mainly by the low income generation there, is the main reason for youths to lose attraction to agriculture. This is further reinforced by the demonstration effects of the perceived high living standards acquired by their migrating peers. Agriculture can be attractive to the youth if it looks like a modern enterprise with enlarged income opportunities unlike the traditional agriculture involving hard work and low income. Transforming small agricultural activities into commercial farms connected to the market can unleash this potential of agriculture. Minimization of risk, innovation
21

and new technology could help revert the trend. Making spending of remittance income more growth and employment enhancing and pro-poor pose both challenge and opportunity in this respect. 7. Recommended areas for USAID support 7.1 Strategic thrust Several issues including land, technology and institutions set the limits to agricultural growth in Nepal. Given this, the right choice of sectors and approaches for effective and result oriented support in the short to medium term is crucial. Such structural issues as that of land holding are socio-politically sensitive and better not engaged in before it is settled by the law of the land. Moreover, those areas that require the mechanism of effective law enforcement are also not advisable. Strategic choice for supporting inclusive growth in agriculture should aim at surfacing the latent comparative advantages within such structural limitations by mitigating its effect and benefiting maximum from the emerging opportunities. In the present context of the urgency of breaking agricultural stagnation and addressing poverty; and in the given environment of uncertainties related to the peace process and policy parameters, the strategic choice should be guided by the following the following considerations:
• Water and external input intensive crop based agriculture seems untenable for growth and income sustainability in the context of small holder agriculture.
• Market opportunities are emerging for diversifying and commercializing small
holder farming.
• Quick outcome interventions working more directly with the beneficiaries are the better bets rather than engagement in the long term issues in the given political-economic context.
• Building on the current achievements, consolidating them further to ensure
sustainability and up scaling to reach the outliers and left out areas would be better strategy to pursue than to get into new fields.
In the above context, the new support in agriculture should aim at connecting small holder farmers to high income markets through promotion of high value agriculture. Priority intervention areas to achieve this have been recommended in the following section.
22

7.2 Priority intervention areas i. Sharpen Focus on high value agriculture A shift to high value agriculture uniquely matches the need to taking pressure off the intensively irrigated cereal crops and enlarging the opportunity of small holder farmers to benefit from the unmet demand of the market at home (rapidly urbanizing, and income growing) and fast growing export market in India. Small holder farmers can improve their food security situation through enhanced incomes as they are net food buyers. In the context of soaring food prices, the government efforts to increase food grains production will be intensified and supply increased, but the market prices would be influenced by high international prices that are likely to persist. Small holder farmers need to be capacitated to afford the market purchase. High value agriculture of vegetables, fruits, spices, herbs, NTFPs and livestock products gives more value to per unit water application, has higher employment elasticity and is suitable for small holder farmers if linked to agribusiness sector. Thus, diversification to high value agriculture offers a unique win-win situation for the farmers, farming environment, the private business, the market and the government. This fits into the recent government priority on commercialization and diversification.
ii. Consolidate and build on value chain outcomes achieved in the Western Hills and
Terai Previous interventions in the Western Hills and Terai districts have prepared groundwork for uptake in high value agriculture. However, there are clear needs of continuation of efforts towards gaining maturity and phasing out. There are still some missing links to be sufficiently addressed. A self functioning system needs to be developed and put in place to address emerging issues such as risks of crop failure and market failure. Small holder farmers' access to these demand responsive service systems are essential to see to it that the demonstrations take into widespread adoption. A system for action research and development (plant and crop protection system) capable of rapidly responding to local problems would build confidence among the early adopters and their continuation of the production and marketing activities. A decentralized technology system that undertakes action and adaptive R&D involving the farmers to address their farm problems need to be developed and put in place. Similarly, a functional system for promotion of appropriate grading and packaging are instrumental to keeping standards and quality. Further efforts are needed to ensure that these improved marketing practices are effectively followed by the farmers and at the market places. Effective information and communication are as important. These are important for enhancing the marketability and also protecting farmers from the risks of market failures.
23

There is also scope for expanding the coverage further beyond the immediate vicinity of the road corridor working with less perishable products. iii. Encourage plowing back remittance income into enlarging opportunities in HVA
for the rural youth Increase in consumption expenditure alone in rural areas would have only limited poverty impact of remittance, while its investment in urban assets is a leakage from the rural economy. The breadth of poverty impact of remittance income is widened if it is also used for much needed investment in HVA in rural areas. Remittance could be source for enlarging opportunities for rural youth in HVA and thereby containing both the remittance and rural youth within rural circuit that is linked to wider economy. Employment opportunities for rural youths in HVA value chain may include trade, processing, service provision, supply chain activities, and information and communication technology (e.g. market information through text messages in mobile phones, internet centers where farmers and private traders can interact and transact). Agricultural enterprise advisory services for identifying investment opportunities with enterprise schemes together with enterprise management and skills trainings could be instrumental for promoting the involvement of rural youths (including the back-home migrants) in HVA. Linking to the market information system developed and operated by AEC could be an area for involving rural youth; this could also be an opportunity for reaching the existing information service to the rural commercial farmers. iv. Reach the excluded geographic region and ethnic community in the Eastern Hills Certain underprivileged districts in the Eastern Hills are home to high concentration of poverty. These districts are also generally home to certain ethnic communities among whom poverty rates are high and have increased over the years. These districts are relatively bypassed by the donor interventions in agriculture that in the east have mostly focused on promoting commercial agriculture. The government has recently initiated eastern hills agriculture development program with, however, a modest resource allocation and conventional implementation mechanism (MoAC). Development intervention in these districts means addressing the high concentration of poverty among excluded ethnic community by reaching the unreached geographic region. There is the scope for spreading the success cases of the previous interventions in the Western Regions and enlarging the threshold for value chain actors developed so far. There are options of working with judiciously selected relatively less perishable commodities such as garlic, red pepper (round) herbs and NTFP based commodities for unleashing high growth potential. These districts are in need of support for preparing to benefit from the rapidly unfolding commercialization mainstream of the Eastern Region when the road connectivity in these districts is completed. There is also the scope of synergy to the recent government initiative.
24

7.3 Proposed design approach The purpose of the recommended program in agriculture is to connect small holder farmers to markets. It is proposed that the program package to achieve this outcome should take a three pronged approach of reducing costs and risks, encouraging use of local resources and inputs, and promoting innovative institutional linkages. i. Reducing marketing costs and risks associated with commercialization. Commercialization entails not only income but also costs and risks to the farmers. Reducing such costs and risks are the keys for connecting small holder farmers to markets as high costs reduce the effective price that farmers receive from the market. The issue here is to ensure maximum net return per unit output for the farmers and that too in a stable manner. High costs are associated with the structure and conduct of production and marketing as well as policies and infrastructures. The program design should recognize this and find ways to minimize the cost effects of these rigidities on profitably marketing small amount by the poor farmers. The tightness of limitations imposed upon by hardware constraints can, to a considerable extent, be loosened by appropriate software measures; and that should be the emphasis of the program design. Effective advisory services on good production and marketing practices and planning; and mechanisms for enhancing scale through agglomeration are indicative examples. High risks are associated with harvest and price uncertainties. Growing an unfamiliar crop or variety with unfamiliar technology involves more uncertainty than growing familiar food grains. Unfamiliarity of pests and diseases and uncertainty of yields are additional sources of production risk. Similarly market and marketing risks stem from the uncertainty of prices at harvest time relative to the food price, perishability of the commodity and lack of alternative market outlets. Reducing such risks is essential to induce farmers to reallocate their land resource from staple food grains production to commercial ones. ii. Promoting low external input sustainable agriculture (LEISA) technology.
Reliance on external and costly inputs make small holder farmers vulnerable to frequent supply breaks and rising costs, such as in case of chemical fertilizer. On the other hand the promotion of self reliant technology such as organic agriculture involving integrated pest management (IPM), integrated plant and nutrient system (IPNS) and sustainable soil management (SSM) offer more sustainable alternatives; and, hence, this should be the approach for designing the new agriculture program. Likewise, non-conventional irrigation systems e.g. sprinkler, drip and treadle pumps are proven for suitability for small farmers. There are also technologies of low energy storage and improved packaging systems that are based on local resources and are suitable for
25

26
small farmers. This approach promotes utilization of local resources, lessens reliance on imported and expensive inputs and reduces strain on public finance at times by reducing the amount of subsidy as is presently being provided to fertilizer transportation to a number of remote districts. iii. Promoting innovative institutions and linkages. Institutions may be innovated to facilitate reduction of costs and risks and promote local resource based technology. Institutions that encourage collective action of small farmers are instrumental in reducing marketing costs and provide economies of scale in marketing. Empowerment of farmers groups and cooperatives to effectively carryout collective actions and to advantageously connect to the market value chains should be given high considerations. Institutions are required to ensure contract security between farmers, processors and the retailers which reduces risks. Institutionalization of weather based insurance could be part of the risk management6. Development of grades and standards and their widespread adoption are important for high value agriculture. Collaboration between farmer organizations, private traders and public bodies is required to set the common standards. These are important in promoting vertical coordination between farms, firms and forks to reduce transaction costs and market risks, and to facilitate trade. An autonomously functioning system of decentralized and needs based R&D that is capable of collaborating among the multiple service providers at the field level may benefit from forging a functional linkage with existing institutions such as NARDF at the central level.
6 This approach takes into account the local rainfall index in the farmer's locality and pays insurance to the farmer when the index falls below certain level (Minot and Hill (2007).

Annex 1
Share of GDP
incomehouseholdShare ofProortion of
labor force Proortion of
Nepal's households
33%49%
66% 79%
Figure 1 Nepal: importance of agriculture in he economy
Source: CBS, 2005, CBS, 2006 and MoF, 2008
Table 1 Nepal: distribution of land holding by size group, 2001/02 (in %)
Size of holding Holdings Number Percent
Area of holding
Number Percent '000 ha Percent < 0.2 606.6 18.2 63.1 2.4 0.2 -- 0.5 972.3 29.1 327.1 12.3 0.5 -- 1.0 915.7 27.4 641.7 24.2 1.0 -- 2.0 588.6 17.6 792.0 29.8 2.0 -- 3.0 157.0 4.7 371.2 14.0 3.0 -- 4.0 51.6 1.5 175.7 6.6 4.0 -- 5.0 20.2 0.6 89.3 3.4 5.0 -- 10.0 21.6 0.6 139.8 5.3 10 and + 3.8 0.1 54.2 2.0 Total land holdings 3337.4 100.0 2654.1 100.0 Landless holdings 26.7 -- -- -- Source: CBS, 2006
27

Table 2 Nepal: annual edible cereal grain production and requirement, 1991 – 2006 (Quantity in Mt.)
Source: MoAC.
Year Production Requirement Balance 1991 3373 3562 -188 1992 3292 3634 -342 1993 3585 3724 -139 1994 3398 3883 -485 1995 3914 3948 -34 1996 3973 4079 -107 1997 4027 4178 -151 1998 4098 4279 -182 1999 4452 4383 68 2000 4513 4430 83 2001 4543 4463 80 2002 4641 4566 76 2003 4884 4671 213 2004 4943 4780 163 2005 4869 4891 -22 2006 4737 5005 -268
Note: Cereal grains include rice, maize, wheat, millet and barley available in edible form.
28

Table 3 Nepal: Share of commodities in Ag GDP 2001/02 and change index 2006/07 (%)
Weights 2001/02 2006/07Cereals and other crop 49.41 100 108.13Paddy 20.75 100 87.3Maize 6.88 100 122.63Wheat 7.14 100 130.86Millet 1.37 100 100.69Barley/naked barley 0.22 100 92.8Potato 4.67 100 147.92Sugarcane 1.24 100 117.54Jute 0.17 100 93.74Tobacco 0.06 100 66.65Soyabeans 0.19 100 119.98Pulses 4.42 100 112.18Others 2.29 100 95.97Total vegetables and Nursery 9.71 100 140.89Vegetables 9.7 100 140.89Others 0.01 100 118.01Fruits and spices 7.04 100 138.42Orange 0.97 100 146.1Mango 1.56 100 113.51Banana 0.4 100 108.86Apple 0.42 100 108.62Spices 1.79 100 193.35Tea 0.05 100 225.97Coffee 0 100 402.25Others 1.85 100 112.36Domestic Animals and Dairy 23.25 100 118.13Buffalo meat 4.42 100 117.77Mutton 3.24 100 117.37Milk 12.36 100 119.96Others 3.23 100 112.4Other Animal Farming 2.43 100 119.69Pig meat 0.5 100 105.24Poultry meat 0.67 100 120.77Eggs 0.81 100 121.19Hides and Skin 0.35 100 144.01Others 0.1 100 89.48Forestry 8.07 100 104.24Overall Index 100 100 115.72
Source: MoAC, 2008.
29

Table 4 Nepal: Selected population groups with high poverty incidence, 2003-04 Poverty
head count rate (%)
Proportion of the poor (%)
Change between 1995-96 and 2003-04 (%)
Proportion of population (%)
Agricultural wage earners 54 11 -4 6Aagricultural self employed 33 67 -24 63< 0.2 ha land holder 39 25 -18 220.2 – 1.0 ha land holder 38 51 -15 47Illiterate HoH 42 71 -18 52Dalits 46 11 -21 7Hill Janjatis 44 28 -10 20Terai Janajatis (Tharu) 35 9 -34 8Muslems 41 9 -6 7Source: CBS, 2005.
Table 5 Nepal: poverty by geographic region, 2003-04
Poverty
head count rate (%)
Change between 1995-96 and 2003-04 (%)
Proportion of the poor (%)
Proportion of population (%)
NLSS region Rural Western Hills (RW Hills) 37 -32 24 19Rural Eastern Hills (RE Hills) 43 19 29 21Rural Western Terai (RW Terai) 38 -17 19 15Rural Eastern Terai (RE Terai) 25 -33 24 29 Development region Eastern Development Region 29 -25 23 25Central Development Region 27 -17 32 37Western Development Region 27 -30 17 19Mid-Western Development Region 45 -25 18 12Far-Western Development Region 41 -36 10 8 Ecological belts Mountain 33 -43 8 7Hill 35 -15 47 42Terai 28 -32 45 51 Urban 10 -56 5 15Rural area 35 -20 95 85Nepal 31 -26 100 100Source: CBS (2005), Poverty trends in Nepal (1995-96 and 2003-04), Kathmandu
30

Figure 2 Nepal: poverty rates by caste/ethnecic groups
0
31
62
93
Hill
Brah
min
Hill C
hhet
ri
Newq
arG
urun
gM
agar
Tam
ang
Rai
Lim
bu
Kam
iDa
mai
Sark
i
Yada
vTh
aru
Mus
lim (m
ostly
tera
i)Te
li
Cham
arM
usah
ar
Othe
rs (m
ostly
tera
i)Ne
pal
%1995-96 2001-02
Source: Sketched from data in Hatlebakk, 2008.
Table 6 Nepal: Rural accessibility indicator: Mean travel time to selected nearest facilities for rural households
Facility Average travel time (hours)
Percent of households more than two hours from the nearest facility
Bus stop 3.2 26 Paved road 5.18 39 Dirt road, vehicle passable 3.12 20 Market center 2.23 31 Agriculture centre 2.23 31 Coperative 3.22 35 Commercial bank 3.2 43 Hat bazzar 1.27 13 Telephone booth 2.22 26
Source: CBS, 2004
31
32
Table 7 Nepal: foreign aid in agriculture as compared to total agricultural expenditure and overall foreign aid
(NRs in million) Fiscal Year Total
expenditure in agriculture
Foreign aid in agriculture
Overall foreign aid (all sectors)
Agricultural foreign aid as % of total agricultural expenditure
Agricultural foreign aid as % of overall foreign aid
1990/91
1567.6
609.6
5990
38.9
10.2
1991/92 1316.4 396.8 7800.4 30.1 5.1 1992/93 2122.8 724.9 9235.6 34.1 7.8 1993/94 2337.2 2064.9 11557.2 88.3 17.9 1994/95 2702.6 1302.4 11249.4 48.2 11.6 1995/96 2292.1 1097.3 14289 47.9 7.7 1996/97 1964.7 436.1 15031.9 22.2 2.9 1997/98 2225.1 924.9 16457.1 41.6 5.6 1998/99 2018.7 909.4 16188.8 45.0 5.6 1999/2000 2239.1 867.3 17523.9 38.7 4.9 2000/01 2433.6 806.3 18797.4 33.1 4.3 2001/02 2696.3 896.7 14384.8 33.3 6.2 2002/03 1971 574.5 15885.5 29.1 3.6 2003/04 2016.2 674.9 18912.4 33.5 3.6 2004/05 2334.7 752 23657.3 32.2 3.2 2005/06 2702.9 825.8 22041.7 30.6 3.7 2006/07 2053.3 25854.3 7.9 Source: MoF

Table 8 Nepal: List of current foreign aided projects in agriculture (MoAC)
S.N. Name of Project Donor Project Duration
1 Agriculture Perspective Plan Support Programme
DFID £ 9,873,500.00 Mar. 2003-Dec. 2008
2 Avian Influenza Control Project (AICP) World Bank US$ 18,204,338
2007-2011
3 Irrigation and Water Resources Management Project
World Bank US $ 50,000,000.00
Dec. 2007-30 June 2013
4 Leasehold Forestry Project-Livestock Component
IFAD US$ 11.71 Million
2005-2013
5 Community Livestock Dev. Project (CLDP)
AsDB US$33 million
2062/63-2066/67
6 Commercial Agriculture Development Project
AsDB US$ 18 Million
2007-2013
7 Japan Fund for Poverty Reduction Project (JFPR)
ADB US$ 1 Million
2007-2010
8 Promotion of Olive Production and Consumption in Nepal
Italy US $ 1.04 Million
Aug 2004-Dec. 2007
9 Sustainable Soil Management Project Phase III
SDC CHF 3,660,666
Jan. 2008-2010
10 Hill Maize Research Project SDC US $ 1.2 million
2008-Dec. 2010
11 Coffee Promotion Program SDC CHF 873,617
Jan. 2007- Dec. 2009
12 Agri. Training and Extension. Improvement Project
Japan US$ 0.38 Million
Jan. 2004-2009
13
Promotion of Quality Cocoon Production and Processing Project in Nepal
Japan JPY 120 Million
Dec. 2006-Oct. 2011
14. Mini project of Peace Building through Agriculture in Tea Sector (HIMTEX)
JICA NRs. 1.56 million
May 2008-April 2009
15. Mini project of Peace Building through Agriculture in Central Development Region adjoining ATEIP
JICA NRs. 2 million
May 2008-April 2009
Source MoAC
33
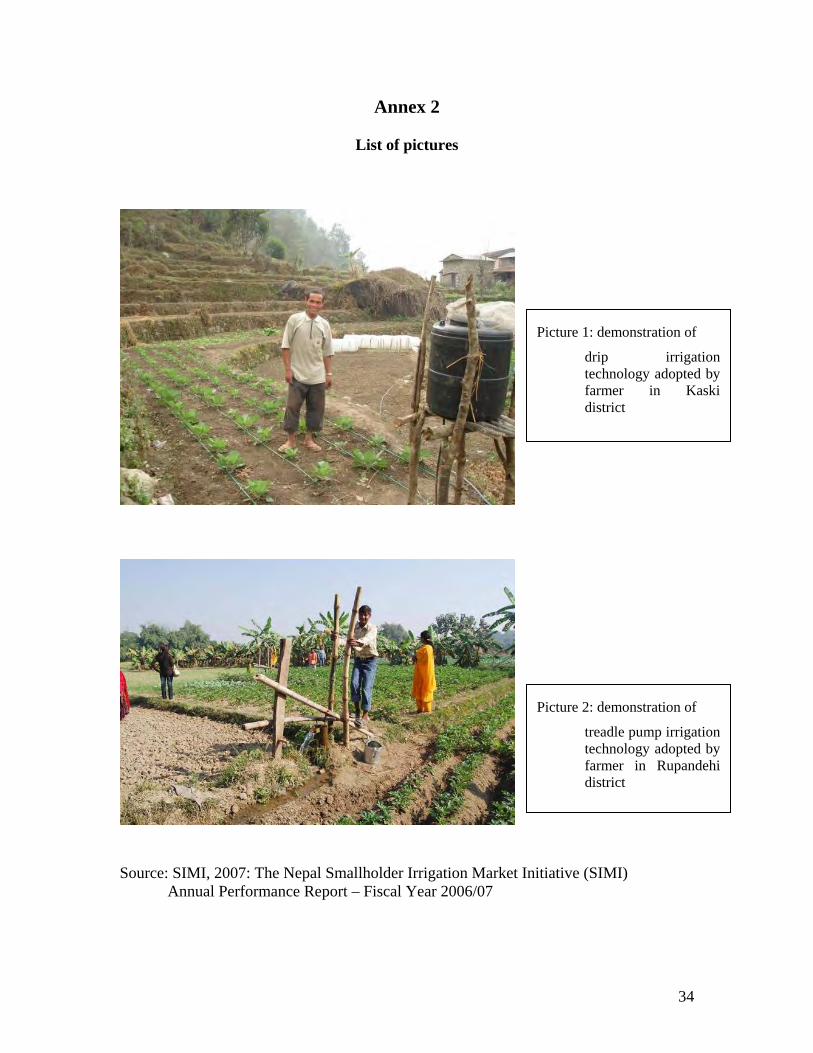
Annex 2
List of pictures
drip irrigation technology adopted by farmer in Kaski district
Picture 1: demonstration of
treadle pump irrigation technology adopted by farmer in Rupandehi district
Picture 2: demonstration of
Source: SIMI, 2007: The Nepal Smallholder Irrigation Market Initiative (SIMI) Annual Performance Report – Fiscal Year 2006/07
34

Picture 3: A farmer growing hybrid tomato seed in Kaski district in a plastic tunnel (size of the tunnel 12m x 4.5m) using drip irrigation
Picture 4: The hybrid tomato farmer in Kaski district performing pollination
Source: Pictures by the author during field visit (July 26, 2008)
35

Picture 5: Tomato farming in plastic tunnel in Syangja district – suffering from problem of welting
36
Picture 6: Bacterial infection in tomato produced in plastic tunnel in Tanahun district.
Source: Pictures by the author during field visit (July 23 – 27, 2008)

Picture 7: Weighing the farmers' produce in the collection center in Syangja district using stone as surrogate to the standard metal weight
Picture 8: Farmer carrying tomato to the collection center at Syangja district in a traditional container doko -- highly damage prone.
Source: Pictures by the author during field visit (July 25, 2008)
37

38
Picture 9: an instance of post harvest losses at the wholesale market at Pokhara
Source: Picture by the author during field visit (July 25, 2008)

Annex 3
Table 1 List of individuals consulted
Name Institution Address
Central Level organizations
1. Mr. Adhir Sharma Dy. Country Programme Director
Helvetas Nepal
Bakhundole Ht. Pulchowk, Lalitpur
2. Mr. Biju Kumar Shrestha Program Director
Agriculture and Forestry Division, National Planning Commission
Singhadurbar, Kathmandu
3. Mr. Christopher Floyd Advisor
DFID-APPSP Kathmandu
4. Dr. Dev Bhakta Shakya Executive Director
Agro-Enterprise Centre, FNCCI
Teku, Kathmandu
5. Dr. Ganesh R. Joshi Member secretary
National Agriculture Research and Development Fund, GoN
Singhadurbar Plaza Kathmandu
6. Govinda Gewali Senior Project Implementation Officer
ADB Nepal Resident Mission
Kamaladi Kathamndu
7. Mr. Komal Pradhan
Iinternational Development Enterprises
Bakhundole, Lalitpur
8. Mr. Madhu Kumar Marashini Under Secretary
Foreign Aid Coordination Division, MoF
Singhadurbar, Kathmandu
9. Mr. Mandip Rai Agricultural Economist
Planning Division MoAC
Singhadurbar, Kathmandu
10. Mr. Narendra Gurung Senior Program Officer
JICA, Nepal Office Pulchowk, Laitpur
11. Mr. Pitambar Sharma Executive Director,
DEPROSC
Kathmandu
12. Dr. Ram Prakash Yadav Vice Chairman
Poverty Alleviation Fund Gyaneswor, Kathmandu
13. Mr. Reshmi Raj Pandey Under Secretary
Planning Division, MLD
Lalitpur
14. Mr Rudra Shapkota Senior Advisor Local Governance
SNV, Nepal Bakhundole, Lalitpur
39

15. Dr. Vinod Sharma Officiating Team Leader
Nepal SIMI Bakhundole, Lalitpur
USAID/ Nepal
16. Ms. Anita Mahat Economic Opportunities Advisor
General Development Office
Maharajgunj Kathmandu
17. Mr. Anthony S. Chan, Ph.D. Deputy Mission Director
General Development Office
Maharajgunj Kathmandu
18. Mr. Kishore K.C. Programme Specialist
General Development Office
Maharajgunj Kathmandu
19. Paul R. Deuster, Ph.D. Consultant
General Development Office
Maharajgunj Kathmandu
20. Mr. Sribindu Bajracharya AID Project Development Specialist
General Development Office
Maharajgunj Kathmandu
Districts
Tanahun
21. Mr. Arjun Neupane Agriculture Development Officer
District Agriculture Development Office
Damauli Tanahun
22. Mr. Basudev Kaphle Planning Officer
District Agriculture Development Office
Damauli Tanahun
23. Mr. Govinda Gurung District Manager
SIMI District Office Damauli Tanahun
24. Mr. Lalan P. Shah Overseer (irrigation technician)
Nepal SIMI Tanahun
25. Madhab Prashad Kaphle Junior technician
Agriculture Service Center
Dhorphirdi, Malebaar, Tanahun
26. Shivraj Paudel Junior Technician and Chief
Agriculture Service Center
Dhorphirdi, Malebaar, Tanahun
27. Group members of Suklesshwor Vegetable Production Group
Rainy season tomato production site
Dhorphirdi --7, Malebaar, Tanahun
Kaski
28. Mr. Beni Bahadur Basnet Agriculture Development Officer
District Agriculture Development Office
Pokhara, Kaski
29. Mr. Bhim Moktan Area Coordinator
SIMI Area Office
Pokahra, Kaski
40

41
30. Mr. Deepak Shrestha President
Pokhara Chamber Commerce and Industry
Pokhara, Kaski
31. Ms. Gauri Shrestha Sr. Marketing and Governance Officer
SIMI Area Office
Pokhara, Kaski
32. Mr. Hari Ghimire District Manager
SIMI District Office
Pokhara, Kaski
33. Ms. Hari Maya K.C. Hybrid tomato seed grower farmer
Dhikurpokhari
Kaski
34. Mr. Ram Krishna Dawadi Trader and Committee Member
Santiban Vegetable and Fruit Wholesale Market
Pokhara, Kaski
35. Mr. Shivajee Koirala Executive Member and Coordinator of Agriculture Sub-Committee
Pokhara Chamber Commerce and Industry
Pokhara, Kaski
36. Oficials and Members Makurisanjal Marketing and Planning Committee
Naudanda – 2, Dhikurpokhari, Kaski.
Syangja
37. Ms. Bhim Kumari Gurung Group Member and Hail Net User
Shree Chandikalika Farmer Group
Hail Net Testing Site, Shankhapur-13 Syangja
38. Jamuna Subedi Leader farmer
Fresh Vegetable Production Group
Phedikhola-9, Sarketari VDC, Syangja
39. Mr. Ram Chandra Paudel Agriculture Development Officer (Officiating)
District Agriculture Development Office
Putalibazar, Syangja
40. Mr. Resham Shrestha Marketing Supervisor (SIMI)
Collection Centre
Chhangchhangdi VDC, Syangja
41. Sabin Regmi Irrigation Technician
IDE
Syangja
42. Members and farmers Namuna Agro Product Marketing Cooperative Committee
Chhangchhangdi VDC, Gairathok Syangja

References (To be completed)
Publications ANZDEC (2002). Nepal Agricultural Sector Performance Review. Volume 1 Main
Report. New Zealand: ANZDEC Limited. APROSC/Nepal and JMA/USA (1995). Nepal Agriculture Perspective Plan. Kathmandu:
Agricultural Projects Services Centre and John Mellor Associates, Inc. BDS – MaPS (2007). Project Completion Report. January 2004 – September 2007.
Lalitpur: BDS – MaPS Central Bureau of Statistics (2006). Monograph Agriculture Census Nepal, 2001/02
Kathmandu: CBS Central Bureau Statistics (2005). Poverty Trends in Nepal (1995-96 and 2003-04).
Kathmandu: CBS Central Bureau Statistics (2004). Nepal Living Standards Survey 2003/04. Statistical
Report, vols one and two. Kathmandu: CBS. CBS, WB, DFID and ADB (2006). Resilience Amidst Conflict An Assessment of Poverty
in Nepal, 1995-96 and 2003-04. Kathmandu: The World Bank. Federation of Nepalese Chambers of Commerce and Industry (2008). Improving the
Policy Environment for Agriculture Trade, Production and Marketing in Nepal Kathmandu: Agro Enterprise Centre.
Ministry of Agriculture and Cooperatives (2004). National Agriculture Policy, 2004.
Kathmandu: MoAC. Ministry of Agriculture and Cooperatives (MoAC) (2007). Agriculture Perspective Plan
Study Report. Kathmandu: APP Support Programme (APPSP). Ministry of Agriculture and Cooperatives. Statistical Information on Nepalese
Agriculture. (Several issues). Kathmandu: MoAC. Ministry of Agriculture and Cooperatives (2008). Selected Indicators of Nepalese
Agriculture and Population. Kathmandu: MoAC. Ministry of Finance (2008). Economic Survey 2007-08,. Kathmandu: Ministry of Finance.
(also several previous issues). Minot, N. and Ruth V. Hill (2007). Developing and Connecting Markets for Poor Farmers. 2020
Focus Brief on the World's Poor and Hungry People. Washington DC: IFPRI National Planning Commission (2007). Three Year Interim Plan (2007/8 – 2009/10).
Kathmandu: NPC.
42

43
National Planning Commission (2002) The Tenth Plan, 2002 - 2006. Kathmandu: NPC. Pant, Krishna P. (2007) Impact of the Regulatory Measures on Farming Structure,
Particularly Small Farmers. Paper presented at "Workshop on Policies for Bio-secure Agriculture"., organized by FAO at Dhulikhel from 16-17 May 2007.
The Nepal Smallholder Irrigation Market Initiative (SIMI) (2007). Nepal SIMI Amnnual
Performance Report. October 1, 2006 – September 30, 2007. Nepal SIMI Report No. 17. Lalitpur: SIMI.
The Nepal Smallholder Irrigation Market Initiative (SIMI) (2008). Second Quarterly
Performance Report. January – March 2008. Report No 19. Lalitpur. The World Bank (2007). World Development Report 2008 -- Agriculture for
Development. Washington DC: The World Bank. World Food Program and Nepal Development Research Institute (2008). Market and
Price Impact Assessment Nepal Final Report. Kathmandu: WFP and NDRI. Unpublished documents Castillo, A. M. del (2008). Nepal A Call to Facilitate a Successful Transition through
Greater Opportunities for Inclusive Economic Growth. Report submitted to USAID, July 2008.
Dukowicz, D. Kishor K.C. and James Walker (2008). Nepal Economic Growth Assessment A
report of the Economic Growth Assessment Team, USAID, June 2008, Gleenslade, M. (2008). Supporting Inclusive Economic Growth in Nepal: Potential
Interventions for Government of Nepal and Development Partners. Final Report of the team commissioned by Mathew Greenslade, DFID, 20 April 2008.
Hatlebakk, M (2008). Inclusive Growth in Nepal. First Draft. CMI, Bergen, Norway ,
June 10, 2008 funded by the Norwegian Embassy, Nepal. Page, C., Jason Wolfe and Anita Mahat (2008). Nepal Inclusive Economic Growth Assessment –
Micro-enterprise Development. Report of the Economic Growth Assessment Team, July 2008
Samson, M. et. al. (2008). Supporting Inclusive Economic Growth in Nepal. Papers for
DFID Nepal Mission. February 11th – 15th 2008. Report of the mission led by Michael Samson.
The World Bank Agriculture and Food Policy Note: Nepal. A policy note prepared by the
team led by Roshan Darshan Bajracharya. 2008 USAID Agricultural Programs and Conflict Mitigation (A briefing paper).