nhsn e-news: sirs special edition, october 2010 · nhsn e-news: sirs special edition updated...
TRANSCRIPT

NHSN e-News: SIRs Special Edition
Updated December 10, 2010
1
Th
e C
en
te
rs f
or
Dis
ea
se
Co
nt
rol
an
d P
rev
en
tio
n (
CD
C)
NH
SN
e-N
ews
Special Edition!
October 2010, Updated December 2010
Your Guide to the Standardized Infection Ratio (SIR)
With the new version of NHSN (version 6.3), new output options are available that will permit the calculation of standardized infection ratios (SIRs) for central line-associated bloodstream infection (CLABSI) and surgical site infection (SSI) data. Each of these measures fall in line with the State-Specific Healthcare-associated Infections Summary Data Report, published by CDC. For SSIs, we will make the transition from SSI rates to the SSI SIR with this new version of the NHSN tool. The SSI SIR is the result of logistic regression modeling that considered all procedure-level data collected by NHSN facilities in order to provide better risk adjustment than afforded by the risk index. In addition, the SSI SIR provided to facilities within NHSN will be more precise and be calculated only if appropriate for comparisons. As we make this transition, we understand that you will have numerous questions, including how to operationalize this new statistic in your facility to drive prevention practices. This guide is intended to answer some of these questions.
STANDARDIZED INFECTION RATIO (SIR)
What is a standardized infection ratio (SIR)?
The standardized infection ratio (SIR) is a summary measure used to track HAIs at a national, state, or local level over time. The SIR adjusts for patients of varying risk within each facility. The method of calculating an SIR is similar to the method used to calculate the Standardized Mortality Ratio (SMR), a summary statistic widely used in public health to analyze mortality data. In HAI data analysis, the SIR compares the actual number of HAIs reported with the baseline U.S. experience (i.e., NHSN aggregate data are used as the standard population), adjusting for several risk factors that have been found to be significantly associated with differences in infection incidence. In other words, an SIR greater than 1.0 indicates that more HAIs were observed than predicted, accounting for differences in the types of patients followed; conversely, an SIR less than 1.0 indicates that fewer HAIs were observed than predicted.
****Important Take Away Points****
The new SSI SIRs provide improved risk adjustment and replace risk-stratified SSI rates.
The SIRS use 2006-2008 as the baseline period, and therefore, SIRs are calculated for 2009 and forward. To allow for more precise comparisons, SIRs are calculated only if the number of expected HAIs (numExp) is ≥1.
Inside this issue: Central Line-associated Bloodstream Infection (CLABSI) SIRs 2 Surgical Site Infection (SSI) SIRs 4 Samples of SIR Output and List of SIR Risk Factors 9
NHSN e-News: SIRs Special Edition
Updated December 10, 2010 2
CENTRAL LINE-ASSOCIATED BLOODSTREAM INFECTION (CLABSI) SIRS
How is the SIR calculated for CLABSI?
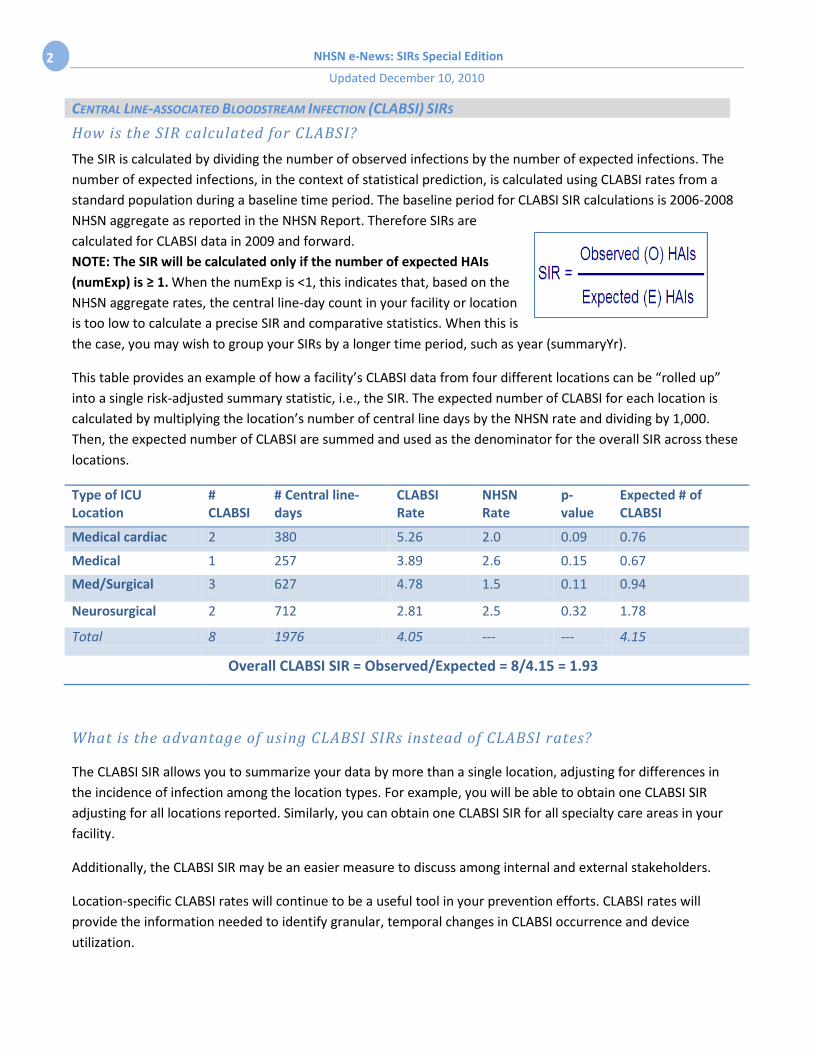
The SIR is calculated by dividing the number of observed infections by the number of expected infections. The number of expected infections, in the context of statistical prediction, is calculated using CLABSI rates from a standard population during a baseline time period. The baseline period for CLABSI SIR calculations is 2006-2008 NHSN aggregate as reported in the NHSN Report. Therefore SIRs are calculated for CLABSI data in 2009 and forward. NOTE: The SIR will be calculated only if the number of expected HAIs (numExp) is ≥ 1. When the numExp is <1, this indicates that, based on the NHSN aggregate rates, the central line-day count in your facility or location is too low to calculate a precise SIR and comparative statistics. When this is the case, you may wish to group your SIRs by a longer time period, such as year (summaryYr).
This table provides an example of how a facility’s CLABSI data from four different locations can be “rolled up” into a single risk-adjusted summary statistic, i.e., the SIR. The expected number of CLABSI for each location is calculated by multiplying the location’s number of central line days by the NHSN rate and dividing by 1,000. Then, the expected number of CLABSI are summed and used as the denominator for the overall SIR across these locations.
Type of ICU Location
# CLABSI
# Central line-days
CLABSI Rate
NHSN Rate
p-value
Expected # of CLABSI
Medical cardiac 2 380 5.26 2.0 0.09 0.76
Medical 1 257 3.89 2.6 0.15 0.67
Med/Surgical 3 627 4.78 1.5 0.11 0.94
Neurosurgical 2 712 2.81 2.5 0.32 1.78
Total 8 1976 4.05 --- --- 4.15
Overall CLABSI SIR = Observed/Expected = 8/4.15 = 1.93
What is the advantage of using CLABSI SIRs instead of CLABSI rates?
The CLABSI SIR allows you to summarize your data by more than a single location, adjusting for differences in the incidence of infection among the location types. For example, you will be able to obtain one CLABSI SIR adjusting for all locations reported. Similarly, you can obtain one CLABSI SIR for all specialty care areas in your facility.
Additionally, the CLABSI SIR may be an easier measure to discuss among internal and external stakeholders.
Location-specific CLABSI rates will continue to be a useful tool in your prevention efforts. CLABSI rates will provide the information needed to identify granular, temporal changes in CLABSI occurrence and device utilization.
NHSN e-News: SIRs Special Edition
Updated December 10, 2010
3
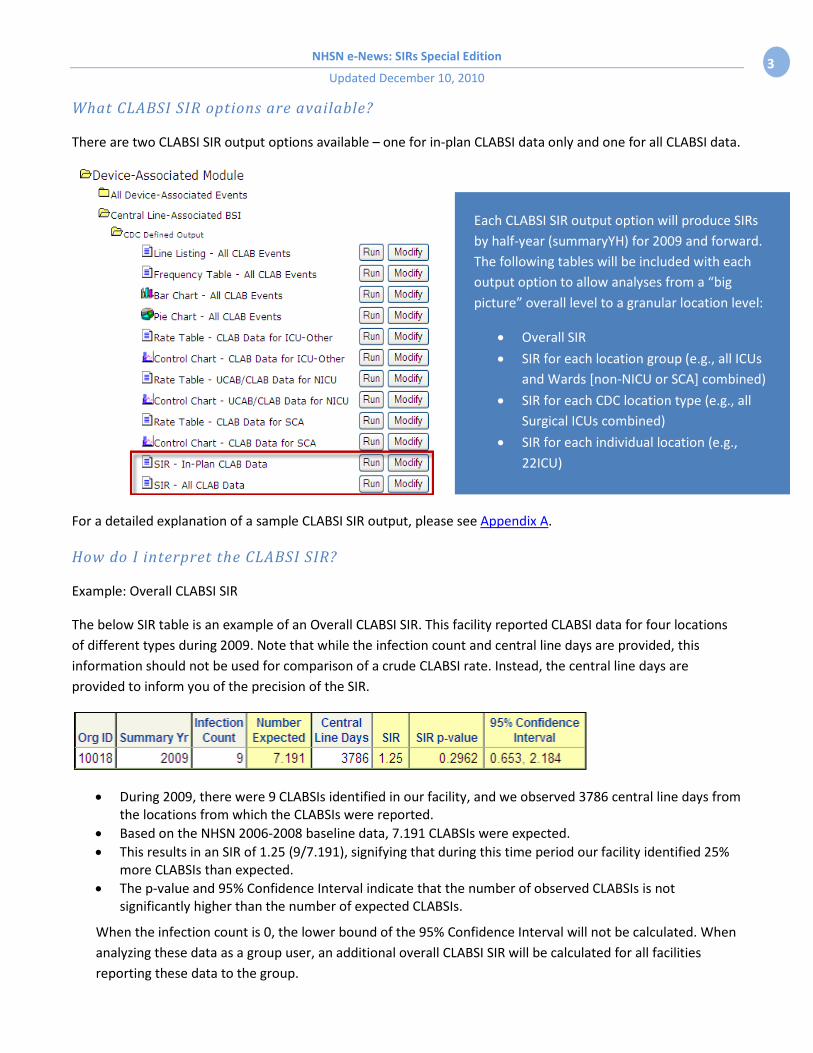
What CLABSI SIR options are available?
There are two CLABSI SIR output options available – one for in-plan CLABSI data only and one for all CLABSI data.
Each CLABSI SIR output option will produce SIRs by half-year (summaryYH) for 2009 and forward. The following tables will be included with each output option to allow analyses from a “big picture” overall level to a granular location level:
• Overall SIR
• SIR for each location group (e.g., all ICUs and Wards [non-NICU or SCA] combined)
• SIR for each CDC location type (e.g., all Surgical ICUs combined)
• SIR for each individual location (e.g., 22ICU)
For a detailed explanation of a sample CLABSI SIR output, please see Appendix A.
How do I interpret the CLABSI SIR?
Example: Overall CLABSI SIR
The below SIR table is an example of an Overall CLABSI SIR. This facility reported CLABSI data for four locations of different types during 2009. Note that while the infection count and central line days are provided, this information should not be used for comparison of a crude CLABSI rate. Instead, the central line days are provided to inform you of the precision of the SIR.
• During 2009, there were 9 CLABSIs identified in our facility, and we observed 3786 central line days from the locations from which the CLABSIs were reported.
• Based on the NHSN 2006-2008 baseline data, 7.191 CLABSIs were expected. • This results in an SIR of 1.25 (9/7.191), signifying that during this time period our facility identified 25%
more CLABSIs than expected. • The p-value and 95% Confidence Interval indicate that the number of observed CLABSIs is not
significantly higher than the number of expected CLABSIs.
When the infection count is 0, the lower bound of the 95% Confidence Interval will not be calculated. When analyzing these data as a group user, an additional overall CLABSI SIR will be calculated for all facilities reporting these data to the group.
NHSN e-News: SIRs Special Edition
Updated December 10, 2010 4
SURGICAL SITE INFECTION (SSI) SIRS
How is the SIR calculated for SSIs?
The SIR is calculated by dividing the number of observed infections by the number of expected infections. For a given operative procedure category, the number of expected infections, in the context of statistical prediction, is derived from a logistic regression model using a baseline time period. The baseline for the SIR calculations uses 2006-2008 data, and therefore SSI SIRs are calculated for procedure data in 2009 and forward.
NOTE: The SIR will be calculated only if the number of expected HAIs (numExp) is ≥ 1. When the numExp is <1, this indicates that the number of procedures performed is too low to calculate a precise SIR and comparative statistics. When this is the case, you may wish to group your SIRs by a longer time period, such as year (summaryYr).
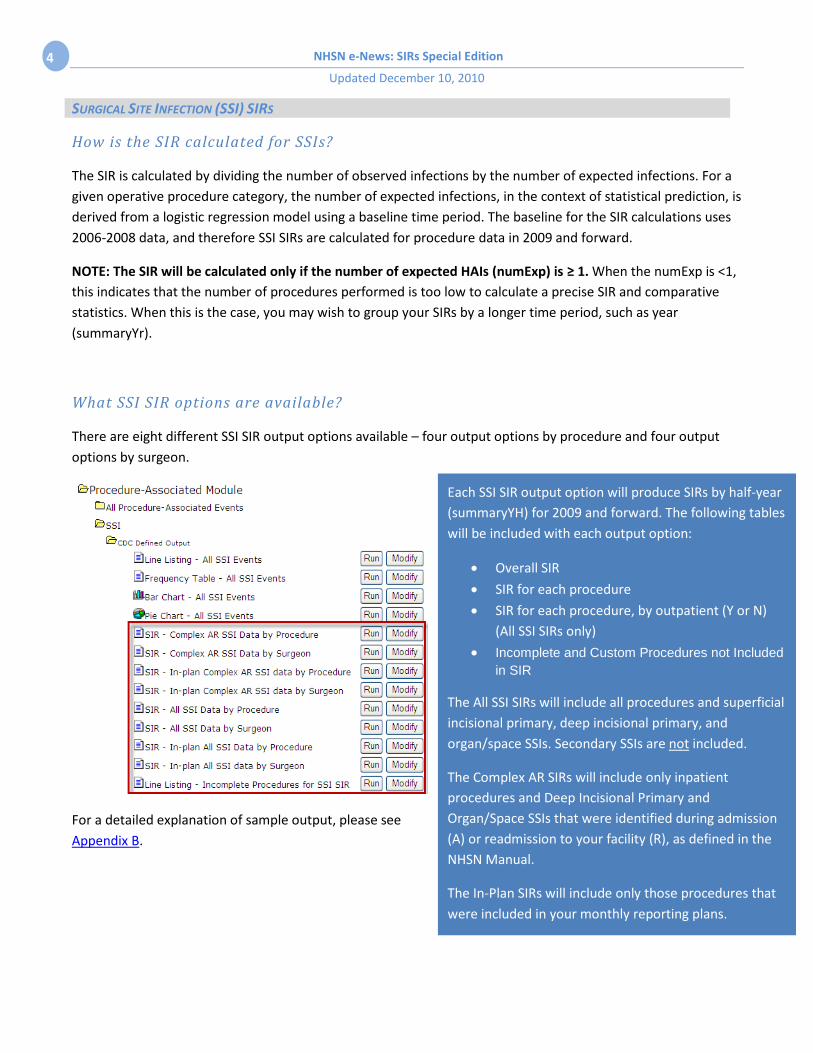
What SSI SIR options are available?
There are eight different SSI SIR output options available – four output options by procedure and four output options by surgeon.
For a detailed explanation of sample output, please see Appendix B.
Each SSI SIR output option will produce SIRs by half-year (summaryYH) for 2009 and forward. The following tables will be included with each output option:
• Overall SIR
• SIR for each procedure
• SIR for each procedure, by outpatient (Y or N) (All SSI SIRs only)
• Incomplete and Custom Procedures not Included in SIR
The All SSI SIRs will include all procedures and superficial incisional primary, deep incisional primary, and organ/space SSIs. Secondary SSIs are not included.
The Complex AR SIRs will include only inpatient procedures and Deep Incisional Primary and Organ/Space SSIs that were identified during admission (A) or readmission to your facility (R), as defined in the NHSN Manual.
The In-Plan SIRs will include only those procedures that were included in your monthly reporting plans.

NHSN e-News: SIRs Special Edition
Updated December 10, 2010
5
How do I interpret the SSI SIR?
Example #1: Overall SSI SIR
• During 2009, there were 524 procedures performed and 13 SSIs identified.
• Based on the NHSN 2006-2008 baseline data, 6.687 SSIs were expected.
• This results in an SIR of 1.94 (13/6.687), signifying that during this time period our facility identified 94% more SSIs than expected.
• The p-value and 95% Confidence Interval indicate that the number of observed SSIs is significantly higher than the number of expected SSIs.
Example #2: SSI SIR by Procedure and Half-Year with Number Expected < 1
• During the first half of 2009 (2009H1), there were 26 HPRO procedures performed and 1 SSI identified.
• Based on the NHSN 2006-2008 baseline data, <1 SSI was expected and therefore, a precise SIR could not be calculated.
When the number expected is less than 1, you should check your data for procedures that were excluded from the SIR, as described in Appendix C.
Will any procedures be excluded from the SIRs?
Yes. The All SSI SIR will exclude any procedure record that meets the exclusion criteria defined in Appendix C, as well as custom procedures. The Complex A/R SSI SIR will exclude all outpatient procedures in addition to those procedures meeting the exclusion criteria, and custom procedures.
You will be able to obtain a detailed list of all non-Custom excluded procedures that meet the exclusion criteria, by using a new output option: “Line Listing – Incomplete Procedures for SSI SIR.” For an explanation of this output option, please see Appendix C.
In addition, SIRs will not be calculated for the current time period. For example, if running the SIRs in November, 2010 by half-years, the 2010H2 data will not be calculated or displayed, as the time period is not yet complete.

NHSN e-News: SIRs Special Edition
Updated December 10, 2010 6
Will any SSIs be excluded from the SIRs?
Yes. All superficial incisional secondary (SIS) and deep incisional secondary (DIS) SSIs will be excluded from all SIR calculations. In addition, any SSI will be excluded if its corresponding procedure is excluded from the SIR.
How is this different from the current SSI SIRs in NHSN?
The previous SSI SIRs were based on the basic risk index and published risk-stratified SSI rates. The new SSI SIRs will use improved risk adjustment calculated through logistic regression modeling. Not only does this allow for all available risk factors to be considered, but it also allows for the risk factors to be procedure-specific. Note that each risk factor’s contribution will vary according to its significant association with risk. Based on this logistic regression modeling, it was determined that for all NHSN procedures, the models predicted SSI risk better than the basic risk index, and as a result, the basic risk index will no longer be used when analyzing SSI data at a national level.
Please see Appendix D for a list of predictive risk factors obtained from the logistic regression models for each of the NHSN operative procedures.
Example: Logistic Regression Model
This table lists the risk factors found to be significant for a particular NHSN operative procedure category. Note that each risk factor’s contribution varies, as represented by the parameter estimate for each factor.
Factor Parameter Estimate OR p-value Intercept -5.448 - - Age (≤44 vs >44) 0.520 1.659 <0.0001 ASA (3/4/5 vs 1/2) 0.425 1.529 0.0415 Duration (>100 vs ≤100) 0.501 1.650 0.0019 Med school affiliation (Y vs N) 1.069 2.912 <0.0001 The model represented in this table is for teaching purposes only and should not be considered an actual model from which to calculate a patient’s risk of SSI.
The parameter estimates above can be plugged into the following formula:
logit (p) = α + β1 X1+ β2 X2 + β3 X3 + β4 X4 = -5.448 + 0.520 (Age ≤ 44* )+ 0.425 (ASA 3/4/5* ) +0.501 (Duration >100* )+ 1.069 (Med school affiliation* )
*For these risk factors, if present = 1; if not = 0
^
NHSN e-News: SIRs Special Edition
Updated December 10, 2010
7
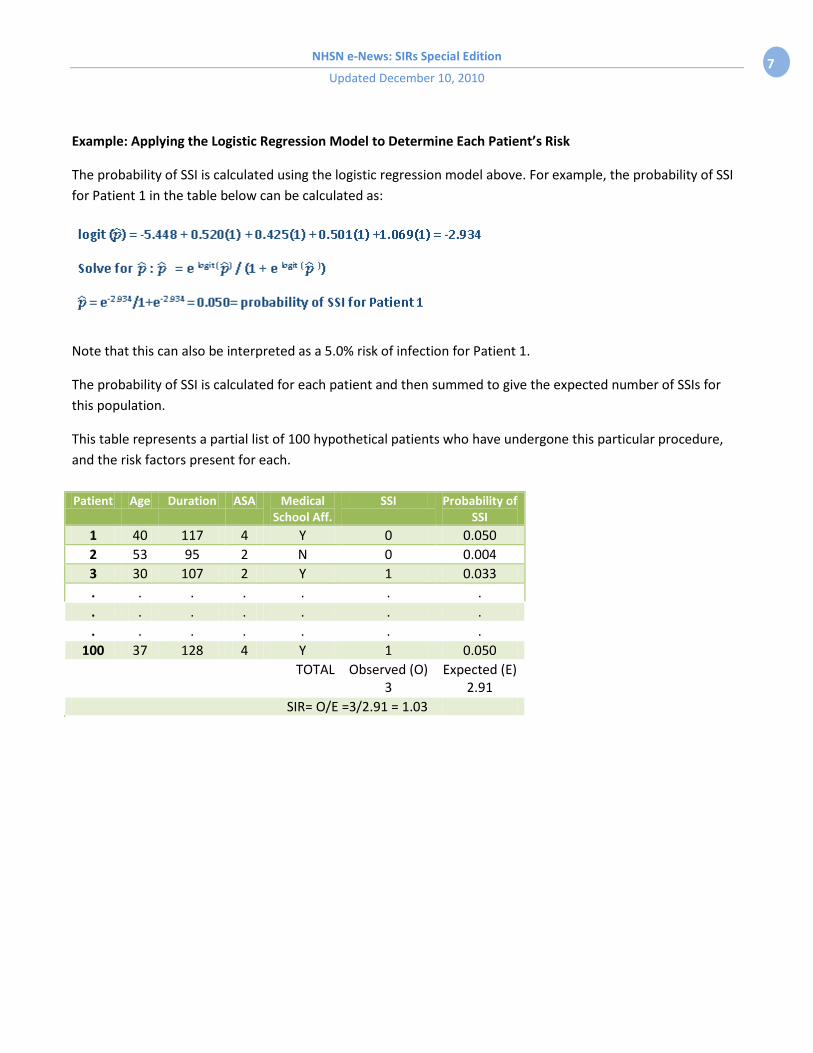
Example: Applying the Logistic Regression Model to Determine Each Patient’s Risk
The probability of SSI is calculated using the logistic regression model above. For example, the probability of SSI for Patient 1 in the table below can be calculated as:
Note that this can also be interpreted as a 5.0% risk of infection for Patient 1.
The probability of SSI is calculated for each patient and then summed to give the expected number of SSIs for this population.
This table represents a partial list of 100 hypothetical patients who have undergone this particular procedure, and the risk factors present for each.
Patient Age Duration ASA Medical School Aff.
SSI Probability of SSI
1 40 117 4 Y 0 0.050 2 53 95 2 N 0 0.004 3 30 107 2 Y 1 0.033 . . . . . . . . . . . . . . . . . . . . .
100 37 128 4 Y 1 0.050 TOTAL Observed (O)
3 Expected (E)
2.91 SIR= O/E =3/2.91 = 1.03
NHSN e-News: SIRs Special Edition
Updated December 10, 2010 8
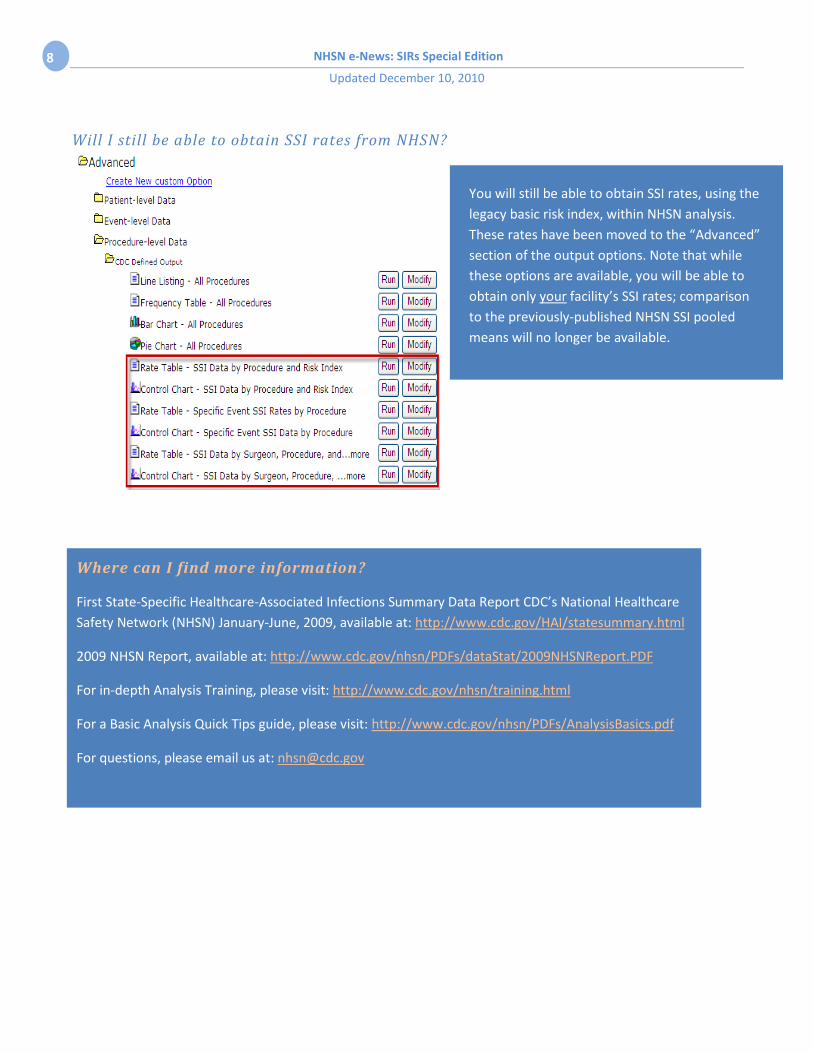
Will I still be able to obtain SSI rates from NHSN?
You will still be able to obtain SSI rates, using the legacy basic risk index, within NHSN analysis. These rates have been moved to the “Advanced” section of the output options. Note that while these options are available, you will be able to obtain only your facility’s SSI rates; comparison to the previously-published NHSN SSI pooled means will no longer be available.
Where can I find more information?
First State-Specific Healthcare-Associated Infections Summary Data Report CDC’s National Healthcare Safety Network (NHSN) January-June, 2009, available at: http://www.cdc.gov/HAI/statesummary.html
2009 NHSN Report, available at: http://www.cdc.gov/nhsn/PDFs/dataStat/2009NHSNReport.PDF
For in-depth Analysis Training, please visit: http://www.cdc.gov/nhsn/training.html
For a Basic Analysis Quick Tips guide, please visit: http://www.cdc.gov/nhsn/PDFs/AnalysisBasics.pdf
For questions, please email us at: [email protected]

NHSN e-News: SIRs Special Edition
Updated December 10, 2010
9
APPENDICES A-E: SIR OUTPUT AND RISK FACTOR SAMPLES
Appendix A: Sample CLABSI SIR Output
The first table represents an overall SIR for those locations for which CLABSIs were monitored in your facility during the specified time period(s). In this example, there is an overall SIR for the first half of 2009 (2009H1).
The second table provides an SIR by location type and the time period(s) specified. The following are location types that may appear in this table: ICU-OTHER (all ICUs and Other non-NICU and non-SCA locations), SCA, and NICU. All locations would be grouped into one of these defined types.
The third table provides an SIR by CDC Location and time period(s) specified. For example, if your facility reported CLABSIs for two Medical ICUs, this table would show one SIR for the two locations represented by that CDC Location designation (IN:ACUTE:CC:M).
The fourth table is the most granular table, as it provides an SIR for each individual location and time period(s) specified. Using the previous example, if your facility reported CLABSIs for two Medical ICUs, each of those locations would have an SIR calculated in this last table.

NHSN e-News: SIRs Special Edition
Updated December 10, 2010 10
Appendix B: Sample SSI SIR Output
The first table represents an overall SIR for those operative procedures for which SSI were monitored in your facility, during the specified time period(s). In this example, there is an overall SIR for the first and second halves of 2009 (2009H1 and 2009H2).
The third table provides an SIR by NHSN operative procedure category and outpatient status, as well as the time period(s) specified. Note that this table will be available only in the “All SSI SIR” output options.
The second table provides an SIR by NHSN operative procedure category and the time period(s) specified. The SIRs that appear in this table will group inpatient and outpatient procedures within each category.
The fourth table provides a count of the number of procedures and SSIs that were excluded from the SIRs above. Note that this will list only those procedures that were excluded from the SIR due to the exclusion criteria. For detailed information on these excluded procedures, you may review the “Line Listing – Incomplete Procedures for SSI SIR” (see Appendix C).

NHSN e-News: SIRs Special Edition
Updated December 10, 2010
11
Appendix C: Sample Line List of Procedures Excluded from SIR Procedures will be excluded from the SIR if they meet any of the following exclusion criteria:
• Missing one or more of the risk factors as defined in Appendix D.
• Procedure duration is <5 minutes or >IQR5, which is defined as five times the interquartile range above the 75th percentile. For example, if the interquartile range is 30 minutes (Q3-Q1) and the 75th percentile is 100 minutes, the IQR5 would be 100 +(5*30) = 250 minutes. Please see Appendix E for a list of IQR5 values for each NHSN Operative Procedure.
• Procedure date is ≤ patient date of birth.
• Patient’s age at procedure is ≥ 109 years.
• Wound Class (swClass) = ‘U’.
• Approach = ‘N’ (for FUSN and RFUSN only.)
• Spinal Level = ‘N’ (for FUSN only.)
TIP: When obtaining a line list of procedures excluded from the SIR, it’s best to modify this output option in order to limit to the procedure, time period, and risk factors in question. The example below was limited to CBGB procedures in May, 2010, and includes only those variables of interest to this procedure category.
After reviewing this line list, the following steps are recommended:
1. Obtain the missing information or correct data. In the example above, the ASA class would need to be obtained. 2. Edit the procedure record in NHSN to include this information. Save the edited record. 3. Re-generate datasets. 4. Run the desired SSI SIR output option.
NHSN e-News: SIRs Special Edition
Updated December 10, 2010 12
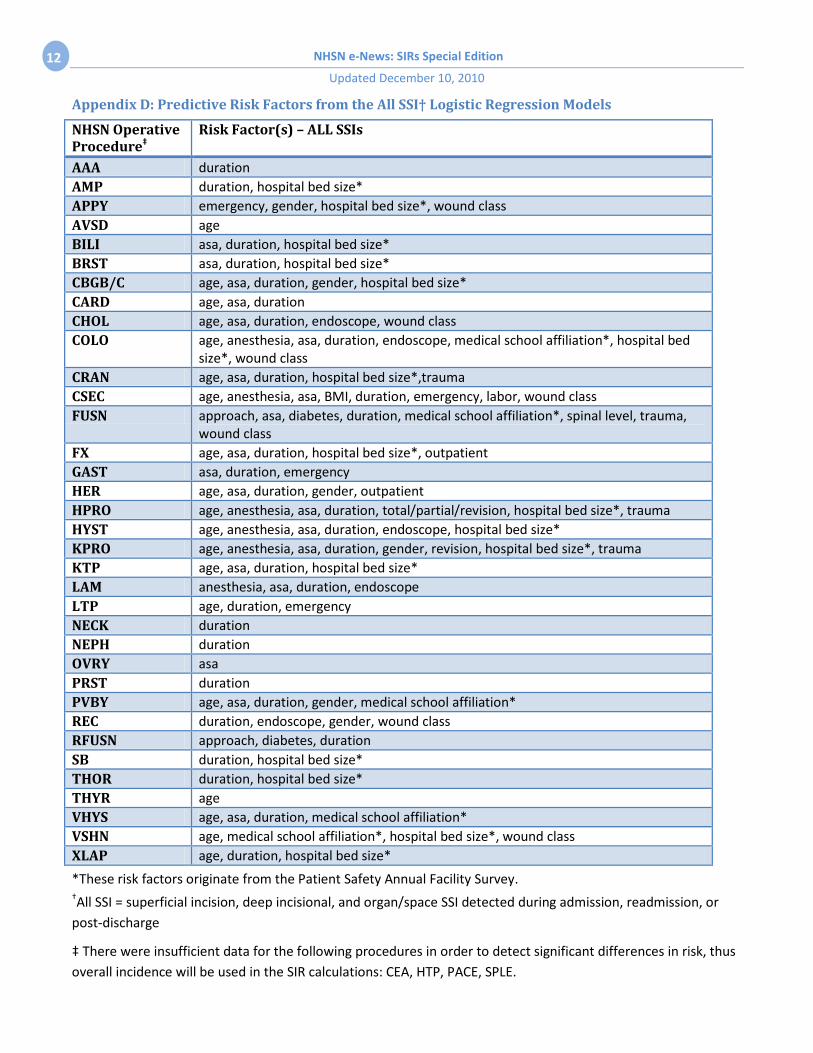
Appendix D: Predictive Risk Factors from the All SSI† Logistic Regression Models
NHSN Operative Procedure‡
Risk Factor(s) – ALL SSIs
AAA duration AMP duration, hospital bed size* APPY emergency, gender, hospital bed size*, wound class AVSD age BILI asa, duration, hospital bed size* BRST asa, duration, hospital bed size* CBGB/C age, asa, duration, gender, hospital bed size* CARD age, asa, duration CHOL age, asa, duration, endoscope, wound class COLO age, anesthesia, asa, duration, endoscope, medical school affiliation*, hospital bed
size*, wound class CRAN age, asa, duration, hospital bed size*,trauma CSEC age, anesthesia, asa, BMI, duration, emergency, labor, wound class FUSN approach, asa, diabetes, duration, medical school affiliation*, spinal level, trauma,
wound class FX age, asa, duration, hospital bed size*, outpatient GAST asa, duration, emergency HER age, asa, duration, gender, outpatient HPRO age, anesthesia, asa, duration, total/partial/revision, hospital bed size*, trauma HYST age, anesthesia, asa, duration, endoscope, hospital bed size* KPRO age, anesthesia, asa, duration, gender, revision, hospital bed size*, trauma KTP age, asa, duration, hospital bed size* LAM anesthesia, asa, duration, endoscope LTP age, duration, emergency NECK duration NEPH duration OVRY asa PRST duration PVBY age, asa, duration, gender, medical school affiliation* REC duration, endoscope, gender, wound class RFUSN approach, diabetes, duration SB duration, hospital bed size* THOR duration, hospital bed size* THYR age VHYS age, asa, duration, medical school affiliation* VSHN age, medical school affiliation*, hospital bed size*, wound class XLAP age, duration, hospital bed size*
*These risk factors originate from the Patient Safety Annual Facility Survey. †All SSI = superficial incision, deep incisional, and organ/space SSI detected during admission, readmission, or post-discharge
‡ There were insufficient data for the following procedures in order to detect significant differences in risk, thus overall incidence will be used in the SIR calculations: CEA, HTP, PACE, SPLE.
NHSN e-News: SIRs Special Edition
Updated December 10, 2010
13
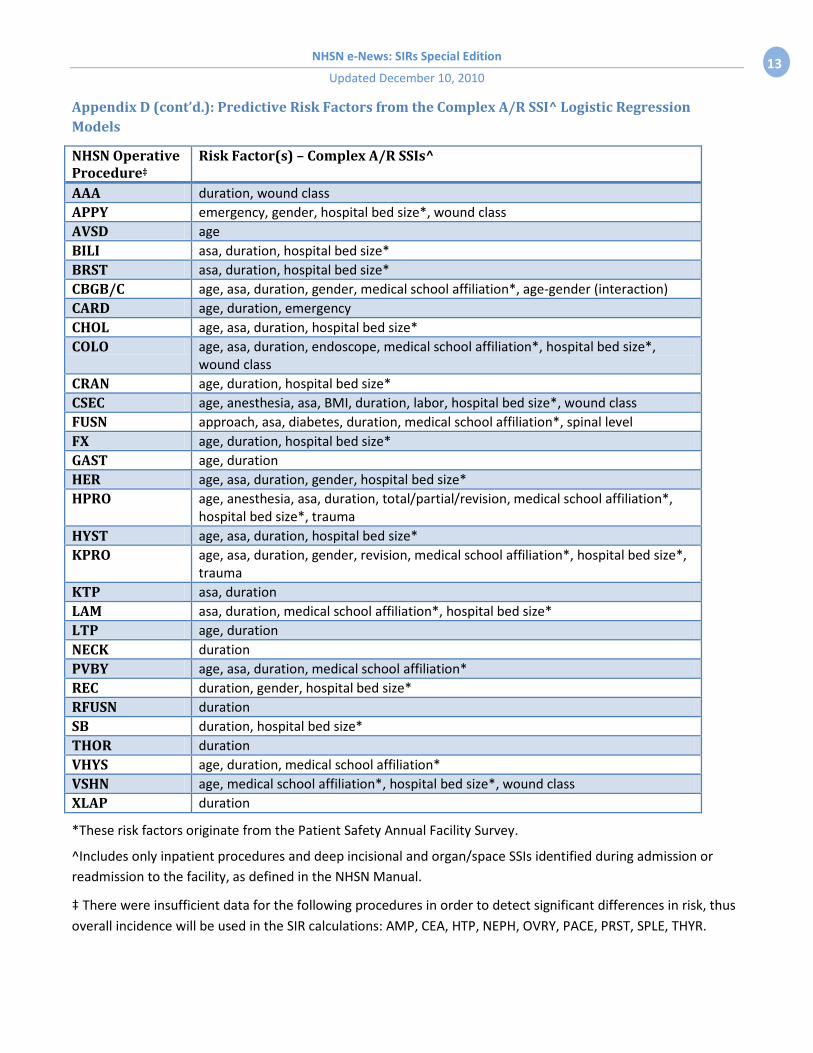
Appendix D (cont’d.): Predictive Risk Factors from the Complex A/R SSI^ Logistic Regression Models
NHSN Operative Procedure‡
Risk Factor(s) – Complex A/R SSIs^
AAA duration, wound class APPY emergency, gender, hospital bed size*, wound class AVSD age BILI asa, duration, hospital bed size* BRST asa, duration, hospital bed size* CBGB/C age, asa, duration, gender, medical school affiliation*, age-gender (interaction) CARD age, duration, emergency CHOL age, asa, duration, hospital bed size* COLO age, asa, duration, endoscope, medical school affiliation*, hospital bed size*,
wound class CRAN age, duration, hospital bed size* CSEC age, anesthesia, asa, BMI, duration, labor, hospital bed size*, wound class FUSN approach, asa, diabetes, duration, medical school affiliation*, spinal level FX age, duration, hospital bed size* GAST age, duration HER age, asa, duration, gender, hospital bed size* HPRO age, anesthesia, asa, duration, total/partial/revision, medical school affiliation*,
hospital bed size*, trauma HYST age, asa, duration, hospital bed size* KPRO age, asa, duration, gender, revision, medical school affiliation*, hospital bed size*,
trauma KTP asa, duration LAM asa, duration, medical school affiliation*, hospital bed size* LTP age, duration NECK duration PVBY age, asa, duration, medical school affiliation* REC duration, gender, hospital bed size* RFUSN duration SB duration, hospital bed size* THOR duration VHYS age, duration, medical school affiliation* VSHN age, medical school affiliation*, hospital bed size*, wound class XLAP duration
*These risk factors originate from the Patient Safety Annual Facility Survey.
^Includes only inpatient procedures and deep incisional and organ/space SSIs identified during admission or readmission to the facility, as defined in the NHSN Manual.
‡ There were insufficient data for the following procedures in order to detect significant differences in risk, thus overall incidence will be used in the SIR calculations: AMP, CEA, HTP, NEPH, OVRY, PACE, PRST, SPLE, THYR.

NHSN e-News: SIRs Special Edition
Updated December 10, 2010 14
Appendix E: IQR5 Values, in minutes, for NHSN Operative Procedures
NHSN Operative Procedure
IQR5*
AAA 827
AMP 334
APPY 300
AVSD 422
BILI 1290
BRST 711
CARD 941
CBGB 846
CBGC 895
CEA 425
CHOL 314
COLO 668
CRAN 929
CSEC 171
FUSN 879
FX 515
GAST 565
HER 342
HPRO 380
HTP 1051.5
NHSN Operative Procedure (cont’d.)
IQR5*
HYST 479KPRO
354KTP
717LAM
615LTP
1254NECK
1578NEPH
923OVRY
722PACE
303PRST
835PVBY
786REC
1189RFUSN
1165SB
760SPLE
920THOR
744THYR
500VHYS
449VSHN
309XLAP
830
*The IQR5 is used as an indicator of an extreme outlier for procedure durations when calculating the SSI SIRs. The IQR5 is calculated as five times the interquartile range (Q1-Q3) above the 75th percentile. For example, if the interquartile range is 30 minutes, and the 75th percentile is 100 minutes, the IQR5 would be calculated as: 100 + (30*5) = 250 minutes. Procedures with a duration greater than the IQR5 were excluded from the baseline data and will be excluded from all SSI SIR calculations for your facility.